Roots, and counting them with a sketch
“
locate approximately a root of an equation, by means of graphical considerations
A root of an equation is a value of that makes the equation true. is a root of , because .
Some equations cannot be solved by algebra. In the sits both inside a logarithm and outside it, and no rearrangement gets it on its own. The equation still has a root; we just cannot write it down exactly. A numerical method finds such a root as a decimal, as accurately as we like, by calculation.
Every question on this topic follows the same three steps, and this note takes them in order:
- Count the roots and see roughly where they are, using a sketch (this section).
- Trap one root between two numbers, using a sign change (next section).
- Close in on it with an iterative formula (the sections after that).
Roots are crossing points
Read an equation "left side right side" as two graphs:
At a root the two sides are equal, so the two graphs have the same height at the same : they meet. So
- each crossing point of the two graphs gives one root, and
- the root is the -coordinate of the crossing.
Counting crossings counts roots. For , sketch and :
y = ln x and y = 4 − x meet once, so ln x = 4 − x has exactly one root: the x-value of the crossing, a little under 3.
Choosing the pair of graphs
Split the equation so that each side is a graph you can sketch. Usually the split is the one printed: becomes and . Never subtract one side from the other and try to sketch the difference; that curve is usually impossible to draw.
These are the graphs that come up, and the features a sketch must show:
Graph | Features to show |
|---|---|
, , | the -intercept (, then shifted); rising for , falling for ; the horizontal asymptote |
, , | only exists where the inside is positive; a vertical asymptote where the inside is ; crosses the -axis where the inside is ; always rising |
, | vertical asymptotes where (for ) or (for ); U-shaped branches that never go between and |
vertical asymptotes where ; crosses the -axis where ; falling on each branch | |
a V shape with its vertex on the -axis at | |
starts at the origin, rises, flattens |
Stretches change the numbers: sec 2x has its first asymptote at x = ¼π, not ½π, because 2x = ½π there.
Arguing that there is exactly one root
A sketch has to convince the examiner of two things: that the graphs do cross, and that they cross only once in the interval.
- They do cross if one graph is above the other at one end of the interval and below it at the other end. The graphs have swapped order, so they met in between.
- Only once is clearest when one graph only ever rises and the other only ever falls. Once the rising one is above, it stays above. Otherwise show enough of both graphs to make it plain that they do not meet again.
Only the interval in the question matters. Ignore what the graphs do outside it. If no interval is given ("show that the equation has exactly one real root"), the whole -axis counts, so your sketch must also show what happens for negative .
What earns the two marks
Mark schemes give one mark for each graph and are specific about what each needs:
- the right shape, with the key points in the right place: intercepts, maximum or minimum values, and asymptotes where they exist in the interval;
- enough of both graphs to rule out a second crossing in the interval;
- the crossing marked with a dot or a cross, or a sentence such as "one point of intersection, so one root".
The second mark is lost if the crossing is not marked or stated, however good the sketch.
Counting the roots of ln x = 4 − x
By sketching a suitable pair of graphs, show that the equation has exactly one root.
Show full working
- 1
Split the equation into two graphs, one for each side:
Both are graphs you already know. Each crossing will be a root.
- 2
Sketch . It exists only for , has the -axis as a vertical asymptote, crosses the -axis at because , and rises more and more slowly.
- 3
Sketch . It is a straight line with gradient , meeting the -axis at and the -axis at .
- 4
Show that they cross. At : , which is below the line's value . At : , which is above the line's value .
The graphs have swapped order between x = 1 and x = 4, so they must meet in between.
- 5
Show that they cross only once. only ever rises and only ever falls, so once is above the line it stays above. For , is negative while the line is above , so there is no crossing there either.
- 6
Mark the single crossing with a dot and state the conclusion: the graphs meet at exactly one point, so the equation has exactly one root.
This sentence (or the dot) is what earns the second mark.
One point of intersection, so exactly one root (it lies between and ).
“One rises, one falls” is the quickest way to justify “only one”. When both rise, or a graph has asymptotes, the sketch itself has to show there is no second crossing.
A trigonometric pair with asymptotes
By sketching a suitable pair of graphs, show that the equation has exactly one root in the interval .
Show full working
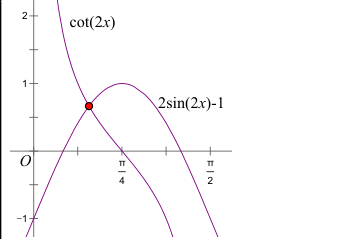
The mark scheme's sketch of the two graphs, with the one crossing marked.
- 1
Split into and .
- 2
Sketch on . The bottom, , is when and when , so there are vertical asymptotes at both ends. The top, , is when , so the graph crosses the -axis at . It falls from to across the interval.
Finding the asymptotes and the intercept from the fraction is safer than trying to remember a stretched cot graph.
- 3
Sketch . As goes from to , goes , so goes : it starts at , reaches a maximum of at , and comes back down to .
- 4
Compare them on . Near , is very large while the sine graph is near , so is above. At , while the sine graph is at , so is below. They swap order, and on this part only falls while the sine graph only rises, so they cross exactly once here.
- 5
Compare them on . Here is negative and plunges towards , staying below the sine graph, which only falls from to . They do not meet again.
The mark scheme asks for enough of both graphs to confirm there is no second intersection in the interval.
- 6
Mark the one crossing and state: one point of intersection in , so exactly one root.
The graphs cross once (between and ), so there is exactly one root.
When there is more than one root
Some questions ask you to show there are exactly two roots. The idea is the same: find where the graphs swap order. If one graph is above, then below, then above again, they must cross twice. Then show they cannot cross a third time.
When an equation has two roots, later parts will say which one they want ("the larger root", "the negative root"), and the iterative formula given will lead to that one only.
Showing there are exactly two roots
By sketching a suitable pair of graphs, show that the equation has exactly two roots in the interval .
Show full working
The U-shaped cosec graph dips below the falling exponential graph and comes back up, so they cross twice.
- 1
Split into and .
- 2
Sketch on . is at both ends, so there are vertical asymptotes at and . is largest () at , so is smallest there: a U shape with minimum point .
The scheme wants the U shape, roughly symmetrical about ½π, with its lowest value 1 at x = ½π.
- 3
Sketch . At it is . It falls as increases, but stays above : at it is .
The scheme checks that it starts at 2, always falls, and is still above 1 at x = π. That last point matters: it is why the graphs meet again near π.
- 4
Compare them. Near , is huge, so it is above. At , while the exponential graph is at , so is below. Near , is huge again, so it is above.
- 5
The order swaps twice, so there are two crossings: one in and one in . To the right of the cosec graph rises while the exponential graph falls, so they meet only once there. To the left, the cosec graph plunges down from far more steeply than the gently falling exponential graph, and the sketch shows a single crossing. Mark both crossings.
Two points of intersection, so exactly two roots in .
Your turn
Sketch both graphs, then say in words why they cross the number of times you claim.
- 1
Show, by sketching and , that the equation has exactly one root in the interval .
Stuck? Show hint
Both graphs pass through the origin, but x = 0 is not in the interval. Compare them just after 0 and at π.
Show solution
- 1
Sketch for : it rises from to a maximum of at , then falls back to at .
- 2
Sketch : a straight line through the origin with gradient , reaching at .
- 3
On the sine graph stays above the line. Just after it is steeper (at , , more than ), and at it is at while the line is only at .
Near 0, 2 sin x behaves like 2x, which is steeper than x. The origin is a meeting point, but x = 0 is not in the interval.
- 4
On the sine graph falls from to while the line rises from to . The sine graph starts above and ends below, and one falls while the other rises, so they cross exactly once here.
- 5
Mark that crossing and state: one point of intersection in , so exactly one root.
AnswerOne crossing in (the origin is excluded), so exactly one root.
- 1
- 29709/35 M/J 2025 Q8(a)2 marks
By sketching a suitable pair of graphs, show that the equation has exactly one root in the interval .
Stuck? Show hint
Sketch and on the same axes. Where does ?
Show solution
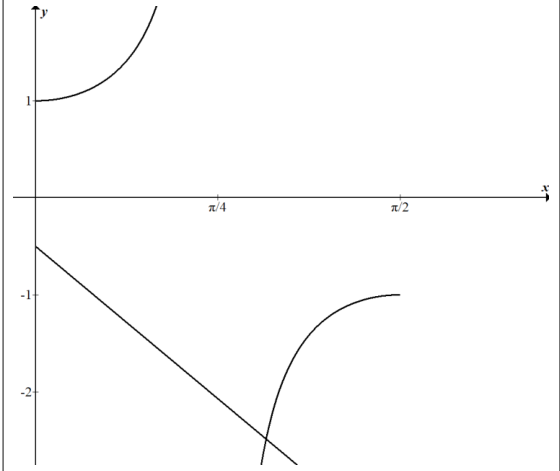
The mark scheme's sketch of the two graphs on 0 ⩽ x ⩽ ½π.
- 1
Sketch . At it equals . There is a vertical asymptote where , that is , so . Before it the graph rises from towards ; after it the graph comes up from to at .
The asymptote and the two branches are what the first mark checks.
- 2
Sketch : a straight line starting at when and falling to at .
- 3
On they cannot meet: is at least , while the line is negative.
- 4
On , rises from to while the line falls from about to . The sec graph starts below the line and ends above it, and one rises while the other falls, so they cross exactly once.
- 5
Mark that crossing with a dot and state that there is one point of intersection.
AnswerOne crossing, on the branch , so exactly one root.
- 1
- 39709/33 O/N 2025 Q8(b)2 marks
The curve with equation has a stationary point at , and satisfies the equation .
By sketching a suitable pair of graphs, show that this equation has only one root.
Stuck? Show hint
Sketch and . Where does cross the -axis?
Show solution
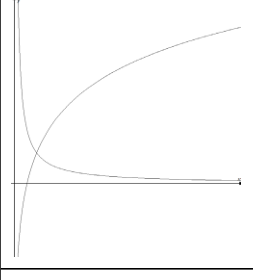
The mark scheme's sketch: y = ln 5x rises from the y-axis and crosses the x-axis at 0.2; y = 1/(5x) falls towards the x-axis.
- 1
Sketch . It exists only for , has the -axis as an asymptote, and crosses the -axis where , at . It always rises.
- 2
Sketch for . It is always positive, falls as increases, and has both axes as asymptotes.
For there is nothing to compare, because does not exist there.
- 3
At , while , so the log graph is below. For large , keeps growing while shrinks towards , so the log graph is above. They cross.
- 4
One graph only rises and the other only falls, so they cross only once. Mark the crossing.
AnswerOne point of intersection, so only one root.
- 1
The rest of this note
Can you do all of these?
Split an equation into two graphs I can sketch, and show their key points and asymptotes
Argue that the graphs cross, and cross only once (or exactly twice), then mark the crossings
With no interval given, show what happens for negative x too
Write f(x) = 0, evaluate at both ends in radians, and state the sign change
Compare the two sides instead, with each pair of values clearly matched
Find two consecutive integers that trap a root
Know that an asymptote or two close roots can fool the sign-change test
Explain the notation x₀, x₁, x₂, … and what converging to a limit means
Explain why the limit of xₙ₊₁ = F(xₙ) satisfies x = F(x)
Rearrange an equation into x = F(x) and turn it into an iterative formula
Iterate from the given x₀ (or one inside the interval), writing every value, using ANS
Stop when consecutive iterates agree at the required accuracy, and check with a sign change if unsure
Give the final answer as the root, to exactly the accuracy asked
State the minimum number of iterations, not counting x₀
Recognise an iteration that fails to converge, and use the other formula when given two
Know which root a formula leads to when an equation has more than one
Show that a formula converges to the root: limit equation, undo the outside function, every step to the printed equation
Solve the limit equation exactly when a question asks for the exact value of the limit
Keep going with the numerical parts even if the first “show that” part defeats me