Mathematics 9709/53 — October/November 2025
Cambridge AS Level · Probability & Statistics 1 · worked solutions for every part, with the mark scheme
Topics Probability · Discrete Random Variables · Permutations and Combinations · Representation of Data · The Normal Distribution
There are a large number of students at Greenfield college. Each student travels to college by car, by bus or on foot, independently of any other student. The probability that any student travels by car is 0.4. The probability that any student travels by bus is 0.35.
3 students from Greenfield college are selected at random.
Find the probability that none of these 3 students travel to college by car.
Approach
Since each student travels by car independently with probability , the probability that one student does not travel by car is . For three independent students, multiply the individual probabilities.
Working
Let be the event that a student travels by car.
For three independent students:
Answer
0.216 (or 27/125)
Walkthrough
We are told the probability that a randomly chosen student travels by car is . The event that none of the 3 selected students travel by car means each selected student is not a car traveller. For one student, . Because travel choices are independent, the probability that all three are not car travellers is the product of three separate probabilities: .
Key Takeaways
- The complement rule: .
- For independent events, probabilities multiply: .
Common Mistakes
- Using instead of . The question asks for none by car, so use the complement probability.
- Forgetting that 'none' means every one of the three students must fail to travel by car.
Things to Be Careful About
- 'Not by car' includes travelling by bus or on foot, so its probability is , not .
- The independence condition is essential; without it we could not multiply the three probabilities.
11 students from Greenfield college are selected at random.
Find the probability that fewer than 9 of these 11 students travel to college by car or by bus.
Approach
Let be the number of students, out of 11, who travel to college by car or by bus. Since car and bus are mutually exclusive, . Thus .
'Fewer than 9' means . It is easier to subtract the upper-tail probabilities , and from 1.
Working
So .
Using :
Therefore
Answer
0.545
Walkthrough
First combine the probabilities for car and bus. Since a student cannot travel by both car and bus, these events are mutually exclusive, so . For 11 independent students, the number who travel by car or bus follows a binomial distribution .
'Fewer than 9' means . Instead of adding nine probabilities, use the complement: , and means or .
For a binomial distribution, . Substitute and add:
So
Key Takeaways
- A fixed number of independent trials with two outcomes leads to the binomial distribution.
- Use the complement when a tail probability has fewer terms than its complement.
- The binomial coefficient counts the number of ways of choosing the successes.
Common Mistakes
- Using or instead of . The event is travelling by car or bus.
- Treating 'fewer than 9' as ; it actually means .
- Forgetting the term when using the complement.
- Giving only a calculator answer without showing the binomial expression, since the mark scheme requires method.
Things to Be Careful About
- Car and bus are mutually exclusive, so their probabilities add to give .
- The probability of failure is , representing travelling on foot.
- Round only at the end; the final answer should be in the range .
- The complement of is , not or only.
The Splash Club has 26 members, of whom 16 are swimmers and 10 are divers. No member is both a swimmer and a diver. The club committee consists of 6 of these 26 members.
In how many ways can the club committee be selected if it must include at least 2 swimmers and at least 2 divers?
Approach
There are three possible splits of the 6 committee members between swimmers and divers that satisfy at least 2 of each: 4 swimmers and 2 divers, 3 swimmers and 3 divers, or 2 swimmers and 4 divers. Count each split by choosing the swimmers from 16 and the divers from 10, then add the totals.
Working
For 4 swimmers and 2 divers:
For 3 swimmers and 3 divers:
For 2 swimmers and 4 divers:
Total:
Answer
174,300
Walkthrough
We need to choose 6 members from 26, but with restrictions: at least 2 swimmers and at least 2 divers. Since there are only two categories, the possible numbers of swimmers on the committee are 2, 3, or 4 (and divers are 4, 3, or 2 respectively). For each case, choose the required number of swimmers from the 16 swimmers and the required number of divers from the 10 divers. Use combinations because order within the committee does not matter. Multiply the two choices for each case, then add the three case totals because the cases are mutually exclusive.
Key Takeaways
This question tests the use of combinations for selections from two distinct groups, and the addition principle for mutually exclusive cases. A key skill is translating a restriction such as 'at least 2 swimmers and at least 2 divers' into the finite list of possible group sizes.
Common Mistakes
- Using permutations instead of combinations; order does not matter in a committee.
- Counting only one or two of the three valid scenarios.
- Including a scenario with fewer than 2 swimmers or fewer than 2 divers, such as 5 swimmers and 1 diver.
- Adding repeated scenarios or incorrect scenarios in the final sum.
Things to Be Careful About
The committee size is fixed at 6, so if the number of swimmers is , the number of divers must be . The condition 'at least 2 swimmers and at least 2 divers' means can only be 2, 3, or 4. The mark scheme allows un-simplified expressions to identify scenarios, but the final sum must contain exactly the three correct identified scenarios. If the method marks are not earned, an unsupported correct total of 174,300 may still receive SCB1.
Find the number of different arrangements of the 9 letters in the word DAFFODILS in which there is a D at each end and the two Fs are not next to each other.
Approach
Fix the two Ds at the ends. Count the arrangements of the remaining 7 letters, then subtract the cases where the two Fs are together.
Working
With a D at each end, the middle 7 positions contain . Since the two Fs are identical, the number of arrangements is
Now count the arrangements with the two Fs together. Treat as one block. Then the 6 items can be arranged in
ways.
Therefore the required number is
Answer
1800
Walkthrough
The word DAFFODILS has 9 letters, with two Ds and two Fs. Part (a) fixes the two Ds at the ends. Once the Ds are fixed, only the middle 7 positions remain. The letters available for those positions are . Since the two Fs are identical, the number of arrangements is .
The condition "the two Fs are not next to each other" is easier to handle by counting the unwanted cases and subtracting. If the two Fs are together, treat as one block. Then the items to arrange are , which is 6 distinct items, so there are arrangements. Subtracting gives .
A useful alternative view is to arrange the five distinct letters in ways, then place the two Fs into two of the 6 gaps around or between them, choosing ways. This gives , the same result.
Key Takeaways
- Repeated letters reduce the number of arrangements by dividing by the factorial of each repeated letter.
- Fixing certain letters in specified positions simplifies the counting problem.
- "Not next to each other" can often be counted by subtracting the adjacent cases from the total.
- The gap method is a powerful alternative for placing identical items so that they are separated.
Common Mistakes
- Forgetting to divide by for the repeated Fs.
- Including arrangements where the Ds are not at the ends.
- Treating the two Fs as distinct letters.
- In the complement method, forgetting that the total count must also have Ds fixed at the ends.
- Giving an unsupported final answer; the mark scheme requires the method to be shown.
Things to Be Careful About
- The two Fs are identical, so divide by when arranging them among the middle letters.
- The two Ds are fixed at the ends, so they are not arranged.
- When subtracting, both counts must be for arrangements with Ds at the ends.
- If using the gap method, choose two different gaps, so use , not .
Find the probability that a randomly chosen arrangement of the 9 letters in the word DAFFODILS has exactly 4 letters between the two Ds.
Approach
Count all arrangements of the 9 letters, then count only those where the two Ds have exactly 4 letters between them. Divide the favourable count by the total.
Working
Total arrangements of DAFFODILS:
because there are two Ds and two Fs.
For exactly 4 letters between the Ds, the two Ds must be 5 positions apart. In 9 positions, the possible starting positions of the first D are 1, 2, 3, 4, giving
possible pairs of D positions.
For each such pair, the remaining 7 positions are filled with , giving
arrangements.
So the number of favourable arrangements is
Hence the probability is
Answer
1/9
Walkthrough
The total number of arrangements of DAFFODILS is , because the two Ds are identical and the two Fs are identical.
Now count the favourable arrangements. If there are exactly 4 letters between the two Ds, then the positions of the Ds differ by 5. In a 9-letter word, the possible pairs of positions are , , and , so there are 4 choices for where the Ds go.
For each choice of D positions, the remaining 7 positions are filled with . Since the two Fs are identical, this can be done in ways.
Therefore the number of favourable arrangements is . The probability is
This matches the mark scheme's accepted answer or .
Key Takeaways
- Probabilities can be found by enumerating favourable outcomes and dividing by the total number of outcomes.
- When letters are repeated, divide by the factorial of each repeated letter.
- A condition such as "exactly 4 letters between" translates into a fixed position difference, here 5.
- It is important to be consistent about whether identical letters are treated as distinct or identical.
Common Mistakes
- Forgetting to divide the total by for the repeated Ds and Fs.
- Using the wrong number of D-position pairs: exactly 4 letters between means the positions differ by 5, giving 4 pairs, not 5.
- Treating the Ds as distinct in one part of the calculation and identical in another.
- Not simplifying the probability fraction to .
Things to Be Careful About
- If you treat the Ds as distinct, the total is and the favourable count is ; if you treat them as identical, the total is and the favourable count is . Both give .
- The two Fs are identical, so divide by when arranging the remaining letters.
- "Exactly 4 letters between" means the Ds are 5 positions apart, not 4 positions apart.
- The final probability should be simplified to or given as .
A fair red spinner has 4 sides, numbered 1, 2, 3, 4. A fair blue spinner has 4 sides, numbered 0, 1, 2, 3. When a spinner is spun, the score is the number on the side on which it lands. The two spinners are spun at the same time.
The random variable denotes the higher of the two scores obtained. If the two scores are equal, then the value of is 0.
Approach
There are equally likely outcomes. For each possible value of , count the ordered pairs that give that value. Remember that equal scores give .
Working
Counting the 16 outcomes:
- : equal scores — 3 outcomes
- : — 1 outcome
- : — 3 outcomes
- : — 5 outcomes
- : — 4 outcomes
So the probability distribution table is:
| 0 | 1 | 2 | 3 | 4 | |
|---|---|---|---|---|---|
Answer
P(X=0)=3/16, P(X=1)=1/16, P(X=2)=3/16, P(X=3)=5/16, P(X=4)=4/16
Walkthrough
There are outcomes for the red spinner and for the blue spinner, so equally likely ordered pairs. We define as the higher score, except when the scores are equal, in which case . This special rule matters: the equal pairs , , all give , not . For every other pair, is the larger of the two numbers. Count how many pairs give each value of : for example, occurs only when the red spinner shows , because the blue spinner can never show ; this gives outcomes. Dividing each count by gives the probability distribution.
Key Takeaways
A probability distribution table lists every possible value of a discrete random variable with its probability. When outcomes are equally likely, probabilities can be found by counting favourable outcomes. Special definitions in the question (such as equal scores giving ) must be applied before counting.
Common Mistakes
- Forgetting that equal scores give , so , , are not counted as .
- Counting ordered pairs incorrectly, e.g. treating and as the same outcome when they are different spins.
- Not checking that the probabilities sum to .
Things to Be Careful About
The two spinners have different sets of numbers: red has to and blue has to . This asymmetry means has only one outcome, while has four. Always distinguish the red and blue scores when counting.
Approach
Use the definitions and . First find , then .
Working
Answer
127/64 (approx. 1.98)
Walkthrough
Use the distribution from part (a). The expectation is the weighted average of the values of , using the probabilities as weights: . We compute this first. Then for variance we need , the weighted average of the squares of the values. Finally, . The fractions must be converted to a common denominator when subtracting.
Key Takeaways
Variance measures spread around the mean. For a discrete random variable, is often the quickest formula. It is important to square each value before multiplying by its probability when finding .
Common Mistakes
- Forgetting to square the values in (using instead of ).
- Subtracting from but using the wrong sign or forgetting the square.
- Using the probabilities from a wrong table; the mark scheme allows follow-through from their table, but the final answer must be consistent.
Things to Be Careful About
Keep fractions exact until the final step. The answer can be written as , , or . If using a calculator, round only at the end.
The red spinner, with sides numbered 1, 2, 3, 4, is spun repeatedly.
Find the probability that it lands on 4 for the first time before the 8th spin.
Approach
The first landing on 4 occurs before the 8th spin if it happens on one of the first 7 spins. It is easier to use the complement: no 4 in the first 7 spins.
Working
So the required probability is to 3 significant figures.
Answer
0.867
Walkthrough
Each spin is independent and the probability of landing on is , so the probability of not landing on is . 'Before the 8th spin' means the first appears on spin . The complement is that no appears in the first spins, which has probability . Therefore the required probability is . This is the standard geometric distribution idea: the first success occurs within the first trials.
Key Takeaways
For repeated independent trials with the same probability of success, . This is often easier than adding the individual geometric probabilities. The geometric distribution models the number of trials until the first success.
Common Mistakes
- Misreading 'before the 8th spin' as including the 8th spin. It means the first spins only.
- Using instead of for the complement.
- Adding only a few terms of the geometric series instead of using the complement.
Things to Be Careful About
The phrase 'before the 8th spin' is a boundary condition. Here it gives . If the question said 'by the 8th spin', would be . The final answer should be given to 3 significant figures: .
Chen has three boxes. Box contains 5 counters, of which 3 are white and 2 are yellow. Box contains 4 red marbles and 3 blue marbles. Box contains 5 red marbles and 3 blue marbles.
Chen chooses one counter at random from box . If the counter is white, he chooses two marbles from box , at random and without replacement. If the counter is yellow, he chooses two marbles from box , at random and without replacement.
Draw a fully labelled tree diagram to illustrate this information, including all the probabilities.
Approach
Construct a three-tier probability tree diagram. The first tier represents the counter chosen from Box A. The second tier represents the first marble chosen (from Box W if the counter is white, Box Y if yellow). The third tier represents the second marble chosen. Probabilities must be calculated for each branch, accounting for the fact that marbles are drawn without replacement.
Working
Tier 1: Counter from Box A
Box A has 3 white (W) and 2 yellow (Y) counters (5 total).
Tier 2: First marble
- If W chosen (Box W: 4R, 3B; 7 total):
- If Y chosen (Box Y: 5R, 3B; 8 total):
Tier 3: Second marble (without replacement)
- From W-R (3R, 3B left; 6 total):
- From W-B (4R, 2B left; 6 total):
- From Y-R (4R, 3B left; 7 total):
- From Y-B (5R, 2B left; 7 total):
Answer
The fully labelled tree diagram is shown above. All branch probabilities and outcomes (W, Y, R, B) are correctly identified and labelled at each tier.
Tree diagram as shown above with branches: W(3/5), Y(2/5); from W: R(4/7), B(3/7); from Y: R(5/8), B(3/8); third tier probabilities adjusted for without replacement.
Walkthrough
We build a probability tree diagram to model the sequential random choices.
Step 1: First choice (Counter from Box A)
Box A contains 3 white and 2 yellow counters. The probability of choosing white is and yellow is . These form the first tier of branches.
Step 2: Second choice (First marble)
The box used depends on the counter:
- If white, we use Box W (4 red, 3 blue = 7 marbles). Probability of red is , blue is .
- If yellow, we use Box Y (5 red, 3 blue = 8 marbles). Probability of red is , blue is .
Step 3: Third choice (Second marble, without replacement)
Since marbles are not replaced, the total count and composition change:
- Path W-R: Box W now has 3 red, 3 blue (6 total). Probabilities are for red, for blue.
- Path W-B: Box W now has 4 red, 2 blue (6 total). Probabilities are for red, for blue.
- Path Y-R: Box Y now has 4 red, 3 blue (7 total). Probabilities are for red, for blue.
- Path Y-B: Box Y now has 5 red, 2 blue (7 total). Probabilities are for red, for blue.
Key Takeaways
- Tree diagrams are ideal for sequential events where later probabilities depend on earlier outcomes.
- Sampling without replacement changes the denominator and numerator for subsequent branches.
- Always label branches with both the outcome and the conditional probability.
Common Mistakes
- Forgetting to update the number of marbles for the third tier (using 7 or 8 instead of 6 or 7).
- Not labelling the outcomes (W, Y, R, B) clearly at the end of branches.
- Incorrectly calculating conditional probabilities (e.g., using the original box composition for the second draw).
Things to Be Careful About
- Ensure the tree has exactly three tiers as described in the question.
- Verify that probabilities on branches from the same node sum to 1 (e.g., ).
- The mark scheme awards marks for the structure, first/second tier probabilities, and third tier probabilities separately.
Approach
We want the probability of obtaining one red marble and one blue marble. Looking at the tree diagram, there are four paths that lead to this outcome: White-Red-Blue (WRB), White-Blue-Red (WBR), Yellow-Red-Blue (YRB), and Yellow-Blue-Red (YBR). We calculate the probability of each path using the multiplication rule and then sum them.
Working
Path 1: WRB
Path 2: WBR
Path 3: YRB
Path 4: YBR
Total Probability
Finding a common denominator (70):
Answer
39/70
Walkthrough
We need the probability of getting exactly one red and one blue marble. Since the order of drawing matters for the tree diagram paths, we must consider all sequences that yield one of each.
Step 1: Identify valid paths
From Box W (chosen if counter is white), we can get Red then Blue (WRB) or Blue then Red (WBR).
From Box Y (chosen if counter is yellow), we can get Red then Blue (YRB) or Blue then Red (YBR).
Step 2: Calculate path probabilities
Using the multiplication rule (multiply probabilities along the branches):
Step 3: Sum the probabilities
Since these paths are mutually exclusive, we add them:
Key Takeaways
- When asking for a combination of outcomes (e.g., one red and one blue), you must consider all possible orders (sequences) that produce that combination.
- The multiplication rule is applied along each branch of the tree.
- Simplifying fractions early can make addition easier, but finding a common denominator at the end is also valid.
Common Mistakes
- Missing one of the four paths (e.g., only calculating paths from Box W and ignoring Box Y).
- Arithmetic errors when adding fractions with different denominators (35 and 28).
- Not simplifying fractions correctly before adding.
Things to Be Careful About
- Ensure you include both orders (Red-Blue and Blue-Red) for each box scenario.
- The final answer should be exact (fraction form ) unless a decimal is requested.
Find the probability that a white counter is chosen from box , given that one red marble and one blue marble are obtained.
Approach
We are asked for the probability that a white counter was chosen, given that one red and one blue marble were obtained. This is a conditional probability problem. We use the formula:
Working
Numerator: P(White and 1 red and 1 blue)
This is the sum of the probabilities of the paths that start with White and result in one red and one blue marble (WRB and WBR):
Denominator: P(1 red and 1 blue)
From part (b), we have:
Calculate conditional probability:
Answer
8/13
Walkthrough
This part asks for a conditional probability: . The formula for conditional probability is .
Step 1: Identify A and B
- Event A: A white counter is chosen from Box A.
- Event B: One red marble and one blue marble are obtained.
Step 2: Calculate P(A ∩ B)
This is the probability that a white counter is chosen AND one red and one blue marble are obtained. Looking at our work in part (b), these are the paths WRB and WBR:
Step 3: Use P(B) from part (b)
Step 4: Apply the formula
Key Takeaways
- Conditional probability restricts the sample space to the given condition (Event B).
- The numerator is the probability of the intersection of the two events.
- Results from previous parts can be directly used in conditional probability calculations.
Common Mistakes
- Using the wrong denominator (e.g., using or some other value instead of the result from part (b)).
- Forgetting that the numerator must only include paths where the counter was white (excluding YRB and YBR).
- Arithmetic errors when dividing fractions.
Things to Be Careful About
- The question asks for the probability given that one red and one blue are obtained, so the denominator MUST be the total probability from part (b), not just the white paths.
- Ensure fractions are simplified correctly at the end ().
Last Saturday, a cycling competition for teams of 11 cyclists took place. For each cyclist, the time taken to complete the course was recorded to the nearest minute. The times taken by the cyclists from two teams, the Linnets and the Puffins, are shown in the following table.
| Linnets | 48 | 51 | 54 | 57 | 59 | 60 | 64 | 64 | 65 | 68 | 70 |
|---|---|---|---|---|---|---|---|---|---|---|---|
| Puffins | 45 | 49 | 51 | 55 | 55 | 58 | 59 | 62 | 64 | 64 | 74 |
Draw a back-to-back stem-and-leaf diagram to represent this information, with Linnets on the left-hand side.
Approach
Organise the times by their tens digit (stem) and units digit (leaf). Place the Linnets leaves in descending order to the left of the stem, and the Puffins leaves in ascending order to the right. Include a clear key.
Working
The stems are 4, 5, 6, 7. The leaves for the Linnets (left side, ordered right-to-left) are:
- Stem 4: 8
- Stem 5: 9, 7, 4, 1
- Stem 6: 8, 5, 4, 4, 0
- Stem 7: 0
The leaves for the Puffins (right side, ordered left-to-right) are:
- Stem 4: 5, 9
- Stem 5: 1, 5, 5, 8, 9
- Stem 6: 2, 4, 4
- Stem 7: 4
The back-to-back stem-and-leaf diagram is:
Key: means 54 minutes for Linnets and 55 minutes for Puffins.
Answer
See the diagram above with the key.
Back-to-back stem-and-leaf diagram with Linnets on the left, Puffins on the right, and key: 4|5|5 means 54 mins for Linnets and 55 mins for Puffins.
Walkthrough
First, we identify the stems (tens digits) which are 4, 5, 6, and 7. For each stem, we list the leaves (units digits).
For the Linnets, the data is: 48, 51, 54, 57, 59, 60, 64, 64, 65, 68, 70.
- For stem 4, the leaf is 8.
- For stem 5, the leaves are 1, 4, 7, 9. Since they go on the left side of the stem, we write them in descending order from right to left: 9, 7, 4, 1.
- For stem 6, the leaves are 0, 4, 4, 5, 8. Written right to left: 8, 5, 4, 4, 0.
- For stem 7, the leaf is 0.
For the Puffins, the data is: 45, 49, 51, 55, 55, 58, 59, 62, 64, 64, 74.
- For stem 4, the leaves are 5, 9. Written left to right: 5, 9.
- For stem 5, the leaves are 1, 5, 5, 8, 9.
- For stem 6, the leaves are 2, 4, 4.
- For stem 7, the leaf is 4.
Finally, we add a key. A value like uses the left leaf 4, stem 5, and right leaf 5 to represent 54 minutes for the Linnets and 55 minutes for the Puffins.
Key Takeaways
- In a back-to-back stem-and-leaf diagram, leaves on the left are ordered in descending order from right to left, while leaves on the right are ordered in ascending order from left to right.
- A key is essential to explain the notation, including the unit of measurement.
Common Mistakes
- Forgetting to order the leaves correctly (left side should be descending right-to-left).
- Adding commas or spaces between leaves on the same side.
- Omitting the key or not including both team names and units in the key.
Things to Be Careful About
- Ensure the stems are aligned vertically.
- Do not split the stems unless specifically asked to do so; a single stem for each tens digit is sufficient here.
- The key must clearly show how to read a value from both sides.
Approach
The Linnets data has values. The lower quartile (LQ) is the th value and the upper quartile (UQ) is the th value. The interquartile range is .
Working
The ordered Linnets data is:
Position of LQ: rd value .
Position of UQ: th value .
Answer
11
Walkthrough
We are given 11 ordered times for the Linnets. To find the interquartile range, we first locate the lower quartile (LQ) and upper quartile (UQ).
For data points:
- The LQ is at position . The 3rd value in the ordered list is 54.
- The UQ is at position . The 9th value in the ordered list is 65.
The interquartile range is the difference between these two values:
Key Takeaways
- For data points, the quartiles can be found using positions and .
- The IQR is a measure of spread that is resistant to outliers, calculated as UQ - LQ.
Common Mistakes
- Using the wrong positions for the quartiles (e.g., using instead of ).
- Forgetting to subtract LQ from UQ to get the IQR.
Things to Be Careful About
- Ensure the data is in ascending order before finding the quartiles.
- The mark scheme allows for condoning values like 54 and 65 if they are clearly identified in the stem-and-leaf diagram from part (a).
On the grid below, draw a box-and-whisker plot to represent the information for the Linnets and the Puffins.
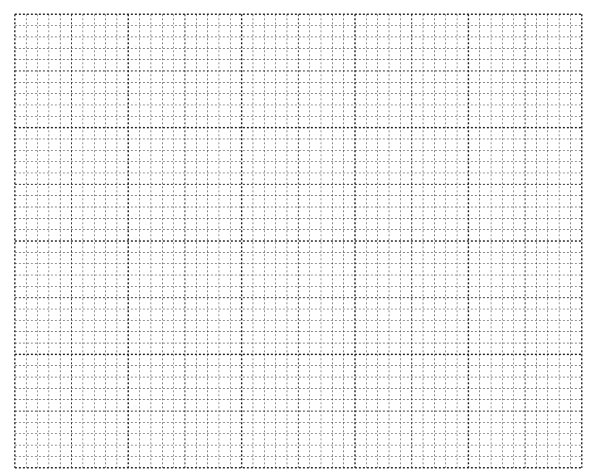
Approach
Calculate the minimum, lower quartile, median, upper quartile, and maximum for both teams. Draw a horizontal axis with a linear scale covering the range of data (e.g., 45 to 75). Draw the box-and-whisker plots for both teams on this scale.
Working
Linnets five-number summary:
- Minimum: 48
- LQ: 54
- Median (6th value): 60
- UQ: 65
- Maximum: 70
Puffins five-number summary:
- Minimum: 45
- LQ (3rd value): 51
- Median (6th value): 58
- UQ (9th value): 64
- Maximum: 74
Draw a horizontal axis labelled "time taken / min" with a linear scale from 45 to 75 (e.g., using ).
Draw the Linnets box-and-whisker plot:
- Left whisker at 48
- Box from 54 to 65
- Median line at 60
- Right whisker at 70
- Label the plot "Linnets"
Draw the Puffins box-and-whisker plot below it:
- Left whisker at 45
- Box from 51 to 64
- Median line at 58
- Right whisker at 74
- Label the plot "Puffins"
Answer
Box-and-whisker plots drawn on a linear scale from 45 to 75, with Linnets: min 48, LQ 54, median 60, UQ 65, max 70; and Puffins: min 45, LQ 51, median 58, UQ 64, max 74.
Box-and-whisker plots with Linnets (48, 54, 60, 65, 70) and Puffins (45, 51, 58, 64, 74) on a linear scale from 45 to 75.
Walkthrough
First, we determine the five-number summary (minimum, LQ, median, UQ, maximum) for both teams.
For the Linnets (11 values):
- Min = 48
- LQ = 3rd value = 54
- Median = 6th value = 60
- UQ = 9th value = 65
- Max = 70
For the Puffins (11 values):
- Min = 45
- LQ = 3rd value = 51
- Median = 6th value = 58
- UQ = 9th value = 64
- Max = 74
Next, we set up a horizontal axis with a linear scale. The data ranges from 45 to 74, so a scale from 45 to 75 is appropriate. The mark scheme allows a scale such as , with at least 3 equally spaced values marked.
We draw the Linnets plot: a whisker from 48 to the box at 54, the box extends to 65 with a median line at 60, and a whisker extends to 70. We label this "Linnets".
We draw the Puffins plot below it on the same scale: a whisker from 45 to the box at 51, the box extends to 64 with a median line at 58, and a whisker extends to 74. We label this "Puffins".
Important rules for box-and-whisker plots:
- Whiskers should not extend to the top/bottom of the box or pass through it.
- The "daylight rule" applies: there should be a gap (daylight) between the end of the whisker and the edge of the box.
Key Takeaways
- A box-and-whisker plot displays the five-number summary and provides a visual representation of the spread and central tendency of data.
- When drawing multiple plots, use the same linear scale for fair comparison.
Common Mistakes
- Using a non-linear or broken scale.
- Forgetting to label the plots or the axis.
- Violating the daylight rule (whiskers touching or crossing the box).
- Using different scales for the two plots.
Things to Be Careful About
- Ensure both plots are drawn on the same linear scale.
- Label the axis with the variable and its unit (e.g., "time taken / min").
- Condone missing vertical lines on the max/min values at the ends of the whiskers.
Make one comparison between the times taken by the Linnets and the times taken by the Puffins.
Approach
Compare the interquartile ranges, ranges, or medians of the two teams to make a valid statement about their spread or central tendency.
Working
Linnets:
- IQR = 11
- Range = 70 - 48 = 22
- Median = 60
Puffins:
- IQR = 64 - 51 = 13
- Range = 74 - 45 = 29
- Median = 58
The Puffins have a larger IQR (13 > 11) and a larger range (29 > 22), indicating their times are more spread out. The Linnets have a higher median (60 > 58), indicating they are generally slower.
Answer
The times taken by the Puffins are more spread out (less consistent) than those of the Linnets.
The times taken by the Puffins are more spread out (less consistent) than those of the Linnets.
Walkthrough
We compare the statistics calculated in the previous parts.
For spread:
- Linnets IQR = 11, Puffins IQR = 13. Since 13 > 11, the Puffins have a larger spread in the middle 50% of their data.
- Linnets range = 22, Puffins range = 29. Since 29 > 22, the Puffins have a larger overall spread.
For central tendency:
- Linnets median = 60, Puffins median = 58. Since 60 > 58, the Linnets generally took longer (slower times).
A valid comparison must refer to spread or central tendency. For example: "The times taken by the Puffins are more spread out than those of the Linnets" or "The Linnets have slower times on average than the Puffins."
Key Takeaways
- Comparisons should be based on measurable statistics like IQR, range, or median.
- A valid comparison must explain what the difference means (e.g., more spread out, slower, more consistent).
Common Mistakes
- Simply stating "the median is different" without explaining the implication.
- Comparing only one value without context (e.g., "Puffins have a higher range" is not a complete comparison statement).
Things to Be Careful About
- The mark scheme explicitly states that a comment comparing only the median or range is not acceptable; it must be a comparison about spread or central tendency (e.g., "more spread out", "less consistent", "slower").
- Extra comments are ignored if they do not contradict the correct statement.
The times taken by Obi to walk to work each morning are normally distributed with mean 14.8 minutes and standard deviation 1.5 minutes.
Find the probability that, on a randomly chosen day, Obi takes more than 15.6 minutes to walk to work.
Approach
Standardise the normal variable using , then use the standard normal table to find the upper-tail probability.
Working
Let be Obi's walking time, so .
For :
Therefore
From the normal table, , so
Answer
0.297
Walkthrough
We are told the walking times are normally distributed with mean 14.8 minutes and standard deviation 1.5 minutes. We want the probability that a randomly chosen time is greater than 15.6 minutes.
First standardise 15.6:
This -value says that 15.6 is 0.5333 standard deviations above the mean. The normal table gives the probability that is less than this value, . Since we want the probability that is greater than 15.6, we take the complement:
So the probability is about 0.297.
Key Takeaways
Standardising a normal variable with lets us use the standard normal table. For an upper-tail probability, subtract the tabled value from 1.
Common Mistakes
- Forgetting to subtract the tabled probability from 1, since the table gives .
- Using the wrong tail, e.g. finding instead of .
- Using or in the standardisation formula instead of .
Things to Be Careful About
- Use , not .
- Because 15.6 is above the mean, the answer should be less than 0.5.
- No continuity correction is needed when working directly with the normal distribution.
Approach
We need the value such that the probability of taking more than minutes is 0.9. Since 90% of the distribution is above , must be below the mean, so the corresponding -value is negative. Find the critical -value and solve for .
Working
We require
Standardising:
The -value with 0.9 above it is , so
Solve for :
Answer
minutes
t = 12.9 minutes
Walkthrough
We know . Standardising gives .
Because the probability above is large (0.9), is below the mean, so the -value is negative. From the normal table, the value with 0.9 above it is . Set the standardised expression equal to and solve:
Rounded to one decimal place, minutes.
Key Takeaways
Given a probability, use the inverse normal table to find the corresponding -value. For an upper-tail probability greater than 0.5, the -value is negative.
Common Mistakes
- Using instead of , which would give a time above the mean.
- Using the probability 0.9 directly as a -value.
- Using or in the standardisation.
Things to Be Careful About
- The critical value is (or with the sign handled correctly).
- No continuity correction is used here.
- Give the final answer in minutes, AWRT 12.9.
Obi walks to work 5 days a week for 45 weeks in a year.
On how many days in a year would you expect Obi to take within one minute of the mean time to walk to work?
Approach
"Within one minute of the mean" means between and . Standardise both boundaries, use symmetry to find the probability, then multiply by the number of walking days in the year.
Working
There are walking days in the year.
For the lower boundary :
For the upper boundary :
By symmetry,
From the normal table, , so
Expected number of days:
So the expected number of days is 111 days.
Answer
days
111 days
Walkthrough
First find the interval: one minute below the mean is , and one minute above the mean is .
Standardise both boundaries:
The two -values are opposites, so the interval is symmetric about the mean. The probability is
Using :
There are walking days in a year. The expected number of days is
Since we are counting days, the expected number is 111 days.
Key Takeaways
For an interval symmetric about the mean, use . To find an expected count, multiply the probability by the total number of trials.
Common Mistakes
- Using 14.3 and 15.3 instead of 13.8 and 15.8; "within one minute of the mean" means .
- Forgetting to multiply the probability by 225.
- Rounding the probability too early; keep at least four decimal places before multiplying.
- Giving a non-integer like 111.465 as the final number of days.
Things to Be Careful About
- The boundaries are minute, not standard deviation.
- No continuity correction is needed.
- The expected value is 111.465, so the sensible integer answer is 111 days.