Mathematics 9709/52 — February/March 2025
Cambridge AS Level · Probability & Statistics 1 · worked solutions for every part, with the mark scheme
Topics Probability · Discrete Random Variables · The Normal Distribution · Representation of Data · Permutations and Combinations
Jacob throws three coins at the same time.
The first coin is biased so that the probability of obtaining a head when it is thrown is .
The second coin is biased so that the probability of obtaining a head when it is thrown is .
The third coin is biased so that the probability of obtaining a head when it is thrown is .
The random variable is the number of heads obtained.
Approach
Exactly two heads can occur in three mutually exclusive ways: HHT, HTH and THH. Since the coins are independent, multiply the probabilities along each branch and add the three results.
Working
Answer
P(X=2) = 3/20
Walkthrough
We need exactly two heads among the three coins. The coins are independent, so for any particular pattern we multiply the three individual probabilities. The three patterns that give two heads are HHT, HTH and THH. Because these patterns cannot happen at the same time, they are mutually exclusive, so we add their probabilities. This gives .
Key Takeaways
This question tests the multiplication law for independent events and the addition law for mutually exclusive events. It also shows that when outcomes have different probabilities, we must consider each ordered pattern separately.
Common Mistakes
- Forgetting the third case THH and only considering two of the three patterns.
- Using the same probability for each coin instead of the given different probabilities.
- Mixing up head and tail probabilities (e.g. using for a head).
- Since the answer is given (AG), you must show the full working; an unsupported answer earns no mark.
Things to Be Careful About
- Keep the order of the coins consistent with the question: first coin probability , second , third .
- Use tail probabilities , and where needed.
- Simplify to as the final line.
Approach
For each possible value of , list the ordered patterns that give that number of heads, multiply the independent probabilities for each pattern, and add the mutually exclusive cases. Then check that the probabilities sum to 1.
Working
The probability distribution table is:
| 0 | 1 | 2 | 3 | |
|---|---|---|---|---|
Check: .
Answer
P(X=0)=2/5, P(X=1)=13/30, P(X=2)=3/20, P(X=3)=1/60
Walkthrough
We start with , which only happens when all three coins show tails: . For , there are three ordered patterns: HTT, THT and TTH, each with a different product because the coins have different probabilities. Adding them gives . For , we already found in part (a). For , all three must be heads: . The probabilities sum to 1, which confirms the distribution is complete.
Key Takeaways
A probability distribution table must list every possible value of the random variable with its probability, and the probabilities must sum to 1. When coins have different biases, each ordered pattern must be considered separately.
Common Mistakes
- Missing one of the three patterns for .
- Using the same probability for every coin.
- Not simplifying probabilities when required or giving decimals to fewer than 3 significant figures.
- Placing probabilities in the table without linking them to the correct value.
Things to Be Careful About
- The mark scheme allows unsimplified fractions, but decimals must be correct to at least 3 significant figures.
- If you cannot find the individual probabilities, placing any four probabilities that sum to 1 in a probability distribution table can earn a special case mark (SC1).
- Keep the order of coins consistent throughout.
Approach
Use the formula . First compute from the distribution table, then substitute the given .
Working
Therefore
Answer
2051/3600 ≈ 0.570
Walkthrough
The variance is found from . We already have the distribution table, so we compute by multiplying each by its probability and adding. This gives . The question gives , so we square this and subtract: .
Key Takeaways
Variance can be calculated as . This is often easier than summing squared deviations when the distribution table is already known.
Common Mistakes
- Forgetting to subtract .
- Using instead of in the formula.
- Squaring incorrectly.
- Giving only as the final answer without showing the more accurate value ; the mark scheme penalises as 2 significant figures.
Things to Be Careful About
- Use exact fractions throughout until the final rounding.
- The mark scheme allows follow-through from the student's own table if it has 3 or more probabilities with , even if they do not sum to 1.
- If no method mark is earned, a special case mark (SC1) is available for the correct final answer or with no working.
- The final answer should satisfy .
Last year, an online store sold a large number of computers. 55% of the computers were made by company , 30% were made by company and 15% were made by company .
A random sample of 3 customers who each bought a computer from this store is chosen.
Find the probability that the 3 customers bought computers all made by different companies.
Approach
Each customer is independent, so the probability of any particular ordered choice is the product of the three company proportions. Since the three customers must be from three different companies, one from each of , and , there are possible orders.
Working
As a fraction, .
Answer
0.1485 or 297/2000
Walkthrough
We need all three customers to have bought computers made by different companies. Since the sample is random, each customer's choice is independent and uses the given proportions. First choose one company for each customer: one , one , one . For a fixed order, say , the probability is . However, the order could be any of the permutations of , , . These orders are mutually exclusive, so we add their probabilities, which is the same as multiplying the single-order probability by .
Key Takeaways
This question tests the multiplication law for independent events and the addition law for mutually exclusive outcomes. It also shows the importance of counting arrangements when order is not specified.
Common Mistakes
- Forgetting to multiply by and giving only .
- Treating the event as ordered when it is not, or incorrectly adding the proportions instead of multiplying them.
- Rounding too early; the exact value is .
Things to Be Careful About
The proportions are probabilities because the sample is random. The three events are independent, and the six possible orders are mutually exclusive. The mark scheme accepts and also condones as a rounded answer.
A random sample of 12 customers who each bought a computer from this store is chosen.
Find the probability that fewer than 10 of these customers bought a computer made by company .
Approach
Let be the number of customers who bought a computer made by company . Then . We need . It is easier to use the complement: subtract the probabilities of from .
Working
0.958
Walkthrough
The number of customers buying company in a sample of 12 is a binomial random variable because each customer independently either buys with probability or does not buy with probability . We need fewer than 10, i.e. . Calculating all 10 probabilities would be long, so we use the complement: . The events , and are mutually exclusive, so their probabilities add. Each uses the binomial formula . Subtract the total from 1.
Key Takeaways
This question tests the binomial distribution and the use of complements to reduce calculation. It also reinforces that binomial probabilities are summed over mutually exclusive outcomes.
Common Mistakes
- Computing instead of ; fewer than 10 means up to 9.
- Using instead of for company .
- Forgetting to include all three terms in the complement.
- Not recognising that has coefficient .
Things to Be Careful About
The complement must include exactly , not . Show the three binomial terms to earn method marks. The final answer should round to ; the mark scheme allows a final answer in the range .
A random sample of 140 customers who each bought a computer from this store is chosen.
Use a suitable approximation to find the probability that more than 24 of these customers bought a computer made by company .
Approach
Let be the number of customers who bought a computer made by company . Then . Since and are both greater than 5, the normal approximation is suitable. Use , , so . For , apply the continuity correction and use .
Working
0.204
Walkthrough
We have a binomial count with and . For a normal approximation, check and are both large enough; here they are and . The approximating normal has mean and variance , so the standard deviation is . Because the binomial is discrete and the normal is continuous, we use a continuity correction. The event means ; the boundary between 24 and 25 is , so we standardise . Then . The required probability is the upper tail, . From tables, , giving .
Key Takeaways
This question tests when and how to use the normal approximation to the binomial distribution, including the continuity correction and standardisation with the Z-score. It also tests calculating the mean and variance of a binomial distribution.
Common Mistakes
- Omitting the continuity correction or using 24 instead of 24.5.
- Using the variance as the standard deviation in the Z-score.
- Using instead of for the event .
- Forgetting to subtract from 1 for an upper-tail probability.
- Approximating without checking that and are large enough.
Things to Be Careful About
The mean is and the variance is ; the standard deviation is . The mark scheme withholds the mean/variance mark if is clearly called the standard deviation. Use , not , for . Show the standardisation and continuity correction to earn method marks. The final answer should be about , and the mark scheme accepts answers within a tolerance. The probability must be less than because 24 is above the mean of 21.
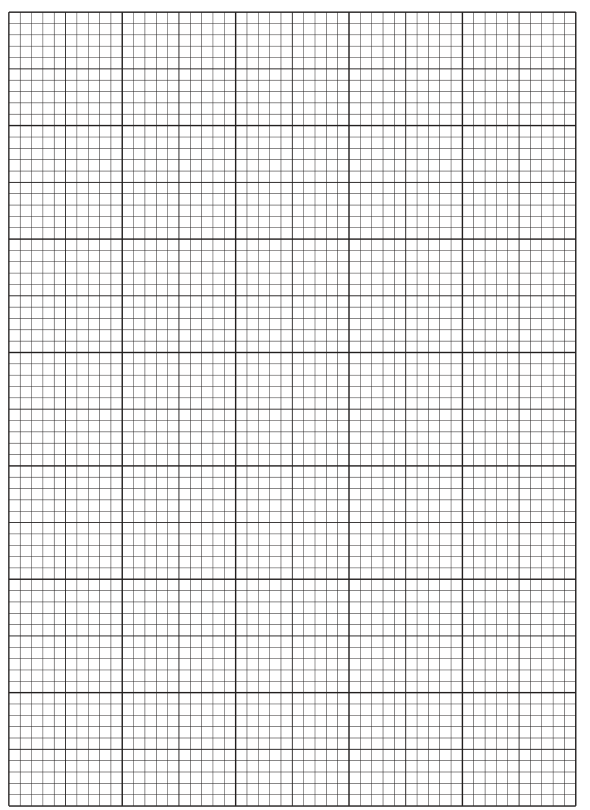
The lengths of 250 leaves of a certain type of plant are measured, correct to the nearest centimetre. The results are summarised in the table below.
| Length (cm) | 5 – 9 | 10 – 14 | 15 – 19 | 20 – 24 | 25 – 29 | 30 – 39 |
|---|---|---|---|---|---|---|
| Frequency | 18 | 28 | 60 | 72 | 48 | 24 |
Approach
To draw a cumulative frequency graph, we first calculate the cumulative frequency at each upper class boundary. The classes are given as 5–9, 10–14, etc., so the upper boundaries are 9.5, 14.5, 19.5, 24.5, 29.5, and 39.5. We also start the graph at the lower boundary of the first class, which is 4.5, with a cumulative frequency of 0.
Working
Calculate the cumulative frequencies:
The points to plot are:
Plot these points on the grid with Length (cm) on the horizontal axis (from 4.5 to 39.5) and Cumulative Frequency on the vertical axis (from 0 to 250). Draw a smooth S-shaped curve (ogive) through the points, starting at and ending at . Do not join the points with straight line segments.
Answer
Cumulative frequency table:
| Length < | 9.5 | 14.5 | 19.5 | 24.5 | 29.5 | 39.5 |
|---|---|---|---|---|---|---|
| Cumulative Frequency | 18 | 46 | 106 | 178 | 226 | 250 |
Graph drawn as described.
Cumulative frequencies: 18, 46, 106, 178, 226, 250 at upper boundaries 9.5, 14.5, 19.5, 24.5, 29.5, 39.5. Smooth ogive plotted from (4.5, 0) to (39.5, 250).
Walkthrough
First, we identify the upper class boundaries for each group. Since the data is measured to the nearest centimetre, the boundary between 9 and 10 is 9.5, between 14 and 15 is 14.5, and so on. The last group is 30–39, so its upper boundary is 39.5. We also note the lower boundary of the first group is 4.5.
Next, we calculate the cumulative frequencies by adding up the frequencies as we move from left to right:
- At 9.5: 18
- At 14.5: 18 + 28 = 46
- At 19.5: 46 + 60 = 106
- At 24.5: 106 + 72 = 178
- At 29.5: 178 + 48 = 226
- At 39.5: 226 + 24 = 250
We plot these points on a graph with Length on the x-axis and Cumulative Frequency on the y-axis. The graph must start at (4.5, 0) because there are 0 leaves shorter than 4.5 cm. We then draw a smooth curve through the points. This is called an ogive. It must be smooth, not made of straight line segments, and should not go above 250 vertically within the range.
Key Takeaways
- Cumulative frequency graphs are plotted at upper class boundaries.
- The graph always starts at the lower boundary of the first class with a cumulative frequency of 0.
- The final cumulative frequency must equal the total frequency (250 in this case).
- The curve should be smooth (an ogive), not straight line segments.
Common Mistakes
- Using the upper limits of the classes (9, 14, 19, etc.) instead of the true boundaries (9.5, 14.5, 19.5, etc.).
- Forgetting to start the graph at (4.5, 0).
- Joining the plotted points with straight line segments instead of drawing a smooth curve.
- Failing to label the axes correctly or not using more than 50% of the grid.
Things to Be Careful About
- The last class is 30–39, which has a different width (10) than the others (5). The upper boundary is correctly 39.5.
- Ensure the axes are linearly scaled and clearly labelled with units (cm and cumulative frequency).
- The curve must be smooth; straight lines will not earn the final accuracy mark.
Approach
The problem states that 38% of the leaves are of length cm or more. This means that the remaining 62% of the leaves are of length less than cm. We can find 62% of the total number of leaves (250) to get the cumulative frequency corresponding to , and then read the value of from the graph.
Working
Calculate 62% of the total frequency:
Draw a horizontal line from 155 on the cumulative frequency axis across to the curve. From the point where this line meets the curve, draw a vertical line down to the length axis.
Reading from the graph, the value of is approximately 23 cm. (Acceptable range from a correct graph: ).
Answer
k = 23
Walkthrough
The question says 38% of leaves are length or more. In terms of cumulative frequency (which measures 'less than'), this means 100% - 38% = 62% of leaves are less than .
We calculate 62% of the total 250 leaves:
So we look for the length where the cumulative frequency is 155. On the cumulative frequency graph, we find 155 on the y-axis, draw a horizontal line to the curve, and then drop a vertical line to the x-axis. This gives us an estimate for .
Reading from a correctly drawn graph, this value is approximately 23 cm.
Key Takeaways
- Cumulative frequency graphs show the number of values less than a given value.
- If a percentage is given for 'more than or equal to', subtract it from 100% to find the corresponding cumulative frequency percentage.
- Always read the graph carefully: horizontal from y-axis to curve, then vertical to x-axis.
Common Mistakes
- Using 38% directly to find the cumulative frequency (38% of 250 = 95), which is incorrect because the graph shows 'less than', not 'more than'.
- Reading the graph incorrectly by going vertical first then horizontal.
Things to Be Careful About
- Ensure you use the correct percentage direction: '38% or more' means '62% or less'.
- The answer is an estimate from the graph, so a small range (e.g., 22.5 to 23.5) is acceptable depending on the precision of the graph drawn.
Approach
To estimate the mean from grouped data, we use the midpoint of each class interval as a representative value for all observations in that class. We multiply each midpoint by its corresponding frequency, sum these products, and divide by the total frequency.
Working
First, find the midpoint of each class:
Now apply the mean formula :
Calculate the numerator:
Sum of :
Calculate the mean:
Answer
20.76
Walkthrough
For grouped data, we don't know the exact values, so we assume all values in a class are equal to the class midpoint.
We calculate the midpoint for each class by averaging the lower and upper bounds. Note that the last class is 30–39, so its midpoint is (30 + 39) / 2 = 34.5.
We then multiply each midpoint by its frequency to get the estimated total length for that class:
- 7 × 18 = 126
- 12 × 28 = 336
- 17 × 60 = 1020
- 22 × 72 = 1584
- 27 × 48 = 1296
- 34.5 × 24 = 828
Summing these gives the estimated total length of all 250 leaves: 5190 cm.
Dividing by the total number of leaves (250) gives the estimated mean: 5190 / 250 = 20.76 cm.
Key Takeaways
- The midpoint of a class is used as the representative value for grouped data mean calculations.
- The formula is , where is frequency and is the midpoint.
- Pay attention to classes with different widths, like 30–39 here, which has a midpoint of 34.5, not 35.
Common Mistakes
- Using the upper or lower class limit instead of the midpoint.
- Miscalculating the midpoint for the last class (30–39) as 35 instead of 34.5.
- Forgetting to divide by the total frequency (250) at the end.
- Using cumulative frequency or frequency density instead of actual frequency in the numerator.
Things to Be Careful About
- The last class 30–39 has width 10, not 5. Its midpoint is correctly (30+39)/2 = 34.5.
- Ensure all arithmetic is correct, especially the multiplication and addition steps, as errors will propagate to the final answer.
- The answer should be given to a reasonable number of decimal places (20.76 is exact here).
Eddie has 16 toy cars, of which 8 are white, 5 are black and 3 are silver. He places all the cars in a bag and selects three of them at random, without replacement.
Approach
To find the probability that all three cars are the same colour, identify all mutually exclusive cases: all white, all black, or all silver. Since the draws are without replacement, multiply the probability for each successive draw, then add the three results.
Working
There are 16 cars: 8 white, 5 black and 3 silver.
Probability all three are white:
Probability all three are black:
Probability all three are silver:
The three cases are mutually exclusive, so add them:
Answer
67/560 ≈ 0.120
Walkthrough
We need the probability that all three cars drawn (without replacement) are the same colour. Three distinct outcomes satisfy this: all white, all black, or all silver. Because these outcomes cannot both happen, they are mutually exclusive, and we may add their individual probabilities.
For a single colour, multiply along the draws: the denominators fall from 16 to 15 to 14 because each draw removes a car and none are replaced. For white we have : 8 white cars out of 16 on the first draw, then 7 white out of the remaining 15, then 6 white out of the remaining 14. The same reasoning gives for black and for silver.
All three products share denominator 3360, so add the numerators: , giving , which simplifies to (approximately 0.120).
An equivalent way to set this up is with combinations: — choose 3 of the 8 white, or 3 of the 5 black, or 3 of the 3 silver, over the total ways to choose any 3 of 16.
Key Takeaways
This question tests the multiplication law of probability (multiplying successive draw probabilities with decreasing denominators for sampling without replacement) and the addition law for mutually exclusive events. It also shows the connection between the sequential-fraction approach and the combinations approach .
Common Mistakes
A frequent error is computing only one case, such as , and forgetting the all-black and all-silver cases. Another is using denominator 16 for every draw (as if sampling with replacement) instead of 16, 15, 14. Students also sometimes fail to add the three cases at the end.
Things to Be Careful About
The draws are without replacement, so denominators decrease by 1 each time. The three colour cases are mutually exclusive, so addition is valid. Ensure the final answer is simplified: . The mark scheme awards each of the three case probabilities and then the total, so show all three products and the sum.
Find the probability that, when the 3 cars are selected, at least one car is white and at least one car is black.
Approach
We need at least one white and at least one black among the three selected. Since exactly three cars are chosen, the third car must be white, black or silver. This gives three mutually exclusive cases: two white and one black, one white and two black, one white, one black and one silver. Compute each probability, allowing for the number of arrangements, and add.
Working
There are 16 cars: 8 white, 5 black and 3 silver.
Case 1: Two white and one black (3 arrangements: WWB, WBW, BWW):
Case 2: One white and two black (3 arrangements: WBB, BWB, BBW):
Case 3: One white, one black and one silver (6 arrangements):
The cases are mutually exclusive, so add them:
Answer
17/28 ≈ 0.607
Walkthrough
We want at least one white and at least one black car among the three selected. Since exactly three cars are chosen, having at least one of each colour leaves only three possibilities for the full set: two whites and one black, one white and two blacks, or one white, one black and one silver.
Take the first case, two whites and one black. It has three arrangements: WWB, WBW and BWW, so compute the probability of one arrangement and multiply by 3: . The is the first white, the black (5 black left out of 15) and the second white (7 white left out of 14).
Second case, one white and two blacks: arrangements are WBB, BWB and BBW, so multiply by 3: .
Third case, one white, one black and one silver: all three colours are different, so there are 6 arrangements, and the probability is .
These three cases are mutually exclusive, so add the numerators (all products already share denominator 3360): , giving .
Alternatively, the same result follows using combinations: .
Key Takeaways
This question tests enumeration of favourable cases and the addition/multiplication laws of probability. The key skill is recognising that 'at least one white and at least one black' forces the third car to be white, black or silver, giving three exhaustive and mutually exclusive cases, each requiring the correct arrangement multiplier.
Common Mistakes
A common error is forgetting the third case (white, black, silver) and only considering WWB and WBB. Another is omitting the arrangement multipliers (multiplying by 3 or 6) when using the sequential-fraction method, which undercounts the probability. Some students incorrectly include cases with no white or no black, such as WWW or BBB.
Things to Be Careful About
Because draws are without replacement, denominators decrease from 16 to 15 to 14. Always apply the arrangement multiplier: 3 for 'two of one colour and one of another', and 6 when all three colours are distinct. Simplify the final answer: . An alternative valid method is the complement approach: subtract from 1 the sum of all cases that lack a white or lack a black.
The mass of peaches sold per day in a supermarket is normally distributed with mean 65.8kg and standard deviation 9.6kg.
Find the probability that the mass of peaches sold on any given day is between 56kg and 75kg.
Approach
Let be the daily mass of peaches sold. Since is normally distributed with mean and standard deviation , standardise the boundaries using
and find the standard normal probability between the two transformed values.
Working
For :
The required probability is the area between these two -values:
Using the symmetry of the normal distribution, , so
From the standard normal table:
Answer
0.677
Walkthrough
We begin with the normal distribution for peaches: mean and standard deviation . Because probabilities for a general normal distribution are not tabulated, we convert the lower limit and upper limit to -scores using . The lower boundary gives and the upper boundary gives . The probability of being between them is the area under the standard normal curve from to . This area equals . Since the curve is symmetric, the area to the left of is , so the probability becomes . Substituting the table values and gives , or to three significant figures.
Key Takeaways
This part tests the standardisation formula and the use of the standard normal table. It also tests the important symmetry property , which is needed whenever one boundary is below the mean.
Common Mistakes
- Dividing by instead of ; the standard deviation is used in the denominator, not the variance.
- Using or another incorrect combination of tails.
- Rounding the -values too early and losing accuracy in the final probability.
Things to Be Careful About
The final probability is greater than because the interval covers nearly the whole central region. No continuity correction is applied, because is already modelled as a continuous normal variable. The mark scheme requires the use of standardisation with , and one of the boundaries to gain the first method mark, and a proper probability area for the second method mark.
The mass of cherries sold per day in a supermarket is normally distributed with mean 72.4kg and standard deviation kg. It is known that on 10% of days less than 59.1kg of cherries are sold.
Find the value of .
Approach
Let be the daily mass of cherries sold. We are told . For the standard normal distribution, the lower 10% point is . Standardise with mean and unknown standard deviation , equate it to this -value, and solve for .
Working
For :
Standardising:
The lower 10% point of the standard normal distribution is , so
Answer
10.4 kg
Walkthrough
For cherries, the distribution is normal with known mean and unknown standard deviation . We know that the probability of being below is , so the standardised value must be the lower point of the standard normal distribution. From the table, that point is . Setting gives , so dividing both sides by gives to 3 significant figures.
Key Takeaways
This is an inverse normal problem: instead of finding a probability from a boundary, we use a known probability to find the corresponding -value and then solve for an unknown parameter. The lower tail has critical value .
Common Mistakes
- Using , , or the table probability instead of the -critical value .
- Losing the negative sign, which may lead to a negative or incorrect standard deviation.
- Using or instead of in the standardisation formula.
Things to Be Careful About
The signs must be consistent throughout. Since is below the mean, must be negative, matching . The answer is accepted as AWRT. No continuity correction is needed here, although a small correction would be condoned.
The supermarket is open 7 days a week.
Find the probability that, in a randomly chosen week, the first day on which less than 59.1kg of cherries are sold is the fifth day of the week.
Approach
From part (b), the probability that fewer than kg of cherries are sold on any one day is . The first such day being the fifth day means the first four days are not such days and the fifth day is. Assuming independence between days, multiply the probabilities.
Working
Answer
0.0656
Walkthrough
Each day independently has probability of being a day with fewer than 59.1 kg of cherries sold, and probability otherwise. For the first such day to be the fifth day, days 1, 2, 3 and 4 must all be non-successes, with probability , and day 5 must be a success, with probability . Multiplying gives , which rounds to .
Key Takeaways
This is a geometric waiting-time problem. If is the probability of success on one trial, the probability that the first success occurs on trial is .
Common Mistakes
- Using , which reverses the success and failure probabilities.
- Using , which treats the first success as occurring on day 6.
- Adding probabilities instead of multiplying, which ignores the need for all four earlier days to be failures.
Things to Be Careful About
Only the first four days and the fifth day are constrained by this event. Outcomes on days 6 and 7 are irrelevant because the first success has already occurred on day 5. The answer should be rounded to 3 significant figures, .
Find the probability that, in a randomly chosen week, the first day on which less than 59.1kg of cherries are sold is before the fifth day of the week.
Approach
‘Before the fifth day’ means the first day with fewer than 59.1 kg of cherries sold is day 1, 2, 3 or 4. It is easier to use the complement: the event that it is not before the fifth day means the first four days all have at least 59.1 kg sold, with probability .
Working
Let be the day number on which fewer than 59.1 kg of cherries are first sold.
Since means no success on the first four days,
Therefore
Equivalently, by summing the probabilities for days 1 to 4:
Answer
0.344
Walkthrough
From part (b), each day has probability of being a day with fewer than 59.1 kg of cherries sold, so probability otherwise. We want the first such day to occur before day 5, i.e. on day 1, 2, 3 or 4. The complement is that the first such day occurs on or after day 5; this happens only if all of the first four days are not such days. The probability of that is . Hence the required probability is , which is to 3 significant figures. Alternatively, one can add .
Key Takeaways
This is another geometric distribution question. It uses the complementary event , avoiding a longer sum. Understanding when to use the complement often simplifies a waiting-time probability.
Common Mistakes
- Using or instead of , because ‘before the fifth day’ depends on the first four days only.
- Forgetting to subtract from 1 and giving the probability that the first such day is day 5 or later.
- For Method 2, missing the first term or using an incorrect number of terms.
Things to Be Careful About
The days are assumed independent, so multiplication is valid. The week has seven days, but the event only constrains what happens on the first four days and, for part (c), the fifth day; outcomes on later days are unrestricted. The answer should be rounded to 3 significant figures, .
Alissa has 10 different books from the series Squares and Circles. The books look similar except for their colour. There are 3 blue books, 2 red books, 2 yellow books, 1 orange book, 1 purple book and 1 green book.
Alissa places the books in a row on her shelf. She is only interested in the arrangement of the colours.
Approach
There are 10 books, but only colours matter. Books of the same colour are indistinguishable in a colour arrangement, so divide the total arrangements by the factorials of the repeated colours.
Working
The colour counts are 3 blue, 2 red, 2 yellow, and 1 each of orange, purple and green.
Answer
151200
Walkthrough
We are arranging all 10 books in a row, but the question asks only for colour arrangements. If every book were distinct, there would be arrangements. However, the 3 blue books are identical as colours, so swapping two blue books does not change the colour pattern; divide by . Similarly, the 2 red books and 2 yellow books are identical, so divide by each. The single orange, purple and green books each contribute a factor of .
Key Takeaways
This question tests the multinomial arrangement formula for a row of items with repeated identical items. The key idea is to start from the factorial of the total number of items and divide by the factorial of each repeated group.
Common Mistakes
A common mistake is to use without dividing by the repeated colours, or to divide by the wrong factorials. Another mistake is to treat the 3 blue books as distinct even though only colours matter.
Things to Be Careful About
Remember that the two yellow books and the two red books are each identical in a colour arrangement. The single-colour books do not require division.
How many different colour arrangements are there of the 10 books in which the 3 blue books are together, but the 2 yellow books are not next to each other?
Approach
Treat the 3 blue books as one block, since they must be together. First count all colour arrangements with this blue block. Then subtract the arrangements in which the 2 yellow books are also together, because those are forbidden.
Working
With the blue block treated as one unit, the units are , , , , , , , : 8 units with 2 red and 2 yellow identical.
Now count the arrangements where the yellow books are also together. Treat as one block. The units are , , , , , , : 7 units with 2 red identical.
Subtract the forbidden arrangements:
Answer
7560
Walkthrough
First, because the 3 blue books must be together, we can imagine gluing them into a single block . This block, together with the other 7 coloured units, gives 8 units. Within these 8 units, the two reds are identical and the two yellows are identical, so there are arrangements. This total includes arrangements where the two yellow books are next to each other, which are not allowed. To remove them, glue the two yellows into a block as well. Then the units are , , , , , , : 7 units with two identical reds, giving forbidden arrangements. Subtract.
Key Takeaways
This question combines two standard ideas: treating identical items that must be together as a single block, and using subtraction to enforce a 'not together' condition. The same block method can be used for both the required grouping and the forbidden grouping.
Common Mistakes
A common mistake is to forget to divide by for the identical red books in the subtraction term, or to treat the blue block as 3 separate units. Another common mistake is to subtract only the arrangements with the yellows together but forget that the blue block must still be together.
Things to Be Careful About
When the blue books are together, they form one unit, not three. When subtracting the case where the yellows are together, the yellow pair also forms one unit, so the number of units decreases by one again. Be careful to divide by the correct factorials in each term.
How many different colour arrangements are there of the 10 books with exactly 4 books between the 2 yellow books?
Approach
Fix the two yellow books so that exactly 4 books lie between them. In a row of 10 positions, the yellow books must occupy positions that are 5 apart. There are 5 such pairs of positions. Then arrange the remaining 8 books in the remaining 8 positions.
Working
The valid position pairs for the yellow books are , , , and , so there are
pairs.
The remaining 8 books are 3 blue, 2 red, 1 orange, 1 purple and 1 green. Their arrangements are
Therefore the total number of arrangements is
Answer
16800
Walkthrough
We need exactly 4 books between the two yellow books. If the first yellow is in position , the second must be in position . Since positions run from 1 to 10, can be 1, 2, 3, 4 or 5, giving 5 possible pairs. For each fixed pair of yellow positions, the other 8 positions are filled with the remaining colours: 3 blue, 2 red, and one each of orange, purple and green. These have colour arrangements because the blues and reds are repeated. Multiply by the 5 choices of yellow positions.
Key Takeaways
This question uses the idea of fixing positions of a repeated pair before arranging the remaining items. The number of valid pairs is found from the required gap, and the remaining arrangements use the multinomial formula.
Common Mistakes
A common mistake is to think there are more than 5 possible position pairs, or to forget to divide by and when arranging the remaining colours. Another mistake is to arrange the yellow books as if they were distinct, which would double the count.
Things to Be Careful About
The two yellow books are identical in a colour arrangement, so choosing positions is the same as ; the list of 5 pairs already accounts for this. Also, the remaining books include repeated colours, so use factorials for the repeats.
Alissa selects 4 books from her 10 different books from the series Squares and Circles.
Find the number of different selections if the 4 books include at least 1 red book, at most 1 blue book and exactly 1 yellow book.
Approach
Exactly one yellow book must be chosen, giving choices. The remaining 3 books must come from 3 blue, 2 red and 3 other books, with at least 1 red and at most 1 blue. Split into cases according to the number of red and blue books chosen, then sum the cases.
Working
Let the number of red books chosen be 1 or 2, and the number of blue books chosen be 0 or 1.
Case 1: 1 red, 0 blue.
Choose 1 of 2 red and 2 of 3 other books:
With the yellow book: .
Case 2: 2 red, 0 blue.
Choose 2 of 2 red and 1 of 3 other books:
With the yellow book: .
Case 3: 1 red, 1 blue.
Choose 1 of 2 red, 1 of 3 blue and 1 of 3 other books:
With the yellow book: .
Case 4: 2 red, 1 blue.
Choose 2 of 2 red and 1 of 3 blue:
With the yellow book: .
Total selections:
Answer
60
Walkthrough
We are selecting 4 books, not arranging them, so order does not matter and we use combinations. The condition 'exactly 1 yellow' fixes one of the two yellow books. The remaining three selections must satisfy the red and blue conditions. Because the numbers are small, split into cases by how many red and blue books are chosen. For each case, multiply the number of ways to choose from each colour group. Finally, sum the cases and multiply by 2 for the yellow choice.
Key Takeaways
This question tests systematic casework in combination problems. The key skill is to identify all possible (red, blue) counts that satisfy the restrictions and then use the multiplication principle within each case.
Common Mistakes
A common mistake is to forget to multiply by 2 for the yellow book, or to count the two red books as distinct when they are identical in a selection (though here choosing 1 of 2 red is still ). Another mistake is to miss one of the four cases, such as the case with 2 red and 1 blue.
Things to Be Careful About
The condition 'at most 1 blue' allows 0 or 1 blue, and 'at least 1 red' allows 1 or 2 red. The three 'other' books are all different colours, so choosing from them uses or as appropriate. Make sure the total number of books selected in each case is 4 including the yellow book.