Mathematics 9709/51 — October/November 2023
Cambridge AS Level · Probability & Statistics 1 · worked solutions for every part, with the mark scheme
Topics Representation of Data · Discrete Random Variables · The Normal Distribution · Probability · Permutations and Combinations
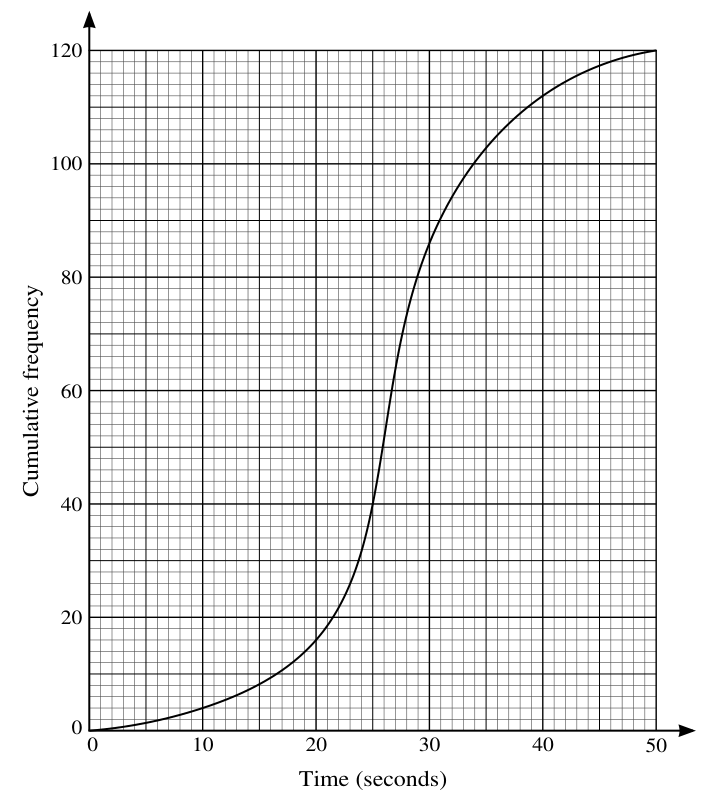
The times taken by 120 children to complete a particular puzzle are represented in the cumulative frequency graph.
Use the graph to estimate the interquartile range of the data.
Approach
The interquartile range (IQR) is defined as the difference between the upper quartile (UQ) and the lower quartile (LQ). For a dataset of 120 values, the lower quartile corresponds to cumulative frequency and the upper quartile corresponds to cumulative frequency . Read the time values at these cumulative frequencies from the graph and subtract.
Working
The lower quartile is at cumulative frequency:
From the graph, at cumulative frequency 30, the corresponding time is approximately seconds. Thus .
The upper quartile is at cumulative frequency:
From the graph, at cumulative frequency 90, the corresponding time is approximately seconds. Thus .
The interquartile range is:
Acceptable reading range: .
Answer
7.3
Walkthrough
The interquartile range measures the spread of the middle 50% of the data. To find it from a cumulative frequency graph, we first identify the cumulative frequencies that correspond to the lower and upper quartiles.
Step 1: Find the quartile cumulative frequencies.
For data points:
- The lower quartile (LQ) is the value below which 25% of the data falls, so we look at cumulative frequency .
- The upper quartile (UQ) is the value below which 75% of the data falls, so we look at cumulative frequency .
Step 2: Read the time values from the graph.
- At cumulative frequency 30, draw a horizontal line to the curve and then drop a vertical line to the x-axis. This gives seconds.
- At cumulative frequency 90, draw a horizontal line to the curve and then drop a vertical line to the x-axis. This gives seconds.
Step 3: Calculate the IQR.
Subtract the lower quartile from the upper quartile: seconds.
Key Takeaways
- For a cumulative frequency graph with total frequency , the lower quartile is read at cumulative frequency and the upper quartile at .
- The interquartile range is always , representing the spread of the middle half of the data.
- Reading values from a cumulative frequency graph requires drawing horizontal lines from the y-axis to the curve and vertical lines down to the x-axis.
Common Mistakes
- Using the wrong cumulative frequency for the quartiles (e.g., using 60 for the lower quartile instead of 30).
- Forgetting to show evidence of reading from the graph — the mark scheme requires visible graph use.
- Subtracting in the wrong order (LQ from UQ instead of UQ from LQ), giving a negative result.
Things to Be Careful About
- Reading values from the graph is inherently approximate. The mark scheme allows , with UQ between 30.5 and 31.25 and LQ between 23.25 and 24. Ensure your readings are consistent with the graph's scale.
- The minor grid lines on the x-axis are every 2 units and on the y-axis every 4 units, so read values carefully to avoid misreading.
- Always show the working: write down the quartile cumulative frequencies and the subtraction step, even if the final answer is within the acceptable range.
35% of the children took longer than seconds to complete the puzzle.
Use the graph to estimate the value of .
Approach
If 35% of children took longer than seconds, then 65% of children took seconds or less. Calculate 65% of the total frequency (120) to find the cumulative frequency corresponding to , then read the time value from the graph.
Working
The cumulative frequency corresponding to is:
From the graph, at cumulative frequency 78, draw a horizontal line to the curve and drop a vertical line to the x-axis. This gives:
Acceptable reading range: .
Answer
28.5
Walkthrough
Step 1: Understand the percentage relationship.
The question states that 35% of children took longer than seconds. This means the remaining 65% took seconds or less. Since a cumulative frequency graph shows the number of values less than or equal to a given value, we need the cumulative frequency for 65% of the total.
Step 2: Calculate the target cumulative frequency.
This means 78 children took 28.5 seconds or less.
Step 3: Read the value from the graph.
Locate cumulative frequency 78 on the y-axis. Draw a horizontal line to the right until it meets the curve. From that intersection point, draw a vertical line down to the x-axis. The x-axis value at this point is approximately seconds.
Key Takeaways
- When a percentage of data is above a value, subtract from 100% to find the percentage below or equal to that value.
- Cumulative frequency graphs directly give the number of observations below a given value, making them ideal for finding percentiles and estimating values from percentages.
Common Mistakes
- Using 35% instead of 65% to find the cumulative frequency, reading the graph at 42 instead of 78.
- Misreading the cumulative frequency on the y-axis — the minor grid lines are every 4 units, so 78 is between 76 and 80.
Things to Be Careful About
- The mark scheme accepts , so readings between 28.1 and 28.9 are all valid. Be precise when reading from the graph.
- Ensure you interpret "longer than " correctly: this is the upper tail, so the cumulative frequency is , not 35%.
The rest of this paper
5 more questions- Q2Discrete Random Variables7M
- Q3The Normal Distribution11M
- Q4Representation of Data9M
- Q5Discrete Random Variables · Probability9M
- Q6Permutations and Combinations10M