Mathematics 9709/63 — October/November 2013
Cambridge AS Level · Probability & Statistics 1 · worked solutions for every part, with the mark scheme
7
questions
50
marks
75
minutes
Topics Discrete Random Variables · Representation of Data · The Normal Distribution · Permutations and Combinations · Probability
Q12MRepresentation of DataFree sample
The distance of a student’s home from college, correct to the nearest kilometre, was recorded for each of 55 students. The distances are summarised in the following table.
| Distance from college (km) | 1 – 3 | 4 – 5 | 6 – 8 | 9 – 11 | 12 – 16 |
|---|---|---|---|---|---|
| Number of students | 18 | 13 | 8 | 12 | 4 |
Dominic is asked to draw a histogram to illustrate the data. Dominic’s diagram is shown below.
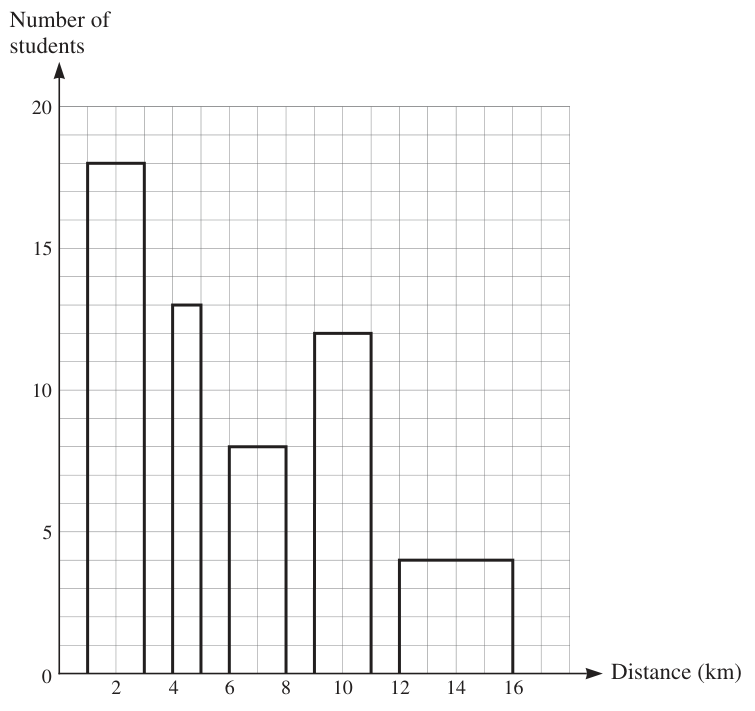
Give two reasons why this is not a correct histogram.
The rest of this paper
6 more questions- Q2The Normal Distribution · Discrete Random Variables5M
- Q3Discrete Random Variables6M
- Q4Representation of Data7M
- Q5The Normal Distribution7M
- Q6Permutations and Combinations10M
- Q7Probability · Discrete Random Variables13M
Loading the full paper…