Mathematics 9709/53 — May/June 2025
Cambridge A-Level · Probability & Statistics 1 · worked solutions for every part, with the mark scheme
Topics Probability · Representation of Data · Discrete Random Variables · The Normal Distribution · Permutations and Combinations
For a set of 40 values of , it is found that
where is a constant.
Approach
The mean of the 40 values is 124.0, so the total . Then use the given and the identity to solve for .
Working
Given:
But:
So:
Answer
k = 103.1
Walkthrough
First, recall that the mean of a set of values is the total divided by the number of values. Since the mean of the 40 values is 124.0, the total .
Next, look at the given sum . When you expand this sum, you get because subtracting from each of the 40 values subtracts in total. We are told this equals 836.0.
So we have the equation . Rearranging gives , so .
Key Takeaways
- The mean .
- is a useful identity when data is coded by subtracting a constant.
- The mean of the coded values is the original mean minus .
Common Mistakes
- Forgetting to multiply the mean by 40 to get the total.
- Sign errors when rearranging (e.g., writing ).
- Not showing the intermediate equation; the mark scheme requires the equation (or equivalent) for the first mark.
Things to Be Careful About
- The mark scheme accepts several equivalent forms: or , so any correct rearrangement is fine.
- The final answer should be given as a decimal, .
Approach
Subtracting a constant from every value does not change the variance. So the variance of equals the variance of . Use the coded-data formula:
Then take the square root to get the standard deviation.
Working
Mean of the coded values:
Variance:
Standard deviation:
Answer
14.1 (14.08758... to at least 3 SF)
Walkthrough
The key idea is that adding or subtracting a constant from every data value does not change the spread of the data. So the variance (and standard deviation) of is the same as the variance of .
We have the coded sums and . The variance formula for a set of values is . Here and .
First find the mean of the coded values: .
Then:
The standard deviation is the square root of the variance:
An alternative method is to first expand to find , then use . Both give the same result.
Key Takeaways
- Variance is invariant under adding or subtracting a constant: .
- The variance formula works with coded data.
- Standard deviation is the positive square root of the variance.
Common Mistakes
- Using instead of its square in the variance formula — you must subtract the square of the mean of the coded values.
- Forgetting to take the square root at the end.
- Confusing variance with standard deviation.
Things to Be Careful About
- The mark scheme requires the answer to at least 3 significant figures: 14.08758... so 14.1 is correct.
- If you use Method 2, make sure the expansion of is correct: .
- The standard deviation is positive; never give a negative value.
At a large college, all students who study Science also study exactly one of Art or Drama or Music. 20% of these students study Art, 45% study Drama and 35% study Music.
3 students are selected at random from the students who study Science.
Find the probability that at least 1 of these students studies Drama.
Approach
Let be the number of Science students studying Drama in a sample of 3. Since the college is large, the selections can be treated as independent, so . The event "at least 1" is the complement of "no Drama".
Working
As an exact fraction:
Answer
0.834 (or 6669/8000)
Walkthrough
We first identify from the stem that 45% of Science students study Drama, so . With 3 students selected at random from a large college, each selection is independent and has the same probability, so the number of Drama students follows a binomial distribution: .
The phrase "at least 1" means or . Rather than adding three binomial probabilities, it is easier to use the complement: find the probability that none of the 3 students studies Drama, then subtract from 1. The probability a student does not study Drama is , so . Therefore .
Key Takeaways
- For "at least one" events, the complement rule is usually the quickest method.
- A large population means the probability stays constant and selections are independent, so a binomial model can be used.
- Convert percentages to decimals before multiplying.
Common Mistakes
- Giving as the answer; that is the probability that all 3 study Drama, not at least 1.
- Forgetting to subtract from 1 after computing .
- Treating "at least 1" as exactly 1.
Things to Be Careful About
- Use for the probability of no Drama.
- The mark scheme accepts the exact fraction or the rounded value 0.834. Do not round intermediate values too early.
10 students are selected at random from the students who study Science.
Find the probability that more than 7 study Art or Music.
Approach
Let be the number of students studying Art or Music among the 10 selected. Since Art and Music are mutually exclusive, , so . The event "more than 7" means or .
Working
Answer
0.0996
Walkthrough
From the stem, the probability that a Science student studies Art is 0.20 and the probability that one studies Music is 0.35. These categories are mutually exclusive, so the probability of studying Art or Music is .
Let be the number of students who study Art or Music in a random sample of 10. Because the college is large, follows a binomial distribution: .
The event "more than 7" includes , and . We use the binomial formula
for , and add the three results because the outcomes are mutually exclusive.
Key Takeaways
- Mutually exclusive categories can be combined by adding their probabilities.
- "More than 7" means 8, 9 and 10, not 7.
- The binomial formula is applied to each favourable value of and the results are summed.
Common Mistakes
- Using (Drama) instead of (Art or Music).
- Including in the sum; "more than 7" means .
- Forgetting the binomial coefficient .
- Rounding each term too early, which can move the final answer outside the accepted range.
Things to Be Careful About
- For , the binomial coefficient is 1, so the term is simply .
- The accepted final answer is 0.0996, or any value in the range .
- Keep enough decimal places in intermediate terms to avoid losing accuracy.
A fair six-sided dice with faces labelled 1, 2, 3, 4, 5, 6 is thrown repeatedly until a 3 is obtained. The number of throws taken is denoted by the random variable .
Approach
Since is the number of throws until the first 3, follows the geometric distribution with success probability . For , the first 7 throws must be failures and the 8th throw must be a success.
Working
The probability of not getting a 3 on a throw is , so
Evaluating,
Answer
0.0465 (78125/1679616)
Walkthrough
is the number of throws until a 3 first appears. Since the die is fair, and . For , the first seven throws must all be non-3s and the eighth throw must be a 3. The probability of seven independent failures is , and we multiply by for the final success. This gives the geometric formula .
Key Takeaways
- The number of trials until the first success follows a geometric distribution.
- For a geometric distribution, .
- The success must occur on the last of the throws, so the exponent on is .
Common Mistakes
- Writing instead of .
- Using the wrong exponent on .
- Not showing the calculation, which can lose the method mark.
Things to Be Careful About
- means seven failures followed by one success.
- The answer may be given as a fraction or a decimal; is accepted.
- Each throw is independent, so probabilities multiply.
Approach
means the first 3 is obtained on one of throws 1 to 8. It is easier to use the complement: fails only if no 3 appears in the first 8 throws.
Working
The probability of no 3 in 8 throws is , so
Evaluating,
Answer
0.767
Walkthrough
means the first success occurs on throw 1, 2, ..., or 8. The direct method would sum eight geometric probabilities. The quicker method is to notice that the event fails only if no 3 appears in the first 8 throws. The probability of no 3 in 8 independent throws is . Therefore .
Key Takeaways
- Complements often simplify geometric sums.
- .
- Check whether the inequality is strict or inclusive.
Common Mistakes
- Writing ; that gives the probability of no success in 8 throws, not the required probability.
- Using the exponent 9 instead of 8.
- Omitting the step and losing the method mark.
Things to Be Careful About
- includes through , not .
- The answer should be 0.767 (AWRT).
- Show the complement method clearly to earn the M1 mark.
Approach
We need the second 3 to occur before the 6th throw, so it must occur on throw 2, 3, 4 or 5. For each such throw , there must be exactly one 3 in the first throws and a 3 on the th throw.
Working
For a fixed , the probability is
The first 3 can be placed in any of the first positions.
These cases are mutually exclusive, so add them:
Using denominator 7776,
Answer
0.196 (763/3888)
Walkthrough
We need the second 3 to occur before the 6th throw, so it must occur on throw 2, 3, 4 or 5. For each possible throw , the second 3 is on throw , so exactly one 3 appears among the first throws and the th throw is a 3. The earlier 3 can be placed in positions. Thus the probability for a given is . These four events are mutually exclusive, so adding them gives the required probability.
An alternative is to use the complement: the second 3 is not before the 6th throw if, in the first 5 throws, there are 0 or 1 threes. So
Key Takeaways
- When a fixed number of successes must occur by a certain number, split the cases by the trial on which the last required success occurs.
- Use a binomial coefficient to count which of the earlier trials contains the previous success.
- Mutually exclusive events can be summed.
Common Mistakes
- Interpreting 'before the 6th throw' as the second 3 occurring on throw 6.
- Forgetting the binomial coefficient that places the first 3.
- Using instead of , since there are exactly two successes and failures in throws.
- Not adding all four cases.
Things to Be Careful About
- The second 3 cannot occur on throw 1, so the smallest possible case is .
- In the complement method, subtract both 'no 3 in 5 throws' and 'exactly one 3 in 5 throws'.
- The mark scheme accepts answers in the range ; the exact fraction is .
- If using the complement method, remember the factor for the position of the single 3.
84 people attempt a particular puzzle. The times taken, in minutes, to complete the puzzle are recorded. These times are represented in the cumulative frequency graph below.
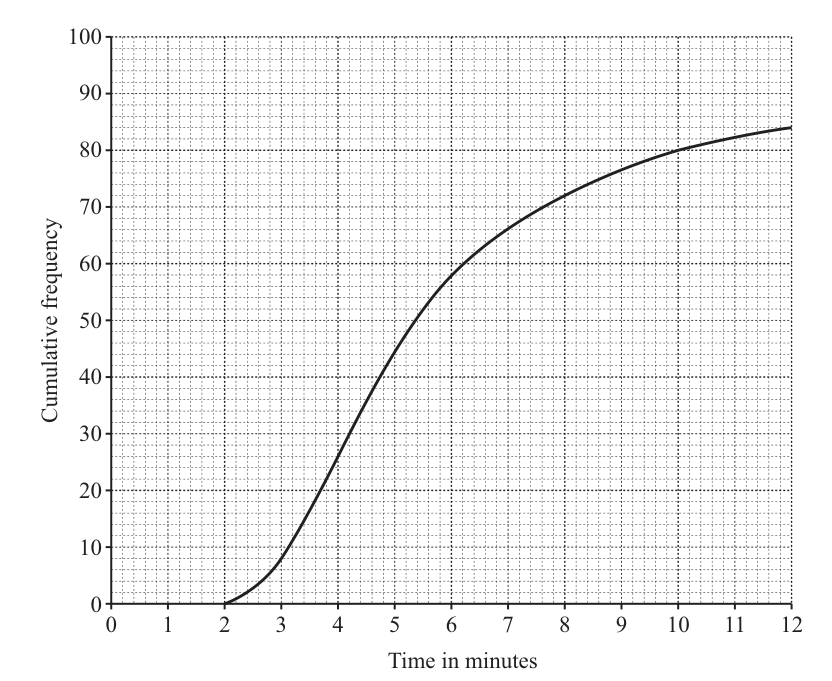
Use the graph to estimate how many people took between 4 and 7.5 minutes to complete the puzzle.
Approach
Read the cumulative frequency values at and minutes from the graph, then subtract the value at 4 from the value at 7.5 to find the number of people in that interval.
Working
From the cumulative frequency graph:
- At minutes, the cumulative frequency is approximately .
- At minutes, the cumulative frequency is approximately to .
The number of people who took between 4 and 7.5 minutes is:
or
Answer
43 or 44
43 or 44
Walkthrough
The question asks for the number of people who completed the puzzle between 4 and 7.5 minutes. On a cumulative frequency graph, the value on the y-axis at a given x-value represents the total number of people who completed the puzzle in that time or less. To find the number of people in a specific interval , we read the cumulative frequency at and subtract the cumulative frequency at . Reading from the graph, at , the cumulative frequency is about 25. At , it is about 68 or 69. Subtracting 25 from these values gives 43 or 44.
Key Takeaways
Cumulative frequency graphs allow us to estimate the number of observations within any time interval by finding the difference in cumulative frequencies at the interval endpoints.
Common Mistakes
- Reading the wrong axis values.
- Forgetting to subtract the lower cumulative frequency from the higher one.
- Accepting answers outside the reasonable range (43 or 44) due to poor graph reading.
Things to Be Careful About
Always ensure you are reading the cumulative frequency (y-axis) for the given time values (x-axis). Small variations in reading the graph are expected, so answers like 43 or 44 are both acceptable.
On the grid below, draw a box-and-whisker plot to summarise the information in the cumulative frequency graph.
Approach
Determine the five-number summary (minimum, lower quartile, median, upper quartile, maximum) from the cumulative frequency graph. The total number of people is 84, so the median is at cumulative frequency 42, the lower quartile at 21, and the upper quartile at 63. Read the corresponding time values from the graph. Then, draw a box-and-whisker plot on the grid using a linear scale.
Working
- Total frequency .
- Minimum value: The curve starts at minutes.
- Maximum value: The curve ends at minutes.
- Median corresponds to cumulative frequency . Reading from the graph, minutes.
- Lower quartile (LQ) corresponds to cumulative frequency . Reading from the graph, or minutes.
- Upper quartile (UQ) corresponds to cumulative frequency . Reading from the graph, or minutes.
Draw the box-and-whisker plot on the grid:
- Use a linear scale from 2 to 12 on the horizontal axis.
- Label the axis "Time in minutes".
- Draw the left whisker from 2 to the LQ ().
- Draw the box from the LQ () to the UQ ().
- Draw a vertical line inside the box at the median ().
- Draw the right whisker from the UQ () to 12.
Answer
Box-and-whisker plot with min , LQ , median , UQ , max
Min=2, LQ≈3.8, Median≈4.8, UQ≈6.6, Max=12
Walkthrough
A box-and-whisker plot summarises data using five key values: minimum, lower quartile (LQ), median, upper quartile (UQ), and maximum. These can be read from a cumulative frequency graph.
- Minimum and Maximum: The graph starts at (CF=0) and ends at (CF=84), so the minimum is 2 and maximum is 12.
- Median: Half of 84 is 42. Find 42 on the y-axis, move horizontally to the curve, then down to the x-axis to get .
- Lower Quartile: One quarter of 84 is 21. Find 21 on the y-axis, move to the curve, then down to get or .
- Upper Quartile: Three quarters of 84 is 63. Find 63 on the y-axis, move to the curve, then down to get or .
Finally, draw these on the grid with a linear scale, ensuring the axis is labelled and whiskers are drawn correctly (not through the box).
Key Takeaways
Box-and-whisker plots provide a visual summary of the spread and central tendency of data. The five-number summary is directly readable from cumulative frequency graphs.
Common Mistakes
- Using a non-linear scale for the box-and-whisker plot.
- Drawing whiskers through the box or at the corners.
- Forgetting to label the axis with units ("Time in minutes").
- Incorrect quartile positions (e.g., using and incorrectly).
Things to Be Careful About
Ensure the scale is linear and covers at least the range from 2 to 12. The whiskers should extend from the minimum to the LQ and from the UQ to the maximum, without passing through the box. Acceptable variations in reading the graph (e.g., LQ=3.7 or 3.8) are allowed.
Bag contains 6 red marbles, 5 blue marbles and 1 green marble.
Bag contains 5 red marbles and 3 blue marbles.
A marble is chosen at random from bag and placed in bag .
A marble is now chosen at random from bag .
Draw a tree diagram to represent this information, giving the probability on each branch.
Approach
Draw a two-stage tree diagram. The first stage represents the marble chosen from Bag A (6 red, 5 blue, 1 green out of 12). The second stage represents the marble chosen from Bag B after the first marble has been added, making 9 marbles total. The composition of Bag B depends on which marble was transferred.
Working
First stage — Bag A selection (12 marbles):
Second stage — Bag B selection (9 marbles):
Bag B originally contains 5 red and 3 blue marbles (8 total). After adding one marble from Bag A, it contains 9 marbles.
-
If a red marble is transferred from A: Bag B now has 6 red and 3 blue.
-
If a blue marble is transferred from A: Bag B now has 5 red and 4 blue.
-
If a green marble is transferred from A: Bag B now has 5 red, 3 blue, and 1 green.
Answer
The tree diagram has first-stage branches R (), B (), G (), with second-stage branches as calculated above.
Tree diagram with first stage probabilities 6/12, 5/12, 1/12 and second stage probabilities 6/9, 3/9 (from R); 5/9, 4/9 (from B); 5/9, 3/9, 1/9 (from G).
Walkthrough
We model this two-step process using a probability tree diagram. The first node splits into three branches representing the marble drawn from Bag A: red (R), blue (B), or green (G). Since Bag A has 12 marbles total (6 red, 5 blue, 1 green), the branch probabilities are , , and .
After the first marble is transferred to Bag B, the second draw is from Bag B, which now contains 9 marbles. The composition of Bag B depends on what was added:
- Adding a red marble gives Bag B: 6 red, 3 blue (9 total). The probabilities for the second draw are for red and for blue.
- Adding a blue marble gives Bag B: 5 red, 4 blue (9 total). The probabilities are for red and for blue.
- Adding a green marble gives Bag B: 5 red, 3 blue, 1 green (9 total). The probabilities are for red, for blue, and for green.
Each branch of the tree is labelled with the corresponding probability. The tree diagram captures all possible outcomes and their probabilities.
Key Takeaways
- A probability tree diagram is a visual tool for representing sequential random events.
- At each stage, the probabilities on the branches must sum to 1.
- Conditional probabilities at the second stage depend on the outcome of the first stage, because the composition of the second bag changes.
Common Mistakes
- Forgetting to update the contents of Bag B before calculating second-stage probabilities.
- Writing the second-stage probabilities as if Bag B still has 8 marbles instead of 9.
- Omitting the green branch from Bag B when a green marble is transferred (probability ).
Things to Be Careful About
- The first set of branches must always represent Bag A, as that is the first event in the sequence.
- Branches with zero probability (e.g., drawing green from Bag B when no green was added) may be omitted or shown with probability 0, but additional branches beyond R, B, G lose the mark.
- Always verify that probabilities on branches from each node sum to 1.
Approach
Both marbles are the same colour if they are both red (RR), both blue (BB), or both green (GG). These three outcomes are mutually exclusive, so we use the multiplication law along each path of the tree diagram and then apply the addition law to sum the probabilities.
Working
Since RR, BB, and GG are mutually exclusive:
Simplifying:
Answer
19/36
Walkthrough
We want the probability that both marbles chosen are the same colour. Looking at the tree diagram, there are exactly three paths that give matching colours:
-
Both red (RR): Draw red from Bag A (), then draw red from Bag B (). Probability = .
-
Both blue (BB): Draw blue from Bag A (), then draw blue from Bag B (). Probability = .
-
Both green (GG): Draw green from Bag A (), then draw green from Bag B (). Probability = .
These three events cannot happen simultaneously, so they are mutually exclusive. We add their probabilities:
Key Takeaways
- The multiplication law gives the probability of a specific sequence of events (following a path on the tree).
- The addition law is used to combine probabilities of mutually exclusive outcomes.
- Always check which paths on the tree correspond to the desired event.
Common Mistakes
- Forgetting the GG path (it is easy to overlook since the green marble is rare).
- Using the wrong denominator for the second stage (should be 9, not 8).
- Not simplifying the final fraction.
Things to Be Careful About
- Ensure all three same-colour combinations (RR, BB, GG) are included.
- The working must show the full expression to earn the method mark.
Find the probability that the marble chosen from bag is blue, given that the marble chosen from bag is blue.
Approach
We need . By the conditional probability formula:
The numerator is , which we already found in part (b). The denominator is found by summing the probabilities of all paths where the marble drawn from Bag B is blue.
Working
Numerator:
Denominator — :
The marble from Bag B can be blue in three scenarios:
- Red from A, then blue from B:
- Blue from A, then blue from B:
- Green from A, then blue from B:
Conditional probability:
Answer
20/41
Walkthrough
We are asked for the probability that the marble from Bag A is blue, given that the marble from Bag B is blue. This is a conditional probability problem.
The conditional probability formula is:
Here, is the event 'marble from Bag A is blue' and is the event 'marble from Bag B is blue'.
Numerator : This is the probability that both marbles are blue, i.e., path BB on the tree:
Denominator : We need the total probability that the marble from Bag B is blue, regardless of what was drawn from Bag A. There are three paths that lead to blue from Bag B:
- Red from A, then blue from B:
- Blue from A, then blue from B:
- Green from A, then blue from B:
Summing these:
Final calculation:
Key Takeaways
- Conditional probability requires identifying the intersection event (numerator) and the conditioning event (denominator).
- The denominator is often found using the law of total probability by summing over all paths that lead to the conditioning event.
- Fractions with the same denominator simplify cleanly.
Common Mistakes
- Using only one path in the denominator instead of summing all paths where Bag B gives blue.
- Forgetting that the green-from-A path also contributes to blue-from-B ().
- Dividing incorrectly or not cancelling the common denominator.
Things to Be Careful About
- The mark scheme awards a method mark for showing the numerator as (or ) and a separate mark for the correct denominator expression. Both must be shown clearly.
- Acceptable decimal answers are 0.488 or 0.4878, but the exact fraction is preferred.
A company sells bags of pasta. The masses of large bags of pasta are normally distributed with mean 2.50 kg and standard deviation 0.12 kg.
Find the probability that the mass of pasta in a randomly chosen large bag is less than 2.65 kg.
Approach
Let be the mass of a large bag of pasta, so . Standardise the required mass using , then read the cumulative probability from the standard normal table.
Working
Therefore,
From the standard normal table,
Answer
0.894
Walkthrough
We are told that large bags of pasta have masses that are normally distributed with mean kg and standard deviation kg. To find the probability that a randomly chosen bag has mass less than kg, we convert to a standard normal -score. The -score tells us how many standard deviations is above the mean. Here , and dividing by gives . We then look up in the standard normal table, obtaining . This is the required probability.
Key Takeaways
The key idea is that any normal distribution can be converted to the standard normal distribution using . Once converted, probabilities are read from the standard normal table. Always subtract the mean before dividing by the standard deviation.
Common Mistakes
- Forgetting to subtract the mean before dividing by the standard deviation.
- Using the wrong tail of the distribution. Here we need the probability less than , so we use the cumulative probability from the left.
- Reading the standard normal table incorrectly for .
Things to Be Careful About
The standard deviation is kg, not the variance. The mark scheme allows some flexibility with or in part (a), but it is safest to use the given standard deviation directly. No continuity correction is needed because the variable is continuous.
A restaurant manager buys 160 of these large bags of pasta.
Find the number of bags for which you would expect the mass of pasta to be more than 1.65 standard deviations above the mean.
Approach
A mass more than standard deviations above the mean is kg. Standardise this value to find the probability that a randomly chosen bag is more than this mass, then multiply by to find the expected number of bags.
Working
The threshold is
Standardise:
Therefore,
From the standard normal table, , so
The expected number of bags out of is
Since the expected number is , the whole-number answer is or ; the single integer answer is .
Answer
8
Walkthrough
We first translate “more than standard deviations above the mean” into a concrete mass: kg. Standardising this mass gives , so the required probability is . The standard normal table gives the left-tail probability , so the right-tail probability is . This is the probability that one randomly chosen large bag is more than standard deviations above the mean. For bags, the expected number is . Since the question asks for a number of bags, we give a whole-number answer; the exact expected value is , so the integer answer is (the mark scheme also allows or ).
Key Takeaways
- “ standard deviations above the mean” means the mass .
- For a sample of items, the expected number with a given property is , where is the probability for one item.
Common Mistakes
- Interpreting as a mass instead of a -score, or adding to the mean without multiplying by the standard deviation.
- Forgetting to subtract the left-tail probability from when finding .
- Giving the final answer as when the question asks for a number of bags; the mark scheme requires a whole-number answer.
Things to Be Careful
- Use the standard deviation , not or .
- No continuity correction is used because this is a normal distribution calculation.
- When following through from a calculated probability, use at least 4 decimal places before multiplying by .
The masses of small bags of pasta sold by the company are normally distributed with mean kg and standard deviation kg. Tests show that 77% of these bags have masses greater than 1.26 kg, and 44% have masses less than 1.35 kg.
Find, in either order, the value of and the value of .
Approach
Let be the mass of a small bag, so . Use the two given percentages to obtain two probabilities, convert them into -scores, and then solve the two standardisation equations for and .
Working
Since of bags have mass greater than kg, have mass less than kg:
The -score for a left-tail probability of is
So
Since of bags have mass less than kg:
The -score for a left-tail probability of is
So
Rearrange both equations:
Equate the two expressions for :
Then
Answer
mu = 1.37, sigma = 0.153
Walkthrough
We need to find and from two percentage conditions. First, of bags have mass greater than kg, so have mass less than kg. The standard normal table tells us that a left-tail probability of corresponds to . Thus . Similarly, of bags have mass less than kg, and the corresponding -value is , giving . These are two linear equations in and . Rearrange each to and , equate them, and solve for . Then substitute back to find . The answers are kg and kg.
Key Takeaways
- Percentages in normal distribution questions must be converted to probabilities before looking up -values.
- The inverse normal table gives a -value for a given cumulative probability.
- Two conditions on a normal distribution produce two equations in and , which can be solved simultaneously.
Common Mistakes
- Using the percentages , , directly as -values instead of looking up the inverse normal values.
- Mixing up the tail direction. For greater than , we use less than .
- Using the wrong sign for the -values; both -values here are negative.
- Making an algebraic error when rearranging the standardisation equations.
Things to Be Careful
- Use , not or , in the standardisation formula.
- The mark scheme allows between and , and between and .
- The final values are and (AWRT).
A set of friends consists of 7 men and 4 women. Three of the men are brothers: Ali, Ben and Charlie.
Find the number of different arrangements of the 7 men in a line in which Ali and Ben do not stand next to each other.
Approach
Count the total number of arrangements of the 7 men, then subtract the arrangements in which Ali and Ben are next to each other by treating them as a single block.
Working
Total arrangements of 7 men:
Treat Ali and Ben as one block. Together with the other 5 men, there are 6 objects to arrange:
Ali and Ben can be arranged inside the block in ways, so the number with Ali and Ben together is:
Therefore the number with Ali and Ben not next to each other is:
Answer
3600
Walkthrough
The phrase "not stand next to each other" suggests counting the complement. First count all arrangements of 7 distinct men: . Then count the arrangements where Ali and Ben are together. To do this, glue Ali and Ben into one block, so there are 6 objects (the block plus the other 5 men), giving arrangements. Inside the block Ali and Ben can be in either order, so multiply by . Subtract this from the total to leave exactly the arrangements where they are not adjacent.
Key Takeaways
This question uses the "total minus unwanted" technique for restrictions. When two people must be together, treat them as a single block and multiply by the internal arrangements.
Common Mistakes
Forgetting to multiply by for the order of Ali and Ben inside the block. Alternatively, forgetting to subtract from the total and just giving .
Things to Be Careful About
The block method counts arrangements where Ali and Ben are together. Since Ali and Ben are distinct, their internal order matters. The final answer must be an integer; no double-counting occurs because the cases "together" and "not together" are complementary.
Find the number of different arrangements of the 7 men and 4 women in a line in which all the men stand together and all the women stand together.
Approach
Group all 7 men into one block and all 4 women into another block. Arrange the two blocks, then arrange the men within their block and the women within theirs.
Working
Treat the 7 men as one block and the 4 women as one block. The two blocks can be arranged in:
ways. The men can be arranged internally in ways and the women in ways. Hence:
Answer
241920
Walkthrough
The condition "all the men stand together and all the women stand together" means we can think of the men as one block and the women as one block. First arrange the two blocks: the men's block could come before the women's block, or the women's block before the men's block, giving arrangements. Then arrange the 7 men inside their block in ways and the 4 women inside theirs in ways. Multiplying gives the total.
Key Takeaways
Blocking is the standard technique when a group of items must stay together. The order of the blocks and the internal order within each block must both be counted.
Common Mistakes
Forgetting to arrange the two blocks, or forgetting to arrange the people inside one of the blocks.
Things to Be Careful About
The blocks are distinct because one contains men and one contains women, so there is no division by . The answer is large: .
In how many ways can the 7 men and 4 women be divided into a group of 6, a group of 3 and a group of 2 if there are no restrictions?
Approach
Choose the group of 6 from the 11 people, then choose the group of 3 from the remaining 5 people; the last 2 form the final group automatically.
Working
Number of ways:
Evaluate:
So:
Answer
4620
Walkthrough
The groups have different sizes, so they are distinct: a group of 6, a group of 3 and a group of 2. Choose the 6 people for the first group from the 11: . From the remaining 5 choose the 3 for the second group: . The last 2 are forced. Multiplying gives the number of ways.
Key Takeaways
When dividing into groups of different sizes, choose groups sequentially; the groups are distinguished by their sizes, so no division by a factorial is needed.
Common Mistakes
Dividing by because the groups are labelled by size, or using permutations instead of combinations when order within a group does not matter.
Things to Be Careful About
The order of choosing the groups does not affect the count as long as the sizes are fixed. The final answer is .
The 7 men and 4 women are divided at random into a group of 6, a group of 3 and a group of 2.
Find the probability that Ali, Ben and Charlie are all in the same group.
Approach
Ali, Ben and Charlie can only be together in the group of 6 or the group of 3, since the group of 2 cannot contain all three. Count the favourable groupings for each case, add them, and divide by the total number of unrestricted groupings from part (c).
Working
Total unrestricted groupings from part (c):
Case 1: all three brothers are in the group of 6.
Choose the other 3 people for that group from the remaining 8:
Then split the remaining 5 people into a group of 3 and a group of 2:
So this case gives:
Case 2: all three brothers are in the group of 3.
Choose the 6 people for the group of 6 from the remaining 8:
The remaining 2 people form the group of 2, so this case gives:
Total favourable groupings:
Probability:
Answer
7/55
Walkthrough
We need the probability that Ali, Ben and Charlie are in the same group. The group sizes are 6, 3 and 2, so the three brothers cannot all be in the group of 2. They must therefore be together either in the group of 6 or in the group of 3.
For the group of 6: place Ali, Ben and Charlie in it, then choose the other 3 members from the remaining 8 people: . The remaining 5 people are then split into a group of 3 and a group of 2: . So this case gives favourable groupings.
For the group of 3: place the three brothers in it, then choose the 6 people for the group of 6 from the remaining 8: . The remaining 2 people automatically form the group of 2, giving 28 favourable groupings.
These two cases are mutually exclusive, so add them: . Divide by the total number of unrestricted groupings from part (c), , to get .
Key Takeaways
This question combines combinatorics and probability. Count favourable outcomes and divide by total outcomes. When outcomes fall into disjoint cases, add the counts.
Common Mistakes
Forgetting the case where the brothers are in the group of 3. Using the group of 2 as a possible case. Forgetting to divide by the total number of groupings from part (c).
Things to Be Careful About
The groups are distinguished by their sizes, so there is no division by . The total from part (c) is . The final probability can be left as or .