Mathematics 9709/53 — May/June 2024
Cambridge A-Level · Probability & Statistics 1 · worked solutions for every part, with the mark scheme
Topics Probability · Discrete Random Variables · The Normal Distribution · Representation of Data · Permutations and Combinations
The numbers on the faces of a fair six-sided dice are 1, 2, 2, 3, 3, 3. The random variable is the total score when the dice is rolled twice.
Approach
The dice has faces , so when it is rolled twice there are equally likely outcomes. For each possible total , count the ordered pairs of faces that give that total, then divide by 36.
Working
Count the outcomes for each total:
- : only , so outcome.
- : or , so outcomes.
- : , , , so outcomes.
- : or , so outcomes.
- : only , so outcomes.
The probability distribution is:
| 2 | 3 | 4 | 5 | 6 | |
|---|---|---|---|---|---|
Equivalently, in simplified form:
Answer
| 2 | 3 | 4 | 5 | 6 | |
|---|---|---|---|---|---|
P(X=2)=1/36, P(X=3)=1/9, P(X=4)=5/18, P(X=5)=1/3, P(X=6)=1/4
Walkthrough
We first note that the six faces are not all distinct: there is one 1, two 2s and three 3s. Rolling twice gives an ordered pair such as or , and there are such ordered pairs. To build the probability distribution, list every possible total from 2 to 6 and count the ordered pairs that produce it.
For example, can occur as , or . Since there are three 3s, two 2s and one 1, the number of ordered pairs is . Dividing by 36 gives . The same idea gives the other probabilities. These probabilities are then placed in a table with the corresponding values.
Key Takeaways
- A probability distribution table must list every possible value of a discrete random variable with its probability.
- When a dice has repeated faces, count ordered outcomes using the multiplicities of the faces.
- The probabilities in a distribution table must sum to 1.
Common Mistakes
- Treating the dice as having faces only, ignoring the repeated 2s and 3s.
- Forgetting that and are different ordered outcomes.
- Missing one of the possible totals, such as or .
Things to Be Careful About
- There are 36 ordered outcomes, not 25 or 12.
- The probabilities sum to 1: .
- The possible values of range from 2 to 6, not from 1 to 6.
Approach
Use the distribution table from part (a). Calculate and , then use
Working
From the table,
Next,
Therefore,
Since ,
Answer
10/9 or 1.11
Walkthrough
The variance is a measure of spread. For a discrete random variable, it is calculated using . First compute : each probability is a count over 36, so add times the count and divide by 36. This gives .
Next, for , square each value before multiplying by its probability. This gives . Finally, subtract the square of , which is , to obtain .
Key Takeaways
- The key formula is .
- is not the same as .
- When probabilities share a common denominator, it is often easier to work with the counts and divide by that denominator at the end.
Common Mistakes
- Forgetting to square the values when computing .
- Computing but then forgetting to subtract .
- Arithmetic errors when simplifying to and to .
Things to Be Careful About
- Use a common denominator of 9 when subtracting the fractions.
- The final answer can be written as , , or 1.11.
- If using decimals, keep enough significant figures to avoid rounding errors.
Approach
Use . Here is the event that is even and is the event that . From the table, means , and the even values in this range are and .
Working
Substitute the probabilities from the table:
Answer
19/31 or 0.613
Walkthrough
Conditional probability asks for the probability of one event given that another has already happened. Here, given , we only consider totals 4, 5 and 6. Their total probability is . Among these, the even totals are 4 and 6, with total probability . The conditional probability is therefore .
Key Takeaways
- Conditional probability restricts the sample space to the given condition.
- Use the formula .
- The probability distribution table allows the required probabilities to be read directly.
Common Mistakes
- Including or in the denominator, even though the condition is .
- Including in the numerator, since 5 is not even.
- Forgetting to divide by .
Things to Be Careful About
- The numerator is , not over the whole sample space.
- The denominator is .
- The fraction is already in simplest form, and its decimal form is 0.613 to 3 significant figures.
In a certain country, the heights of the adult population are normally distributed with mean and standard deviation .
Find the probability that an adult chosen at random from this country will have height greater than .
Approach
We standardise the height using the normal mean and standard deviation, obtain a -value, then use the standard normal table and its complement.
Working
Let be the height of a randomly chosen adult. Then .
Standardise the threshold :
So
From the standard normal table, . Therefore the required upper-tail probability is
Answer
The probability is .
0.123
Walkthrough
We begin with the normal model . To find a probability we convert the value into a standard normal -score: . Here . The table gives the area to the left of as . Because the question asks for height greater than , we need the area to the right, so we subtract this from , giving .
Key Takeaways
This question tests the standard method for finding probabilities from a normal distribution: standardise, use tables or a calculator for the cumulative probability, and interpret the direction of the inequality. The key skill is recognising when to use the complement.
Common Mistakes
- Reporting as the final answer instead of .
- Standardising wrongly, for example dividing by instead of .
- Forgetting that normal probabilities are continuous, so no continuity correction is used.
Things to Be Careful About
The table gives lower-tail probabilities . For an upper tail, always take . Use the appropriate after standardising, and denote the variance as , not the standard deviation, in the model.
In another country, the heights of the adult population are also normally distributed. of the adult population have height less than . of the adult population have height greater than .
Find the mean and the standard deviation of this distribution.
Approach
Use the information about the percentages to find the -values corresponding to the given cumulative probabilities. Then apply the standardisation formula to obtain two equations in and , and solve them simultaneously.
Working
Let the mean be and the standard deviation be .
Since of adults are shorter than , the lower-tail probability is , so the critical -value is negative:
Thus
Since of adults are taller than , the lower-tail probability is , so the critical -value is:
Thus
Rewrite the two equations:
or
Equate the two expressions for :
Then
Answer
The mean is and the standard deviation is .
mean = 1.68 m, standard deviation = 0.269 m
Walkthrough
This question gives normal distribution information in terms of percentages. For below , we need the -value with lower-tail probability ; from the standard normal table this is , negative because is below the unknown mean. For above , the standard normal table shows , so the -value is . The standardisation formula then gives two linear equations. Rearranging each to make the subject and equating them eliminates , giving . Substituting back gives .
Key Takeaways
This is a reverse normal distribution problem: instead of finding a probability from known mean and standard deviation, you use known probabilities and data values to solve for the unknown parameters. The crucial steps are accurate -value lookup, correct signs, and solving simultaneous equations.
Common Mistakes
- Using or as the -values directly instead of and .
- Giving the first -value as positive instead of negative because the value is below the mean.
- Forgetting to use the complement to turn above into a lower-tail probability of before looking up the table.
- Not showing the standardisation formula, which is required for method marks.
Things to Be Careful About
The standard normal percentage points are and , not the percentages and . Check the direction of each inequality. Units should be metres for both the mean and the standard deviation, though the standard deviation uses the same unit as the data. Rounding to and is accepted.
Box contains 6 green balls and 3 yellow balls.
Box contains 4 green balls and yellow balls.
A ball is chosen at random from box and placed in box . A ball is then chosen at random from box .
Draw a tree diagram to represent this information, showing the probability on each of the branches.
Approach
Construct a two-stage tree diagram. The first stage represents choosing a ball from Box A. The second stage represents choosing a ball from Box B after one ball has been transferred from Box A to Box B. Calculate the probability for each branch, noting that the contents of Box B change depending on the outcome of the first stage.
Working
Stage 1: Box A
Box A contains 6 green (G) and 3 yellow (Y) balls, total 9.
- Probability of choosing Green from Box A:
- Probability of choosing Yellow from Box A:
Stage 2: Box B
Box B initially contains 4 green (G) and yellow (Y) balls, total .
-
If Green was transferred from A to B:
Box B now contains green balls and yellow balls. Total balls = .- Probability of choosing Green from Box B:
- Probability of choosing Yellow from Box B:
-
If Yellow was transferred from A to B:
Box B now contains 4 green balls and yellow balls. Total balls = .- Probability of choosing Green from Box B:
- Probability of choosing Yellow from Box B:
Answer
The tree diagram has the following branches and probabilities:
- First stage: ,
- Second stage (from G): ,
- Second stage (from Y): ,
Tree diagram with branches: Box A: G(6/9), Y(3/9). Box B (after G): G(5/(5+x)), Y(x/(5+x)). Box B (after Y): G(4/(5+x)), Y((1+x)/(5+x)).
Walkthrough
The problem involves two sequential events: moving a ball from Box A to Box B, then choosing a ball from Box B. This is a classic setup for a probability tree diagram.
Step 1: First Stage (Box A)
Box A has 6 green and 3 yellow balls (total 9). The probabilities for the first branch are straightforward:
- Probability of Green ():
- Probability of Yellow ():
Step 2: Second Stage (Box B)
The contents of Box B change depending on which ball was moved from Box A. Box B originally has 4 green and yellow balls.
-
Case 1: Green ball moved from A to B
Box B now has green balls and yellow balls. Total = .- Probability of picking Green from B:
- Probability of picking Yellow from B:
-
Case 2: Yellow ball moved from A to B
Box B now has 4 green balls and yellow balls. Total = .- Probability of picking Green from B:
- Probability of picking Yellow from B:
Step 3: Drawing the Diagram
Draw two main branches for Box A outcomes. From each outcome, draw two sub-branches for Box B outcomes, labeling each with the calculated conditional probability.
Key Takeaways
- Probability tree diagrams are useful for sequential events where outcomes affect subsequent probabilities.
- Always update the total number of items and the number of specific items in the container after a transfer or removal.
- Probabilities on branches from the same node must sum to 1 (check: and ).
Common Mistakes
- Forgetting to update the total number of balls in Box B. The total becomes in both cases, not .
- Incorrectly counting the number of yellow balls in Box B after a yellow ball is added (it becomes , not ).
- Not labeling the final outcomes (GG, GY, YG, YY) clearly.
Things to Be Careful About
- Ensure all branches from a single node sum to 1.
- The variable appears in the denominators, so be careful with algebraic fractions in later parts.
- The diagram must clearly show the dependency between the stages.
The probability that both the balls chosen are the same colour is .
Find the value of .
Approach
The event 'both balls chosen are the same colour' can occur in two mutually exclusive ways:
- Green from Box A and Green from Box B (GG)
- Yellow from Box A and Yellow from Box B (YY)
Use the multiplication law along the tree branches to find the probability of each path, sum them, and equate to . Solve the resulting equation for .
Working
The probability of both balls being green (path G then G):
The probability of both balls being yellow (path Y then Y):
The probability that both balls are the same colour is :
Set this equal to :
Simplify the fractions and to and :
Combine the terms on the left side over the common denominator :
Cross-multiply to form a linear equation:
Expand both sides:
Rearrange to solve for :
Answer
x = 5
Walkthrough
Step 1: Identify the successful outcomes
We want the probability that both balls are the same colour. Looking at the tree diagram from part (a), there are two paths that lead to the same colour:
- Path 1: Green from Box A, then Green from Box B (GG).
- Path 2: Yellow from Box A, then Yellow from Box B (YY).
These are mutually exclusive events, so we add their probabilities.
Step 2: Calculate probabilities for each path
Using the multiplication law (multiply along the branches):
Step 3: Set up the equation
Sum the probabilities and set equal to the given value :
Step 4: Solve the equation
Simplify and :
Combine numerators:
Cross-multiply:
Key Takeaways
- When asked for the probability of 'same colour' or 'different colour', identify all mutually exclusive paths in the tree diagram that satisfy the condition.
- Sum the probabilities of these paths using the addition law.
- Equations involving algebraic fractions often simplify to linear equations after cross-multiplication.
Common Mistakes
- Forgetting to include both paths (GG and YY). Students might only calculate P(GG) or make an error in P(YY).
- Algebraic errors when combining fractions or cross-multiplying.
- Forgetting that the total number of balls in Box B is (not ) after the transfer.
Things to Be Careful About
- Ensure the equation is set up correctly: , not or other combinations.
- Check that the final value of makes physical sense (e.g., must be a positive integer, and denominators must not be zero). Here is valid.
The times taken, in seconds, by 15 members of each of two swimming clubs, the Penguins and the Dolphins, to swim 50 metres are shown in the following table.
| Penguins | 35 | 39 | 42 | 44 | 45 | 45 | 48 | 50 | 56 | 58 | 59 | 61 | 66 | 68 | 72 |
|---|---|---|---|---|---|---|---|---|---|---|---|---|---|---|---|
| Dolphins | 36 | 41 | 43 | 48 | 49 | 49 | 50 | 51 | 54 | 56 | 56 | 60 | 61 | 64 | 71 |
Draw a back-to-back stem-and-leaf diagram to represent this information, with Penguins on the left-hand side.
Approach
Create a central stem for the tens digits. Penguins leaves go to the left in descending order (right to left, meaning largest closest to stem). Dolphins leaves go to the right in ascending order. Add a key.
Working
Organise the data by tens digit (stem):
- Stem 3: Penguins 35, 39 → leaves 9, 5. Dolphins 36 → leaf 6.
- Stem 4: Penguins 42, 44, 45, 45, 48 → leaves 8, 5, 5, 4, 2. Dolphins 41, 43, 48, 49, 49 → leaves 1, 3, 8, 9, 9.
- Stem 5: Penguins 50, 56, 58, 59 → leaves 9, 8, 6, 0. Dolphins 50, 51, 54, 56, 56 → leaves 0, 1, 4, 6, 6.
- Stem 6: Penguins 61, 66, 68 → leaves 8, 6, 1. Dolphins 60, 61, 64 → leaves 0, 1, 4.
- Stem 7: Penguins 72 → leaf 2. Dolphins 71 → leaf 1.
Construct the back-to-back stem-and-leaf diagram:
Key: means 42 seconds for Penguins and 41 seconds for Dolphins.
Answer
Key: means 42 seconds for Penguins and 41 seconds for Dolphins
See back-to-back stem-and-leaf diagram with key: 2 | 4 | 1 means 42s for Penguins and 41s for Dolphins.
Walkthrough
First, we sort the data by their tens digits to form the stems. For the Penguins (left side), we write the units digits in descending order from right to left so that they read correctly from the stem outwards (e.g., stem 4 with leaves 8, 5, 5, 4, 2 represents 48, 45, 45, 44, 42). For the Dolphins (right side), we write the units digits in ascending order from left to right (e.g., stem 4 with leaves 1, 3, 8, 9, 9 represents 41, 43, 48, 49, 49). Finally, we include a clear key showing how to read the values for both clubs.
Key Takeaways
- A back-to-back stem-and-leaf diagram allows direct visual comparison of two datasets.
- Left-side leaves must be ordered away from the stem (descending), while right-side leaves are ordered away from the stem (ascending).
- A key is essential to clarify the meaning of the stem and leaves.
Common Mistakes
- Forgetting to order the leaves correctly on the left-hand side (they should be largest closest to the stem).
- Omitting the key or not labelling both clubs in the key.
- Adding commas or punctuation between the leaves.
Things to Be Careful About
- Ensure leaves are lined up vertically and do not cross into the next column.
- The key must clearly state the units (e.g., 'sec' or 's') and label both groups.
The diagram shows a box-and-whisker plot representing the times for the Penguins.
On the same diagram, draw a box-and-whisker plot to represent the times for the Dolphins.
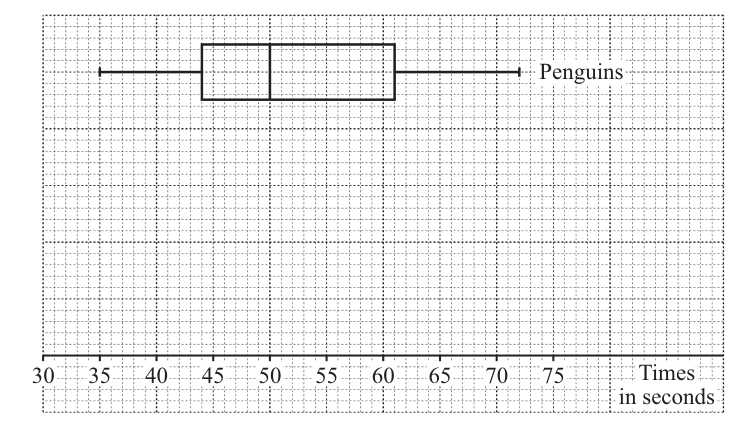
Approach
Find the minimum, lower quartile (LQ), median, upper quartile (UQ), and maximum for the Dolphins. Plot these on the grid below the Penguins plot.
Working
The Dolphins data (n = 15) in order:
36, 41, 43, 48, 49, 49, 50, 51, 54, 56, 56, 60, 61, 64, 71.
- Minimum = 36
- Maximum = 71
- Median (8th value) = 51
- Lower Quartile (4th value) = 48
- Upper Quartile (12th value) = 60
Plot the whiskers from 36 to 71. Draw the box from 48 to 60. Draw the median line at 51. Label the diagram as 'Dolphins'.
Answer
Box-and-whisker plot for Dolphins: whiskers at 36 and 71, box from 48 to 60, median at 51.
Dolphins box-and-whisker plot: min=36, LQ=48, median=51, UQ=60, max=71.
Walkthrough
First, identify the five-number summary for the Dolphins dataset. With 15 values, the median is the 8th value, the lower quartile is the 4th value, and the upper quartile is the 12th value. Calculate these values: min=36, LQ=48, median=51, UQ=60, max=71. Then, draw the box-and-whisker plot on the grid below the Penguins plot, ensuring the whiskers extend to the min and max, the box spans from LQ to UQ, and the median is drawn as a line inside the box. Label it clearly as 'Dolphins'.
Key Takeaways
- The five-number summary (min, LQ, median, UQ, max) is essential for drawing a box-and-whisker plot.
- For an odd number of data points n, the median is the ((n+1)/2)th value, LQ is the ((n+1)/4)th value, and UQ is the (3(n+1)/4)th value.
- Whiskers must not pass through the box and should be drawn at the corners or ends of the box.
Common Mistakes
- Calculating the quartiles incorrectly (e.g., using n/4 instead of the correct position formula).
- Drawing whiskers through the box or connecting them at the corners of the box.
- Forgetting to label the new plot.
Things to Be Careful About
- Ensure the scale on the axis is consistent and correctly read.
- Whiskers should be horizontal lines ending in a vertical tick or just a horizontal line, not drawn through the box.
Hence state one difference between the distributions of the times for the Penguins and the Dolphins.
Approach
Compare the medians or the spreads (range/IQR) of the two distributions to state a difference.
Working
- Central tendency: Penguins median = 50s, Dolphins median = 51s. Penguins have faster times on average.
- Spread: Penguins range = 72 - 35 = 37s, Dolphins range = 71 - 36 = 35s. Penguins IQR = 61 - 44 = 17s, Dolphins IQR = 60 - 48 = 12s. Dolphins have more consistent times.
Answer
Dolphins have more consistent times than Penguins (or Penguins are faster than Dolphins).
Dolphins have more consistent times than Penguins (or Penguins are faster than Dolphins).
Walkthrough
To state a difference, we can compare either the central tendency (median) or the spread (range or IQR) of the two datasets. From the box-and-whisker plots, the Penguins median is 50s and the Dolphins median is 51s, meaning Penguins are faster. The Penguins range is 37s and Dolphins range is 35s; the Penguins IQR is 17s and Dolphins IQR is 12s, meaning Dolphins are more consistent. Either valid comparison is acceptable.
Key Takeaways
- Box-and-whisker plots allow easy comparison of central tendency and spread between datasets.
- A lower median indicates faster times in this context.
- A smaller range or IQR indicates more consistent (less variable) data.
Common Mistakes
- Stating a difference without context (e.g., 'Dolphins have a higher median' instead of 'Dolphins are slower').
- Comparing the wrong measures (e.g., comparing range when IQR is more appropriate, though both are acceptable here).
Things to Be Careful About
- Always give the reason in context (e.g., 'faster times' or 'more consistent', not just 'higher median').
- Ensure the comparison is factually correct based on the calculated values.
Salah decides to attempt the crossword puzzle in his newspaper each day. The probability that he will complete the puzzle on any given day is 0.65, independent of other days.
Find the probability that Salah completes the puzzle for the first time on the 5th day.
Approach
The probability that the first success occurs on the 5th day means the first 4 days are failures and the 5th day is a success. This follows a geometric distribution with .
Working
Answer
0.00975
Walkthrough
This is a geometric distribution problem. The geometric distribution models the number of trials needed to get the first success. Here, "success" is completing the puzzle, with probability per day. For the first success to occur on day 5, days 1–4 must all be failures (each with probability ), and day 5 must be a success (probability ). Since the days are independent, we multiply these probabilities together: . This is the general formula for a geometric distribution: .
Key Takeaways
- The geometric distribution gives the probability of the first success occurring on the th trial: .
- Independence between trials allows us to multiply probabilities.
- The failures before the first success each contribute a factor of .
Common Mistakes
- Forgetting to include the failures before the success — writing just instead of .
- Using which would be five successes, not one success on the fifth day.
- Confusing "first time on the 5th day" with "at least once in the first 5 days".
Things to Be Careful About
- The day of the first success is the 5th day, so there are exactly 4 failures before it.
- The answer should be rounded to 3 significant figures (0.00975) as required by the mark scheme (AWRT).
Find the probability that Salah completes the puzzle for the second time on the 5th day.
Approach
For the second success to occur on day 5, exactly one success must occur in the first 4 days, and day 5 must be a success. Choose which of the first 4 days is the success (4 choices), then multiply the individual probabilities.
Working
Answer
0.0725
Walkthrough
This is a negative binomial scenario: we want the second success to occur on the 5th day. This means two things must happen: (1) exactly one success occurs among the first 4 days, and (2) day 5 is a success. For condition (1), we use the binomial distribution: the number of ways to choose which of the 4 days is the success is . The probability of one success and three failures in those 4 days is . For condition (2), the probability day 5 is a success is . Multiplying: .
Key Takeaways
- The negative binomial distribution generalises the geometric distribution: the th success occurs on trial when there are successes in the first trials and a success on trial .
- The binomial coefficient counts the number of ways to arrange the successes among the earlier trials.
Common Mistakes
- Forgetting the factor of 4 (the choice of which of the first 4 days is the success).
- Using instead of — the 5th day is fixed as a success.
- Writing without the binomial coefficient.
Things to Be Careful About
- The 5th day must be a success — it is not part of the choice.
- The first 4 days must contain exactly 1 success and 3 failures.
- The answer 0.0725 is correct to 3 significant figures.
Find the probability that Salah completes the puzzle fewer than 5 times in a week (7 days).
Approach
Let be the number of days Salah completes the puzzle in a 7-day week. Then . "Fewer than 5 times" means . Compute using the complement: .
Working
Answer
0.468
Walkthrough
Let be the number of days Salah completes the puzzle in a 7-day week. Since each day is an independent trial with success probability , .
"Fewer than 5 times" means , i.e. . Rather than computing all five probabilities directly, it is easier to use the complement: .
Each term uses the binomial probability formula . Computing:
Summing and subtracting from 1 gives (to 3 s.f.).
Key Takeaways
- The binomial distribution models the number of successes in independent trials.
- The complement rule often simplifies calculations.
- "Fewer than 5" means , not .
Common Mistakes
- Including in "fewer than 5" — this would give , which is wrong.
- Forgetting the binomial coefficients.
- Rounding intermediate values too early, leading to an inaccurate final answer.
Things to Be Careful About
- The mark scheme accepts either Method 1 (complement) or Method 2 (direct sum of through ).
- The final answer should be 0.468 (AWRT — anything within tolerance).
Use a suitable approximation to find the probability that Salah completes the puzzle more than 50 times in a period of 84 days.
Approach
Let be the number of days Salah completes the puzzle in 84 days. Then . Since and , the normal approximation is suitable: . Apply the continuity correction for .
Working
For , the continuity correction uses 50.5:
Since the normal distribution is symmetric:
Answer
0.826
Walkthrough
Let be the number of days Salah completes the puzzle in 84 days. Then . Since is large and both and are greater than 5, the normal approximation is suitable.
The mean is and the variance is , so .
We want . Since is discrete and we're approximating with a continuous normal distribution, we apply the continuity correction. "More than 50" means , so the boundary is 50.5 (halfway between 50 and 51). Standardising:
So . By symmetry of the normal distribution, .
Key Takeaways
- The normal approximation to the binomial is valid when and .
- The continuity correction is essential: for , use ; for , use .
- by symmetry of the standard normal curve.
Common Mistakes
- Omitting the continuity correction and using 50 instead of 50.5.
- Using the variance instead of the standard deviation in the standardisation formula.
- Looking up directly in the table instead of using symmetry to get .
Things to Be Careful About
- The mark scheme checks that the mean and variance are correctly computed (54.6 and 19.11).
- The continuity correction must be applied correctly: for , use 50.5.
- The final answer 0.826 must be within the range .
Approach
The word RECORDERS has 9 letters. Since R appears 3 times and E appears 2 times, the number of distinct arrangements is found by dividing by the factorials of the repeated counts.
Working
Answer
30240
30240
Walkthrough
The word RECORDERS contains 9 letters. If all letters were different, there would be arrangements. However, the letter R appears three times and the letter E appears twice. Swapping identical letters does not create a new arrangement, so the repeated letters are over-counted. Dividing by removes the over-count from the three R's, and dividing by removes the over-count from the two E's.
Key Takeaways
- When counting arrangements of a word with repeated letters, divide the total factorial by the factorial of each repeated count.
- The formula is when letters are repeated , , ... times.
Common Mistakes
- Forgetting to divide by the factorials of the repeated letters.
- Dividing by the wrong factorials, e.g. using for the E's or for the R's.
Things to Be Careful About
- Count the letters carefully: RECORDERS has 3 R's, 2 E's, and one each of C, O, D and S.
- The answer is , not alone.
How many different arrangements are there of the 9 letters in the word RECORDERS in which there is an E at the beginning, an E at the end and the three Rs are not all together?
Approach
Place an E at the beginning and an E at the end. The remaining 7 positions contain R, R, R, C, O, D, S. Count all arrangements of these 7 letters, then subtract the arrangements in which the three R's are all together.
Working
With E at both ends, the number of arrangements of the middle 7 letters is
To count the forbidden arrangements, treat the three R's as one block RRR. This block together with C, O, D and S gives 5 distinct items, so
Therefore the required number is
Answer
720
720
Walkthrough
First fix the two E's at the two ends. The remaining letters are R, R, R, C, O, D, S. These 7 letters can be arranged in ways because the three R's are identical. This total includes arrangements where all three R's are together, which are not allowed. To count those forbidden arrangements, glue the three R's into one block RRR. The block plus C, O, D and S gives 5 distinct objects, so there are forbidden arrangements. Subtracting gives the required answer.
Key Takeaways
- Fixing letters at specified positions reduces the problem to the remaining positions.
- “Not all together” is often best handled as total arrangements minus the forbidden “all together” case.
- Treating a repeated block as a single object simplifies the counting.
Common Mistakes
- Using instead of for the middle letters.
- Counting the block case as instead of .
- Counting arrangements where two R's are together but not all three; the condition only forbids all three being together.
Things to Be Careful About
- The two E's are fixed at the ends, so no extra division by is needed for them in the middle count.
- The three R's are identical, so divide by in the middle count.
- The subtraction must be .
The 9 letters of the word RECORDERS are divided at random into two groups: a group of 5 letters and a group of 4 letters.
Find the probability that the three Rs are in the same group.
Approach
The split into a group of 5 and a group of 4 is determined by choosing which 5 letters form the larger group. Count the total number of such choices, then count the choices that put all three R's in the same group.
Working
Total ways to choose the group of 5:
The three R's can be in the same group in two ways.
All three R's in the group of 5: choose 2 of the remaining 6 letters.
All three R's in the group of 4: choose 1 of the remaining 6 letters.
Total favourable ways:
Therefore
Answer
1/6
Walkthrough
The random split is completely determined by which 5 letters form the larger group; the remaining 4 letters form the other group. So the total number of equally likely splits is . For all three R's to be in the same group, they must either all be in the group of 5 or all be in the group of 4.
If they are in the group of 5, choose the other 2 letters from the 6 non-R letters: . If they are in the group of 4, choose the other 1 letter from the 6 non-R letters: . These two cases are disjoint, so the total number of favourable splits is . The probability is therefore .
Key Takeaways
- A random division into two groups can be counted by choosing the letters of one group.
- Use combinations to count equally likely selections.
- Split favourable outcomes into disjoint cases and add them.
- Probability is the number of favourable outcomes divided by the total number of equally likely outcomes.
Common Mistakes
- Forgetting the case where all three R's are in the group of 4.
- Using or as the denominator instead of .
- Treating the two E's as indistinguishable when counting the random splits; the mark scheme treats them as distinct individual letters.
Things to Be Careful About
- The remaining 6 letters are the two E's, C, O, D and S, and they are treated as 6 distinct letters in the random split.
- The two cases are disjoint, so they should be added, not multiplied.
- The answer simplifies to , which is approximately 0.167.