Mathematics 9709/52 — May/June 2024
Cambridge A-Level · Probability & Statistics 1 · worked solutions for every part, with the mark scheme
Topics Probability · Discrete Random Variables · The Normal Distribution · Representation of Data · Permutations and Combinations
Rajesh applies once every year for a ticket to a music festival. The probability that he is successful in any particular year is 0.3, independently of other years.
Approach
Let be the number of attempts until the first success. follows a geometric distribution with success probability . The probability that the first success occurs on the th attempt is .
Working
For :
Answer
0.0353
Walkthrough
This is a geometric distribution problem. Each year is an independent trial with success probability and failure probability . For the first success to occur on the 7th attempt, Rajesh must fail in each of the first 6 years and then succeed in the 7th year. Because the trials are independent, the probability is the product of the six failure probabilities and the one success probability: . This is exactly the geometric distribution formula with .
Key Takeaways
- The geometric distribution models the number of trials until the first success.
- The probability of the first success on the th trial is .
- Independent trials allow us to multiply individual probabilities.
Common Mistakes
- Using instead of .
- Forgetting to include the final success probability .
- Rounding to fewer than 3 significant figures.
Things to Be Careful About
- The exponent on is 6 (the number of failures before the success), not 7.
- The answer must be given to at least 3 significant figures.
Find the probability that Rajesh is successful for the first time before his 6th attempt.
Approach
"Before his 6th attempt" means success on attempt 1, 2, 3, 4, or 5. We use the complement: the probability that no success occurs in the first 5 attempts is , so .
Working
Alternatively, summing the geometric probabilities directly:
Answer
0.832
Walkthrough
"Before his 6th attempt" means the first success occurs on attempt 1, 2, 3, 4, or 5. There are two valid approaches.
Method 1 (complement): The probability that the first success occurs on or after the 6th attempt is the probability that the first 5 attempts are all failures, which is . Therefore .
Method 2 (direct summation): Sum the geometric probabilities for :
Both methods give the same result.
Key Takeaways
- The complement method is often easier than summing many geometric terms.
- The geometric distribution can be summed directly for a small number of trials.
Common Mistakes
- Using directly instead of .
- Including the 6th attempt in the range ("before his 6th attempt" excludes attempt 6).
- Rounding to fewer than 3 significant figures.
Things to Be Careful About
- "Before his 6th attempt" means attempts 1 to 5, not 1 to 6.
- The mark scheme accepts both methods and requires the answer to at least 3 significant figures.
Find the probability that Rajesh is successful for the second time on his 10th attempt.
Approach
For the second success to occur on the 10th attempt, there must be exactly one success in the first 9 attempts, followed by a success on the 10th. The number of ways to choose which of the first 9 attempts is the success is . Each such arrangement has probability .
Working
Answer
0.0467
Walkthrough
This is a negative binomial problem. For the second success to occur on the 10th attempt, there must be exactly one success in the first 9 attempts and a success on the 10th attempt. The number of ways to place the one success among the first 9 attempts is . Each such arrangement has probability (8 failures and 2 successes). Therefore the total probability is:
Key Takeaways
- The negative binomial distribution gives the probability of the th success on the th trial: .
- Combinatorics (binomial coefficients) is used to count the arrangements.
Common Mistakes
- Using instead of .
- Forgetting to multiply by the binomial coefficient.
- Using the wrong exponents on and .
Things to Be Careful About
- The binomial coefficient must be over the first 9 attempts (since the 10th attempt is fixed as a success).
- The exponents must sum correctly: 8 failures + 2 successes = 10 attempts.
- The answer must be given to at least 3 significant figures.
Seva has a coin which is biased so that when it is thrown the probability of obtaining a head is . He also has a bag containing 4 red marbles and 5 blue marbles.
Seva throws the coin. If he obtains a head, he selects one marble from the bag at random. If he obtains a tail, he selects two marbles from the bag at random and without replacement.
Approach
Find the probability of selecting no red marbles by considering the two ways this can happen: head then blue, or tail then two blues. Subtract this from 1 to get the probability of at least one red.
Working
Let be head, be tail, and be blue.
Probability of no red marbles:
Therefore,
Answer
17/27
Walkthrough
Start by identifying the two possible outcomes that give no red marble. If the coin lands heads, Seva takes one marble, so no red means the marble is blue: probability . If the coin lands tails, he takes two marbles without replacement, so no red means both are blue: first blue , then second blue , giving . These two cases are mutually exclusive, so add them. This gives . Since 'at least one red' is the complement of 'no red', subtract from 1: .
Key Takeaways
The key idea is to use the complement when 'at least one' appears. Also, when selections are made without replacement, the denominator changes after the first selection. Probabilities of disjoint cases are added, and probabilities along a branch are multiplied.
Common Mistakes
A common mistake is to forget the tail branch entirely, or to treat the second marble as selected with replacement, using again instead of . Another mistake is to compute the probability of at least one red directly but miss one of the red-containing cases.
Things to Be Careful About
Remember that if the coin is tails, two marbles are chosen without replacement, so the second probability is out of 8. Keep the fractions unsimplified until the end to make adding easier. The probability of no red marbles is , which is also needed in part (b).
Approach
Use the conditional probability formula , where is 'head' and is 'no red marbles'. The numerator is the probability of head and blue, and the denominator is the total probability of no red marbles from part (a).
Working
Answer
1/2
Walkthrough
We need the probability that the coin was a head, given that no red marble was selected. Write this as . By the conditional probability formula, divide the probability of head and no red by the probability of no red. Head and no red means head and blue: . The probability of no red was found in part (a): . Dividing gives .
Key Takeaways
Conditional probability reverses the conditioning: uses the intersection divided by , not by . The denominator is the total probability of the condition, which may come from a previous part.
Common Mistakes
A common mistake is to use instead of , or to divide by 1 instead of by . Another mistake is to forget that the numerator must be the intersection, not just the probability of a head.
Things to Be Careful About
Make sure the denominator is the total probability of 'no red marbles', including both the head-blue and tail-blue-blue branches. The final answer is exact; do not round unnecessarily.
The weights of oranges can be modelled by a normal distribution with mean 131 grams and standard deviation 54 grams. Oranges are classified as small, medium or large. A large orange weighs at least 184 grams and 20% of oranges are classified as small.
Approach
Let be the weight of an orange, with . A large orange is one with . Standardise using , find the upper-tail probability from the standard normal table, then convert this probability into a percentage.
Working
From the standard normal table, , so
Converting to a percentage:
Answer
16.3%
Walkthrough
The weight of an orange is modelled by a normal distribution with mean and standard deviation . A large orange is one that weighs at least 184 grams, so we need .
First, standardise the boundary value 184:
This tells us that 184 grams is about 0.9815 standard deviations above the mean. The normal table gives the probability that is less than 0.9815, which is . Since we want the probability that is greater than 0.9815, we take the complement:
Finally, multiply by 100 to express this as a percentage: .
Key Takeaways
- The standardisation formula is the bridge between any normal distribution and the standard normal distribution.
- The standard normal table gives left-tail probabilities, so for an upper tail you must subtract from 1.
- A probability can be converted directly to a percentage by multiplying by 100.
Common Mistakes
- Using directly as the answer instead of taking .
- Forgetting to multiply by 100 and giving 0.163 instead of 16.3%.
- Using the variance instead of the standard deviation 54 in the standardisation formula.
Things to Be Careful About
- Since the normal distribution is continuous, is the same as ; no continuity correction is needed.
- The boundary 184 lies above the mean, so the -value is positive and the upper-tail probability is less than 0.5, which is a good sanity check.
- The mark scheme accepts any reasonable rounding of the final percentage, so 16.3% is the expected answer.
Approach
Let be the greatest possible weight of a small orange. Since 20% of oranges are small, . Standardise and find the -value whose left-tail probability is 0.20. Because 20% is below the mean, this -value is negative. Then solve for .
Working
From the standard normal table, the -value with is approximately .
Using the standardisation formula:
Solve for :
So the greatest possible weight of a small orange is approximately grams.
Answer
85.5 grams
Walkthrough
We want the greatest weight that is still classified as small. Since 20% of oranges are small, the threshold satisfies .
Standardising gives:
The value is the -score such that the area to its left is 0.20. Looking up 0.20 in the standard normal table gives . The negative sign is essential: 20% is below the mean, so the threshold must be below 131 grams.
Now solve:
So the greatest possible weight of a small orange is approximately 85.5 grams.
Key Takeaways
- The inverse normal problem starts from a probability and works backwards to a -value, then to the original data value.
- A probability below 0.5 corresponds to a -value below the mean, so the -value is negative.
- The standardisation formula can be rearranged to solve for the unknown boundary .
Common Mistakes
- Using a positive -value of 0.842 instead of , giving grams instead of 85.5 grams.
- Using 0.2 directly as the -value rather than finding the -value whose cumulative probability is 0.2.
- Using 0.8 or another probability instead of 0.2 when reading the table.
- Mixing up signs in the equation, such as writing but then producing a negative answer.
Things to Be Careful About
- The final answer must be positive, so the signs in the equation must be consistent.
- The mark scheme accepts , so rounding to 85.5 is fine.
- Use the standard deviation 54, not the variance .
- “Greatest possible weight” is the boundary itself; because the normal distribution is continuous, whether the boundary is included or not does not affect the probability.
The back-to-back stem-and-leaf diagram shows the annual salaries of 19 employees at each of two companies, Petral and Ravon.
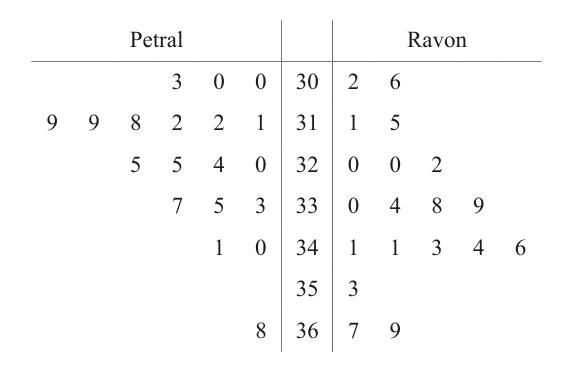
Key: means $31 200 for a Petral employee and $31 500 for a Ravon employee.
Approach
Read the 19 Petral salaries from the back-to-back stem-and-leaf diagram, place them in ascending order, then locate the median (10th of 19) and the lower and upper quartiles. The IQR is the difference .
Working
Reading the Petral side of the diagram and using the key $31,200 for Petral, the 19 salaries in ascending order are:
Median (10th of 19 values):
Lower quartile (5th value of 19):
Upper quartile (15th value of 19):
Interquartile range:
Answer
Median = $32 000, IQR = $2 300
Walkthrough
The back-to-back stem-and-leaf diagram gives every Petral salary directly: each stem on the left is read in conjunction with each leaf to its left, in the order shown, using the key $31,200. The 19 Petral salaries must first be written out in ascending order, because a stem-and-leaf diagram already orders them row-by-row. Once the 19 values are listed, the median of an odd number of observations is the single middle value — the 10th out of 19 — which is the 32000 (the lone "0" leaf on stem 32). The lower quartile is the median of the lower half (the 5th of 19), giving 31200. The upper quartile is the median of the upper half (the 15th of 19), giving 33500. Subtracting gives the IQR.
Key Takeaways
- For , the median is the 10th value, the lower quartile is the 5th value, and the upper quartile is the 15th value.
- A back-to-back stem-and-leaf diagram already lists the data in ascending order within each stem, which makes locating summary statistics straightforward.
- The IQR is a robust measure of spread, less affected by extreme values than the standard deviation.
Common Mistakes
- Forgetting the $100 part of the key, so the answer comes out 100 times too small (e.g. writing the median as 320 instead of 32000).
- Using the wrong position for the quartiles, for example taking the 4th and 16th values rather than the 5th and 15th.
- Including the median inside either half when locating the quartiles, which would shift the positions.
Things to Be Careful About
- Always use the Petral half of the key ( $31,200), not the Ravon half.
- Make sure the count of leaves on the Petral side adds to 19 before assuming the median is the 10th value.
The median salary of the Ravon employees is $33 800, the lower quartile is $32 000 and the upper quartile is $34 400.
Represent the data shown in the back-to-back stem-and-leaf diagram by a pair of box-and-whisker plots in a single diagram.
Approach
Collect the five-number summary (minimum, lower quartile, median, upper quartile, maximum) for each company and plot both box-and-whisker plots on the same horizontal salary axis. For Petral, the summary comes from part (a) and the stem-and-leaf extremes; for Ravon, the question supplies the quartiles and median, and the stem-and-leaf gives the extremes.
Working
Petral five-number summary (from the stem-and-leaf and part (a)):
Ravon five-number summary (given in the question plus the stem-and-leaf):
Plot both on a single linear scale (at least cm = $1000) ranging from about $30,000 to $37,000, with the Ravon plot above the Petral plot, and label the axis "salary ($)":
Answer
Pair of horizontal box-and-whisker plots on a shared scale from $30,000 to $37,000:
- Ravon: whiskers from 30200 to 36900, box from 32000 to 34400, median line at 33800.
- Petral: whiskers from 30000 to 36800, box from 31200 to 33500, median line at 32000.
Ravon: 30200, 32000, 33800, 34400, 36900; Petral: 30000, 31200, 32000, 33500, 36800 (plotted on a shared horizontal salary axis)
Walkthrough
A box-and-whisker plot is built from a five-number summary. For each company, list the minimum, lower quartile, median, upper quartile and maximum. For Petral, the minimum (30000) and maximum (36800) are the smallest and largest leaves in the stem-and-leaf diagram, and the quartiles and median are the values found in part (a). For Ravon, the question gives the lower quartile (32000), median (33800) and upper quartile (34400); the minimum (30200) is the smallest leaf on the Ravon side and the maximum (36900) is the largest. The two plots are then drawn as horizontal boxes on the same scale, with the whiskers extending to the extremes and a clear vertical line inside each box marking the median.
Key Takeaways
- The five-number summary fully determines a box-and-whisker plot.
- Putting two box plots on a common axis makes it easy to compare centre, spread and symmetry of the two distributions visually.
- A scale of at least cm = $1000 is required so the plots can be read accurately.
Common Mistakes
- Forgetting the $100 part of the key when reading the extremes from the stem-and-leaf.
- Drawing the whiskers through the box or at the corners of the box instead of stopping at the box edges.
- Using a non-linear or compressed scale that prevents the quartile values being plotted accurately.
Things to Be Careful About
- The label "salary ($)" or equivalent must appear on the axis so the scale is unambiguous.
- Each box must be clearly labelled (R and P) so the two plots cannot be confused.
- The horizontal width of each box has no statistical meaning — only the positions of the box edges, the median line and the whisker ends do.
Comment on whether the mean or the median would be a better representation of the data for the employees at Petral.
Approach
Look at the Petral distribution for skew or extreme values. The salary $36,800 sits well above the rest of the data, so the mean is pulled upwards. The median is unaffected by this single extreme observation, so it is the more representative measure.
Working
Most Petral salaries lie in the range $30,000 to $34,100, but $36,800 is an isolated high value. Including it raises the mean, while the median is not affected by the size of this single value. Hence the median gives a more representative picture of a "typical" Petral salary.
Answer
The median is the better measure of central tendency because the Petral data contain an extreme high value ($36,800) which distorts the mean.
Median, because the Petral data contain an extreme high value ($36 800) which would distort the mean.
Walkthrough
A measure of central tendency should reflect a typical observation. The Petral salaries are mostly clustered between $30,000 and $34,100, with a single salary of $36,800 sitting noticeably above the rest. Such an extreme value drags the arithmetic mean upwards, away from where the bulk of the data lie. The median, being the middle value, ignores the size of that extreme observation and remains within the main cluster. So when the data are skewed or contain an outlier, the median is the more robust summary.
Key Takeaways
- The mean is sensitive to extreme values; the median is resistant to them.
- When a data set contains an outlier, the median gives a fairer representation of a typical value than the mean does.
- Justifying the choice of measure requires naming the feature of the data (outlier, skew) that makes one measure preferable to the other.
Common Mistakes
- Saying "the median because there are extreme values" — the mark scheme requires identifying the extreme value itself (e.g. $36,800) or the direction of the skew, not a vague reference to "values".
- Choosing the mean because the data are numerical, with no consideration of the outlier.
Things to Be Careful About
- The Petral data are positively skewed (long right tail), which on its own is enough to justify the median; the single $36,800 salary is the most concrete reason.
Jasmine has one $5 coin, two $2 coins and two $1 coins. She selects two of these coins at random. The random variable is the total value, in dollars, of these two coins.
Approach
To get , Jasmine must choose the one $5 coin and one of the two $2 coins. Count the number of ways this can happen out of the total number of ways to choose 2 coins from 5.
Working
Total number of selections:
Favourable selections: one $5 coin and one $2 coin.
Therefore:
Answer
P(X = 7) = 0.2
Walkthrough
Jasmine has one $5 coin, two $2 coins, and two $1 coins. She chooses two coins at random. We want the probability that their total value is $7. The only way to get $7 is to pick the $5 coin and one of the two $2 coins. There are favourable pairs. The total number of pairs of coins she could choose is . So the probability is . This is a "show that" question, so we must state both the favourable count and the total count.
Key Takeaways
- When selecting objects without replacement, use combinations to count selections.
- Probability = favourable outcomes / total outcomes.
- For "show that" questions, include enough working to justify the given value.
Common Mistakes
- Forgetting to count both $2 coins, so only getting instead of .
- Using ordered selections and forgetting to multiply by 2 for the two orders (5 then 2, or 2 then 5).
- Not showing the total number of selections.
Things to Be Careful About
- The two $2 coins are distinct coins even though they have the same value.
- If using ordered probability, the probability is .
- The mark scheme requires the value 7, the coins 5 and 2, and the probabilities linked to the appropriate value.
Approach
List all possible pairs of coins and their total values, then convert counts to probabilities.
Working
The coins are: one $5, two $2, two $1.
Possible totals:
- Two $1 coins: , 1 way
- One $2 and one $1: , ways
- Two $2 coins: , 1 way
- One $5 and one $1: , ways
- One $5 and one $2: , ways
Total selections .
| 2 | 3 | 4 | 6 | 7 | |
|---|---|---|---|---|---|
| 0.1 | 0.4 | 0.1 | 0.2 | 0.2 |
Answer
The probability distribution table for is:
: 2, 3, 4, 6, 7
: 0.1, 0.4, 0.1, 0.2, 0.2
x: 2, 3, 4, 6, 7; P(X = x): 0.1, 0.4, 0.1, 0.2, 0.2
Walkthrough
List all possible pairs of coins and their sums. There are 5 coins: $5, $2, $2, $1, $1. The possible totals are 2, 3, 4, 6, 7. Count the number of pairs for each total:
- $1 + $1 = 2: only one pair (the two $1 coins).
- $2 + $1 = 3: each of the two $2 coins can pair with each of the two $1 coins, so 4 pairs.
- $2 + $2 = 4: one pair (the two $2 coins).
- $5 + $1 = 6: the $5 coin with each of the two $1 coins, so 2 pairs.
- $5 + $2 = 7: the $5 coin with each of the two $2 coins, so 2 pairs.
Total pairs = . Divide each count by 10 to get probabilities: 0.1, 0.4, 0.1, 0.2, 0.2.
Key Takeaways
- A probability distribution table must list every possible value and the probabilities must sum to 1.
- Identical coin values still represent distinct coins when counting outcomes.
- Systematic listing avoids missing outcomes.
Common Mistakes
- Missing the outcome (the most common one) or miscounting it as 2 instead of 4.
- Including a row, which is impossible.
- Forgetting that probabilities must sum to 1.
Things to Be Careful About
- The two $2 coins and two $1 coins are distinct objects, so there are 4 ways to get $3.
- The mark scheme allows extra values only if their probabilities are stated as 0.
- If writing outcomes, label them clearly so the probabilities can be linked to the correct totals.
Approach
Use . First find , then .
Working
Answer
3.24
Walkthrough
Use the formula . First compute by multiplying each value by its probability and summing: . Then compute by multiplying each squared value by its probability: . Finally subtract , giving .
Key Takeaways
- Variance measures spread and is calculated as .
- Always compute first because it is needed for both the mean and the variance.
- Use the probability distribution table from part (b) consistently.
Common Mistakes
- Forgetting to square the values when computing .
- Subtracting instead of .
- Using the wrong probabilities from the table.
- Rounding intermediate values too early.
Things to Be Careful About
- The mark scheme allows follow-through from an incorrect table, but the final answer 3.24 is exact (CAO).
- If your table is wrong, your variance may still earn method marks as long as you use the correct variance formula.
- ; be careful with the subtraction .
The residents of Mahjing were asked to classify their local bus service:
- 25% of residents classified their service as good.
- 60% of residents classified their service as satisfactory.
- 15% of residents classified their service as poor.
A random sample of 110 residents of Mahjing is chosen.
Use a suitable approximation to find the probability that fewer than 22 residents classified their bus service as good.
Approach
Since is large and is not too close to 0 or 1, approximate the binomial distribution by a normal distribution with the same mean and variance. Use a continuity correction because the binomial variable is discrete.
Working
Let be the number of residents who classified the service as good. Then . Using the normal approximation,
so
Fewer than 22 residents means , so apply the continuity correction using 21.5:
Using the standard normal table,
Answer
0.0932
Walkthrough
We start by recognising that the number of residents who classify the service as good in a sample of 110 follows a binomial distribution: . Because is large, we can approximate this with a normal distribution. The mean of the approximation is and the variance is .
Since the binomial variable is discrete and we want , we apply a continuity correction: is equivalent to , so we use 21.5 as the boundary. We then standardise using , giving . The required probability is the area to the left of this z-score. Because the z-score is negative, we use symmetry: . From the table, , so the probability is .
Key Takeaways
This question tests the normal approximation to the binomial distribution. The key skills are: checking that the approximation is appropriate, calculating the mean and variance correctly, applying the continuity correction, and standardising to use the normal table.
Common Mistakes
- Forgetting the continuity correction and using 22 instead of 21.5.
- Using the standard deviation instead of the variance in the standardisation formula, or vice versa.
- Reading the wrong tail of the normal distribution and giving a probability greater than 0.5.
- Not showing the mean and variance, which are required for the first mark.
Things to Be Careful About
The continuity correction is essential: becomes , so the boundary is 21.5. The standard deviation is , not 20.625. When the z-score is negative, remember to take . The final answer should be less than 0.5.
For a random sample of 10 residents of Mahjing, find the probability that fewer than 8 classified their bus service as good or satisfactory.
Approach
Let be the number of residents in the sample of 10 who classified the service as good or satisfactory. The probability that a resident classifies it as good or satisfactory is , so . We need , which is easier to find using the complement: .
Working
With and ,
Therefore
Answer
0.180
Walkthrough
First combine the probabilities for 'good' and 'satisfactory': . The number of such residents in a sample of 10 is binomial, . We need , i.e. . Computing all eight terms from 0 to 7 would be tedious, so use the complement: . The complement consists of exactly 8, 9 or 10 successes. Each is a binomial term: . Sum these three terms and subtract from 1 to obtain 0.180.
Key Takeaways
This question tests the binomial distribution and the use of the complement rule. Recognising when to use the complement can greatly simplify the calculation. It also reinforces the formula .
Common Mistakes
- Forgetting to subtract from 1 and giving the probability of 8, 9 or 10 instead.
- Using or instead of .
- Misreading 'fewer than 8' as instead of .
- Rounding intermediate terms too early, which can change the final answer.
Things to Be Careful About
'Fewer than 8' means , not . The complement is , which includes exactly 8, 9 and 10. Use the full binomial formula, not just , because the factor and the factor are both needed. The final answer should be rounded to 0.180.
Three residents of Mahjing are selected at random.
Find the probability that one resident classified the bus service as good, one as satisfactory and one as poor.
Approach
For three independently selected residents, the probability of a particular ordered outcome, such as (good, satisfactory, poor), is the product of the individual probabilities. Since the three categories can be arranged in different orders, multiply the product by 6.
Working
Answer
0.135
Walkthrough
We need the probability that among three randomly selected residents, one falls into each category. For a specific order, say good first, satisfactory second, poor third, the probability is . However, the one good resident could be any of the three positions, so there are possible orders. Multiply by 6 to account for all of them: .
Key Takeaways
This question tests the multiplication law for independent events and the idea of counting arrangements. When selecting one item from each of several categories, multiply the individual probabilities and then multiply by the number of possible orderings.
Common Mistakes
- Forgetting to multiply by 6 and giving .
- Adding the probabilities instead of multiplying them.
- Using only one order and not considering the different arrangements.
Things to Be Careful About
The three selections are independent, so probabilities multiply. The number of arrangements is , not 3. The final answer is , which can also be written as .
Approach
Use the formula for arrangements of a word with repeated letters: divide the total factorial by the factorials of the repeated-letter counts.
Working
The word REGENERATE has 10 letters, with R appearing 2 times and E appearing 4 times.
Answer
75600
Walkthrough
We need to count distinct arrangements of the 10 letters in REGENERATE. If all 10 letters were different, there would be arrangements. But the word has repeated letters: R appears twice and E appears four times. Swapping the two R's does not produce a new arrangement, and swapping any of the four E's does not produce a new arrangement. Therefore we divide by for the repeated R's and by for the repeated E's.
Key Takeaways
This question tests the standard formula for arrangements of a word with repeated letters. The key idea is that identical items should not be counted as different orders, so we divide by the factorial of each repeated count.
Common Mistakes
- Using without dividing by the repeated-letter factorials.
- Dividing by but forgetting to divide by , or vice versa.
- Treating the repeated letters as distinct, which overcounts.
Things to Be Careful About
Count the letters carefully: REGENERATE has 10 letters, with R repeated twice and E repeated four times. The total will be used as the denominator in part (c).
How many different arrangements are there of the 10 letters in the word REGENERATE in which the 4 Es are together and the 2 Rs have exactly 3 letters in between them?
Approach
Treat the four Es as a single block. Then arrange the 7 units so that the two Rs have exactly 3 units between them; the 3 letters between the Rs cannot include the E-block because that would put 4 actual letters between the Rs.
Working
Let denote the block . The units to arrange are .
For the two Rs to have exactly 3 letters between them, the 3 middle letters must be chosen from (not ):
There are 3 possible pairs of positions for the Rs with exactly 3 units between them: , and .
The remaining one of and occupy the two outside positions:
Total arrangements:
Since , this is .
Answer
144
Walkthrough
First make the four E's behave as one block, say . This guarantees that the E's are together. Now we arrange seven units: , R, R, G, N, A, T.
The condition says the two R's must have exactly 3 letters between them. The block represents 4 actual letters, so it cannot be one of the three letters between the R's; otherwise there would be too many letters between them. Therefore the three middle letters must be chosen from G, N, A and T. We choose and order three of these four letters: .
Next, where can the two R's be placed among the seven units so that exactly three units lie between them? The possible position pairs are (1,5), (2,6) and (3,7), giving 3 choices. For each choice, the remaining one of G, N, A, T and the block X occupy the two outside positions, which can be done in ways.
So the total is . Since , this matches the compact expression .
Key Takeaways
This problem combines two ideas: treating identical letters as a single block, and imposing a positional restriction between two identical letters. It shows how to count arrangements by fixing positions rather than listing all cases.
Common Mistakes
- Forgetting that the E-block counts as 4 letters, so it cannot be placed between the R's.
- Forgetting that there are 3 possible position pairs for the R's.
- Treating the two R's as distinct and multiplying by an extra .
- Multiplying by for the internal order of the E's; the E's are identical, so the block has only one internal arrangement.
Things to Be Careful About
The three letters between the R's must be actual letters, not units. Since represents four E's, it would make the gap too large. Also, the two R's are identical, so placing R at position 1 and R at position 5 is the same as the reverse; the position-pair method already accounts for this.
Find the probability that a randomly chosen arrangement of the 10 letters in the word REGENERATE is one in which the consonants (G, N, R, R, T) and vowels (A, E, E, E, E) alternate, so that no two consonants are next to each other and no two vowels are next to each other.
Approach
Count arrangements in which consonants and vowels alternate. There are two alternating patterns. Arrange the 5 consonants in their slots and the 5 vowels in their slots, then divide by the total number of arrangements from part (a).
Working
The consonants are and the vowels are .
There are two alternating patterns:
Arrange the consonants in their 5 slots:
Arrange the vowels in their 5 slots:
So the number of required arrangements is
Using the total arrangements from part (a), :
Answer
1/126 ≈ 0.00794
Walkthrough
For consonants and vowels to alternate, the 10 positions must be filled in one of two patterns: consonant-vowel-consonant-vowel... or vowel-consonant-vowel-consonant... . Since there are exactly 5 consonants and 5 vowels, both patterns use all letters.
For each pattern, arrange the 5 consonants in the consonant slots. The consonants are G, N, R, R, T, so the number of arrangements is because R is repeated. Similarly, the vowels are A, E, E, E, E, so the number of vowel arrangements is because E is repeated.
There are two patterns, so multiply by 2. This gives favourable arrangements. The total number of arrangements of all 10 letters is from part (a). Therefore the probability is .
Key Takeaways
This question links counting arrangements with probability. The numerator counts arrangements satisfying the alternating condition, and the denominator is the total number of equally likely arrangements. Repeated letters must be accounted for in both counts.
Common Mistakes
- Using instead of for the consonants because R is repeated.
- Using instead of for the vowels because E is repeated.
- Forgetting to multiply by 2 for the two alternating patterns.
- Using as the denominator without accounting for repeated letters; this requires a different numerator () but gives the same probability.
Things to Be Careful About
There are exactly two alternating patterns because there are equal numbers of consonants and vowels. If the denominator is taken from part (a), the numerator must be . If instead the denominator is , the numerator must be ; either way the probability simplifies to . The mark scheme accepts as an equivalent final answer.