Mathematics 9709/53 — May/June 2021
Cambridge A-Level · Probability & Statistics 1 · worked solutions for every part, with the mark scheme
Topics Discrete Random Variables · Representation of Data · Probability · The Normal Distribution · Permutations and Combinations
The heights in cm of 160 sunflower plants were measured. The results are summarised on the following cumulative frequency curve.
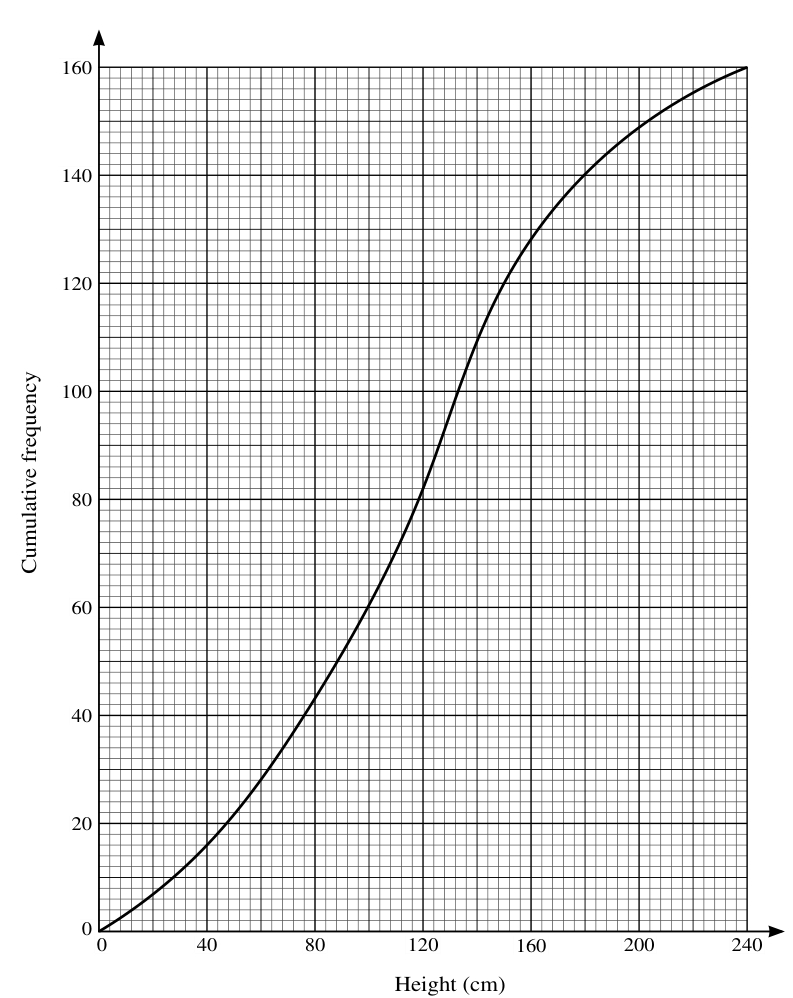
Use the graph to estimate the number of plants with heights less than 100 cm.
Approach
Locate 100 cm on the height axis (x-axis), move vertically up to the curve, then read across to the cumulative frequency axis (y-axis).
Working
From the graph, at height cm, the cumulative frequency is approximately .
Answer
60
Walkthrough
The cumulative frequency graph plots height on the x-axis and cumulative frequency on the y-axis. To find the number of plants with heights less than 100 cm, we locate 100 on the x-axis, move vertically up to the curve, and then read horizontally across to the y-axis. The y-value at that point gives the cumulative count of plants with heights up to 100 cm. From the graph, this value is approximately 60.
Key Takeaways
- A cumulative frequency graph allows direct reading of how many observations fall below a given value of the variable.
- Always read from the correct axis: the x-axis gives the variable value (height), and the y-axis gives the cumulative count (number of plants).
Common Mistakes
- Reading the wrong value from the graph, such as reading the x-coordinate when a y-coordinate is required or vice versa.
- Estimating from the wrong point on the curve due to misalignment with the grid lines.
Things to Be Careful About
- The graph is an estimate, so acceptable answers may vary slightly (the mark scheme accepts 60 or 61).
- Ensure you are reading from the correct axis — the question asks for a number of plants (y-axis value), not a height (x-axis value).
Use the graph to estimate the 65th percentile of the distribution.
Approach
Calculate 65% of the total number of plants to find the target cumulative frequency, then read the corresponding height from the graph.
Working
The total number of plants is . The 65th percentile corresponds to a cumulative frequency of:
Locate on the cumulative frequency axis (y-axis). Move horizontally to the curve, then vertically down to the height axis (x-axis).
From the graph, the height corresponding to a cumulative frequency of is approximately cm.
Answer
136 cm
Walkthrough
The 65th percentile is the value below which 65% of the data falls. First, we calculate the target cumulative frequency: 65% of 160 plants equals . This means we need to find the height at which the cumulative frequency reaches 104. We locate 104 on the y-axis (cumulative frequency), move horizontally to the right until we meet the curve, then move vertically down to read the corresponding height on the x-axis. From the graph, this height is approximately 136 cm.
Key Takeaways
- To find a percentile from a cumulative frequency graph, first calculate the target cumulative frequency as a proportion of the total number of observations.
- Then use the graph to find the corresponding value of the variable by reading from the correct axis.
Common Mistakes
- Forgetting to calculate the target cumulative frequency first and trying to read 65% directly from the graph.
- Reading the height from the wrong position on the graph, such as not aligning carefully with the grid lines.
- Not showing the working for the percentile calculation (the mark scheme requires evidence of the method).
Things to Be Careful About
- The mark scheme requires evidence of both the method (calculating ) and the use of the graph. If neither is evident, only a support mark may be awarded for the correct value.
- The graph is an estimate, so slight variations in reading are expected, but the working must be shown.
Use the graph to estimate the interquartile range of the heights of these plants.
Approach
Find the lower quartile (25th percentile) and upper quartile (75th percentile) from the graph by reading off the heights at cumulative frequencies of and respectively, then subtract to find the interquartile range.
Working
The lower quartile corresponds to of :
From the graph, at cumulative frequency , the height is approximately cm. So the lower quartile is cm.
The upper quartile corresponds to of :
From the graph, at cumulative frequency , the height is approximately cm. So the upper quartile is cm.
The interquartile range is:
Answer
74 cm
Walkthrough
The interquartile range is the difference between the upper quartile (75th percentile) and the lower quartile (25th percentile). First, we calculate the cumulative frequencies for each quartile: the lower quartile is at of , and the upper quartile is at of . We then locate these values on the y-axis of the cumulative frequency graph, move horizontally to the curve, and read the corresponding heights on the x-axis. The lower quartile height is approximately cm and the upper quartile height is approximately cm. The IQR is the difference: cm.
Key Takeaways
- The lower quartile is at 25% of the total frequency and the upper quartile is at 75% of the total frequency.
- The interquartile range is calculated as upper quartile minus lower quartile.
- Cumulative frequency graphs allow direct estimation of quartiles by reading off the variable value at the appropriate cumulative frequency.
Common Mistakes
- Using the wrong percentage for the quartiles (e.g., using 50% for the upper quartile instead of 75%).
- Reading the cumulative frequency value instead of the height value from the graph.
- Subtracting in the wrong order (lower quartile minus upper quartile gives a negative value).
- Not showing the working for the quartile calculations and graph readings.
Things to Be Careful About
- The mark scheme requires the working to show . Simply stating the answer without showing the subtraction from the quartile values may not earn full marks.
- The graph is an estimate, so acceptable ranges are given: and . However, the final answer must be computed from the specific values read from the graph.
The rest of this paper
6 more questions- Q2Discrete Random Variables4M
- Q3Representation of Data5M
- Q4Probability · Discrete Random Variables6M
- Q5The Normal Distribution9M
- Q6Permutations and Combinations10M
- Q7Probability · Discrete Random Variables · The Normal Distribution11M