Mathematics 9709/32 — October/November 2017
Cambridge A-Level · Pure Mathematics 3 · worked solutions for every part, with the mark scheme
Topics Integration · Differentiation · Logarithmic and Exponential Functions · Trigonometry · Differential Equations · Complex Numbers · +3 more
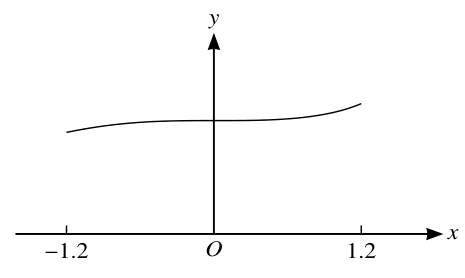
The diagram shows a sketch of the curve for values of from to .
Use the trapezium rule, with two intervals, to estimate the value of
giving your answer correct to 2 decimal places.
Approach
Apply the trapezium rule formula with intervals. Calculate the width and the ordinates at , , and .
Working
The interval is with 2 intervals, so the width of each interval is:
The ordinates are evaluated at , , and :
Apply the trapezium rule formula:
Substitute the values:
Rounding to 2 decimal places:
Answer
2.42
Walkthrough
First, determine the width of each sub-interval. The total range is from to , which is . With two intervals, the width is . Next, calculate the -values (ordinates) at the three -values that define these intervals: , , and . Substitute these into the function to get , , and . Finally, plug these into the trapezium rule formula to find the approximate area, and round to 2 decimal places.
Key Takeaways
- The trapezium rule approximates the area under a curve by dividing it into trapezia.
- The formula for intervals is , where is the interval width.
- Always keep extra decimal places during intermediate calculations to avoid rounding errors.
Common Mistakes
- Using the wrong interval width . Remember , not the number of ordinates.
- Forgetting to multiply the middle ordinates by 2 in the formula.
- Rounding intermediate values too early, which can lead to an incorrect final answer.
Things to Be Careful About
- Ensure you evaluate the function correctly, especially with negative values and powers (e.g., ).
- The question asks for the answer correct to 2 decimal places, so do not round until the very last step.
Explain, with reference to the diagram, why the trapezium rule may be expected to give a good approximation to the true value of the integral in this case.
Approach
Examine the shape of the curve in the diagram to determine why the trapezium rule will yield a good approximation.
Working
The trapezium rule works by approximating the curve with straight line segments. If the curve is nearly straight (or has very little curvature) over the intervals, the trapezia will closely match the actual area under the curve.
From the diagram, the curve is slightly increasing and slightly concave upwards. Because the curvature is small and the function is nearly linear over the given interval, the straight edges of the trapezia will lie very close to the actual curve.
Therefore, the trapezium rule is expected to give a good approximation.
Answer
The curve is nearly straight (or has very small curvature) over the interval, so the trapezia closely approximate the area under the curve.
The curve is nearly straight (or has very small curvature) over the interval.
Walkthrough
The trapezium rule replaces the curved area under the graph with straight-edged trapezia. The accuracy of this method depends on how much the curve deviates from a straight line. By observing the provided diagram, we can see that the curve is only slightly increasing and slightly concave upwards between and . This means the curvature is very small, and the curve is almost linear. Because the curve is nearly straight, the straight-line tops of the trapezia will closely follow the actual curve, resulting in a very good approximation of the true integral.
Key Takeaways
- The trapezium rule is most accurate when the function being integrated is nearly linear or has very low curvature over the interval.
- Visual inspection of the graph can provide insight into the expected accuracy of numerical integration methods.
Common Mistakes
- Stating that the curve is 'flat' or 'constant' when it is actually slightly increasing.
- Not referencing the diagram or the shape of the curve in the explanation.
Things to Be Careful About
- The mark scheme awards a mark for justifying the statement, so the explanation must clearly link the curve's shape (small curvature / nearly straight) to the accuracy of the approximation. Avoid vague statements like 'the graph is nice'.
The rest of this paper
9 more questions- Q2Logarithmic and Exponential Functions5M
- Q3Trigonometry5M
- Q4Differentiation7M
- Q5Differential Equations7M
- Q6Differentiation8M
- Q7Complex Numbers8M
- Q8Algebra10M
- Q9Integration · Numerical Solution of Equations10M
- Q10Vectors11M