Mathematics 9709/72 — October/November 2012
Cambridge A-Level · Probability & Statistics 2 · worked solutions for every part, with the mark scheme
7
questions
50
marks
75
minutes
Topics Continuous Random Variables · Hypothesis Tests · Linear Combinations of Random Variables · Sampling and Estimation · The Poisson Distribution
Q13MContinuous Random VariablesFree sample
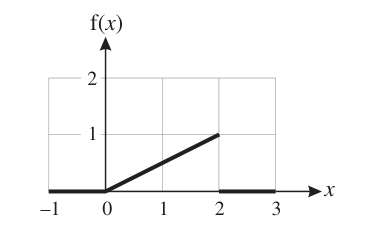
The diagram shows the graph of the probability density function, , of a random variable . Find the median of .
The rest of this paper
6 more questions- Q2Hypothesis Tests5M
- Q3Linear Combinations of Random Variables6M
- Q4Hypothesis Tests8M
- Q5Continuous Random Variables8M
- Q6Sampling and Estimation9M
- Q7The Poisson Distribution · Linear Combinations of Random Variables11M
Loading the full paper…