Mathematics 9709/71 — October/November 2012
Cambridge A-Level · Probability & Statistics 2 · worked solutions for every part, with the mark scheme
Topics Continuous Random Variables · Hypothesis Tests · Linear Combinations of Random Variables · Sampling and Estimation · The Poisson Distribution
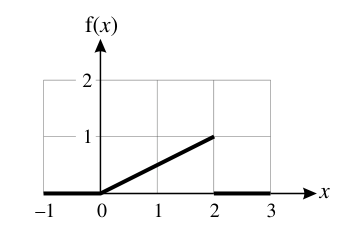
The diagram shows the graph of the probability density function, , of a random variable . Find the median of .
Approach
The median of a continuous random variable is the value that splits the total area under the probability density function (PDF) in half, so that . First, determine the equation of from the graph, then set up and solve the integral equation.
Working
From the graph, for and . For , the graph is a straight line from to .
The gradient of this line is:
Since the line passes through the origin, the equation is:
The median satisfies the condition that the area under the PDF from to equals :
Evaluating the integral:
Solving for :
Since must lie in the interval , we take the positive root.
Answer
m = sqrt(2) or 1.41 (to 3 s.f.)
Walkthrough
The median of a continuous random variable with PDF is the value such that the probability . This means the area under the PDF from the lower bound of the support up to must equal .
Step 1: Determine the equation of from the graph.
The graph shows that outside the interval . Inside , the PDF is a straight line from to . The gradient is , and since the line passes through the origin, the equation is .
We can verify this is a valid PDF by checking the total area: . ✓
Step 2: Set up the median equation.
Since for , the median equation simplifies to:
Step 3: Evaluate the integral.
Step 4: Solve for .
Setting gives , so (taking the positive root since ).
Key Takeaways
- The median of a continuous random variable is found by solving .
- When the PDF is zero over part of the range, the integral limits can be adjusted accordingly.
- Reading a linear PDF from a graph requires finding the equation of the line (gradient and intercept).
- Always verify the solution lies within the support of the PDF.
Common Mistakes
- Forgetting to set the integral equal to : Some students integrate and forget the right-hand side should be , not .
- Using as the final answer: The median must be positive (and within ), so only the positive root is valid. The mark scheme explicitly awards A0 for .
- Incorrect PDF equation: Misreading the gradient or intercept of the line from the graph.
- Not checking that is in the valid range: The median must satisfy .
Things to Be Careful About
- The PDF is zero for , so the lower limit of integration is , not .
- The answer is mathematically valid for but physically meaningless here since must be in . Always state the valid root.
- When writing the final answer, give to 3 significant figures as if required by the mark scheme.
- Verify that the total area under the PDF equals 1 as a sanity check before proceeding.
The rest of this paper
6 more questions- Q2Hypothesis Tests5M
- Q3Linear Combinations of Random Variables6M
- Q4Hypothesis Tests8M
- Q5Continuous Random Variables8M
- Q6Sampling and Estimation9M
- Q7Linear Combinations of Random Variables · The Poisson Distribution11M