Economics 9708/24 — October/November 2025
Cambridge AS Level · AS Level Data Response and Essays · worked solutions for every part, with the mark scheme
Topics Monetary Policy · Economic Growth · Aggregate Demand and Aggregate Supply · Price Stability · Methods of Government Intervention in Markets · Classification of Goods and Services · +7 more
Will stronger economic growth in the United States (US) lead to high inflation?
The US has experienced stronger economic growth than countries in Europe and elsewhere since the COVID-19 pandemic. In terms of Gross Domestic Product (GDP), it had particularly strong growth over the fourth quarter of 2023 of 3.3%. This far exceeded economists’ expectations of 2%. This means that annual growth for 2023 was 2.5% which was better than other high-income economies. It is on target to do the same in 2024 as shown in Fig 1.1.
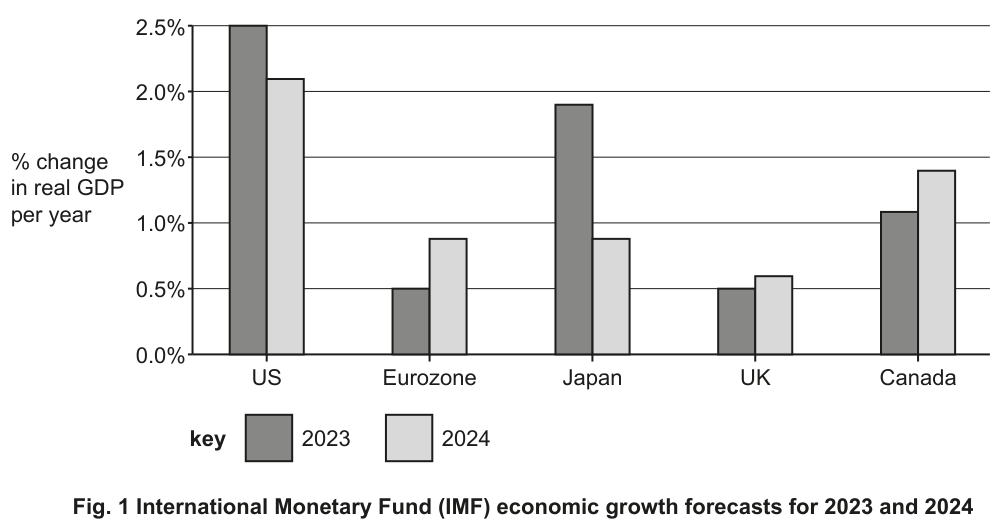
Fig. 1 International Monetary Fund (IMF) economic growth forecasts for 2023 and 2024
Economists have suggested that the strong economic growth in the US was caused by both demand and supply factors. In 2020, the US government responded to the COVID-19 pandemic by injecting US$5 trillion into the economy. Spending in many areas included more generous unemployment benefits and grants to small firms. This huge financial stimulus, much bigger than other countries, has been credited with maintaining consumer spending which represents 70% of aggregate demand.
On the supply side of the economy, existing flexible labour markets enabled firms to make workers redundant. This encouraged firms to invest in new technologies, leading to increased productivity and continued expansion in the long run. As firms expanded, they employed more workers causing disposable incomes to rise. Finally, the US is a net exporter of energy and therefore firms did not suffer the huge increase in energy costs faced by firms in Europe caused by the conflict in Ukraine. This has allowed the US to keep inflationary pressure under control.
In March 2024, however, the rate of inflation in the US rose much faster than expected as its level of unemployment fell, leading to an increase in consumer spending. Although this may lead to further economic growth and the benefits this brings, there are costs associated with inflation that may need to be dealt with. One policy that could be used is to increase interest rates, but US interest rates were already at their highest level for more than two decades because of earlier inflationary pressures. The hope had been that interest rates might start to fall, but now there are fears that any cuts in interest rates will be delayed or even worse, it might even be necessary to increase them further.
Sources: Adapted from BBC News articles: US economy sees surprisingly strong growth, 13 February 2024, US inflation jumps, 11 April 2024 and US jobs boom raises doubts about rate cuts, 5 April 2024
Compare the forecast rates of economic growth for the US and Eurozone between 2023 and 2024.
Answer
Both the US and Eurozone are forecast to have positive real GDP growth in 2023 and 2024. The US has a higher real GDP growth rate than the Eurozone in both years: 2.5% in 2023 and 2.1% in 2024 for the US, compared to 0.5% in 2023 and 0.9% in 2024 for the Eurozone. In addition, the US growth rate is forecast to fall between 2023 and 2024, while the Eurozone growth rate is forecast to rise over the same period.
The US had a higher real GDP growth rate than the Eurozone in both 2023 and 2024, with US growth forecast to fall and Eurozone growth forecast to rise between the two years.
Background Concept
Economic growth is a key macroeconomic objective, measured as the annual percentage change in real GDP. Real GDP adjusts nominal GDP (the value of output at current prices) for inflation, so it reflects changes in the actual volume of goods and services produced in an economy, rather than changes in prices. Comparing growth rates between economies and over time requires using real GDP, as it eliminates the distortion caused by different inflation rates across countries or years.
Understanding the Question
This part asks you to compare the IMF's forecast real GDP growth rates for the US and the Eurozone between 2023 and 2024, using the data in Fig 1.1. The chart shows the percentage change in real GDP per year for five economies in 2023 and 2024. You need to identify similarities and differences between the two economies across the two time periods, focusing on the level of growth and the direction of change in the growth rate. The mark scheme awards credit only for valid comparisons between the two economies and the two years, not for describing one economy in isolation.
Approach
First, identify the overall trend for both economies: both have positive real GDP growth in both years. Then compare the relative size of their growth rates in each year. Finally, compare the direction of change in their growth rates between 2023 and 2024. Use the exact figures from the chart to support your comparisons, and avoid confusing the growth rate with the level of GDP (the chart shows percentage change, not absolute GDP).
Step-by-Step Reasoning
- First, note the overall trend: both the US and Eurozone are forecast to have positive real GDP growth in 2023 and 2024, meaning both economies are expected to expand over the two years.
- Compare the level of growth: The US has a far higher growth rate than the Eurozone in both years. In 2023, US growth is 2.5% compared to 0.5% for the Eurozone; in 2024, US growth is forecast at 2.1% compared to 0.9% for the Eurozone.
- Compare the direction of change: The US growth rate is forecast to fall between 2023 (2.5%) and 2024 (2.1%), while the Eurozone growth rate is forecast to rise between 2023 (0.5%) and 2024 (0.9%).
- These three points provide a full comparison, but for 2 marks you need to include at least two valid comparison points (e.g., the relative growth rates and the direction of change).
Key Takeaways
- When comparing economic growth data, always focus on the growth rate (percentage change) rather than the level of GDP.
- A valid comparison requires referencing both the two economies and the two time periods.
- Always use the exact figures from the chart to support your points.
Common Mistakes
- Stating that US GDP fell between 2023 and 2024: this is incorrect, as the growth rate fell, but GDP still increased (just at a slower pace). The mark scheme explicitly refuses credit for this error.
- Describing only one economy without comparing it to the other: this does not answer the question, which asks for a comparison.
- Quoting figures without explaining the comparison: e.g., saying "US growth was 2.5% in 2023" without noting that this is higher than the Eurozone's 0.5% does not earn credit.
Things to Be Careful About
- Distinguish between the growth rate (percentage change) and the level of GDP: a fall in the growth rate does not mean GDP fell, only that it grew more slowly.
- Ensure all comparisons are between the two specified economies (US and Eurozone) and the two specified years (2023 and 2024).
Explain one reason why the IMF uses percentage change in real GDP and not percentage change in nominal GDP when measuring economic growth.
Answer
Nominal GDP measures output at current market prices, so it includes the effects of inflation. Real GDP adjusts for inflation by measuring output at constant base-year prices, removing the impact of price changes. This means real GDP provides a more accurate measure of the actual change in the volume of goods and services produced, allowing for meaningful comparisons of economic growth between different time periods.
Real GDP removes the effects of inflation, so it measures the actual change in the volume of output produced, allowing for meaningful comparisons of economic growth over time.
Background Concept
Economic growth is measured using GDP, which can be expressed in nominal or real terms. Nominal GDP is the value of all final goods and services produced in an economy in a given year, measured at the current market prices of that year. Real GDP adjusts nominal GDP for changes in the price level (inflation or deflation) by using the prices of a fixed base year, so it reflects only changes in the quantity of output produced. Using real GDP is essential for measuring true economic growth, as it removes the distortion of price changes.
Understanding the Question
This part asks you to explain why the IMF uses percentage change in real GDP, rather than percentage change in nominal GDP, to measure economic growth. You need to identify the key difference between nominal and real GDP, and explain why real GDP is a more accurate measure of growth. The mark scheme awards 1 mark for explaining the difference between the two measures, and 1 mark for explaining why real GDP allows for better comparisons.
Approach
First, define what nominal GDP measures (output at current prices, includes inflation) and what real GDP measures (output at constant prices, excludes inflation). Then explain that using real GDP removes the effect of price changes, so it shows the actual change in the volume of goods and services produced, allowing for meaningful comparisons of growth over time or between countries.
Step-by-Step Reasoning
- Nominal GDP growth measures the change in the value of output at current prices, so it includes the effect of inflation (rising prices) as well as changes in the quantity of output produced.
- Real GDP growth adjusts for inflation by measuring output at constant base-year prices, so it removes the impact of price changes and reflects only the change in the volume of goods and services produced.
- Using real GDP allows for a more meaningful comparison of economic growth between different time periods (or different countries), as it isolates changes in output from changes in prices. For example, if nominal GDP grew by 5% in a year but inflation was 3%, real GDP growth is only 2%, which is a more accurate measure of how much the economy actually expanded.
Key Takeaways
- Nominal GDP is affected by both changes in output and changes in prices; real GDP is affected only by changes in output.
- Real GDP is the standard measure of economic growth because it eliminates the distortion of inflation, allowing for valid comparisons over time.
Common Mistakes
- Confusing nominal and real GDP: e.g., stating that nominal GDP removes inflation, which is the opposite of the truth.
- Only stating that real GDP is better without explaining why: the second mark requires an explanation of the advantage of real GDP (meaningful comparison), not just a statement that it is better.
- Failing to link the explanation to the context of measuring economic growth: the question asks why it is used for measuring growth, so the explanation must focus on how real GDP reflects actual output changes.
Things to Be Careful About
- Be precise about what each measure includes: nominal GDP includes price changes, real GDP excludes them.
- Ensure you explain the benefit of using real GDP (accurate comparison of output changes) to earn the second mark.
Explain, with the help of a diagram, why an increase in productivity in US firms may reduce the price of their products and consider whether this will always be the outcome.
Answer
An increase in productivity reduces firms' average cost of production, as more output can be produced per unit of input. Lower costs make it profitable for firms to supply more output at every price level, so the short-run aggregate supply (SRAS) curve shifts to the right. With aggregate demand (AD) unchanged, the rightward shift in SRAS reduces the equilibrium price level and increases equilibrium real output.
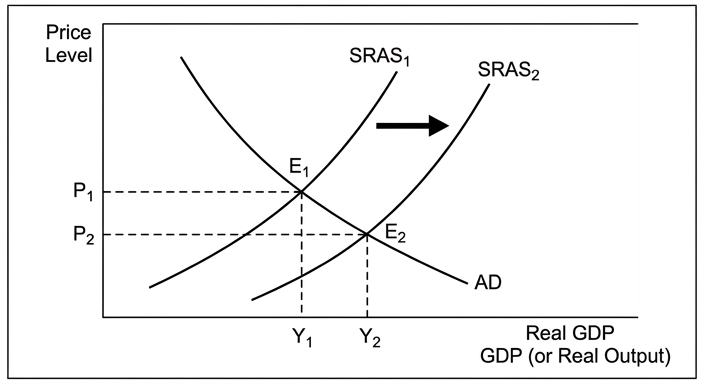
This outcome is not always certain. For example, firms may choose to retain the extra profit from lower costs rather than passing the savings to consumers, so the SRAS does not shift right. Alternatively, other costs (such as rising energy costs or wages) may increase at the same time, offsetting the productivity gain and leaving the price level unchanged.
Higher productivity lowers firms' average costs, shifting the SRAS curve right to reduce the equilibrium price level, but this outcome is not certain if firms retain extra profits or other costs rise.
Background Concept
Productivity is a measure of how efficiently an economy or firm uses its inputs (such as labour and capital) to produce output. Higher productivity means more output is produced per unit of input, which lowers the average cost of production for firms. In the AD/AS model, the short-run aggregate supply (SRAS) curve shows the relationship between the overall price level and the total quantity of goods and services that firms are willing and able to produce in the short run, holding input prices constant. A reduction in production costs shifts the SRAS curve to the right, as firms can supply more output at every price level, leading to a lower equilibrium price level and higher equilibrium real output, ceteris paribus.
Understanding the Question
This part has two components: first, explain with the help of a diagram why an increase in productivity in US firms may reduce the price of their products; second, consider whether this outcome is always certain. The mark scheme awards 3 marks for the analysis (productivity lowers costs, SRAS shifts right, lower price shown on diagram) and 1 mark for evaluation of why the price may not fall. A correctly labelled AD/AS diagram is required to earn full analysis marks.
Approach
First, build the causal chain: higher productivity -> lower average costs -> rightward shift in SRAS -> lower equilibrium price level. Draw and explain an AD/AS diagram to illustrate this chain. Then evaluate the claim by identifying reasons why the price may not fall, such as firms retaining extra profits, offsetting cost increases, or demand conditions.
Step-by-Step Reasoning
Analysis
- An increase in productivity means firms can produce more output per unit of input (e.g., per worker hour), which reduces their average cost of production. For example, if a factory adopts new automation technology, it can produce more cars with the same number of workers, lowering the cost per car.
- Lower production costs make it profitable for firms to supply more output at every price level, so the short-run aggregate supply (SRAS) curve shifts to the right. This is because firms are willing and able to produce a larger quantity of goods and services at any given price level when their costs are lower.
- With aggregate demand (AD) unchanged, the rightward shift in SRAS leads to a new, lower equilibrium price level and higher equilibrium real output. This is shown in the AD/AS diagram: the initial equilibrium is at the intersection of AD and SRAS1 (price level P1, output Y1). After the SRAS shifts right to SRAS2, the new equilibrium is at the intersection of AD and SRAS2, with a lower price level P2 and higher output Y2.
Evaluation
This outcome is not always guaranteed. First, firms may choose not to pass the cost savings from higher productivity on to consumers, instead retaining the extra profit. In this case, the SRAS curve does not shift right, and the price level remains unchanged. Second, other costs may rise at the same time as productivity increases, offsetting the cost savings. For example, if energy costs or wages rise by more than the productivity gain, average costs may not fall, so the SRAS does not shift right. Third, if aggregate demand is perfectly elastic, the price level may not fall even if SRAS shifts right, though this is a rare case in the real economy.
Key Takeaways
- Productivity improvements are a key supply-side factor that reduces production costs and shifts the SRAS curve rightward, lowering the price level and increasing output.
- The impact of productivity on prices depends on firms' pricing decisions and other cost changes: cost savings may not be passed on to consumers, or may be offset by other cost increases.
- Always evaluate conditional claims (e.g., "may reduce the price") by identifying circumstances where the outcome does not occur.
Common Mistakes
- Drawing a shift in the aggregate demand curve instead of the SRAS curve: productivity is a supply-side factor, so it affects SRAS, not AD.
- Failing to label the diagram correctly: the mark scheme requires an accurately labelled diagram with AD, SRAS, price level, real output, and the direction of the shift, to earn full marks.
- Omitting the evaluation: the question asks to "consider whether this will always be the outcome", so a short evaluation is required to earn the fourth mark.
- Confusing a shift in SRAS with a movement along the SRAS curve: productivity changes shift the entire SRAS curve, they do not cause a movement along it.
Things to Be Careful About
- Label all axes and curves in the AD/AS diagram clearly: the vertical axis must be the price level, the horizontal axis real GDP/output, and curves must be labelled AD, SRAS1, SRAS2.
- Show the direction of the SRAS shift with an arrow, and label the initial and new price levels (P1, P2) to show the fall in price.
- Ensure the evaluation directly addresses the "always" part of the question: explain why the outcome is not certain, with a specific reason.
Assess whether the costs of inflation are always likely to be greater than the benefits of inflation for the US.
Answer
There are potential benefits of inflation for the US. Low and stable inflation is a sign of strong aggregate demand and economic growth: rising prices encourage firms to increase output and hire more workers, reducing unemployment, which aligns with the extract's description of inflation rising as unemployment fell and consumer spending increased. Borrowers also benefit from inflation, as the real value of the money they repay is lower than the value of the money they borrowed.
However, there are significant costs of inflation, particularly if it is high or prolonged. High inflation creates menu costs and shoe-leather costs for firms and households, erodes the purchasing power of fixed-income households and savers, and causes fiscal drag as rising nominal incomes push households into higher tax brackets. It also reduces international competitiveness if US prices rise faster than those of trading partners, reducing export demand. In the US context, the extract notes that faster inflation in March 2024 has led to fears that interest rates will stay high or rise further, which would reduce investment and consumer spending, slowing growth and increasing unemployment.
Whether costs outweigh benefits depends on the rate and persistence of inflation. Low, stable inflation (around the Federal Reserve's 2% target) is likely to have net benefits, as it is associated with growth and avoids deflation risks. However, high or accelerating inflation, as seen in March 2024, is likely to have greater costs, as it creates uncertainty and may require contractionary policy that harms growth. Since US inflation is currently driven by demand-pull factors from strong growth, if it remains moderate, benefits may outweigh costs, but if it continues to accelerate, costs will be greater.
Conclusion
The costs of inflation are not always greater than the benefits for the US. For low, stable inflation associated with sustainable growth, benefits are likely to outweigh costs, but for high or accelerating inflation, costs are likely to be greater.
The costs of inflation are not always greater than the benefits for the US: low, stable inflation associated with growth has net benefits, while high or accelerating inflation has net costs.
Background Concept
Inflation is a sustained increase in the general price level of goods and services in an economy over time. It has both potential benefits and costs, and the net effect depends on the rate, persistence, and cause of inflation, as well as the broader economic context. Demand-pull inflation occurs when aggregate demand rises faster than aggregate supply, often during periods of strong economic growth. Cost-push inflation occurs when production costs rise, shifting the SRAS curve leftward and raising the price level while reducing output. The US currently has demand-pull inflation driven by strong consumer spending, as noted in the extract.
Understanding the Question
This part asks you to assess whether the costs of inflation are always likely to be greater than the benefits for the US. The word "assess" requires a two-sided analysis of both the benefits and costs of inflation, evaluation of the claim that costs are always greater, and a justified conclusion. The mark scheme awards up to 4 marks for analysis of benefits and costs, up to 2 marks for evaluation, and 1 mark for a justified conclusion. Evaluation must be specific to the US context, using the extract's data that US inflation is driven by demand-pull factors from strong growth.
Approach
First, outline the potential benefits of inflation, particularly low and stable inflation, in the US context. Then outline the potential costs of inflation, particularly high or prolonged inflation. Then evaluate the claim by considering the rate and persistence of inflation, and the US-specific context (demand-pull inflation from strong growth, high interest rates already in place). Finally, reach a justified conclusion that answers the "always" part of the question.
Step-by-Step Reasoning
Analysis of Benefits of Inflation
- Low and stable inflation is often a sign of strong aggregate demand and healthy economic growth. Rising prices indicate that firms can sell output at higher prices, encouraging them to increase production and hire more workers, which reduces unemployment. This aligns with the extract's description of US inflation rising as unemployment fell and consumer spending increased, linking inflation to strong growth.
- Borrowers benefit from inflation, as the real value of the money they repay is lower than the real value of the money they borrowed. For example, a household with a fixed-rate mortgage will repay the loan with money that is worth less in real terms if inflation is positive.
- Low inflation avoids the risks of deflation (a falling price level), which can lead to delayed consumption (as consumers wait for lower prices), reduced firm revenue, and higher real debt burdens, leading to recession.
Analysis of Costs of Inflation
- High or prolonged inflation creates administrative costs for firms (menu costs, the cost of changing prices) and for households (shoe-leather costs, the cost of making more trips to the bank to withdraw cash as money loses value).
- Inflation erodes the purchasing power of fixed-income households, such as those living on pensions or savings, if their income does not rise as fast as prices. Lenders also lose if the nominal interest rate is lower than the inflation rate, as the real value of repayments is lower than expected.
- Fiscal drag occurs when rising nominal incomes push households into higher income tax brackets, increasing their tax burden even if their real income has not changed, reducing disposable income.
- High inflation reduces international competitiveness if domestic prices rise faster than the prices of trading partners' goods, reducing export demand and increasing import demand, worsening the trade balance.
- In the US context, the extract notes that faster inflation in March 2024 has led to fears that interest rates will stay high or rise further. High interest rates reduce investment and consumer spending, slowing economic growth and increasing unemployment, creating a trade-off between inflation and other policy objectives.
Evaluation
Whether costs outweigh benefits depends on the rate and persistence of inflation, and the US economic context. Low, stable inflation (around the Federal Reserve's 2% target) is likely to have net benefits, as it is associated with sustainable growth, avoids deflation risks, and has minimal costs. However, high or accelerating inflation, as described in the extract for March 2024, is likely to have greater costs, as it creates uncertainty, erodes purchasing power, and may require contractionary policy that harms growth and employment. Since US inflation is currently driven by demand-pull factors from strong growth, if it remains moderate, benefits may outweigh costs, but if it continues to accelerate, costs will dominate. The extract also notes that the US avoided the cost-push inflation from energy prices that hit Europe, so US inflation is less likely to be associated with falling output, making its net impact more positive than in economies facing cost-push inflation.
Key Takeaways
- Inflation has both benefits (associated with growth, benefits borrowers, avoids deflation) and costs (erodes purchasing power, creates administrative costs, reduces competitiveness).
- The net effect of inflation depends on its rate, persistence, and cause: low stable inflation usually has net benefits, while high/prolonged inflation has net costs.
- Context is critical for evaluation: the US's current demand-pull inflation from strong growth means its net impact is likely more positive than cost-push inflation in other economies.
Common Mistakes
- Writing a one-sided answer: only discussing benefits or only costs, which forfeits all evaluation marks. The mark scheme explicitly states that a one-sided response cannot gain evaluation marks.
- Making generic points not linked to the US context: the mark scheme requires evaluation to be specific to the US, using the extract's data (e.g., demand-pull inflation from strong growth, high existing interest rates).
- Ending with a summary instead of a justified conclusion: a conclusion that restates both benefits and costs without stating which is larger and why is considered vague and scores no marks for evaluation.
- Ignoring the "always" in the question: the claim is that costs are always greater, so the counter-case (low inflation where benefits are greater) is the core of the evaluation.
Things to Be Careful About
- Ensure you cover both benefits and costs of inflation to earn full analysis marks.
- Link your evaluation to the US context: use the extract's information that US inflation is demand-pull from strong consumer spending, and that interest rates are already at 20-year highs.
- The conclusion must answer the "always" part of the question: state clearly that costs are not always greater, and explain the conditions under which benefits or costs dominate.
Assess the extent to which maintaining interest rates at a high level will be the best policy for the US to control inflation.
Answer
Maintaining high interest rates has advantages for controlling inflation in the US. Higher interest rates increase the cost of borrowing for households and firms, reducing consumer spending and investment, which lowers aggregate demand (AD) and reduces the equilibrium price level. Higher interest rates also attract foreign capital inflows, causing the US dollar to appreciate, which reduces import prices and further lowers AD, adding to the disinflationary effect. Since US inflation is driven by demand-pull factors from strong consumer spending, this policy is directly targeted at the root cause of inflation.
However, there are significant disadvantages. Reducing AD lowers real output and increases unemployment, conflicting with the US's objectives of strong growth and low unemployment. As the extract notes, US interest rates are already at their highest level for over two decades, so maintaining them at a high level will cause excessive harm to growth and jobs. High interest rates may also cause the dollar to appreciate sharply, reducing international competitiveness and worsening the trade balance, while reducing business confidence and long-term investment, harming future growth.
The suitability of high interest rates as the best policy depends on trade-offs and alternatives. In the short run, for demand-pull inflation, high interest rates are effective, but they are not the best standalone policy. Supply-side policies (such as training or infrastructure investment) could control long-run inflation without harming growth and employment, while fiscal policy could reduce AD without the side effects of exchange rate appreciation. A mix of moderate interest rates and supply-side policies would achieve inflation control with less harm to other objectives.
Conclusion
Maintaining interest rates at a high level is an effective short-run policy to control demand-pull inflation in the US, but it is not the best overall policy, as it creates significant trade-offs with growth and employment; a combination of moderate interest rates and supply-side policies would be more appropriate for controlling inflation without harming long-run economic performance.
Maintaining high interest rates is an effective short-run policy to control demand-pull inflation in the US, but it is not the best overall policy due to its negative effects on growth and employment; a mix of moderate interest rates and supply-side policies is more appropriate.
Background Concept
Monetary policy is a macroeconomic policy tool used by central banks to control the money supply and interest rates to achieve policy objectives such as low inflation, high employment, and economic growth. Contractionary monetary policy, such as raising interest rates, is used to reduce aggregate demand and lower inflation when it is above the target level. Higher interest rates increase the cost of borrowing, reduce consumer spending and investment, and may attract foreign capital inflows, causing the exchange rate to appreciate, which further reduces import demand and aggregate demand. However, contractionary monetary policy also reduces real output and increases unemployment, creating a trade-off between inflation and other policy objectives.
Understanding the Question
This part asks you to assess the extent to which maintaining interest rates at a high level will be the best policy for the US to control inflation. The word "assess" requires a two-sided analysis of the advantages and disadvantages of using high interest rates to control inflation in the US, evaluation of whether this is the best policy (including consideration of alternatives), and a justified conclusion. The mark scheme awards up to 4 marks for analysis of advantages and disadvantages, up to 2 marks for evaluation, and 1 mark for a justified conclusion. Evaluation must be specific to the US context, using the extract's data that inflation is demand-pull from strong growth, and interest rates are already at 20-year highs.
Approach
First, outline the advantages of high interest rates as a contractionary policy to control inflation, focusing on how it reduces aggregate demand. Then outline the disadvantages, particularly the trade-offs with growth and employment, and the context of the US economy. Then evaluate the policy by comparing it to alternative policies (supply-side, fiscal) and considering the trade-offs, to judge whether it is the best option. Finally, reach a justified conclusion that answers the "extent to which" part of the question.
Step-by-Step Reasoning
Analysis of Advantages of High Interest Rates
- High interest rates are a contractionary monetary policy tool. Higher interest rates increase the cost of borrowing for households (e.g., for mortgages, car loans, credit cards) and firms (e.g., for investment loans), reducing consumer spending on durable goods and housing, and reducing investment spending by firms as the return on investment falls.
- The reduction in consumer spending and investment reduces aggregate demand (AD), shifting the AD curve leftward. This lowers the equilibrium price level, reducing inflation, while also reducing equilibrium real output and increasing unemployment.
- Higher interest rates in the US may attract foreign capital inflows, as investors seek higher returns on US assets. This increases demand for the US dollar, causing it to appreciate. A stronger dollar reduces the price of imported goods and services, further reducing AD and inflationary pressure, while making US exports more expensive, reducing export demand.
- In the current US context, the extract notes that inflation is driven by demand-pull factors from strong consumer spending, so reducing AD via higher interest rates is directly targeted at the root cause of inflation, making it an effective tool.
Analysis of Disadvantages of High Interest Rates
- The reduction in AD from high interest rates lowers real output and increases unemployment, which conflicts with the US's macroeconomic objectives of strong economic growth and low unemployment, as highlighted in the extract. The extract notes that the US has had stronger growth than other high-income economies, so a policy that harms growth may be undesirable.
- The extract notes that US interest rates are already at their highest level for more than two decades, so maintaining them at a high level or increasing them further will have a larger negative impact on growth and employment than if rates were lower.
- High interest rates may reduce international competitiveness if the dollar appreciates sharply, making US exports more expensive and imports cheaper, worsening the US trade balance. While the US is a net energy exporter, a stronger dollar could reduce export demand for other US goods and services.
- High interest rates reduce business confidence and long-term investment, as firms delay or cancel capital investment projects due to higher borrowing costs. This harms the US's productive capacity and long-run economic growth.
- If inflation were caused by cost-push factors (such as higher energy costs), high interest rates would not address the root cause, and would only reduce output and increase unemployment without lowering inflation. However, the extract notes that US inflation is driven by demand-pull factors, so this is less of an issue in the current context.
Evaluation
Whether high interest rates are the best policy depends on the trade-offs between inflation, growth, and employment, and the availability of alternative policies. In the short run, for demand-pull inflation as seen in the US, high interest rates are effective at reducing inflation. However, they are not the best standalone policy, as they create significant negative side effects for growth and employment, especially since rates are already at 20-year highs.
Alternative policies could achieve inflation control with fewer negative side effects. Supply-side policies, such as investment in worker training to increase productivity, or infrastructure investment to increase long-run aggregate supply (LRAS), would reduce inflation in the long run by increasing the economy's productive capacity, without reducing short-run output or increasing unemployment. Fiscal policy, such as temporary increases in taxes or reductions in government spending, could also reduce AD without the side effects of exchange rate appreciation and reduced long-term investment. The best policy mix depends on the time period: high interest rates are appropriate for short-run control of demand-pull inflation, but supply-side policies are better for long-run inflation control without harming growth. In the US context, where inflation is driven by strong demand from fiscal stimulus and consumer spending, a combination of moderately high interest rates and supply-side policies would be more effective than maintaining interest rates at very high levels alone.
Key Takeaways
- Contractionary monetary policy (higher interest rates) reduces aggregate demand, lowering inflation but also reducing output and increasing unemployment.
- The effectiveness of high interest rates depends on the cause of inflation: they are effective for demand-pull inflation but not for cost-push inflation.
- Policy choice involves trade-offs between different macroeconomic objectives: controlling inflation may harm growth and employment, so the best policy is one that achieves the desired inflation target with the smallest negative impact on other objectives.
- Context is critical: the US's current demand-pull inflation from strong growth, and already high interest rates, mean that further rate hikes or prolonged high rates will have larger negative effects than in a different context.
Common Mistakes
- Writing a one-sided answer: only discussing advantages or only disadvantages of high interest rates, which forfeits all evaluation marks.
- Making generic points not linked to the US context: the mark scheme requires evaluation to be specific to the US, using the extract's data (demand-pull inflation, 20-year high interest rates, strong growth).
- Failing to consider alternative policies: evaluation is strengthened by comparing high interest rates to other policy options (supply-side, fiscal) to judge whether it is the best policy.
- Ending with a summary instead of a justified conclusion: a conclusion that restates advantages and disadvantages without stating the extent to which high interest rates are the best policy scores no evaluation marks.
- Confusing the effect of high interest rates on the exchange rate: higher interest rates attract capital inflows, causing currency appreciation, which reduces import prices and further lowers AD, but also reduces export competitiveness.
Things to Be Careful About
- Ensure you cover both advantages and disadvantages of high interest rates to earn full analysis marks.
- Link your analysis to the US context: note that inflation is demand-pull from strong growth, so high interest rates are effective at reducing AD, but that rates are already at 20-year highs, so further increases will have larger negative effects.
- The conclusion must answer the "extent to which" part of the question: state clearly that high interest rates are effective in the short run but not the best overall policy, and explain why.
Explain what is meant by the incidence of an indirect tax and consider the extent to which it is possible for the incidence to pass from a producer of a good to a consumer of that good.
Answer
Definition
An indirect tax is a tax imposed on expenditure on goods and services, e.g., VAT. The incidence of an indirect tax refers to the division of the burden of the tax between the producer and the consumer.
Analysis
The imposition of an indirect tax, such as a specific tax, shifts the supply curve vertically to the left by the amount of the tax. The new equilibrium price is higher and the quantity traded is lower. The extent to which the price rises determines how much of the tax is passed on from the producer to the consumer.
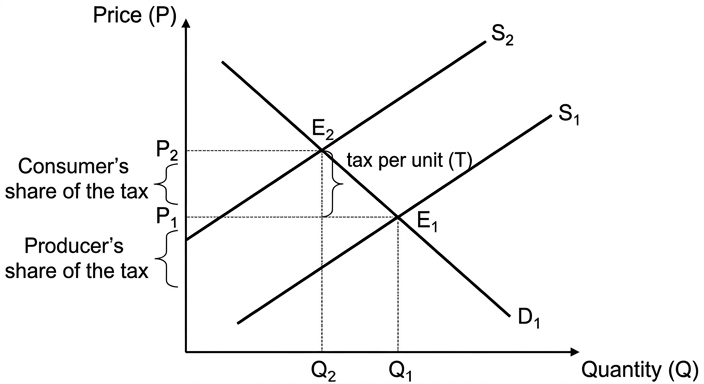
If the price elasticity of demand (PED) is inelastic, a larger proportion of the tax is passed on to the consumer through a higher price. This is because consumers are less responsive to price changes, so the producer can raise the price significantly without losing many sales. Conversely, if PED is elastic, consumers are highly responsive to price changes. The producer cannot raise the price much without losing a large volume of sales, so the producer must bear the majority of the tax burden. The incidence on the consumer is smaller.
Evaluation
The possibility of passing the incidence of an indirect tax from producer to consumer depends critically on the PED of the good. It is highly possible for goods with inelastic demand, such as necessities like petrol or cigarettes. For goods with elastic demand, such as luxury items, it is far less possible, and the producer bears more of the burden.
The possibility of passing the incidence of an indirect tax from producer to consumer is extensive for goods with inelastic PED but limited for goods with elastic PED.
Background Concept
Incidence of an Indirect Tax
An 'indirect tax' is a tax on spending (expenditure), such as Value Added Tax (VAT) or an excise duty on petrol. Unlike a direct tax on income, it is levied on the transaction. The 'incidence' of the tax is about who ultimately bears the financial burden. While the producer pays the government the tax revenue, they may try to pass this cost to the consumer in the form of a higher price.
The Role of Price Elasticity of Demand (PED)
PED measures the responsiveness of quantity demanded to a change in price. It is the key determinant of tax incidence. If demand is relatively inelastic (PED < 1), consumers' buying habits are relatively unresponsive price changes. If demand is relatively elastic (PED > 1), consumers will significantly reduce their purchases in response to a price rise.
Understanding the Question
This is a two-part point-based (AO1, AO2, AO3) question for 8 marks. Part (a) asks two things. First, to explain the concept of 'incidence of an indirect tax' (AO1 – Knowledge). Second, to consider the extent to which it is possible for the burden to be passed on (AO3 – Evaluation). The underlying scenario is a market where a government imposes an indirect tax. The 'extent' depends on a specific economic factor.
Approach
- Define Key Terms: Start by clearly defining both an 'indirect tax' and its 'incidence'. This immediately secures AO1 marks.
- Provide a Diagram (for Analysis): Draw a standard supply and demand diagram. Show the initial equilibrium. Then, show the effect of the tax as a vertical shift of the supply curve (S1 to S2). This visually represents the post-tax price and quantity.
- Use PED for Analysis: The core analysis links the diagram to PED. Explain how the new price is determined and how its level determines who pays the tax. Show the two clear extremes: inelastic demand vs. elastic demand.
- Evaluate and Conclude: The 'consider the extent to which' phrase requires a short, justified conclusion. The 'extent' is not absolute; it depends entirely on PED. A good answer qualifies this judgement, stating it is 'highly possible' for some goods and 'far less possible' for others.
Step-by-Step Reasoning
1. Definition (AO1)
- An indirect tax is a tax on spending on goods and services (e.g., VAT, excise duties).
- The incidence of tax refers to the ultimate distribution of the tax burden between the producer (reduced profit margins / surplus) and the consumer (paying a higher price).
2. Diagram and Analysis (AO2)
- Draw a diagram for a normal good. The Pre-tax equilibrium is at P1, Q1.
- An indirect specific tax of T is imposed. This shifts the supply curve from S1 to S2 vertically by the amount of the tax. This shift represents the cost increase to the producer for each unit supplied.
- The new equilibrium is at P2, Q2. The price rises from P1 to P2. The consumer now pays P2.
- The total incidence of the tax (T per unit) is split:
- Consumer's share = P2 - P1 (the price rise).
- Producer's share = The total tax T minus the consumer's share.
3. The Role of PED
- Inelastic Demand (e.g., necessities like petrol, tobacco): When the government imposes a tax on a good with inelastic demand, the demand curve is steep. The supply shift leads to a large increase in the price and only a small fall in quantity. Most of the tax (P2 - P1) is close to the total tax T. The consumer bears most of the burden. The 'extent' of passing on the incidence is high.
- Elastic Demand (e.g., luxury goods, non-essential items): When demand is elastic (flat curve), a large increase in price would cause a massive fall in quantity demanded. The producer cannot raise the price much. Therefore, P2 is close to P1. The producer must absorb most of the tax (the producer's share is much larger). The 'extent' of passing on the incidence is low.
4. Evaluation (AO3) - Considering the Extent
- It is not always possible to fully pass on the incidence. The ability is fundamentally constrained by the PED of the good.
- A justified conclusion: The extent to which a tax can be passed on is extensive for goods with inelastic PED but is very limited for goods with elastic PED. The final judgement must conclude that PED is the critical determining factor.
Key Takeaways
The main takeaway is that the burden of an indirect tax is not simply 'paid' by one party. It is a shared burden determined by the responsiveness of consumers (PED). The key economic concept is that the more inelastic the demand, the greater the proportion of the tax passed on to the consumer.
Common Mistakes
- Forgetting to define 'incidence' clearly: Many describe the tax itself but fail to explain the distribution of the burden between producer and consumer.
- Confusing the incidence with the revenue: The tax revenue is shared (tax paid by consumer + tax paid by producer), but the incidence is about the economic burden (higher price paid by consumer reduced profit absorbed by producer).
- The diagram is crucial: Not drawing the correct shift (a shift of the supply curve, not the demand curve). The wrong labelling of axes (Price and Quantity) and curves (S1, S2, D1).
- One-sided evaluation: Failing to 'consider the extent'. A simple statement 'it is possible' is not enough. The answer must create a contrast based on the elasticity. A conclusion is mandatory for the top marks.
Things to Be Careful About
- Use the diagram: Even though the mark scheme says it is not essential, a correct diagram is the best way to show the analysis for AO2.
- Label everything: Price (P) on the vertical axis, Quantity (Q) on the horizontal, the original curves (D1, S1), the shifted curve (S2), and the equilibrium points (E1, E2).
- Be precise with terminology: Use 'incidence' correctly, and mention 'price elasticity of demand' explicitly.
- The 'extent' part is crucial: For AO3, this is what 'evaluation' is. Do not just explain the logic; weigh up the conditions under which it is 'possible' or 'not possible'.
Assess the extent to which a government should subsidise the production of merit goods to increase the consumption of these goods.
Introduction
A merit good is one which is under-consumed and under-provided by the free market because consumers underestimate the private benefit from consumption (e.g., education, healthcare). A subsidy is a government payment to producers to reduce their costs. The question asks us to assess both the strength and the weaknesses of using a subsidy to increase the consumption of merit goods.
The Case for a Subsidy
A subsidy directly addresses the cost barrier to consumption. By lowering the price of the good, it makes it more affordable. For example, a subsidy on university tuition fees reduces the price faced by students. This should lead to a movement down the demand curve and a significant increase in the quantity consumed. Furthermore, a subsidy is a market-based solution. Unlike direct provision, it retains consumer choice. The government does not decide where a student studies; the student chooses among subsidised courses. This encourages efficiency and responsiveness from producers. The subsidy also reduces the social cost of under-consumption, such as a less skilled workforce, leading to higher long-term economic growth.
The Case Against a Subsidy
However, a subsidy has significant limitations. First, it is expensive and creates a heavy burden on the government budget. The opportunity cost is high—the money spent on the subsidy could be used for other things like infrastructure or tax cuts. Second, the key cause of under-consumption of merit goods is not just price, but also imperfect information. Consumers may not understand the true long-term benefit of education. If a student is unaware of the value of a skills course, a lower price may still not persuade them to take it. The demand may be relatively price-inelastic. Third, a subsidy can lead to inefficiency if producers have no incentive to control costs, potentially leading to wasted government money. Finally, there is the risk of deadweight welfare loss if the subsidy exceeds the divergence between private and social benefits.
Evaluation
The effectiveness of a subsidy ultimately hinges on the specific circumstances. It is most effective when the main barrier to consumption is price and when demand is price-elastic (e.g., for vocational training where the return is clear). It is less effective when the main barrier is lack of information (e.g., preventative healthcare). An alternative policy is direct provision, where the government provides the service for free (like state schools). This completely removes the price barrier but eliminates choice and can create a large monopoly. The best approach is often a mixed strategy: using subsidies alongside information campaigns to address both price and informational failures.
Conclusion
While subsidies can be a powerful tool to increase consumption by making merit goods cheaper, they are not a complete solution. Their effectiveness is constrained by the cost to the government and, more importantly, by the root cause of under-consumption—imperfect information. Therefore, a government should subsidise merit goods, but as part of a broader package that includes direct provision and better information provision to fully achieve its goal.
A government should subsidise merit goods to increase their consumption, but only as part of a wider strategy that addresses both price barriers and the root cause of under-consumption, which is imperfect information. A single-minded focus on subsidies is unlikely to be fully effective.
Background Concept
Merit Goods and Market Failure
A merit good is a good that is under-consumed if left to the free market. The main reason is that consumers have imperfect information about the long-term private benefits they would receive from consuming the good (e.g., education, healthcare, training). Because they underestimate the benefit, they demand less than the socially optimal level. This leads to a market failure and a welfare loss.
Subsidies as Government Intervention
A subsidy is a payment from the government to producers (or consumers) to reduce the price of a good. In theory, this makes the good cheaper, increasing quantity demanded. The effect is to shift the supply curve to the right, lowering the price and increasing the quantity. This is a classic way to address a negative externality in consumption or an under-consumed good.
Understanding the Question
This is a 12-mark levels-marked essay. The command word is 'Assess the extent to which...'. This requires a balanced evaluation and a final judgement. The question is asking how effective a subsidy is at solving the specific problem of merit goods. The key focus is not just whether it can increase consumption, but how well it does so compared to other policies and given the specific cause of the under-consumption (imperfect information).
Approach
- Define Key Terms: Start by defining merit good, subsidy, and market failure.
- Develop the Argument FOR (AO1/AO2):
- Show how a subsidy works (e.g., via a diagram where the supply curve shifts right).
- Explain the benefits: lower price, higher quantity. Apply to a specific merit good (e.g., education).
- Discuss the efficiency argument: it preserves consumer choice compared to direct provision.
- Develop the Argument AGAINST (AO1/AO2):
- Emphasise the cost to the government: the opportunity cost, the inefficiency.
- Crucially, link this back to the core cause of the market failure: imperfect information. Explain why a price reduction might not be enough to change behaviour.
- Evaluation and Conclusion (AO3):
- Weigh the arguments: when is a subsidy effective? When the main barrier is price. When is it less effective? When the barrier is information.
- Consider an alternative policy: direct provision.
- Reach a justified conclusion that addresses the 'extent' question. The conclusion should not be 'yes or no' but a nuanced 'it depends' on the specific good and the reason for the market failure.
Step-by-Step Reasoning
1. Definition and Context (AO1 - Knowledge)
- Merit Good: Education, healthcare. Under-consumed. Imperfect information is the root cause.
- Subsidy: A payment to producers, reducing their cost per unit.
2. The Argument FOR Subsidising Merit Goods (Analysis - AO2)
- Diagram: Draw a demand and supply diagram for a merit good. Show the initial equilibrium with a low price and quantity (P1, Q1) representing the under-consumed free market outcome. Impose a subsidy which shifts the supply curve from S1 to S2. The new equilibrium is at a higher quantity Q2 and a lower price P2.
- Chain of Reasoning: A subsidy lowers the cost of production for the firm. This allows them to reduce their price from P1 to P2. The lower price makes the good more affordable, leading to a movement down the demand curve and an increase in quantity from Q1 to Q2. This directly tackles the problem of under-consumption. It is a market-based solution, preserving consumer choice.
3. The Argument AGAINST Subsidising Merit Goods (Analysis - AO2)
- High Cost to Government: Subsidies are expensive. They require large government spending, which has an opportunity cost (e.g., forgone spending on other vital services or tax cuts).
- The Imperfect Information Problem (Crucial Point): The main reason merit goods are under-consumed is not just their price, but that consumers underestimate the benefit. A lower price may not be an effective incentive if a consumer does not want or value the good. For example, reducing the price of a training course might not persuade someone who sees no value in it. This implies the demand for the good might be price-inelastic in some cases, meaning the subsidy will not lead to a large increase in consumption.
- Inefficiency: Subsidies can be poorly designed. They may provide a windfall gain to those who would have bought the good anyway, resulting in deadweight loss.
4. Evaluation (AO3) - 'Assess the extent'
- Weighing the Arguments: The effectiveness of a subsidy is not uniform. It depends on the specific good.
- More Effective: Where the primary barrier is price (e.g., early childhood education, where the benefit is widely recognised).
- Less Effective: Where the barrier is primarily information (e.g., some forms of preventative healthcare or higher education for non-traditional students).
- Consider an Alternative Policy: The government could use direct provision (providing the service for free, like state schools). This is highly effective at removing the price barrier but eliminates choice and can be a monopoly provider. The best policy is often a combination: a subsidy, plus public information campaigns to correct the imperfect information.
- Justified Conclusion: To achieve the 'extent', the answer must conclude that subsidies are a useful tool but not a perfect solution. They are most effective as part of a mixed strategy (subsidies + information). A government should subsidise, but should not rely on it as the only tool. An answer that just says 'yes, they should' or 'no, they should not' is one-sided and would fall short.
Key Takeaways
- The effectiveness of a policy depends on the specific cause of the market failure. A subsidy attacks the price barrier; it does not fix an information failure.
- Evaluation in economics is about weighing the strengths and weaknesses of different options against a clear criterion.
- A conclusion must be a judgement, not a summary of both sides. It should state a clear position and justify it.
Common Mistakes
- One-sided answer: The biggest mistake. Forgetting to discuss the limitations of subsidies, especially the information failure. A one-sided answer scores zero for evaluation.
- Focusing only on the diagram: The diagram is a tool for analysis, not the final answer. The analysis must discuss the reasons for the outcome.
- Ignoring the 'merit good' aspect: Not discussing the specific problem of imperfect information. Discussing a subsidy generically as a way to lower prices is too shallow.
- Providing a simple conclusion: Ending with 'It depends' or 'Both have pros and cons' is not a justified conclusion. A good conclusion should reach a judgement about the relative effectiveness.
Things to Be Careful About
- Explicitly mention opportunity cost: Showing an awareness of the cost to the government (as it is a key argument against).
- Use accurate terminology: 'Market failure', 'imperfect information', 'demand-side subsidy', 'supply-side subsidy'.
- Link back to the question: Every paragraph should connect back to the idea of 'increasing consumption' and the 'extent to which' it is a good idea.
- Structure: Use a logical structure: Introduction -> Arguments For -> Arguments Against -> Evaluation -> Conclusion.
Explain what determines elastic and inelastic price elasticity of supply (PES) and consider the extent to which the value of PES may differ between an agricultural good and a manufactured good.
Answer
AO1 Knowledge and Understanding
Price elasticity of supply (PES) measures the responsiveness of quantity supplied to a change in price. The formula is:
PES = % change in quantity supplied / % change in price
Supply is elastic when PES > 1 (quantity supplied changes by a larger percentage than price) and inelastic when PES < 1 (quantity supplied changes by a smaller percentage).
Key determinants of PES include:
- Time period: supply is more elastic in the long run as firms can adjust production.
- Spare capacity: firms with spare capacity can increase output quickly, making supply more elastic.
- Ability to store stocks: goods that can be stored easily have more elastic supply.
- Perishability: perishable goods have more inelastic supply.
- Complexity of production: goods requiring long production processes have more inelastic supply.
AO2 Analysis
Agricultural goods tend to have inelastic PES because:
- Production takes time (crops take months to grow; livestock takes years to rear).
- Many agricultural goods are perishable (e.g., fresh fruit, milk) and cannot be stored for long.
- Land is fixed in the short run, limiting the ability to expand output.
- Weather and biological constraints make rapid supply response difficult.
Manufactured goods tend to have more elastic PES because:
- Firms often hold spare capacity and can increase output by using existing machinery and labour more intensively.
- Many manufactured goods can be stored as unfinished or finished goods, allowing supply to respond to price changes from stocks.
- Production processes can often be adjusted more quickly (e.g., increasing shift work).
AO3 Evaluation
The extent of the difference depends on specific circumstances. For example, some agricultural goods (e.g., grain) can be stored for long periods, making their supply more elastic, while some manufactured goods (e.g., custom-built machinery) have very inelastic supply due to long production times. Overall, agricultural goods generally have more inelastic PES than manufactured goods, but the difference is not absolute and varies with the good and the time period considered.
Agricultural goods generally have more inelastic PES than manufactured goods due to time, perishability, and fixed land, but the difference varies with storage ability and production complexity.
Background Concept
Price elasticity of supply (PES) is a measure of how responsive the quantity supplied of a good is to a change in its price. It is calculated as the percentage change in quantity supplied divided by the percentage change in price. The value of PES is always positive because supply curves slope upward (higher price leads to higher quantity supplied).
- Elastic supply (PES > 1): Quantity supplied changes by a larger percentage than price. This occurs when firms can easily increase production.
- Inelastic supply (PES < 1): Quantity supplied changes by a smaller percentage than price. This occurs when it is difficult or time-consuming to increase production.
- Unit elastic supply (PES = 1): Quantity supplied changes by the same percentage as price.
The key determinants of PES are:
- Time period: In the short run, supply is often inelastic because firms cannot easily change production. In the long run, supply becomes more elastic as firms can invest in new capacity.
- Spare capacity: Firms with unused capacity can increase output quickly, making supply more elastic.
- Ability to store stocks: If goods can be stored, firms can increase supply from inventories when price rises, making supply more elastic.
- Perishability: Perishable goods cannot be stored for long, limiting the ability to increase supply from stocks, making supply more inelastic.
- Complexity of production: Goods that take a long time to produce (e.g., ships, buildings) have more inelastic supply.
Understanding the Question
This question has two parts. First, it asks you to "explain what determines elastic and inelastic PES" — this is AO1 (knowledge) and AO2 (analysis). You need to define PES, state the formula, and explain the factors that make supply elastic or inelastic. Second, it asks you to "consider the extent to which the value of PES may differ between an agricultural good and a manufactured good" — this is AO3 (evaluation). You need to apply the determinants to these two types of goods and reach a justified conclusion about how much their PES values differ.
The question is point-based, with marks allocated as: AO1 up to 3, AO2 up to 3, AO3 up to 2. The final mark is reserved for a justified conclusion.
Approach
- Start with a clear definition of PES and its formula (AO1).
- Explain what makes supply elastic or inelastic, listing the key determinants (AO1).
- Apply these determinants to agricultural goods, explaining why their PES tends to be inelastic (AO2).
- Apply the same determinants to manufactured goods, explaining why their PES tends to be more elastic (AO2).
- Evaluate the extent of the difference: acknowledge that it varies by specific good and circumstances, and reach a justified conclusion (AO3).
Step-by-Step Reasoning
Step 1: Define PES and state the formula.
PES = % change in quantity supplied / % change in price. This is a standard definition that earns the first mark.
Step 2: Explain elastic and inelastic PES.
Elastic supply means quantity supplied is very responsive to price changes (PES > 1). Inelastic supply means quantity supplied is not very responsive (PES < 1). This earns the second mark.
Step 3: Explain the determinants.
List and briefly explain at least one factor: time (longer time allows more adjustment), spare capacity (more capacity = more elastic), stock levels (ability to store = more elastic), perishability (perishable = less elastic), complexity of production (complex = less elastic). This earns the third mark.
Step 4: Apply to agricultural goods.
Agricultural goods typically have inelastic PES because:
- Production is seasonal and takes time (e.g., wheat takes months to grow).
- Many are perishable (e.g., fresh milk, strawberries) and cannot be stored.
- Land is fixed in the short run.
- Biological constraints limit rapid expansion.
This earns up to 2 marks for AO2.
Step 5: Apply to manufactured goods.
Manufactured goods typically have more elastic PES because:
- Firms often have spare capacity and can increase output quickly.
- Goods can be stored as unfinished or finished goods.
- Production processes can be adjusted (e.g., overtime, extra shifts).
This earns up to 2 marks for AO2.
Step 6: Evaluate the extent of the difference.
The difference is not absolute. Some agricultural goods (e.g., grain) can be stored, making their supply more elastic. Some manufactured goods (e.g., custom-built machinery) have very inelastic supply. The time period also matters: in the long run, even agricultural supply becomes more elastic as farmers can plant more. Conclude that agricultural goods generally have more inelastic PES than manufactured goods, but the extent varies. This earns up to 2 marks for AO3, with the second mark reserved for a justified conclusion.
Key Takeaways
- PES measures supply responsiveness to price changes.
- Key determinants: time, spare capacity, stock levels, perishability, production complexity.
- Agricultural goods tend to have inelastic PES; manufactured goods tend to have more elastic PES.
- The difference is not absolute and depends on specific circumstances.
- Always provide a justified conclusion when asked to "consider the extent".
Common Mistakes
- Confusing PES with PED (price elasticity of demand). PES is about supply, not demand.
- Forgetting to state the formula for PES.
- Listing determinants without explaining how they affect elasticity.
- Providing a one-sided answer (only discussing agricultural goods or only manufactured goods).
- Failing to reach a conclusion or providing a vague conclusion.
- Not using the correct terminology (e.g., "elastic" vs "inelastic").
Things to Be Careful About
- Ensure you define PES accurately and use the correct formula.
- Explain each determinant clearly and link it to elasticity.
- Apply the determinants to both agricultural and manufactured goods.
- In the evaluation, acknowledge that the difference varies and provide a justified conclusion.
- Use the extract's context if provided (none here, but in data response questions, always use the data).
Firms will often try to estimate elasticity values to judge the possible success of decisions to change prices or to introduce new products.
Assess the extent to which an understanding of income elasticity of demand (YED) may be more useful than cross elasticity of demand (XED) in increasing the income from sales for a firm.
Introduction
Income elasticity of demand (YED) measures the responsiveness of demand for a good to a change in consumer income. Cross elasticity of demand (XED) measures the responsiveness of demand for one good to a change in the price of another good. Both can inform a firm's pricing and product strategy, but their usefulness depends on the market context and the firm's objectives.
The case for YED being more useful
YED helps a firm predict how demand for its products will change as the economy grows or contracts. Goods with positive YED (normal goods) see demand rise with income; goods with negative YED (inferior goods) see demand fall. A firm producing luxury goods (YED > 1) can plan to increase output and raise prices during an economic boom, boosting revenue. During a recession, it might diversify into necessities (YED < 1) to maintain sales. YED also guides product development: a firm can target high-YED goods in growing markets. For example, a car manufacturer might focus on premium models during a boom and introduce budget models during a downturn. This forward-looking ability to align production with macroeconomic trends directly supports revenue growth.
The case for XED being more useful
XED helps a firm understand its competitive position. Goods with positive XED (substitutes) see demand rise when a rival's price rises; goods with negative XED (complements) see demand fall when a complement's price rises. A firm can use XED to predict the impact of a competitor's price change on its own sales. For example, if a firm knows its product has a high positive XED with a rival's product, it might lower its price to capture market share when the rival raises its price. Conversely, if a product is a complement to another (e.g., printers and ink), the firm can bundle them or adjust pricing to maximise joint revenue. XED is particularly useful in oligopolistic markets where strategic interaction is key.
Evaluation
The relative usefulness depends on the firm's market environment and the source of revenue change. YED is more useful for long-term strategic planning and for firms whose sales are heavily influenced by the business cycle (e.g., luxury goods, housing). XED is more useful for short-term tactical pricing decisions and for firms in competitive markets where rivals' actions are the main driver of demand. Both measures have limitations: they are estimates that change over time, and they assume ceteris paribus, which rarely holds in practice. A firm that ignores either risks missing important demand drivers.
Conclusion
Neither measure is universally more useful. For a firm seeking to increase sales revenue, YED is more useful when income changes are the dominant factor (e.g., during a recession or boom), while XED is more useful when competitive dynamics are the main influence (e.g., in a price war). The most effective strategy is to use both together, as they capture different dimensions of demand. Therefore, the extent to which YED is more useful than XED depends on the specific circumstances of the firm and the market.
YED is more useful for long-term strategic planning in response to income changes, while XED is more useful for short-term competitive pricing decisions. Neither is universally superior; the most useful depends on the firm's market context.
Background Concept
Income Elasticity of Demand (YED) measures how responsive the quantity demanded of a good is to a change in consumer income. The formula is:
YED = % change in quantity demanded / % change in income
- Positive YED (YED > 0): Normal goods. Demand rises as income rises.
- YED > 1: Luxury goods (e.g., holidays, designer clothes). Demand rises more than proportionally.
- 0 < YED < 1: Necessities (e.g., bread, basic clothing). Demand rises less than proportionally.
- Negative YED (YED < 0): Inferior goods (e.g., own-brand products, public transport). Demand falls as income rises.
Cross Elasticity of Demand (XED) measures how responsive the quantity demanded of one good (Good A) is to a change in the price of another good (Good B). The formula is:
XED = % change in quantity demanded of Good A / % change in price of Good B
- Positive XED (XED > 0): Substitutes (e.g., tea and coffee). A rise in the price of B increases demand for A.
- Negative XED (XED < 0): Complements (e.g., cars and petrol). A rise in the price of B decreases demand for A.
- Zero XED: Unrelated goods.
The size of the coefficient indicates the strength of the relationship: a high positive XED means close substitutes; a high negative XED means strong complements.
Understanding the Question
This is a levels-marked essay (12 marks: AO1+AO2 out of 8, AO3 out of 4). The question asks you to "assess the extent to which an understanding of YED may be more useful than XED in increasing the income from sales for a firm." This is an evaluative question: you must discuss both sides (why YED might be more useful, and why XED might be more useful) and reach a justified conclusion. A one-sided response cannot gain any marks for evaluation.
The top band (Level 3 for AO1/AO2) requires: detailed knowledge, fully developed explanations, accurate use of concepts, and a well-organised response. The top band for AO3 (Level 2) requires: a justified conclusion that addresses the specific question, with developed, reasoned evaluative comments.
Approach
- Introduction: Define YED and XED briefly, and state the purpose of the essay.
- First side (YED more useful): Explain how YED helps a firm predict demand changes from income changes, plan product mix, and target growing markets. Use examples.
- Second side (XED more useful): Explain how XED helps a firm understand competitive dynamics, predict the impact of rivals' price changes, and make tactical pricing decisions. Use examples.
- Evaluation: Weigh the two against each other. Discuss limitations of both (estimates, ceteris paribus, time period). Consider the firm's market context (e.g., cyclical vs competitive industry).
- Conclusion: Reach a justified judgement on the extent to which YED is more useful. Avoid fence-sitting; state the conditions under which one is more useful.
Step-by-Step Reasoning
Step 1: Define YED and XED.
Start with clear definitions and formulas. This establishes knowledge.
Step 2: Explain how YED can increase sales revenue.
- A firm can identify whether its goods are normal, luxury, or inferior.
- During an economic boom, a firm producing luxury goods (YED > 1) can increase prices and output, knowing demand will rise more than proportionally with income.
- During a recession, a firm can switch to producing necessities (YED < 1) or inferior goods to maintain sales.
- YED helps with product development: target high-YED goods in growing markets.
- Example: A car manufacturer might focus on premium models during a boom and introduce budget models during a downturn.
Step 3: Explain how XED can increase sales revenue.
- A firm can identify substitutes and complements.
- If a rival raises its price, a firm with a close substitute (high positive XED) can raise its own price or capture market share.
- If a product is a complement to another, the firm can bundle them or adjust pricing to maximise joint revenue.
- XED is crucial in oligopolistic markets where strategic interaction is key.
- Example: A coffee shop might lower its price when a rival raises its price, knowing that demand for its coffee will rise (positive XED).
Step 4: Evaluate the relative usefulness.
- Limitations of YED: It assumes income is the main driver of demand; in reality, other factors (tastes, advertising, competition) also matter. YED estimates are based on past data and may change over time.
- Limitations of XED: It assumes the price of the other good is the main driver; in reality, multiple factors affect demand. XED estimates are also based on past data and may change.
- Context matters: YED is more useful for firms in cyclical industries (e.g., luxury goods, housing) where income changes are the dominant factor. XED is more useful for firms in competitive markets (e.g., supermarkets, airlines) where rivals' actions are the main driver.
- Time period: YED is more useful for long-term strategic planning; XED is more useful for short-term tactical decisions.
Step 5: Reach a justified conclusion.
Conclude that neither is universally more useful. The extent to which YED is more useful depends on the firm's market context. For a firm facing significant income fluctuations, YED is more useful. For a firm in a highly competitive market, XED is more useful. The best approach is to use both together.
Key Takeaways
- YED and XED are both useful for predicting demand and increasing sales revenue.
- YED is better for long-term planning and responding to income changes.
- XED is better for short-term tactical pricing and responding to competitors.
- Both have limitations: they are estimates, assume ceteris paribus, and can change over time.
- A justified conclusion must address the specific question and avoid fence-sitting.
Common Mistakes
- Writing a one-sided answer (only discussing YED or only XED) — this loses all evaluation marks.
- Failing to define YED and XED clearly.
- Providing generic explanations without linking to the firm's goal of increasing sales revenue.
- Not reaching a conclusion or providing a vague conclusion (e.g., "it depends" without saying on what).
- Listing points without developing them (e.g., stating that YED is useful but not explaining how).
- Ignoring the limitations of both measures.
Things to Be Careful About
- Ensure the answer is directly related to "increasing the income from sales for a firm." The mark scheme warns that answers not directly related to this will be capped at mid-Level 2.
- Use examples to support explanations (e.g., luxury cars, own-brand products, coffee and tea).
- Organise the essay logically: introduction, one side, other side, evaluation, conclusion.
- In the evaluation, make developed, reasoned comments (e.g., discuss time period, market context, limitations).
- The conclusion must be justified: state which is more useful and under what conditions.
Using two tools of protection, explain what is meant by protectionism and consider the extent to which these two tools may benefit an economy.
Answer
AO1 Knowledge and Understanding
Protectionism is the use of government policies to restrict international trade in order to protect domestic industries from foreign competition. Two common tools are import tariffs and import quotas.
An import tariff is a tax on imported goods, raising their price relative to domestic substitutes. An import quota is a physical limit on the quantity of a good that can be imported over a given period.
AO2 Analysis
A tariff can benefit an economy by protecting domestic employment. By raising the price of imports, domestic firms become more competitive, allowing them to maintain or increase output and employment. This can also improve the current account balance by reducing the volume of imports. A quota provides a guaranteed market share for domestic producers, which can help protect infant industries until they achieve economies of scale and become internationally competitive.
However, both tools have drawbacks. A tariff may not protect employment if the demand for imports is price inelastic (PED < 1), as consumers continue to buy the now more expensive imports, simply paying more. This can fuel cost-push inflation. A quota can lead to higher prices for consumers and a reduction in choice. Both tools risk retaliation from trading partners, who may impose their own tariffs or quotas, harming the economy's export sector and potentially leading to a trade war.
AO3 Evaluation
The extent to which these tools benefit an economy is limited. While they can offer short-term protection for specific industries and jobs, the costs to consumers through higher prices and the risk of retaliation often outweigh these benefits. The benefits are most likely to be realised if the protection is temporary and part of a strategy to allow industries to restructure and become competitive. A justified conclusion is that protectionism offers limited, short-term benefits but carries significant long-term costs, making it a generally inferior policy to free trade.
Protectionism offers limited, short-term benefits for specific industries but carries significant long-term costs for consumers and risks retaliation, making it generally inferior to free trade.
Background Concept
Protectionism is the economic policy of restraining trade between nations through methods such as tariffs, quotas, and subsidies. The core idea is to shield domestic producers from foreign competition. The theoretical foundation for free trade is the principle of comparative advantage, which suggests that countries benefit from specialising in what they produce relatively most efficiently. Protectionism directly contradicts this by creating barriers to trade.
An import tariff is a tax levied on goods imported into a country. It raises the domestic price of the imported good, making domestically produced substitutes more attractive. An import quota is a direct restriction on the quantity of a good that can be imported, which also raises the domestic price by limiting supply.
Understanding the Question
This is a point-based question worth 8 marks, split across three assessment objectives: AO1 (Knowledge, 3 marks), AO2 (Analysis, 3 marks), and AO3 (Evaluation, 2 marks). The command words are "explain" and "consider the extent to which".
- "Explain what is meant by protectionism" (AO1): You must provide a clear definition and name two specific tools.
- "Using two tools of protection" (AO1/AO2): You must explain how these two tools work.
- "Consider the extent to which these two tools may benefit an economy" (AO2/AO3): This requires analysis of the potential benefits AND drawbacks of each tool, followed by a short, justified conclusion that weighs them up. The mark scheme explicitly reserves the second evaluation mark for a justified conclusion.
Approach
- Define protectionism and name two tools (tariff and quota are the most straightforward).
- Explain each tool briefly (how it works).
- Analyse the benefits of each tool (e.g., protecting jobs, improving the current account, protecting infant industries).
- Analyse the drawbacks of each tool (e.g., higher prices for consumers, retaliation, inefficiency). The mark scheme caps analysis at 3 marks and notes that if only one tool is considered, the maximum is 2 marks. Therefore, you must cover both tools.
- Evaluate the extent of the benefit. This is not just a list of pros and cons. You must weigh them against each other and reach a judgement. The key is to argue that the benefits are limited and often short-term, while the costs are more widespread and long-lasting.
Step-by-Step Reasoning
Step 1: Define and Explain (AO1)
- Start with a clear definition: "Protectionism is government policy to protect domestic industries from foreign competition."
- Name two tools: "Two common tools are import tariffs and import quotas."
- Explain each: "A tariff is a tax on imports, which raises their price. A quota is a physical limit on the quantity of imports."
Step 2: Analyse Benefits (AO2)
- Tariff Benefit: A tariff makes imports more expensive. This shifts demand towards domestically produced goods. This can protect jobs in the domestic industry and improve the current account balance by reducing the volume of imports.
- Quota Benefit: A quota guarantees a specific market share for domestic producers. This is particularly useful for protecting an 'infant industry' that needs time to grow and achieve economies of scale before it can compete internationally.
Step 3: Analyse Drawbacks (AO2)
- Tariff Drawback: The benefit of protecting jobs is not guaranteed. If the demand for the imported good is price inelastic (PED < 1), consumers will continue to buy it despite the higher price. The tariff then simply raises government revenue but does not protect the domestic industry. It also raises costs for consumers and businesses that use the imported good as an input, potentially causing cost-push inflation.
- Quota Drawback: A quota directly restricts supply, which almost always leads to higher prices for consumers and less choice. It also removes the competitive pressure on domestic firms to be efficient, leading to higher costs and lower quality over time.
- Common Drawback (Retaliation): Both tools risk retaliation. If Country A imposes a tariff on Country B's steel, Country B may retaliate by imposing a tariff on Country A's agricultural products. This can harm the export sector of the initiating country and can escalate into a trade war, which reduces global output and welfare.
Step 4: Evaluate and Conclude (AO3)
- The question asks "consider the extent to which these two tools may benefit an economy." The answer is "to a limited extent."
- The benefits are specific (protecting a few industries, saving some jobs) and are often short-term. The costs are widespread (higher prices for all consumers, retaliation harming the whole export sector, reduced efficiency).
- A justified conclusion must state this judgement clearly: "While tariffs and quotas can provide short-term protection for specific industries, the long-term costs to consumers and the risk of retaliation mean that their overall benefit to the economy is limited. They are generally an inferior policy to free trade."
Key Takeaways
- Protectionism is the opposite of free trade.
- Tariffs and quotas are two key tools, but they work in different ways (price vs. quantity).
- The benefits of protectionism are often concentrated (on a specific industry), while the costs are dispersed (across all consumers).
- A key evaluation point is the risk of retaliation, which can negate any initial benefits.
- For a "consider the extent" question, you must provide a balanced analysis and a clear, justified conclusion.
Common Mistakes
- Only discussing one tool: The mark scheme explicitly limits analysis to 2 marks if only one tool is considered. You must discuss both.
- One-sided analysis: Only listing benefits and ignoring drawbacks. This would fail to access the AO3 evaluation marks.
- No conclusion: The mark scheme reserves a mark for a justified conclusion. An answer that just lists pros and cons without a final judgement will lose this mark.
- Vague conclusion: A conclusion like "it depends" is not sufficient. You must state the extent to which it benefits the economy (e.g., "to a limited extent") and justify why.
- Confusing tools: Mixing up a tariff (a tax) with a quota (a limit).
Things to Be Careful About
- Command words: "Explain" requires a mechanism. "Consider the extent" requires a judgement.
- Elasticity: Mentioning PED is a strong analytical point. A tariff is less effective at protecting an industry if demand is inelastic.
- Retaliation: This is a crucial evaluation point that is explicitly mentioned in the mark scheme. Always include it.
- Structure: Organise your answer clearly. A simple structure is: Definition -> Tool 1 (benefits and drawbacks) -> Tool 2 (benefits and drawbacks) -> Conclusion.
Assess the extent to which the principle of comparative advantage should be the main factor to consider when countries decide whether to trade with each other.
Introduction
The principle of comparative advantage states that countries should specialise in producing goods and services where they have the lowest opportunity cost, and then trade. This leads to a more efficient allocation of global resources and an increase in world output. While this is a powerful argument for free trade, it is not the only factor countries should consider when deciding whether to trade.
The Case for Comparative Advantage as the Main Factor
The theory provides a clear, logical framework for maximising global welfare. If each country specialises according to its comparative advantage, total world output of every good can increase. This allows countries to consume beyond their own production possibility curves (PPCs), leading to higher living standards. For example, a country with a comparative advantage in wine (low opportunity cost of land and labour) should specialise in wine and trade for cloth, even if it could produce cloth more efficiently in absolute terms. This specialisation leads to lower prices for consumers and a wider variety of goods. The theory's core insight—that mutually beneficial trade is possible even if one country is more efficient at producing everything—is a fundamental economic truth.
The Case Against Comparative Advantage as the Main Factor
Despite its theoretical elegance, the theory has significant limitations that mean it should not be the sole or main factor in trade decisions.
First, the theory assumes perfect resource mobility. In reality, specialisation can lead to structural unemployment. If a country specialises in textiles and then loses its comparative advantage to a lower-cost producer, its workers and capital are not instantly transferable to a new industry. The costs of this adjustment can be severe.
Second, over-specialisation can make an economy vulnerable. A country that specialises in a narrow range of primary commodities (e.g., oil or coffee) is exposed to volatile world prices and demand shocks. This can destabilise the entire economy, a phenomenon known as the 'resource curse'.
Third, strategic and political factors often override comparative advantage. A country may wish to protect its domestic agriculture or steel industry for food security or national defence, even if it has a comparative disadvantage in these sectors. Relying on other countries for essential goods like food or energy can be a strategic risk.
Fourth, the theory assumes free trade and ignores the role of transport costs, which can offset the gains from specialisation. It also assumes constant returns to scale, whereas in reality, increasing returns can create new comparative advantages over time.
Evaluation
The principle of comparative advantage provides a strong theoretical foundation for the benefits of free trade and should be a primary consideration. However, its assumptions are often violated in the real world. The static nature of the model ignores the dynamic process of economic development, where countries may deliberately protect 'infant industries' to develop a comparative advantage in higher-value sectors. The importance of comparative advantage is therefore context-dependent. For a developed, diversified economy with flexible labour markets, it is a very strong guide. For a developing economy or one facing strategic threats, other factors like food security, industrialisation, and employment stability may be more important.
Conclusion
To a significant extent, the principle of comparative advantage should be a main factor, as it provides the fundamental economic rationale for trade and specialisation that raises global living standards. However, it should not be the only factor. Strategic, political, and developmental considerations are also crucial. A justified conclusion is that comparative advantage is a necessary but not sufficient guide for trade policy; it must be weighed against the risks of over-specialisation, strategic vulnerability, and the costs of adjustment.
Comparative advantage is a necessary but not sufficient guide for trade policy; it must be weighed against the risks of over-specialisation, strategic vulnerability, and the costs of adjustment.
Background Concept
The principle of comparative advantage is the cornerstone of the theory of free trade. Developed by David Ricardo, it states that even if one country is more efficient (has an absolute advantage) in producing all goods, both countries can still benefit from trade if they specialise in producing the good in which they have the lowest opportunity cost. Opportunity cost is the value of the next best alternative forgone.
For example, if Country A can produce 10 units of cloth or 5 units of wine with one unit of labour, and Country B can produce 6 units of cloth or 2 units of wine, Country A has an absolute advantage in both. However, Country A's opportunity cost of 1 unit of cloth is 0.5 wine, while Country B's is 0.33 wine. Country B has a lower opportunity cost in wine, so it has a comparative advantage in wine. Country A has a comparative advantage in cloth. Specialisation and trade will benefit both.
Understanding the Question
This is a levels-marked essay question worth 12 marks, split into AO1/AO2 (8 marks) and AO3 (4 marks). The command word is "Assess the extent to which...". This requires:
- Knowledge and Understanding (AO1): A clear definition and explanation of the principle of comparative advantage.
- Analysis (AO2): A developed explanation of why it is a powerful factor (the benefits of specialisation and trade). Also, a developed analysis of its limitations and why other factors might be more important.
- Evaluation (AO3): A balanced judgement on the extent to which it should be the main factor. This requires weighing the theoretical benefits against the real-world limitations and arriving at a justified conclusion. The mark scheme explicitly states: "A one-sided response cannot gain any marks for evaluation."
The top band descriptors require a "detailed knowledge", "fully developed" explanations, and a "justified conclusion or judgement that addresses the specific requirements of the question."
Approach
- Introduction: Define comparative advantage and state the essay's purpose: to assess its importance relative to other factors.
- First Side (The Case FOR): Develop the argument for why it should be the main factor. Focus on the core benefits: efficient resource allocation, increased world output, higher consumption possibilities, and lower prices. Use a simple numerical example to illustrate the point.
- Second Side (The Case AGAINST): Develop the counter-argument. This is where you discuss the limitations of the theory. Key points include:
- Structural unemployment: The assumption of perfect factor mobility is unrealistic.
- Over-specialisation and vulnerability: The risk of relying on a narrow range of exports.
- Strategic concerns: Food security, national defence, and the desire to protect infant industries.
- Transport costs and other real-world frictions.
- Evaluation: This is the most important section. You must weigh the two sides. The key is to argue that the theory is a powerful guide but not an absolute rule. Its relevance depends on the context (e.g., the level of development of the country, the flexibility of its markets, the nature of the goods being traded).
- Conclusion: Provide a clear, justified answer to the question. State the extent (e.g., "to a significant extent, but not entirely") and explain why.
Step-by-Step Reasoning
Step 1: Define and Explain the Principle (AO1)
- Start by defining comparative advantage in terms of opportunity cost.
- Use a simple 2-country, 2-good example to show how specialisation and trade can lead to gains for both countries, even if one has an absolute advantage in both. This demonstrates your understanding.
Step 2: Analyse the Benefits (AO2 - First Side)
- Explain that if countries follow comparative advantage, global resources are allocated to their most efficient uses. This maximises world output.
- This increased output allows countries to consume beyond their PPCs, leading to higher living standards.
- Consumers benefit from lower prices and a greater variety of goods.
- This is the fundamental economic argument for free trade and is a very strong factor.
Step 3: Analyse the Limitations (AO2 - Second Side)
- Unemployment: Specialisation means some industries will decline. The theory assumes workers can instantly move to the expanding industry. In reality, this causes structural unemployment, which has significant economic and social costs.
- Over-specialisation: A country that specialises in one or two products (e.g., a developing country specialising in coffee) is vulnerable to price fluctuations and demand shocks. This can destabilise the entire economy.
- Strategic Factors: Countries may choose to protect industries vital for national security (e.g., defence, energy, food) even if they have a comparative disadvantage. The cost of being dependent on a potentially hostile nation for essential goods is too high.
- Infant Industry Argument: A developing country may have a potential comparative advantage in a manufacturing industry, but it cannot compete with established foreign firms initially. Temporary protection (e.g., a tariff) can allow the industry to grow and achieve economies of scale, creating a new comparative advantage. This dynamic view contradicts the static nature of the Ricardian model.
- Other Factors: Transport costs, imperfect information, and the presence of trade barriers can all reduce or eliminate the gains from trade predicted by the theory.
Step 4: Evaluate and Conclude (AO3)
- The question asks for the extent to which it should be the main factor. The answer is not a simple yes or no.
- Weighing the arguments: The theoretical benefits of comparative advantage are powerful and provide a strong prima facie case for free trade. However, the real-world limitations are significant.
- Context is key: For a developed, diversified economy with flexible labour markets and a strong welfare state, comparative advantage is an excellent guide. The costs of adjustment are manageable. For a developing economy, the risks of over-specialisation and the desire to industrialise may mean that other factors (like protecting infant industries) are more important in the short to medium term.
- Justified Conclusion: "Comparative advantage should be a main factor, as it provides the fundamental economic rationale for trade. However, it should not be the only factor. Strategic, developmental, and social considerations are also crucial and can, in certain circumstances, override the pure efficiency gains from specialisation. Therefore, it is a necessary but not sufficient guide for trade policy."
Key Takeaways
- Comparative advantage is about opportunity cost, not absolute efficiency.
- It provides a powerful theoretical case for free trade.
- The theory's assumptions (perfect factor mobility, no transport costs, constant returns) are often unrealistic.
- Real-world trade decisions are influenced by strategic, political, and developmental goals.
- A good evaluation weighs the theoretical benefits against the practical limitations and reaches a context-dependent conclusion.
Common Mistakes
- One-sided answer: Only discussing the benefits of comparative advantage and ignoring its limitations. This would score zero for evaluation (AO3).
- Confusing absolute and comparative advantage: This is a fundamental error that shows a lack of understanding.
- No conclusion: A levels-marked essay must have a conclusion. The top band for evaluation requires a "justified conclusion."
- Vague conclusion: A conclusion like "it depends" is not enough. You must say what it depends on and which way the balance tips.
- Lack of development: Simply listing limitations without explaining why they are important. For example, saying "it can cause unemployment" is not enough. You must explain how and why this happens.
- Ignoring the question: The question asks about the extent to which it should be the main factor. The answer must engage with this specific wording.
Things to Be Careful About
- Structure: A clear essay structure (Introduction, Arguments For, Arguments Against, Evaluation, Conclusion) is essential for a high mark.
- Depth over breadth: It is better to develop 3-4 strong points in detail than to list 8 points superficially.
- Use of examples: A simple numerical example to illustrate comparative advantage is very effective for AO1. A real-world example (e.g., the vulnerability of an oil-exporting nation) strengthens the analysis.
- The word "Assess": This is a direct instruction to evaluate. The entire essay must be geared towards making a judgement.
- Diagrams: While a PPC diagram showing the gains from trade could be used, it is not explicitly required by the question or the indicative content. The focus is on the limitations and other factors, which are harder to diagram. A well-written essay without a diagram can still achieve top marks.
Explain the difference between structural unemployment and cyclical unemployment and consider the extent to which structural unemployment is likely to be more damaging to an economy than cyclical unemployment.
Answer
AO1 Knowledge and understanding
Unemployment refers to people who are willing and able to work at the going wage rate but are without a job. Structural unemployment arises from a mismatch between the skills of workers and the requirements of available jobs, often due to long-term changes in the pattern of demand or technology. Cyclical (demand-deficient) unemployment occurs when there is insufficient aggregate demand in the economy to employ all those willing to work, typically during a recession.
AO2 Analysis
Structural unemployment is likely to be more damaging because it tends to be long-term or permanent. Workers in declining industries (e.g. coal mining) may lack the skills needed for growing sectors (e.g. renewable energy), leading to persistent joblessness and a loss of human capital. It can also be concentrated in specific regions, causing localised social and economic decline, including falling house prices and reduced local tax revenues. In contrast, cyclical unemployment is temporary, as it is linked to the business cycle. When the economy recovers and AD rises, cyclical unemployment typically falls. However, cyclical unemployment can affect the whole country simultaneously, and a prolonged downturn can cause significant hardship for many.
AO3 Evaluation
On balance, structural unemployment is likely to be more damaging in the long run because it represents a permanent loss of output and can lead to hysteresis, where the long-term unemployed become detached from the labour market, reducing the economy's potential output. Cyclical unemployment, while painful, is usually reversible through macroeconomic policy. However, the extent of the damage depends on the scale and duration of each type. A very deep and prolonged recession causing high cyclical unemployment could be more damaging in the short term than a small amount of structural unemployment. Therefore, while structural unemployment is generally more damaging, the specific context matters.
Structural unemployment is generally more damaging in the long run due to its permanent nature and potential for hysteresis, but the relative severity depends on the scale and duration of each type.
Background Concept
Unemployment is a key macroeconomic indicator. The main types relevant here are:
- Structural unemployment: Caused by a fundamental change in the structure of the economy. This could be a long-term shift in consumer demand (e.g. from physical media to streaming), technological change (automation replacing workers), or the decline of a major industry (e.g. shipbuilding in the UK). The key feature is a mismatch between the skills workers have and the skills employers need. It is often long-term and can be concentrated in specific regions.
- Cyclical (demand-deficient) unemployment: Caused by a shortfall in aggregate demand (AD). When the economy enters a recession, firms produce less and lay off workers. It is directly linked to the business cycle and is temporary, as it should fall when the economy recovers and AD increases.
The question asks you to explain the difference and then 'consider the extent to which' structural unemployment is more damaging. This 'consider' clause is the AO3 evaluation element, requiring a two-sided judgement.
Understanding the Question
This is a Paper 2 essay part (a), worth 8 marks. The mark scheme is point-based, split into AO1 (3 marks), AO2 (3 marks), and AO3 (2 marks). The command word is 'Explain... and consider the extent to which...'. The first part ('Explain the difference') requires clear definitions and a comparative analysis. The second part ('consider the extent to which...') requires a short, justified evaluation. A one-sided answer that only argues structural unemployment is more damaging will lose marks for evaluation. You must consider the counter-case (when cyclical unemployment might be more damaging) and reach a conclusion.
Approach
- AO1 (Knowledge): Start by defining unemployment itself, then clearly define structural and cyclical unemployment. Ensure the definitions are precise and distinct.
- AO2 (Analysis): Build a comparative analysis. For each type, explain why it could be damaging. The mark scheme specifically says 'must compare the two types'. Structure this as: 'Structural unemployment is more damaging because...' followed by 'However, cyclical unemployment can also be damaging because...'. Use specific examples to develop the points (e.g. a declining industry for structural, a recession for cyclical).
- AO3 (Evaluation): This is the 'consider the extent to which' part. The mark scheme reserves 1 mark for a justified conclusion. Weigh the two types against each other. The key evaluative point is the time period: structural is more damaging in the long run (permanent, hysteresis), cyclical is more damaging in the short run (if severe). Conclude by stating which is generally more damaging, but acknowledge that the context (scale, duration) matters.
Step-by-Step Reasoning
- Define Unemployment: Start with a standard definition: people who are willing and able to work but are without a job. This is a basic knowledge point.
- Define Structural Unemployment: Explain it is caused by a mismatch between skills and job vacancies due to long-term changes in the economy. Give an example, like the decline of the UK's coal mining industry leaving miners without jobs in renewable energy sectors.
- Define Cyclical Unemployment: Explain it is caused by a lack of aggregate demand, rising during recessions and falling during booms. It is temporary and linked to the business cycle.
- Analyse the Damage of Structural Unemployment:
- Permanent: Workers may never return to their old jobs. They need retraining, which is costly and time-consuming.
- Regional: It can devastate entire towns or regions that relied on a single industry, leading to social problems, falling house prices, and reduced local tax revenue.
- Hysteresis: Long-term unemployment can lead to a loss of skills and motivation, making it harder for workers to find jobs even when the economy recovers. This reduces the economy's potential output (LRAS shifts left).
- Analyse the Damage of Cyclical Unemployment:
- Widespread: It affects the entire country, not just specific regions.
- Short-term: It is temporary and should reverse when the economy recovers.
- Severity: A very deep and prolonged recession (like the Great Depression or the 2008 Financial Crisis) can cause immense hardship, with high unemployment lasting for years. This can also lead to some degree of hysteresis.
- Evaluate and Conclude:
- Point for Structural: It is more damaging in the long run because it represents a permanent loss of output and human capital. It is harder to fix.
- Point for Cyclical: It can be more damaging in the short run if it is very severe and widespread. A 10% cyclical unemployment rate for two years is more damaging than a 2% structural unemployment rate.
- Justified Conclusion: State that, on balance, structural unemployment is generally more damaging because of its permanent nature and the risk of hysteresis. However, the 'extent' depends on the specific context. A justified conclusion is not just 'it depends', but 'it depends on X, and therefore in most cases Y is more damaging'.
Key Takeaways
- The ability to clearly define and distinguish between different types of unemployment.
- The skill of building a comparative analysis, not just describing each type in isolation.
- The importance of evaluation: considering both sides of an argument and reaching a justified conclusion, even in a short-answer question.
- The concept of hysteresis and its link to structural unemployment.
Common Mistakes
- One-sided answer: Only arguing that structural unemployment is more damaging, ignoring the potential severity of cyclical unemployment. This loses all evaluation marks.
- No conclusion: Failing to provide a final judgement, which loses the reserved mark for a justified conclusion.
- Vague definitions: Not clearly distinguishing between the two types (e.g. confusing structural with seasonal).
- Descriptive, not analytical: Simply stating facts ('structural unemployment is long-term') without explaining why that makes it more damaging ('...because it leads to a permanent loss of human capital and reduces the economy's potential output').
- Ignoring the 'extent' clause: Not addressing the 'to what extent' part of the question.
Things to Be Careful About
- Command word: 'Explain... and consider' means you must do both. The 'consider' part is the evaluation.
- Mark allocation: 3 marks for knowledge, 3 for analysis, 2 for evaluation. Structure your answer to hit each AO. The analysis must be comparative.
- Examples: Use specific, relevant examples (e.g. UK coal miners, US auto workers in 2008) to support your analysis. This is a hallmark of a top-band answer.
- Terminology: Use precise economic terms like 'hysteresis', 'aggregate demand', 'human capital', 'business cycle'.
Low unemployment is a macroeconomic policy objective for a government.
Assess the extent to which this is most likely to be achieved by supply-side policy.
Introduction
Supply-side policy aims to increase the economy's productive capacity by shifting the Long-Run Aggregate Supply (LRAS) curve to the right. Its primary objective is to improve efficiency and potential output. Low unemployment is a key macroeconomic objective, but the most effective policy to achieve it depends on the cause of the unemployment.
The Case for Supply-Side Policy
Supply-side policy is the most direct and effective tool for reducing structural unemployment. Policies such as government-funded training and education programmes can help workers in declining industries acquire the skills needed for growing sectors, directly addressing the skills mismatch. Reducing the level or duration of unemployment benefits can increase the incentive to seek work, reducing frictional and structural unemployment. Deregulation of labour markets (e.g. making it easier to hire and fire) can encourage firms to take on more workers. By increasing the economy's potential output, these policies can achieve a sustainable, non-inflationary reduction in the natural rate of unemployment.
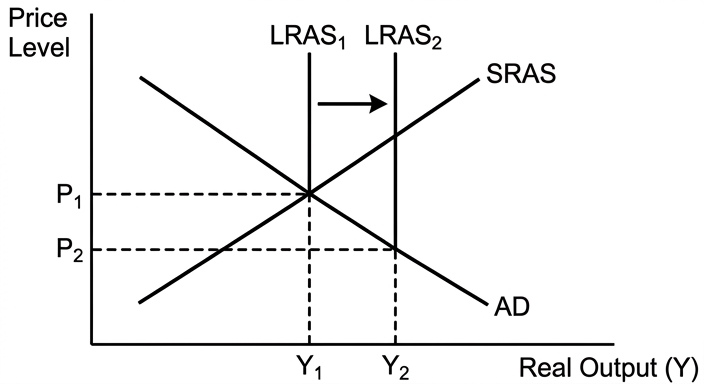
This diagram shows a rightward shift of the LRAS from LRAS1 to LRAS2. If AD remains constant, this leads to a fall in the price level from P1 to P2 and an increase in real output from Y1 to Y2. The increase in real output is associated with higher employment, reducing unemployment without causing demand-pull inflation.
The Case Against Supply-Side Policy
Supply-side policy is largely ineffective against cyclical (demand-deficient) unemployment. If unemployment is caused by a recession and a lack of aggregate demand, increasing the economy's potential output will not create jobs if there is no demand for that output. In fact, it could worsen the problem in the short run if it involves cutting government spending (austerity). Furthermore, supply-side policies often have long time lags. Training programmes can take years to yield results, and infrastructure projects take time to plan and build. They are therefore a poor tool for addressing a sudden rise in unemployment.
Alternative Policies: Demand-Side Management
To reduce cyclical unemployment, expansionary fiscal policy (increased government spending or tax cuts) and expansionary monetary policy (lower interest rates or quantitative easing) are more appropriate. These policies directly boost aggregate demand (AD), shifting the AD curve to the right. This creates jobs in the short run as firms increase production to meet the higher demand.
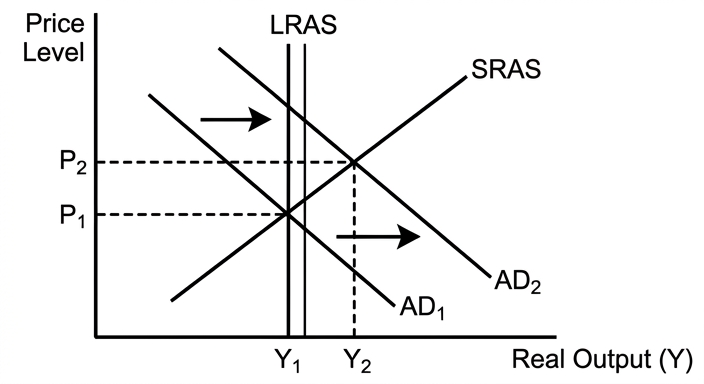
This diagram shows a rightward shift of AD from AD1 to AD2. This leads to an increase in real output from Y1 to Y2 and a rise in the price level from P1 to P2. The increase in output reduces cyclical unemployment. However, this can cause demand-pull inflation, especially if the economy is already near full capacity.
Evaluation
The effectiveness of supply-side policy in achieving low unemployment depends critically on the type of unemployment. For structural unemployment, it is the most effective long-term solution. For cyclical unemployment, it is ineffective, and demand-side policies are superior. However, demand-side policies have their own limitations: they can cause inflation and increase the national debt. A balanced approach is often best. For example, during a recession, a government might use expansionary fiscal policy to boost AD and reduce cyclical unemployment, while simultaneously implementing supply-side policies (like training schemes) to prepare the workforce for the recovery and reduce structural unemployment.
Conclusion
To a significant extent, low unemployment is not most likely to be achieved by supply-side policy alone. While it is essential for tackling structural unemployment and achieving a sustainable, non-inflationary reduction in the natural rate, it is ineffective against cyclical unemployment. For this, demand-side policies are necessary. Therefore, the most effective strategy is a combination of both, tailored to the specific causes of unemployment in the economy at a given time.
Supply-side policy is the most effective tool for reducing structural unemployment, but it is ineffective against cyclical unemployment. Therefore, low unemployment is not most likely to be achieved by supply-side policy alone; a combination of supply-side and demand-side policies, tailored to the cause of unemployment, is the most effective strategy.
Background Concept
This question tests your understanding of the causes of unemployment and the policies used to address them. The key distinction is between:
- Demand-side policies (Fiscal and Monetary): These aim to influence Aggregate Demand (AD). Expansionary policies (e.g., lower taxes, lower interest rates) boost AD, reducing cyclical unemployment. Contractionary policies reduce AD to control inflation.
- Supply-side policies: These aim to increase the economy's productive capacity by shifting the Long-Run Aggregate Supply (LRAS) curve to the right. They focus on improving the quantity and quality of labour, capital, and enterprise. They are the primary tool for reducing the 'natural rate of unemployment' (structural + frictional).
The question asks you to 'assess the extent to which' low unemployment is 'most likely' to be achieved by supply-side policy. This is a classic evaluative command. You must argue both for and against the statement and reach a justified conclusion.
Understanding the Question
This is a Paper 2 essay part (b), worth 12 marks. It is levels-marked, using Table A (AO1/AO2, 8 marks) and Table B (AO3, 4 marks). The mark scheme explicitly states: 'A one-sided response cannot gain any marks for evaluation.' The indicative content suggests you should:
- Define supply-side policy.
- Analyse how it can reduce unemployment (training, benefits, infrastructure).
- Analyse its limitations (time lags, ineffective against cyclical unemployment).
- Analyse alternative policies (fiscal and monetary) and their limitations.
- Evaluate the extent to which supply-side policy is the 'most likely' to succeed.
The top band for AO1/AO2 requires 'detailed knowledge', 'fully developed explanations', and 'accurate and relevant use of analytical tools such as diagrams... which are fully explained'. The top band for AO3 requires a 'justified conclusion' with 'developed, reasoned and well-supported evaluative comment(s)'.
Approach
- Introduction: Define supply-side policy and its objective. State that the best policy depends on the cause of unemployment. This sets up the two-sided argument.
- The Case FOR Supply-Side Policy: Focus on structural unemployment. Explain how specific policies (training, benefits reform, deregulation) reduce the natural rate. Use an AD/AS diagram to show the LRAS shifting right, leading to higher output and lower unemployment without inflation. This is a strong argument.
- The Case AGAINST Supply-Side Policy: Focus on cyclical unemployment. Explain why supply-side policy is ineffective here (it doesn't boost demand). Highlight the problem of time lags. This is the crucial counter-argument.
- Alternative Policies (Demand-Side): Introduce expansionary fiscal and monetary policy. Explain how they boost AD and reduce cyclical unemployment. Use a second AD/AS diagram to show the AD shift. Also, analyse their limitations (inflation, national debt). This shows a balanced understanding.
- Evaluation: This is where you weigh the arguments. The key evaluative criterion is the type of unemployment. Supply-side is best for structural; demand-side is best for cyclical. Acknowledge that a 'mixed' approach is often optimal. This leads to a nuanced conclusion.
- Conclusion: Answer the question directly. State that supply-side policy is not the most likely to achieve low unemployment on its own. It is essential but insufficient. The most effective strategy is a combination of policies.
Step-by-Step Reasoning
- Define Supply-Side Policy: Start by defining it as policies designed to increase the economy's productive capacity by shifting the LRAS curve to the right. Mention its objectives: increasing productivity, efficiency, and potential output.
- Analyse How Supply-Side Policy Reduces Unemployment:
- Training and Education: Reduces structural unemployment by giving workers the skills needed for available jobs. This directly addresses the skills mismatch.
- Reducing Benefits: Reduces frictional and structural unemployment by increasing the incentive to work. This lowers the 'natural rate'.
- Labour Market Deregulation: Makes it easier for firms to hire, reducing the cost of employment and encouraging job creation.
- Infrastructure: Improves the economy's efficiency and can create jobs in the short run, but its main effect is on LRAS.
- Explain the Diagram (LRAS Shift):
- Draw an AD/AS diagram with LRAS, SRAS, and AD.
- Show LRAS shifting right from LRAS1 to LRAS2.
- Explain that this represents an increase in the economy's potential output.
- With AD constant, the new equilibrium is at a lower price level (P2) and a higher real output (Y2).
- The higher output means more people are employed, reducing unemployment. This is a 'non-inflationary' reduction in unemployment.
- Analyse the Limitations of Supply-Side Policy:
- Ineffective against Cyclical Unemployment: If the problem is a lack of demand, increasing supply will not help. Firms will not hire workers to produce goods no one wants to buy.
- Time Lags: Training and infrastructure take years to have an effect. They are useless for a sudden recession.
- Cost: Many supply-side policies (e.g., tax cuts, infrastructure spending) are expensive and may require cuts elsewhere or higher borrowing.
- Political and Social Costs: Reducing benefits or deregulating labour markets can be politically unpopular and may lead to greater inequality.
- Analyse Alternative Policies (Demand-Side):
- Expansionary Fiscal Policy: Lower taxes or higher government spending. This directly increases AD. The multiplier effect amplifies the impact.
- Expansionary Monetary Policy: Lower interest rates or quantitative easing. This stimulates consumption and investment, increasing AD.
- Explain the Diagram (AD Shift):
- Draw a second AD/AS diagram.
- Show AD shifting right from AD1 to AD2.
- Explain that this represents an increase in total spending in the economy.
- The new equilibrium is at a higher price level (P2) and a higher real output (Y2).
- The higher output reduces cyclical unemployment.
- Crucially, explain the limitation: This can cause demand-pull inflation (the rise in the price level). If the economy is already at full capacity, the increase in AD will only cause inflation, not more output.
- Evaluate and Conclude:
- Point for Supply-Side: It is the only sustainable way to reduce the natural rate of unemployment without causing inflation.
- Point for Demand-Side: It is the only effective way to reduce cyclical unemployment in the short run.
- Justified Conclusion: State that the statement is an over-simplification. Supply-side policy is 'most likely' to achieve low unemployment only if the unemployment is structural. For cyclical unemployment, demand-side policy is 'most likely' to succeed. Therefore, the 'extent' is limited. The best approach is a combination of both, tailored to the specific economic circumstances.
Key Takeaways
- The importance of diagnosing the cause of an economic problem before prescribing a policy.
- The distinction between demand-side and supply-side policies and their respective strengths and weaknesses.
- The skill of using AD/AS diagrams to support an argument and explaining them fully in the text.
- The necessity of a two-sided evaluation and a justified conclusion for a 'discuss/assess' question.
- The concept of the 'natural rate of unemployment' and how supply-side policy can reduce it.
Common Mistakes
- One-sided answer: Only arguing for or against supply-side policy. This loses all 4 evaluation marks.
- No conclusion or a vague conclusion: 'It depends' without saying what it depends on and which way the balance tips. This caps the evaluation at Level 1.
- Confusing supply-side with demand-side: For example, arguing that tax cuts are a supply-side policy (they are primarily a demand-side policy, though they can have supply-side effects).
- Poorly explained diagrams: Drawing a diagram but not explaining what the shift represents or what the new equilibrium means. The top band requires diagrams to be 'fully explained'.
- Ignoring the question: Writing a general essay on supply-side policy without linking it specifically to the objective of 'low unemployment'.
- Lack of development: Listing policies without explaining the chain of reasoning (e.g., 'training reduces unemployment' without explaining how it reduces the skills mismatch).
Things to Be Careful About
- Command word: 'Assess the extent to which' requires a clear judgement on the degree of effectiveness.
- Structure: A well-organised essay with clear paragraphs for the case for, the case against, and the evaluation is essential for the top band.
- Diagrams: Use them to support your analysis. The LRAS shift diagram is perfect for the 'for' argument. The AD shift diagram is perfect for the 'against' argument (showing the alternative). Explain each one fully.
- Examples: Use real-world examples to support your points. For example, the UK's 'New Deal' or 'Work Programme' as supply-side policies, or the US Federal Reserve's quantitative easing as a demand-side policy.
- Terminology: Use precise terms like 'natural rate of unemployment', 'hysteresis', 'demand-pull inflation', 'multiplier effect', 'time lag'.