Economics 9708/23 — October/November 2025
Cambridge AS Level · AS Level Data Response and Essays · worked solutions for every part, with the mark scheme
Topics Methods of Government Intervention in Markets · Factors of Production · Scarcity, Choice and Opportunity Cost · Production Possibility Curves · Classification of Goods and Services · Aggregate Demand and Aggregate Supply · +12 more
Malaysia’s uncertain economic prospects
Malaysia is an emerging middle-income country. Its increasing population is an important factor in promoting future economic growth. The country, however, faces two underlying problems. First, the fertility rate, the average number of children a woman can expect to give birth to, has fallen consistently as Malaysia’s economy has developed. This rate is now below the critical level where a population replaces itself. Second, Malaysia has an ageing population, with an increasing proportion of its population over 65 years of age. In 2015 the average age of Malaysia’s population was 28.2 years; in 2030 it is forecast to reach 34.1 years. Malaysia’s forecast total population to 2027 and its ageing population from 2017 to 2022 are shown in Figs. 1.1 and 1.2 below.
Fig. 1.1 Total population of Malaysia, 2017 to 2027
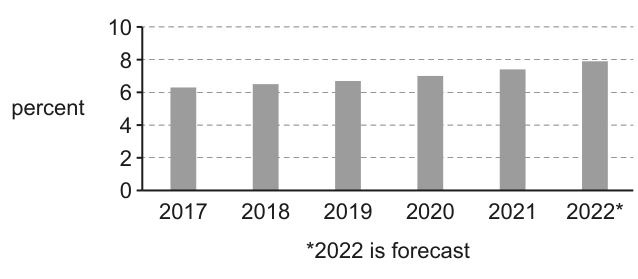
Fig. 1.2 Share of population older than 65 years in Malaysia, 2017 to 2022

The key issue for Malaysia’s government is whether it is prepared for this fundamental shift in its population. There is plenty of scope for optimism. The economy appears to have recovered from the shock of the COVID-19 pandemic. Its growth rate in 2021 and the 2022 forecast was above the government’s target of 5.1%, with substantial growth in exports of electrical and electronic goods, palm oil, gas and oil supplies. Unemployment is below 4% and the current account of the balance of payments was projected to have a record surplus in 2022.
Economists, however, fear that Malaysia’s government and its people are not ready to meet the challenges of an ageing population. In a recent survey, 70% of respondents felt it was the duty of the young to take care of the elderly, but they were also concerned that the economy could not cope with the pressure on its human capital and other resources. More resources will have to be allocated to meet the needs of the elderly.
It was further argued that Malaysia needed a proper plan for dealing with this situation. According to one economist, free childcare for working parents was essential and tax incentives should be used to keep more elderly workers in employment.
Source: Saw Yee Fung, Low rates impact on Malaysia’s human capital and economic development, The Star (KL) 15 October 2022.
Use the information in Figs. 1.1 and 1.2 to compare the change in Malaysia’s total population from 2017 to 2022 with the change in its ageing population from 2017 to 2022.
Answer
Both Malaysia’s total population and its ageing population (share of people over 65) increased between 2017 and 2022. The share of the ageing population increased at a faster rate than the growth in total population over this period.
Both total and ageing population increased between 2017 and 2022, with the share of the ageing population rising at a faster rate.
Background Concept
Interpreting data from charts and graphs is a core economics skill. To compare two trends, first identify the overall direction of change for each variable (increasing, decreasing, or stable) over the time period, then compare their rates of change. For population data, this may refer to total population size, population growth rates, or the share of specific demographic groups in the total population.
Understanding the Question
This question asks you to compare how Malaysia’s total population changed between 2017 and 2022 with how its ageing population (share of people over 65) changed over the same period, using only data from Figs. 1.1 and 1.2. The command word "compare" requires identifying both similarities and differences in the two trends. Fig. 1.1 shows a steady upward trend in its vertical axis variable (total population growth rate) from ~6.2% in 2017 to a forecast 8.1% in 2022. Fig. 1.2 (per the mark scheme) shows the share of the population over 65 also rose over 2017–2022, at a faster rate than the total population measure.
Approach
First, identify the trend for total population from Fig. 1.1: it is rising steadily. Second, use the question context and mark scheme guidance to identify the ageing population trend: it is also rising, and faster than the total population trend. State both points clearly, as each is worth 1 mark.
Step-by-Step Reasoning
- Fig. 1.1 shows the total population growth rate rose consistently from 2017 to 2022, meaning total population is growing at an increasing rate.
- The question stem and mark scheme confirm the share of Malaysia’s population aged over 65 also increased between 2017 and 2022.
- The key difference is that the ageing population share rose at a faster rate than the total population growth rate over the period.
- These two points earn the full 2 marks: 1 for both trends rising, 1 for the faster rate of increase in the ageing share.
Key Takeaways
- For 2-mark comparison questions, you need one point of similarity and one point of difference, or two clear comparative points.
- Always state the overall trend first before comparing rates of change.
- If a figure is missing, use the question stem and mark scheme guidance to identify the required trend, as the mark scheme reflects the original figure’s content.
Common Mistakes
- Stating only one trend (e.g. only that total population increased) without comparison, which earns only 1 mark.
- Quoting figures without identifying the overall trend, which is not credited in data-response questions.
- Claiming the ageing population share rose slower than total population, which contradicts the mark scheme and loses the second mark.
Things to Be Careful About
- Check axis labels: Fig. 1.1’s axis is labelled "percent", so it shows a growth rate or demographic share, not absolute population size, but the upward trend is clear.
- The 2022 figure is marked as a forecast, but this does not affect the comparison of trends for this question.
Explain one example of ‘what to produce’ in Malaysia that may have to change in order to meet the needs of its ageing population.
Answer
One example of a 'what to produce' decision is healthcare and elderly care services. Malaysia will need to produce more of these services, such as hospitals, nursing homes and medical equipment, to meet the higher demand for medical attention and long-term care from its growing ageing population. This requires shifting resources away from the production of goods and services targeted at younger age groups.
More healthcare and elderly care services (e.g. hospitals, nursing homes) should be produced, as the ageing population has higher demand for medical and long-term care.
Background Concept
The fundamental economic problem of scarcity means all societies have limited resources but unlimited wants, so they must answer three basic resource allocation questions: what to produce, how to produce it, and for whom to produce. The "what to produce" question refers to the choice of which goods and services an economy will make with its limited resources, and in what quantities. As the structure of demand changes (e.g. from an ageing population), the pattern of production must also change to reflect new consumer needs.
Understanding the Question
This question asks for one example of a "what to produce" decision Malaysia may need to make to meet the needs of its ageing population, and an explanation of why this change is needed. It is worth 2 marks: 1 for identifying the good/service, 1 for explaining the link to the ageing population’s needs. The question stem context tells you Malaysia has a growing ageing population with higher needs for medical and long-term care.
Approach
First, identify a good or service with higher demand from an ageing population, such as healthcare, elderly care, or medical equipment. Second, explain that the ageing population’s higher demand for this good/service requires shifting resources away from other types of production to produce more of it.
Step-by-Step Reasoning
- The "what to produce" question requires choosing which goods and services to make with limited resources. An ageing population has different consumption needs than a young population: older people typically require more healthcare, medical services, nursing home care, and specialist medical equipment.
- A valid example is healthcare and elderly care services, such as hospitals, nursing homes, and mobility aids for older people.
- To meet higher demand for these services from the growing ageing population, Malaysia must allocate more resources (labour, capital, land) to producing these services. This means shifting resources away from producing goods and services targeted at younger age groups, such as toys, schools, or youth entertainment.
- This earns 2 marks: 1 for the example of healthcare/elderly care, 1 for the explanation that the ageing population’s higher demand requires a shift in resource allocation.
Key Takeaways
- The "what to produce" question is a core part of the fundamental economic problem, driven by changing consumer demand and scarce resources.
- When answering "what to produce" questions, always link the change in production to a change in the needs or demand of the target population.
- Any good or service with higher demand from the target group is acceptable, as long as you explain the link.
Common Mistakes
- Giving an example of "how to produce" (e.g. using more labour to produce healthcare) instead of "what to produce", which does not answer the question.
- Stating the example without explaining why it is needed for the ageing population, which earns only 1 mark.
- Choosing an example unrelated to the ageing population, such as producing more electronics, which is irrelevant.
Things to Be Careful About
- The question asks for an example of what to produce, so focus on the type of good/service, not the method of production.
- You do not need to mention opportunity cost explicitly, though it is implied: producing more healthcare means producing less of other goods.
With the help of a production possibility curve (PPC) diagram, consider the extent to which Malaysia’s productive capacity is likely to change with its projected change in total population.
Answer
A production possibility curve (PPC) illustrates the maximum output combinations of two goods an economy can produce with its current resources and technology.
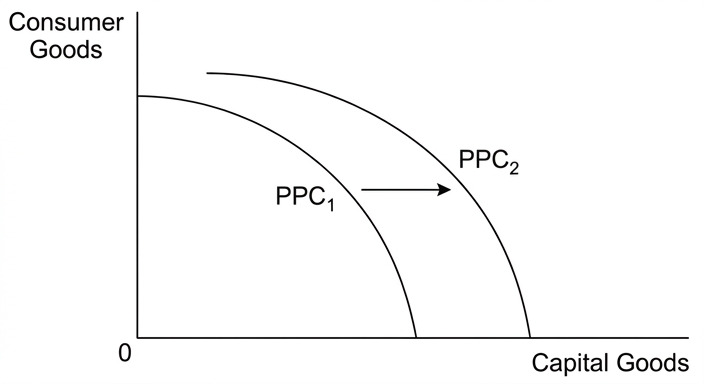
The diagram has 'Consumer Goods' on the vertical axis and 'Capital Goods' on the horizontal axis. The initial PPC (PPC1) is concave to the origin, and shifts outward to PPC2, showing increased productive capacity for both goods.
Population growth expands the labour force, a key factor of production, so the PPC shifts outward, meaning Malaysia can produce more of both goods than before.
The extent of the shift depends on two factors. First, higher productivity of additional workers (from training or technology) will increase the size of the outward shift. Second, if the retirement age is not raised, a larger share of the population will be retired, limiting the growth of the effective labour force and reducing the size of the shift.
Malaysia’s productive capacity will increase, shifting the PPC outward, but the size of the shift depends on productivity improvements and the labour force participation rate of older people.
Background Concept
A production possibility curve (PPC) is a diagram showing the maximum possible output combinations of two goods or services an economy can produce with its current resources and technology, assuming all resources are fully and efficiently utilised. The concave (bowed out) shape of the PPC reflects increasing opportunity cost, as resources are not perfectly adaptable between the two goods. An outward shift of the PPC represents economic growth: an increase in the economy’s productive capacity, meaning it can produce more of both goods than before. Shifts are caused by changes in the quantity or quality of factors of production (land, labour, capital, enterprise) or improvements in technology.
Understanding the Question
This question asks you to use a PPC diagram to consider the extent to which Malaysia’s productive capacity will change as its total population grows. The command words "with the help of a diagram" mean a labelled PPC is required, and "consider the extent" means you must evaluate how large the change in productive capacity will be, not just state that it will increase. The question is worth 4 marks: 1 for correctly labelled axes, 1 for a valid PPC, 1 for the outward shift, and 1 for valid evaluation of the extent of the shift.
Approach
- Draw a correctly labelled PPC with two appropriate goods on the axes (e.g. consumer goods and capital goods), showing an outward shift to represent increased productive capacity from population growth.
- Explain that a larger population increases the labour force, a key factor of production, so the PPC shifts outward.
- Evaluate the extent of the shift by considering factors that increase or decrease its size: productivity of additional workers, and labour force participation of the ageing population.
Step-by-Step Reasoning
- Diagram construction (3 marks):
- Label the vertical axis 'Consumer Goods' and the horizontal axis 'Capital Goods' (any two distinct goods are acceptable).
- Draw the initial PPC (PPC1) as a concave curve from the vertical axis to the horizontal axis, reflecting increasing opportunity cost.
- Draw a second PPC (PPC2) to the right of PPC1, with both endpoints further from the origin than PPC1's endpoints, showing an outward shift that increases productive potential for both goods.
- Analysis of the shift:
- Total population growth increases the size of the labour force, a factor of production. More workers mean the economy can produce more output of both goods, so the PPC shifts outward from PPC1 to PPC2, representing an increase in Malaysia’s productive capacity.
- Evaluation of the extent of the shift (1 mark):
- The size of the outward shift depends on the productivity of additional workers. If the government invests in training and technology to raise productivity, the shift will be larger, as each worker produces more output.
- If the retirement age remains unchanged, a growing share of the population will be retired, so the effective labour force may not grow as much as total population. This limits the size of the outward shift, or could even reverse it if the dependency ratio rises too much, putting pressure on workers to support retirees.
- Any other relevant comment on factors affecting the shift size (e.g. skill level of new workers) is also creditworthy.
Key Takeaways
- An outward PPC shift always represents increased productive capacity, caused by more/better factors of production or technological progress.
- When asked to "consider the extent" of a change, evaluate factors that make the change larger or smaller, not just state that the change will happen.
- Population growth only increases the PPC if additional people are of working age and participate in the labour market.
Common Mistakes
- Drawing a PPC that does not touch both axes, or using unlabelled axes, which loses the first two marks.
- Showing a movement along the PPC instead of a shift, which confuses a change in production with a change in productive capacity.
- Stating only that the PPC will shift outward without evaluating the extent of the shift, which loses the final mark.
- Forgetting to link the shift to growth in the labour force from population growth.
Things to Be Careful About
- The question requires a PPC diagram, so you must draw it and explain what the shift shows in the prose.
- Label every part of the diagram clearly: axes, initial PPC, shifted PPC, and direction of shift.
- Evaluation must focus on the extent of the shift, not just its direction: comments on the size of the shift are required for the evaluation mark.
Assess whether the Malaysian government should provide free childcare to working parents.
Answer
The Malaysian government should provide free childcare to working parents. First, it reduces childcare costs for low-income families, lowering poverty and income inequality. Second, it allows more parents (especially women) to work, raising household incomes and living standards. Third, higher household income increases consumption, boosting aggregate demand and economic growth, while also increasing tax revenue.
However, there are significant drawbacks. First, free childcare has a high opportunity cost, as the spending could be used for healthcare, pensions or infrastructure instead. Second, it distorts the price mechanism, leading to overconsumption of childcare and inefficient resource allocation. Third, funding it via higher taxes could discourage work and investment, reducing productivity. Fourth, it may reduce competition and quality in the private childcare sector.
On balance, the government should provide free childcare, as the benefits of higher labour force participation and reduced inequality outweigh the costs, provided the policy is targeted to low-income families to minimise fiscal costs and market distortion.
The Malaysian government should provide free childcare to working parents, as the benefits of higher labour force participation and reduced inequality outweigh the opportunity cost and market distortion risks, provided the policy is targeted to minimise fiscal costs.
Background Concept
Government intervention in markets occurs when the government acts to influence the production, distribution or consumption of goods and services. Direct provision is a common form of intervention, where the government produces and provides a good/service for free or at a subsidised price, often for merit goods: goods that are under-consumed in a free market because consumers underestimate their long-term benefits, or because they are unaffordable for low-income groups. Childcare is a merit good: it delivers long-term benefits for children’s development, enables parents to work, and reduces inequality, but is under-consumed due to high private costs and imperfect information about its benefits.
When evaluating government intervention, key criteria include: the benefits of correcting market failure (e.g. reducing inequality, increasing merit good consumption), the opportunity cost of government spending, the impact on market efficiency (e.g. price mechanism distortion, impact on private sector provision), and the impact on work and investment incentives.
Understanding the Question
This question asks you to assess whether the Malaysian government should provide free childcare to working parents. The command word "assess" requires developing two sides of the argument (why it should, and why it should not), evaluating trade-offs between the two sides, and reaching a justified conclusion. It is worth 6 marks: up to 3 marks for analysis of why the government should provide free childcare, up to 3 marks for analysis of why it should not, and up to 2 marks for evaluation (consideration of both sides and a reasoned conclusion, with 1 mark reserved for the conclusion).
Approach
- Develop the case for free childcare: list benefits such as reduced poverty, higher labour force participation, higher consumption and growth, explaining each causal link.
- Develop the case against free childcare: list drawbacks such as high opportunity cost, price mechanism distortion, reduced private sector efficiency, and higher tax burdens, explaining each causal link.
- Evaluate the two sides by weighing benefits against costs, considering factors such as fiscal cost size, labour force participation gains, and alternative policy options.
- Reach a justified conclusion that answers the precise question: whether the government should provide free childcare, with a clear reason for your verdict.
Step-by-Step Reasoning
- Case for free childcare (up to 3 marks):
- Free childcare reduces costs for low-income working parents, lowering poverty and income inequality, as childcare is a large share of household costs for low-income families.
- It enables more parents (particularly women, who are more likely to leave the workforce for childcare) to work, raising household incomes, living standards, and the size of the labour force, which supports economic growth.
- Higher household income from dual-earner households increases total consumption, raising aggregate demand and economic growth, while also increasing tax revenue for the government.
- Each point earns credit if the causal chain is explained (e.g. "free childcare reduces costs -> more parents can work -> household income rises -> consumption rises").
- Case against free childcare (up to 3 marks):
- Free childcare has a high opportunity cost: spending on this policy could instead be allocated to higher-priority areas such as healthcare for the ageing population, pensions, or infrastructure, which may deliver greater social benefits.
- It distorts the price mechanism by making childcare artificially cheap, leading to overconsumption (e.g. parents using more hours of childcare than they would at market price) and inefficient resource allocation, as some childcare workers could be more productive in other sectors.
- Free provision reduces incentives for private childcare providers to compete, lowering quality, efficiency and innovation in the sector, as private firms have no incentive to improve.
- Funding free childcare requires higher taxes, which could discourage work and investment, reducing overall economic productivity and offsetting gains from higher labour force participation.
- Evaluation and conclusion (up to 2 marks):
- The decision depends on weighing benefits (higher labour force participation, reduced inequality, higher growth) against costs (opportunity cost, market distortion). For an emerging middle-income country like Malaysia with a growing ageing population and a need to raise productivity, the benefits are likely to outweigh the costs, but the policy should be targeted to low-income working parents to minimise fiscal costs and avoid excessive overconsumption.
- The conclusion must be justified: it is not enough to say "it depends" — you must state which side is stronger and why, based on the analysis above. The final mark is reserved for this justified conclusion.
Key Takeaways
- When assessing a government policy, you must develop both sides of the argument (benefits and drawbacks) with clear economic reasoning for each.
- Evaluation requires weighing the two sides against an explicit criterion (here, net social benefit) and reaching a justified verdict, not just listing pros and cons.
- For 6-mark assess questions, up to 3 marks are available for each side, and up to 2 for evaluation, with 1 mark reserved for the conclusion, so ensure you allocate time to write the conclusion.
Common Mistakes
- Writing a one-sided answer that only presents the case for or against free childcare, which forfeits all evaluation marks (maximum 3 marks if only one side is presented).
- Listing points without explaining the causal chain (e.g. "free childcare reduces inequality" without explaining how), which limits analysis marks.
- Ending with a summary of both sides instead of a justified conclusion, which loses the reserved 1 mark.
- Failing to link analysis to Malaysia’s specific context (ageing population, emerging middle-income status), which makes the answer less applied and relevant.
Things to Be Careful About
- Clearly separate the analysis of why the government should and should not provide free childcare, so the examiner can see both sides are developed.
- Evaluation marks are only available if both viewpoints are explicitly considered; a one-sided answer receives no evaluation marks.
- The conclusion must answer the exact question asked: whether the Malaysian government should provide free childcare, not a general statement about childcare policy.
Excluding net exports, assess the likely impact of the change in Malaysia’s total population on aggregate demand.
Answer
Malaysia’s population growth is likely to increase aggregate demand (AD). First, a larger population means more consumers, so total consumption (C) rises. Second, higher demand for housing and infrastructure increases business investment (I). Third, the government must spend more on public services for the larger population, raising government expenditure (G). Fourth, a larger workforce increases total national income, further boosting consumption.
However, the increase in AD may be limited. First, if population growth causes higher unemployment, consumption will fall as unemployed people have lower income. Second, higher demand may cause inflation, reducing real incomes and consumption. Third, higher government spending on population-related services may force tax rises or spending cuts elsewhere, reducing AD. Fourth, households may save more due to uncertainty, limiting the rise in consumption.
Overall, AD is likely to increase, but the size of the increase depends on the rate of job creation, inflation and government fiscal policy.
The change in total population is likely to increase aggregate demand, but the magnitude of the increase depends on the rate of employment, inflation and government fiscal policy.
Background Concept
Aggregate demand (AD) is the total demand for goods and services in an economy at a given price level, calculated as AD = C + I + G + (X - M), where C is household consumption, I is business investment, G is government spending, and (X - M) is net exports. AD shifts when any of its components change, due to factors such as population change, household income, interest rates, government policy or consumer confidence. A rightward shift indicates higher AD, while a leftward shift indicates lower AD. This question excludes net exports, so we only consider the impact of population change on C, I and G.
Understanding the Question
This question asks you to assess the likely impact of Malaysia’s projected total population change on aggregate demand, excluding net exports. The command word "assess" requires developing two sides of the argument (why AD will increase, and why AD may be limited or fall), evaluating trade-offs, and reaching a justified conclusion. It is worth 6 marks: up to 3 marks for analysis of why AD increases, up to 3 marks for analysis of why AD is limited or falls, and up to 2 marks for evaluation (consideration of both sides and a reasoned conclusion, with 1 mark reserved for the conclusion).
Approach
- Develop the case that population growth increases AD: link population growth to higher consumption (more consumers), higher investment (more demand for housing/infrastructure), and higher government spending (more public services needed).
- Develop the case that population growth does not increase AD as much, or may reduce it: link population growth to higher unemployment, inflation, higher saving, and constrained government budgets.
- Evaluate the two sides by weighing factors that increase AD against those that limit it, using the context of Malaysia’s economy (low unemployment, strong growth prospects).
- Reach a justified conclusion that answers the precise question: what is the net likely impact of population change on AD, excluding net exports.
Step-by-Step Reasoning
- Case for higher AD (up to 3 marks):
- A larger total population means more consumers, so total household consumption (C) rises as more people spend on goods and services.
- Population growth increases demand for housing and infrastructure, so businesses increase investment (I) to meet this demand, raising AD.
- The government needs to spend more on public services such as healthcare, education and transport for the larger population, so government expenditure (G) rises, increasing AD.
- A larger population expands the workforce, increasing total national income. Higher total income allows households to spend more, further boosting consumption and AD.
- Each point earns credit if the link to the AD component is explained (e.g. "more people -> more consumers -> C rises -> AD shifts right").
- Case for limited or lower AD (up to 3 marks):
- If population growth is faster than job creation, unemployment rises. Unemployed people have lower or no income, so total consumption falls, limiting the increase in AD.
- Higher population growth may cause demand-pull inflation if supply cannot keep up with higher demand. Inflation reduces the real value of household incomes, so consumption falls, offsetting the rise in AD from more consumers.
- Increased demand for public services may strain the government budget, forcing it to cut spending elsewhere or raise taxes to fund extra spending. Higher taxes reduce household disposable income and business profits, lowering C and I, which reduces AD.
- If households are uncertain about future economic prospects due to rapid population growth, they may increase saving and reduce consumption, so the rise in AD from population growth is smaller than expected.
- Evaluation and conclusion (up to 2 marks):
- The net impact of population growth on AD depends on the economy’s ability to absorb the additional population. Malaysia currently has low unemployment (below 4%) and strong export growth, so it is likely that additional population can be absorbed into the workforce, leading to higher income and consumption. However, if population growth outstrips job creation and supply capacity, inflation and unemployment will rise, limiting the increase in AD.
- The conclusion must be justified: for example, "The likely impact of Malaysia’s population growth is an increase in aggregate demand, as the economy is currently growing strongly and can absorb additional workers, but the size of the increase will depend on the rate of job creation and inflation." The final mark is reserved for this justified conclusion.
Key Takeaways
- When assessing the impact of a change on AD, break the analysis down into the four components of AD (C, I, G, X-M) and link the change to each relevant component.
- For "assess" questions, you must develop both sides of the argument, even if one side is stronger, to earn evaluation marks.
- Excluding net exports means you do not need to consider the impact of population change on exports or imports, only on C, I and G.
Common Mistakes
- Writing a one-sided answer that only explains why AD will increase, which forfeits all evaluation marks (maximum 3 marks if only one side is presented).
- Forgetting to exclude net exports from the analysis, wasting time on export/import effects that are not credited.
- Quoting figures from the extract (e.g. the 5.1% growth target) without linking them to the impact on AD, which does not earn marks.
- Ending with a summary of both sides instead of a justified conclusion, which loses the reserved 1 mark.
Things to Be Careful About
- Ensure you clearly link each factor to a specific component of AD, so the examiner can see you understand how AD is calculated.
- The evaluation must consider both positive and negative impacts on AD, and reach a verdict on the net likely impact, not just state that "it depends".
- Use the context of Malaysia’s economy (low unemployment, strong growth) to support your conclusion, as this makes the answer more applied and relevant.
In 2022 the supply of root ginger from Nigeria, Africa’s biggest producer, fell by 20%. Market demand was expected to grow by more than 5%.
With the help of a demand and supply diagram, explain how the market equilibrium for root ginger in Nigeria is likely to change and consider how certain you are of the new market price.
Answer
AO1 Knowledge and understanding
Market equilibrium is the price and quantity at which the quantity demanded equals the quantity supplied, with no tendency for change.
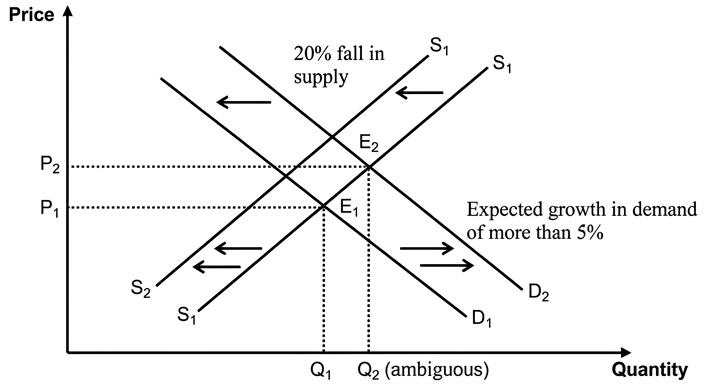
The diagram shows the market for root ginger in Nigeria. The initial equilibrium is at E1, with price P1 and quantity Q1. The fall in supply shifts the supply curve leftwards from S1 to S2. The expected growth in demand shifts the demand curve rightwards from D1 to D2.
AO2 Analysis
The decrease in supply creates excess demand at the original price P1, putting upward pressure on price. The increase in demand also creates excess demand at P1, further reinforcing the upward pressure. Both shifts therefore push the equilibrium price higher. The new equilibrium is at E2, with a higher price P2. The effect on equilibrium quantity is ambiguous: the supply reduction tends to lower quantity, while the demand increase tends to raise it. The net change in quantity depends on the relative sizes of the two shifts.
AO3 Evaluation
I am certain that the new equilibrium price will be higher than P1, because both shifts push price in the same direction. However, I am less certain about the exact magnitude of the price increase. The final price depends on the relative size of the shifts: if the demand increase is much larger than the supply fall, the price rise will be greater. It also depends on the price elasticities of demand and supply. If demand is price inelastic (PED < 1), the same shift in supply will cause a larger price change. If supply is price inelastic (PES < 1), the same shift in demand will also cause a larger price change. Without knowing these elasticities and the exact sizes of the shifts, the precise new price cannot be predicted with certainty.
The new equilibrium price will be higher, but the exact magnitude is uncertain and depends on the relative sizes of the shifts and the price elasticities of demand and supply.
Background Concept
Market equilibrium is a fundamental concept in microeconomics. It is the point where the plans of buyers (demand) and sellers (supply) are consistent. At the equilibrium price, the quantity that consumers wish to buy exactly equals the quantity that producers wish to sell. Any deviation from this price creates either a surplus (excess supply) or a shortage (excess demand), which then drives the price back towards equilibrium.
A shift in the demand curve occurs when a factor other than the good's own price changes, such as consumer income, tastes, or the price of related goods. A shift in the supply curve occurs when a factor other than the good's own price changes, such as input costs, technology, or the number of sellers. A movement along a curve is a change in quantity demanded or supplied caused solely by a change in the good's own price.
Price elasticity of demand (PED) measures the responsiveness of quantity demanded to a change in price. Price elasticity of supply (PES) measures the responsiveness of quantity supplied to a change in price. These elasticities determine how much price and quantity adjust when a curve shifts.
Understanding the Question
This question presents a real-world scenario: the supply of root ginger from Nigeria fell by 20%, while market demand was expected to grow by more than 5%. You are asked to:
- Explain how the market equilibrium (price and quantity) is likely to change.
- Consider how certain you are of the new market price.
The command word is "explain" for the first part, which requires a chain of reasoning. The phrase "and consider" introduces an evaluative element (AO3), asking you to assess the degree of certainty. The question explicitly requires a demand and supply diagram.
The mark scheme allocates 3 marks for AO1 (knowledge and understanding, including the diagram), 3 marks for AO2 (analysis of the two shifts), and 2 marks for AO3 (evaluation of certainty).
Approach
- Define equilibrium (AO1).
- Draw and label a diagram showing the initial equilibrium, then a leftward shift of supply and a rightward shift of demand (AO1).
- Analyse the effect of the supply fall on price and quantity (AO2).
- Analyse the effect of the demand increase on price and quantity (AO2).
- Combine the two effects to determine the overall impact on price and quantity (AO2).
- Evaluate the certainty of the price outcome by discussing the relative size of the shifts and the role of PED and PES (AO3).
Step-by-Step Reasoning
Step 1: Define equilibrium.
Market equilibrium is the price and quantity where the quantity demanded equals the quantity supplied. At this point, there is no tendency for the price to change unless an external factor shifts demand or supply.
Step 2: Draw the diagram.
Start with a standard demand and supply diagram. Label the vertical axis "Price" and the horizontal axis "Quantity". Draw the initial demand curve D1 and the initial supply curve S1. They intersect at the initial equilibrium point E1, with price P1 and quantity Q1.
Now, apply the two changes:
- The supply of root ginger fell by 20%. This is a decrease in supply, meaning at every price, producers are willing and able to supply less. This shifts the supply curve to the left, from S1 to S2.
- Market demand was expected to grow by more than 5%. This is an increase in demand, meaning at every price, consumers are willing and able to buy more. This shifts the demand curve to the right, from D1 to D2.
Both shifts can be shown on the same diagram. The new intersection of S2 and D2 is the new equilibrium E2, with price P2 and quantity Q2.
Step 3: Analyse the effect of the supply fall.
At the original price P1, the supply reduction means that the quantity supplied falls from Q1 to a lower level. The quantity demanded at P1 remains unchanged (assuming no change in demand yet). This creates excess demand (a shortage) at P1. This shortage puts upward pressure on the price. As the price rises, the quantity demanded contracts (a movement up along the demand curve) and the quantity supplied expands (a movement up along the new supply curve S2). The process continues until a new equilibrium is reached at a higher price and a lower quantity (if only supply had changed).
Step 4: Analyse the effect of the demand increase.
At the original price P1, the demand increase means that the quantity demanded rises from Q1 to a higher level. The quantity supplied at P1 remains unchanged (assuming no change in supply yet). This also creates excess demand at P1. This shortage puts upward pressure on the price. As the price rises, the quantity demanded contracts (a movement up along the new demand curve D2) and the quantity supplied expands (a movement up along the supply curve). The process continues until a new equilibrium is reached at a higher price and a higher quantity (if only demand had changed).
Step 5: Combine the two effects.
Both the supply decrease and the demand increase create excess demand at the original price, so both push the price upwards. Therefore, we can be certain that the new equilibrium price (P2) will be higher than the original price (P1).
The effect on equilibrium quantity is ambiguous. The supply decrease, on its own, would reduce quantity. The demand increase, on its own, would increase quantity. The net change in quantity depends on which shift is larger. If the demand increase is larger than the supply decrease, the new quantity will be higher. If the supply decrease is larger, the new quantity will be lower. If they are equal, the quantity will remain the same. The question states the supply fell by 20% and demand grew by more than 5%, but without knowing the exact magnitudes in terms of units, we cannot determine the net effect on quantity.
Step 6: Evaluate the certainty of the price outcome.
While we are certain the price will rise, we are less certain about the exact magnitude of the rise. Two factors determine this:
-
Relative size of the shifts: A larger demand increase relative to the supply decrease will result in a larger price increase. The question gives percentage changes, but the actual impact on price depends on the slopes of the curves and the absolute changes in quantity.
-
Price elasticities:
- Price elasticity of demand (PED): If demand for root ginger is price inelastic (PED < 1), consumers are not very responsive to price changes. This means that for a given shift in supply, the price will rise by more than if demand were elastic. This is because consumers continue to buy relatively large quantities even as the price rises.
- Price elasticity of supply (PES): If supply of root ginger is price inelastic (PES < 1), producers cannot easily increase output in response to a higher price. This means that for a given shift in demand, the price will rise by more than if supply were elastic. This is because the supply response is limited, so the shortage persists, driving the price up further.
Without specific information on the elasticities and the exact magnitudes of the shifts, we cannot predict the precise new price. Therefore, our certainty is limited to the direction of the price change, not its magnitude.
Key Takeaways
- When both demand and supply shift, the effect on price is determined by the direction of both shifts. If both push price in the same direction, the price change is certain in direction.
- The effect on quantity is ambiguous when the shifts push quantity in opposite directions.
- Elasticities (PED and PES) are crucial in determining the magnitude of price and quantity changes following a shift in a curve.
- A well-labelled diagram is essential for explaining market equilibrium changes.
- Evaluation in economics often involves discussing the degree of certainty and the factors that influence the outcome.
Common Mistakes
- Drawing only one shift: Some candidates only show the supply shift or the demand shift, ignoring the simultaneous change. Both must be shown.
- Confusing a shift with a movement: A change in supply or demand is a shift of the curve, not a movement along it. A movement along the curve is a change in quantity supplied or demanded caused by a change in the good's own price.
- Not labelling the diagram fully: Axes (Price, Quantity), curves (D1, D2, S1, S2), and equilibrium points (E1, E2) must be clearly labelled.
- Asserting a definite change in quantity: The question does not provide enough information to determine the net change in quantity. Stating that quantity will definitely rise or fall is incorrect.
- Ignoring the evaluation part: The "and consider" clause requires a separate evaluative discussion. Simply stating the price will rise is not enough for full marks.
- Not using economic terminology: Terms like "excess demand", "equilibrium", "shift", "elasticity" should be used correctly.
Things to Be Careful About
- Read the question carefully: It asks about the market for root ginger in Nigeria. Keep your answer focused on this specific market.
- Use the data provided: The question gives specific percentage changes (supply fell by 20%, demand grew by more than 5%). Use these figures in your analysis to show application.
- Distinguish between the two shifts: Clearly explain the effect of each shift separately before combining them.
- The evaluation should be specific: Discuss the relative size of the shifts and the role of PED and PES in determining the magnitude of the price change. A general statement like "it depends" is not sufficient.
- Diagram first: Draw the diagram before writing the analysis. This helps structure your thinking and ensures you have a visual representation to refer to.
Assess the ways in which producers of root ginger might be able to stabilise their incomes.
Introduction
Producers of root ginger face income instability due to fluctuating market prices caused by unpredictable supply shocks (e.g., weather, disease) and demand changes. Stabilising their incomes requires policies that either reduce price volatility or directly support their revenue. This essay assesses the effectiveness of subsidies, minimum prices, and buffer stock schemes in achieving this goal.
Subsidies
A subsidy is a payment from the government to producers, reducing their costs of production. This shifts the supply curve to the right, lowering the market price but increasing the quantity traded. For producers, the subsidy per unit provides a direct addition to their revenue, effectively raising the price they receive (the market price plus the subsidy). This can stabilise incomes by providing a guaranteed minimum revenue stream, especially during periods of low market prices. However, subsidies are expensive for the government and may encourage overproduction, leading to wasted resources and potentially lower market prices in the long run. They also create a dependency on government support, which may not be sustainable.
Minimum Price
A minimum price (price floor) is a legally imposed price above the market equilibrium. This guarantees producers a minimum revenue per unit. For root ginger, a minimum price would ensure that even when market conditions are poor, producers receive a price that covers their costs and provides a stable income. This encourages consistent production levels. However, if the minimum price is set above the equilibrium, it creates a surplus (excess supply) of ginger. The government must then purchase the surplus to maintain the price, which is costly. Storage and disposal of the surplus also pose problems. The policy can be effective in stabilising incomes but is inefficient and expensive.
Buffer Stock Scheme
A buffer stock scheme involves a government agency buying ginger when prices are low (to support the price) and selling from its stock when prices are high (to moderate the price rise). This aims to keep the price within a target band, thereby stabilising producer incomes. By buying surplus at low prices, the scheme provides a guaranteed market and income floor for producers. By releasing stock at high prices, it prevents prices from rising too high, which could benefit consumers but might also reduce producer revenue in the short term. The scheme requires significant storage and management costs. There is a risk of financial loss if the agency buys high and sells low, or if the stored ginger spoils. The scheme's success depends on accurate forecasting and sufficient funding.
Evaluation
All three policies can help stabilise incomes, but each has significant drawbacks. Subsidies are the most direct way to support income but are fiscally expensive and can distort production incentives. Minimum prices are effective at guaranteeing a price floor but inevitably lead to costly surpluses. Buffer stock schemes are more market-oriented and can smooth price fluctuations, but they require sophisticated management and carry financial risks.
The most appropriate policy depends on the specific circumstances of the Nigerian root ginger market. If the government has limited fiscal capacity, a buffer stock scheme might be more sustainable than a permanent subsidy or a minimum price that requires continuous surplus purchases. However, if the main source of income instability is unpredictable supply shocks, a buffer stock scheme is particularly well-suited to absorbing these shocks. If the problem is a long-term decline in prices, a subsidy or minimum price might be more appropriate.
Conclusion
While subsidies, minimum prices, and buffer stock schemes can all contribute to stabilising the incomes of root ginger producers, each has significant limitations. A buffer stock scheme is likely the most effective approach for stabilising incomes in the face of fluctuating supply and demand, as it directly addresses price volatility without creating permanent surpluses or requiring continuous fiscal outlays. However, its success depends on effective management and adequate funding. A combination of a buffer stock scheme with a limited, targeted subsidy during periods of extreme market stress might offer the most robust solution.
A buffer stock scheme is likely the most effective way to stabilise incomes for root ginger producers, as it directly addresses price volatility without the permanent costs of subsidies or the surplus problem of minimum prices, though its success depends on effective management and adequate funding.
Background Concept
Income instability for agricultural producers is a common problem due to the nature of agricultural markets. Supply is often subject to unpredictable shocks (weather, pests, disease), while demand is often price inelastic in the short run. This combination leads to large price fluctuations: a small change in supply causes a large change in price. This price volatility directly translates into income volatility for producers, as their income is price multiplied by quantity sold.
Governments can intervene in agricultural markets to stabilise prices and incomes. The main policy tools are:
- Subsidies: A direct payment to producers, which lowers their costs and increases their revenue.
- Minimum prices (price floors): A legally set minimum price above the market equilibrium, which guarantees a minimum revenue per unit.
- Buffer stock schemes: A government agency buys and sells the good to keep its price within a target range.
Each policy has different implications for government budgets, market efficiency, and producer incentives.
Understanding the Question
The question asks you to "assess the ways in which producers of root ginger might be able to stabilise their incomes." The command word "assess" requires you to:
- Analyse (AO1/AO2) the mechanisms of at least two different ways (policies) that could stabilise incomes.
- Evaluate (AO3) the strengths and weaknesses of these policies, and reach a justified conclusion on their overall effectiveness.
The mark scheme is levels-based (Table A for AO1/AO2, Table B for AO3). The top band (Level 3) for AO1/AO2 requires detailed knowledge, fully developed explanations, and accurate use of analytical tools. The top band (Level 2) for AO3 requires a justified conclusion and developed, reasoned evaluative comments.
The question is specific: it is about stabilising the incomes of root ginger producers, not a general discussion of agricultural policy. A response that fails to link the policies to income stability will not score highly.
Approach
- Introduction: Define the problem (income instability for root ginger producers) and state the policies to be assessed.
- Analyse Policy 1: Subsidies. Explain how a subsidy works, how it affects producer revenue and income, and its strengths and weaknesses.
- Analyse Policy 2: Minimum Price. Explain how a minimum price works, how it stabilises income, and its strengths and weaknesses.
- Analyse Policy 3: Buffer Stock Scheme. Explain how a buffer stock scheme works, how it stabilises income, and its strengths and weaknesses.
- Evaluation: Compare the three policies, weighing their pros and cons. Discuss the conditions under which each might be more or less effective.
- Conclusion: Provide a justified judgement on the most effective way to stabilise incomes, addressing the specific requirements of the question.
Step-by-Step Reasoning
Step 1: Introduction
Start by framing the problem. Root ginger producers face income instability because their revenue (price x quantity) is volatile. This is due to factors like weather affecting supply and changing consumer tastes affecting demand. The question asks for ways to stabilise this income. Three main policy options are subsidies, minimum prices, and buffer stock schemes.
Step 2: Analyse Subsidies
- Mechanism: A subsidy is a payment per unit of output from the government to producers. This reduces the producers' costs, effectively shifting the supply curve to the right. The market price falls, but the price producers receive (the market price plus the subsidy) is higher than the original equilibrium price.
- Income Stabilisation: The subsidy provides a guaranteed addition to revenue. Even if the market price falls, the subsidy ensures a minimum income. This can stabilise income by making it less dependent on market fluctuations.
- Strengths: Direct and effective at raising producer income. Can be targeted to specific groups of producers.
- Weaknesses: Expensive for the government (requires tax revenue). Can lead to overproduction and inefficiency. May create dependency and discourage innovation. Can be difficult to remove once introduced.
Step 3: Analyse Minimum Price
- Mechanism: The government sets a minimum price (floor) above the market equilibrium. Producers are guaranteed this price for their output. At this price, quantity supplied exceeds quantity demanded, creating a surplus.
- Income Stabilisation: The minimum price guarantees a minimum revenue per unit. This provides a stable income floor for producers, protecting them from low market prices.
- Strengths: Simple to understand and implement. Provides a clear and predictable income floor.
- Weaknesses: Creates a persistent surplus. The government must buy the surplus, which is costly. Storage and disposal of the surplus (e.g., selling it on world markets at a loss) add further costs. Can lead to inefficient allocation of resources.
Step 4: Analyse Buffer Stock Scheme
- Mechanism: A government agency (or marketing board) intervenes in the market to keep the price within a target band. When the market price falls below the lower band, the agency buys the good, increasing demand and pushing the price up. When the price rises above the upper band, the agency sells from its stock, increasing supply and pushing the price down.
- Income Stabilisation: By preventing prices from falling too low, the scheme provides a guaranteed minimum income for producers. By preventing prices from rising too high, it can also help stabilise consumer prices, which can indirectly support demand and producer incomes in the long run.
- Strengths: Directly addresses price volatility. Can be self-financing if the agency buys low and sells high. Does not create a permanent surplus or require continuous government spending.
- Weaknesses: Requires significant storage and management costs. Risk of financial loss if the agency buys high and sells low. Risk of spoilage of the stored good. Requires accurate forecasting of market conditions. May be difficult to manage if the underlying trend in prices is strongly upward or downward.
Step 5: Evaluation
Now, compare the three policies. The key criteria for evaluation are:
- Effectiveness in stabilising income: All three can be effective, but buffer stock schemes directly target price volatility, which is the main source of income instability.
- Cost to the government: Subsidies and minimum prices are expensive and require continuous fiscal outlays. Buffer stock schemes can be self-financing if managed well.
- Market distortion: Subsidies and minimum prices create significant distortions (overproduction, surpluses). Buffer stock schemes are less distorting as they only intervene at the margins.
- Sustainability: Subsidies and minimum prices create dependency and are difficult to remove. Buffer stock schemes can be more sustainable if they are well-managed.
- Specific context: For root ginger, which is a perishable good, a buffer stock scheme carries a high risk of spoilage. This is a significant weakness. A minimum price or subsidy might be more practical if storage is a major issue.
Step 6: Conclusion
The conclusion must be a justified judgement. It should not simply summarise the points. It should state which policy is most effective and why, based on the evaluation. For example: "While all three policies can stabilise incomes, a buffer stock scheme is likely the most effective approach as it directly addresses price volatility without the permanent costs of subsidies or the surplus problem of minimum prices. However, its success depends on effective management and adequate funding. A combination of a buffer stock scheme with a limited, targeted subsidy during periods of extreme market stress might offer the most robust solution."
Key Takeaways
- Income instability for producers is often caused by price volatility in agricultural markets.
- Subsidies, minimum prices, and buffer stock schemes are three common policy interventions.
- Each policy has distinct mechanisms, strengths, and weaknesses.
- Evaluation requires comparing policies against criteria like cost, effectiveness, market distortion, and sustainability.
- A justified conclusion must be specific to the question and based on the preceding analysis.
Common Mistakes
- One-sided response: The question asks you to "assess," which requires a balanced discussion of both strengths and weaknesses. A one-sided response (only praising or only criticising a policy) cannot score high marks for evaluation.
- General discussion of policies: The question is specifically about stabilising the incomes of root ginger producers. A response that discusses the general pros and cons of subsidies without linking them to income stability will not score well.
- Lack of development: Simply stating that a subsidy "helps producers" is not enough. You must explain the mechanism (how it affects costs, supply, price, and revenue) and why it stabilises income.
- No conclusion: The top band for evaluation requires a justified conclusion. An essay that ends without a conclusion cannot achieve full marks.
- Ignoring the context: The question mentions root ginger from Nigeria. While you don't need specific knowledge of the Nigerian economy, you should keep your analysis relevant to an agricultural market in a developing country (e.g., considering the cost of storage, the availability of government funds).
- Descriptive rather than analytical: Level 1 responses are "largely descriptive." You must explain why and how things happen, not just describe what a policy is.
Things to Be Careful About
- Use economic terminology: Use terms like "price floor", "surplus", "supply shift", "revenue", "price elasticity", "government expenditure", "market distortion".
- Structure your essay: A clear structure (introduction, analysis of each policy, evaluation, conclusion) is essential for a well-organised response.
- Depth over breadth: It is better to analyse two or three policies in detail than to list five policies superficially. The top band requires "fully developed explanations."
- Link analysis to income: For each policy, explicitly state how it stabilises income. For example, "The subsidy provides a guaranteed addition to revenue, which stabilises income by making it less dependent on market price fluctuations."
- Evaluation must be developed: Don't just say "this policy has drawbacks." Explain what the drawbacks are, why they matter, and under what conditions they are more or less significant.
- The conclusion must be justified: Your conclusion should flow from your evaluation. State which policy you think is most effective and give the reasons for your judgement.
The Gini coefficient for South Korea was estimated to be 0.39 in 2019 and 0.33 in 2022.
Explain what this data means, how it might be used by the government of South Korea and consider its usefulness.
Answer
The Gini coefficient is a measure of income inequality, ranging from 0 (perfect equality) to 1 (perfect inequality). The fall from 0.39 in 2019 to 0.33 in 2022 indicates that income became more evenly distributed in South Korea.
The government can use this data to evaluate the effectiveness of redistributive policies, such as progressive taxation and social welfare programmes. It can also guide future policy decisions, for example by increasing transfer payments if inequality remains high.
However, the Gini coefficient has limitations. It does not show which income groups have gained or lost, nor does it capture wealth inequality or access to services. Its usefulness also depends on the accuracy of the data. Despite these limitations, it remains a valuable indicator for comparing inequality over time and across countries.
The Gini coefficient is a useful indicator of income inequality but has limitations that mean it should be used alongside other measures.
Background Concept
The Gini coefficient is a statistical measure of distribution, often used to measure income or wealth inequality. It ranges from 0 to 1, where 0 means perfect equality (everyone has the same income) and 1 means perfect inequality (one person has all the income). It is derived from the Lorenz curve, which plots the cumulative share of income against the cumulative share of the population. The Gini coefficient is the ratio of the area between the Lorenz curve and the line of perfect equality to the total area under the line of perfect equality.
Understanding the Question
The question provides data: South Korea's Gini coefficient fell from 0.39 in 2019 to 0.33 in 2022. It asks you to explain what this means, how the government might use it, and consider its usefulness. The command word "explain" requires you to define and interpret the data, and "consider" requires evaluation, so you need to discuss both strengths and limitations.
Approach
First, define the Gini coefficient and interpret the change. Then, discuss how the government can use this data for policy evaluation and formulation. Finally, evaluate the usefulness by considering both strengths and limitations, and conclude with a balanced judgement.
Step-by-Step Reasoning
-
Definition: The Gini coefficient measures income inequality. A value of 0.39 in 2019 means income distribution was fairly unequal. A fall to 0.33 indicates a reduction in inequality, meaning the income gap narrowed.
-
Government use: The government can use this trend to assess whether its policies (e.g., progressive taxation, welfare) are working. If the coefficient is falling, it may indicate success. It can also guide future policy decisions, such as increasing transfer payments if inequality remains high.
-
Evaluation: The Gini coefficient is useful for tracking overall inequality over time and for comparing countries. However, it does not show which income groups have gained or lost, nor does it capture wealth inequality or access to services. Its usefulness also depends on the accuracy of the data. Despite these limitations, it remains a valuable indicator.
Key Takeaways
- The Gini coefficient is a standard measure of inequality.
- A falling coefficient indicates reduced inequality.
- Governments can use it to evaluate policy.
- It has limitations that must be considered.
Common Mistakes
- Confusing the Gini coefficient with other coefficients.
- Not stating the range (0 to 1).
- Forgetting to mention that it measures income inequality, not wealth.
- One-sided evaluation: only strengths or only weaknesses.
Things to Be Careful About
- Use the correct range: 0 to 1.
- Interpret the data correctly: a fall means more equality.
- In evaluation, mention both usefulness and limitations.
- Avoid overstating the data; acknowledge it is a tool.
Assess why it is easier for a government such as that of South Korea to redistribute income rather than redistribute wealth.
Introduction
Income is a flow of money received over time, while wealth is a stock of assets accumulated. Redistributing income is easier because it is measured regularly and can be taxed through existing policies. This essay assesses why it is easier to redistribute income rather than wealth.
Analysis
Redistributing Income
Income is easier to redistribute because it is measured through wages, salaries, and profits. Governments can use progressive income tax and transfer payments (e.g., benefits, unemployment) to adjust income distribution. These policies are already in place and can be adjusted quickly. For example, increasing the top marginal tax rate or increasing welfare payments can reduce income inequality.
Redistributing Wealth
Wealth is harder to redistribute because it is difficult to measure accurately. Assets include property, shares, and offshore accounts that are often undervalued or hidden. Wealth taxes, inheritance taxes, and capital gains taxes are subject to avoidance and legal loopholes. Wealthy individuals may have political influence to resist such taxes. For example, inheritance tax can be avoided through trusts.
Evaluation
While income redistribution is easier due to existing systems and regular measurement, it may not address the root causes of inequality, which is wealth accumulation. Wealth redistribution, though harder, can be more effective in reducing long-term inequality. However, the ease of redistribution also depends on the political will and the structure of the economy. In South Korea, with a developed tax system, income redistribution is relatively straightforward, but wealth redistribution faces significant challenges.
Conclusion
It is easier for a government to redistribute income because income is a regular flow that can be taxed and transferred through existing fiscal systems. Wealth redistribution is more challenging due to measurement difficulties and avoidance, but it may be necessary for addressing deep-seated inequality.
It is easier to redistribute income because it is a regular flow and can be taxed through existing systems, whereas wealth redistribution is more difficult due to measurement and avoidance issues.
Background Concept
Income is a flow of money received over time, such as wages, salaries, interest, and profits. Wealth is a stock of assets, including property, land, savings, and shares. Redistribution refers to policies that transfer income or wealth from the rich to the poor to reduce inequality. Common policies include progressive income tax, transfer payments, inheritance tax, and wealth tax.
Understanding the Question
The question asks you to assess why it is easier for a government to redistribute income rather than wealth. "Assess" means you need to consider both sides: reasons why income redistribution is easier, and reasons why wealth redistribution is harder. You must then evaluate and reach a justified conclusion. The question is set in the context of South Korea, but general economic principles apply.
Approach
First, define income and wealth. Then, explain the reasons for redistributing income: it is a regular flow, measured through tax systems, and can be adjusted via progressive taxation and transfer payments. Then, discuss the challenges of redistributing wealth: measurement difficulties, valuation issues, avoidance, and political resistance. Finally, evaluate both sides and conclude which is easier and why.
Step-by-Step Reasoning
-
Income redistribution: Income is recorded regularly through wages and salaries. Governments can use progressive income tax to take a larger share from high earners and use transfer payments to give to low earners. These policies are already in place and can be adjusted through the budget. This makes income redistribution relatively easy.
-
Wealth redistribution: Wealth is accumulated over time and is harder to measure. Assets like property and shares require valuation, which can be subjective. Wealth taxes are difficult to administer and can be avoided through offshore accounts, trusts, and legal loopholes. Wealthy individuals may also lobby against such taxes. This makes wealth redistribution more difficult.
-
Evaluation: While income redistribution is easier, it may not be sufficient if wealth inequality is high. Wealth redistribution, though harder, can be more effective in reducing long-term inequality. However, the ease of redistribution also depends on the political context and the structure of the economy. In South Korea, with a developed tax system, income redistribution is feasible, but wealth redistribution faces significant obstacles.
Key Takeaways
- Income is a flow, wealth is a stock.
- Income redistribution is easier due to existing systems and regular measurement.
- Wealth redistribution is harder due to measurement and avoidance.
- A balanced assessment requires considering both sides and reaching a justified conclusion.
Common Mistakes
- Not distinguishing between income and wealth.
- One-sided argument: only discussing income redistribution or only wealth redistribution.
- Forgetting to provide a conclusion.
- Ignoring the specific context of South Korea.
Things to Be Careful About
- Clearly define income and wealth.
- Use economic terminology: progressive tax, transfer payments, avoidance.
- Ensure the conclusion is justified and addresses the question.
- Avoid overgeneralising; the ease of redistribution depends on context.
For your economy or for one that is known to you, explain three causes of inflation and consider which of these causes is likely to be most important in 2025.
Answer
Inflation is a sustained rise in the general price level.
Three causes of inflation in the UK economy:
-
Demand-pull inflation occurs when aggregate demand (AD) grows faster than aggregate supply (AS). In the UK, a strong post-pandemic recovery in consumer spending, supported by low unemployment and rising wages, has increased AD. As the economy nears full capacity, the extra demand bids up prices.
-
Cost-push inflation arises when rising costs of production force firms to raise prices. In the UK, higher global energy prices following the conflict in Ukraine have increased firms' fuel and electricity costs. Higher import prices due to a weaker pound have also raised the cost of imported raw materials and components, pushing up the general price level.
-
Imported inflation occurs when a fall in the exchange rate raises the domestic price of imports. The UK's depreciation of sterling since 2016 has made imports more expensive, directly raising the CPI and also raising costs for firms that use imported inputs.
Consideration of the most important cause in 2025:
By 2025, the relative importance of these causes will depend on the economic context. If global energy prices have stabilised and the exchange rate has recovered, cost-push and imported inflation may have subsided. However, if the UK economy is operating near full capacity with strong wage growth, demand-pull inflation is likely to be the most persistent cause. Given the UK's tight labour market and the lagged effects of previous monetary stimulus, demand-pull inflation is likely to be the most important cause in 2025.
Demand-pull inflation is likely to be the most important cause in 2025, given the UK's tight labour market and the lagged effects of previous monetary stimulus.
Background Concept
Inflation is a sustained increase in the general price level of goods and services in an economy over a period of time. It is measured by indices such as the Consumer Price Index (CPI). The main causes of inflation are:
-
Demand-pull inflation: This occurs when aggregate demand (AD) in an economy rises faster than aggregate supply (AS). When the economy is at or near full capacity, the increase in demand cannot be met by an equivalent increase in output, so prices are bid upwards. Factors that increase AD include higher consumer spending (C), increased investment (I), higher government spending (G), or a rise in net exports (X-M).
-
Cost-push inflation: This occurs when the costs of production rise, forcing firms to increase their selling prices to maintain profit margins. Sources of cost increases include higher wages, higher raw material prices, higher energy costs, and higher indirect taxes.
-
Imported inflation: This is a specific type of cost-push inflation that occurs when the prices of imported goods and services rise. This can be due to a depreciation of the domestic currency (making imports more expensive in domestic currency terms) or a rise in global prices of key imports such as oil or food.
Understanding the Question
This question asks you to (a) explain three causes of inflation for a named economy (the UK is used here, but any economy you know well is acceptable), and (b) consider which of these causes is likely to be most important in 2025. The command word "explain" requires you to define each cause and describe the mechanism by which it leads to inflation, using the context of the named economy. The command word "consider" requires a short evaluation: you must weigh the three causes against each other and reach a justified conclusion about which is most important in 2025. The question is point-based, with marks allocated as follows: up to 3 marks for AO1 (knowledge and understanding), up to 3 marks for AO2 (analysis), and up to 2 marks for AO3 (evaluation).
Approach
- Define inflation to establish knowledge (AO1).
- Identify and explain three causes of inflation, each with a clear mechanism and a specific example from the UK economy (AO1 + AO2). For each cause, explain the chain of causation: what triggers it, how it affects prices, and why it is relevant to the UK.
- Consider the relative importance of the three causes in 2025 (AO3). This requires a short evaluation: discuss the conditions that would make each cause more or less important, and then reach a justified conclusion about which is likely to be the most important. The conclusion must be specific to the named economy and the year 2025.
Step-by-Step Reasoning
Step 1: Define inflation.
Inflation is a sustained rise in the general price level. This definition is essential for AO1 marks.
Step 2: Explain three causes of inflation in the UK.
Cause 1: Demand-pull inflation.
- Mechanism: An increase in AD (e.g., due to higher consumer spending, investment, government spending, or net exports) leads to an excess of demand over supply at the current price level. Firms respond by raising prices.
- UK example: The UK economy experienced a strong post-pandemic recovery in 2021-2022, with consumer spending boosted by pent-up savings and low unemployment. This increased AD, and as the economy approached full capacity, prices rose.
- Chain of reasoning: Higher consumer confidence -> increased consumption -> AD shifts right -> at full capacity, output cannot rise enough -> price level rises (demand-pull inflation).
Cause 2: Cost-push inflation.
- Mechanism: An increase in the costs of production (e.g., wages, raw materials, energy) reduces firms' profit margins. Firms pass on these higher costs to consumers by raising prices.
- UK example: The conflict in Ukraine led to a sharp rise in global energy prices, increasing UK firms' fuel and electricity costs. Additionally, the depreciation of sterling made imported raw materials more expensive.
- Chain of reasoning: Higher global energy prices -> higher production costs for UK firms -> firms raise prices to maintain profit margins -> cost-push inflation.
Cause 3: Imported inflation.
- Mechanism: A depreciation of the domestic currency makes imports more expensive in domestic currency terms. This directly raises the CPI (as imported goods become more expensive) and also raises costs for firms that use imported inputs.
- UK example: Sterling depreciated significantly after the 2016 Brexit referendum and again in 2022. This made imports of food, fuel, and manufactured goods more expensive, contributing to inflation.
- Chain of reasoning: Depreciation of sterling -> imports become more expensive in pounds -> higher prices for imported consumer goods (direct effect) + higher costs for firms using imported inputs (indirect effect) -> general price level rises.
Step 3: Consider which cause is most important in 2025 (AO3).
To evaluate, consider the likely economic conditions in the UK in 2025:
- If global energy prices have stabilised or fallen, cost-push inflation from energy may have subsided.
- If the exchange rate has stabilised or appreciated, imported inflation may be less significant.
- However, if the UK labour market remains tight (low unemployment, high vacancies) and wage growth is strong, demand-pull inflation may persist. The lagged effects of previous monetary and fiscal stimulus may also continue to boost AD.
Conclusion: Given the UK's tight labour market and the likelihood that demand-side pressures will persist, demand-pull inflation is likely to be the most important cause in 2025. This conclusion is justified by the specific conditions of the UK economy.
Key Takeaways
- Inflation has multiple causes, and a good answer identifies and explains each one clearly.
- For each cause, build a clear chain of reasoning from the trigger to the effect on prices.
- Use specific, real-world examples from a named economy to demonstrate application.
- For the evaluative part, weigh the causes against each other based on likely future conditions, and reach a justified conclusion.
Common Mistakes
- Defining inflation incorrectly: A common error is to define inflation as "a rise in prices" without specifying "sustained" or "general price level." A one-off price rise is not inflation.
- Confusing causes: Some students confuse demand-pull and cost-push inflation. Remember: demand-pull starts from the demand side; cost-push starts from the supply side.
- Not naming an economy: The question explicitly asks for "your economy or one that is known to you." A generic answer without a named economy loses application marks.
- Not evaluating: The "consider" clause requires a short evaluation. Simply listing three causes without weighing them loses the AO3 marks.
- No conclusion: The mark scheme reserves 1 mark for a justified conclusion. A conclusion that simply says "it depends" without a clear verdict is not sufficient.
Things to Be Careful About
- Ensure each cause is distinct. Imported inflation is a type of cost-push inflation, but it is often treated separately in the syllabus. Make sure you explain the mechanism clearly.
- Use the correct terminology: "demand-pull," "cost-push," "imported inflation."
- For the evaluation, be specific about the year 2025. Your reasoning should be forward-looking and based on plausible economic conditions.
- Keep the answer concise. This is an 8-mark question, so do not write an essay. Focus on clear, developed points.
Assess whether supply-side policy or demand-side policy is the better way of reducing this inflation.
Introduction
Inflation is a sustained rise in the general price level. The question asks whether supply-side policy or demand-side policy is the better way to reduce this inflation, where 'this inflation' refers to the causes identified in part (a) — demand-pull, cost-push, and imported inflation. Demand-side policies aim to influence aggregate demand (AD), while supply-side policies aim to increase aggregate supply (AS). The better policy depends on the type of inflation and the economic context.
The case for demand-side policy
Demand-side policies, such as contractionary monetary policy (higher interest rates) or contractionary fiscal policy (higher taxes or lower government spending), are effective against demand-pull inflation. By reducing AD, they directly address the source of the upward pressure on prices.
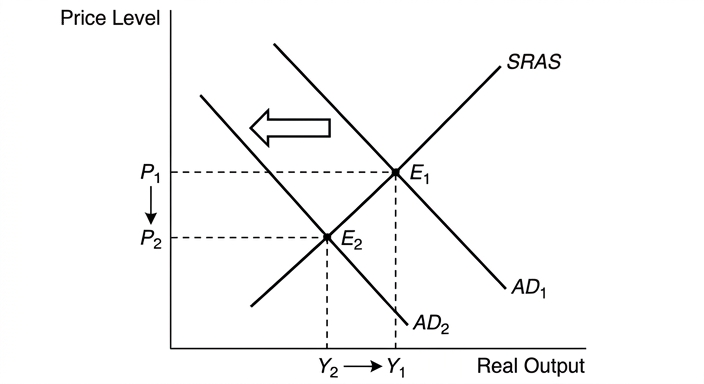
As shown in the diagram, a contractionary policy shifts AD leftwards from AD1 to AD2. The price level falls from P1 to P2, and real output falls from Y1 to Y2. This demonstrates how demand-side policy can reduce demand-pull inflation, but at the cost of lower output and potentially higher unemployment.
However, demand-side policy has significant drawbacks. It is ineffective against cost-push inflation, as it does not address rising costs. It can also cause a recession if applied too aggressively, and there are time lags before interest rate or tax changes affect spending.
The case for supply-side policy
Supply-side policies aim to increase the productive capacity of the economy, shifting the LRAS curve to the right. This can reduce both demand-pull and cost-push inflation. By increasing AS, the economy can meet higher demand without price rises. By improving productivity and reducing costs, supply-side policies can directly address cost-push pressures.
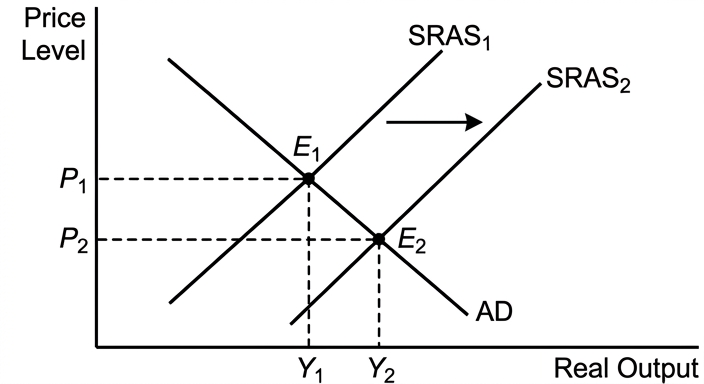
As shown in the diagram, an increase in AS from AS1 to AS2 reduces the price level from P1 to P2 while increasing real output from Y1 to Y2. This is a 'win-win' outcome: lower inflation and higher output.
However, supply-side policies take a long time to have an effect. Training, infrastructure, and technological improvements require years to bear fruit. They are also expensive and may not guarantee results. Furthermore, they cannot control external factors such as global oil prices or imported inflation.
Evaluation
The choice between supply-side and demand-side policy depends on the type of inflation and the time horizon. For demand-pull inflation in the short run, demand-side policy is more effective and direct. However, it comes with the cost of lower output and employment. For cost-push inflation, supply-side policy is more appropriate in the long run, as it addresses the root cause of rising costs. However, it is ineffective in the short run.
In the context of the UK in 2025, if the main cause is demand-pull inflation from a tight labour market, a combination of policies may be best: contractionary demand-side policy to cool demand in the short run, combined with supply-side policies to increase productive capacity in the long run. This balanced approach minimises the trade-off between inflation and output.
Conclusion
Neither policy is universally better. For reducing demand-pull inflation quickly, demand-side policy is more effective. For reducing cost-push inflation sustainably, supply-side policy is superior. Given the likely mix of causes in the UK in 2025, a combination of both policies, with a greater emphasis on supply-side measures in the long term, is the most effective strategy.
Neither policy is universally better; the optimal approach depends on the type of inflation. For demand-pull inflation, demand-side policy is more effective in the short run, but for cost-push inflation, supply-side policy is superior in the long run. A combination of both policies, with a greater emphasis on supply-side measures in the long term, is the most effective strategy for the UK in 2025.
Background Concept
This question requires an understanding of two broad categories of macroeconomic policy:
-
Demand-side policies: These aim to influence aggregate demand (AD). They include monetary policy (e.g., changing interest rates, money supply) and fiscal policy (e.g., changing government spending and taxes). Contractionary demand-side policies reduce AD and are used to combat demand-pull inflation.
-
Supply-side policies: These aim to increase the productive capacity of the economy, shifting the long-run aggregate supply (LRAS) curve to the right. They include policies to improve education and training, infrastructure, technology, and labour market flexibility. They can reduce both demand-pull and cost-push inflation by enabling the economy to produce more at lower cost.
The key analytical tool is the AD/AS model. A shift in AD affects the price level and real output. A shift in AS also affects the price level and real output, but in a different way.
Understanding the Question
This is a 12-mark levels-marked essay part (part (b) of a Paper 2 essay). The command word is "Assess whether...", which requires a two-sided evaluation and a justified conclusion. The question is specifically about reducing "this inflation" — the inflation identified in part (a). Therefore, the answer must be tailored to the causes of inflation (demand-pull, cost-push, imported) and the context of the named economy (the UK).
The mark scheme allocates 8 marks for AO1 and AO2 (knowledge, understanding, and analysis) and 4 marks for AO3 (evaluation). The top band for AO1/AO2 requires detailed knowledge, fully developed explanations, and accurate use of analytical tools (diagrams). The top band for AO3 requires a justified conclusion with developed evaluative comments.
Approach
- Introduction: Define inflation and state the two policy types. Acknowledge that the better policy depends on the type of inflation.
- First side: The case for demand-side policy. Explain how contractionary monetary/fiscal policy reduces AD and thus demand-pull inflation. Use an AD/AS diagram. Then discuss the drawbacks (ineffective against cost-push, causes recession, time lags).
- Second side: The case for supply-side policy. Explain how supply-side policies increase AS, reducing both demand-pull and cost-push inflation. Use an AD/AS diagram. Then discuss the drawbacks (long time lags, expensive, cannot control external factors).
- Evaluation: Weigh the two approaches against each other. Consider the type of inflation, the time horizon, and the specific context of the UK in 2025. Argue that a combination of policies is likely best.
- Conclusion: Provide a justified judgement that answers the question directly.
Step-by-Step Reasoning
Step 1: Define the context.
The inflation in question is the one explained in part (a): demand-pull, cost-push, and imported. The answer must address how each policy type can reduce each type of inflation.
Step 2: Explain demand-side policy.
- Contractionary monetary policy: The central bank raises interest rates. This increases the cost of borrowing, reducing consumption and investment. AD falls, reducing demand-pull inflation.
- Contractionary fiscal policy: The government raises taxes or cuts spending. This reduces disposable income and aggregate demand, again reducing demand-pull inflation.
- AD/AS diagram: Show AD shifting left, price level falling, but real output also falling (a recessionary gap).
- Drawbacks: Time lags (monetary policy takes 12-18 months to affect inflation fully). Ineffective against cost-push inflation (raising interest rates does not reduce energy costs). Can cause unemployment.
Step 3: Explain supply-side policy.
- Policies: Investment in education and training increases labour productivity. Investment in infrastructure reduces transport costs. Deregulation and tax reforms can incentivise work and investment.
- Effect: LRAS shifts right. The economy can produce more at the same price level. This reduces both demand-pull inflation (by increasing capacity to meet demand) and cost-push inflation (by reducing unit costs).
- AD/AS diagram: Show AS shifting right, price level falling, and real output rising. This is a favourable outcome.
- Drawbacks: Long time lags (years). Expensive. May not work if the economy is already at full capacity. Cannot control external factors like global oil prices.
Step 4: Evaluate.
- For demand-pull inflation: Demand-side policy is more direct and effective in the short run. However, it causes a recession. Supply-side policy is better in the long run but does not help immediately.
- For cost-push inflation: Demand-side policy is ineffective and may worsen the recession. Supply-side policy is more appropriate as it addresses the cost side.
- For the UK in 2025: If the main cause is demand-pull from a tight labour market, a temporary contractionary policy may be needed. However, to avoid a recession, supply-side policies should be implemented simultaneously to increase capacity. A combination is best.
Step 5: Conclude.
The conclusion should state that neither policy is universally better; the optimal choice depends on the type of inflation and the time horizon. For the UK in 2025, a combination of both policies is recommended.
Key Takeaways
- Always tailor the answer to the specific question. Here, "this inflation" refers to the causes from part (a).
- Use AD/AS diagrams to illustrate the effects of each policy. Explain the diagrams fully in the text.
- Develop both sides of the argument. A one-sided answer cannot score evaluation marks.
- The conclusion must be justified and specific to the question. Avoid vague statements like "it depends."
Common Mistakes
- One-sided answer: Only discussing the benefits of one policy without considering the other. This loses all evaluation marks.
- Generic answer: Discussing supply-side and demand-side policies in general, without linking them to the specific inflation problem. The mark scheme warns that this limits the mark to mid-Level 2.
- No diagrams: The question does not explicitly require a diagram, but the mark scheme's top band for AO1/AO2 mentions "accurate and relevant use of analytical tools such as diagrams." Including and explaining AD/AS diagrams strengthens the analysis.
- No conclusion: The top band for AO3 requires a justified conclusion. An answer that ends without a conclusion cannot achieve Level 2 for evaluation.
- Confusing policy types: Some students confuse supply-side policy with demand-side policy. Remember: supply-side policy affects AS; demand-side policy affects AD.
Things to Be Careful About
- Ensure the diagrams are correctly labelled: axes (Price Level, Real Output), curves (AD, SRAS, LRAS), and equilibrium points.
- Explain the diagrams in the text. Do not just draw them and assume the examiner will understand.
- Use the correct terminology: "contractionary monetary policy," "expansionary fiscal policy," "supply-side policy."
- The evaluation should be developed. Do not just list pros and cons; weigh them against each other and reach a judgement.
- The conclusion should be a clear answer to the question: "Assess whether supply-side policy or demand-side policy is the better way." State which is better, or under what conditions each is better.
Explain two reasons why an economy may have a deficit on the current account of its balance of payments and consider whether its government is likely to be concerned about this deficit.
Answer
AO1 Knowledge and understanding
The current account of the balance of payments records transactions in goods, services, primary income, and secondary income between residents of one country and the rest of the world. A current account deficit occurs when the value of imports of goods and services plus outflows of primary and secondary income exceeds the value of exports plus inflows.
AO2 Analysis
Two reasons for a current account deficit:
- Low international competitiveness: If domestic firms produce goods that are relatively expensive or of lower quality than foreign rivals, exports will be low while imports remain high, leading to a deficit.
- Strong domestic economic growth: Rising incomes increase demand for imports, especially if the marginal propensity to import is high; if export demand from trading partners grows more slowly, the trade balance worsens.
AO3 Evaluation
Whether the government is concerned depends on the size, duration, and cause of the deficit. A temporary deficit caused by high imports of capital goods may actually boost future productive capacity and exports, so concern may be limited. However, a persistent, large deficit may lead to downward pressure on the exchange rate, higher inflation, and reduced foreign investor confidence, which would be a serious concern. Therefore, the government's level of concern is conditional on these factors.
The government's concern is conditional on the size, duration, and cause of the deficit; a persistent deficit from low competitiveness is more concerning than a temporary one due to investment imports.
Background Concept
The current account is part of the balance of payments that records flows of goods, services, primary income (e.g., interest, dividends), and secondary income (e.g., remittances). A deficit means more money flows out than in. The main components are the trade balance (exports minus imports of goods and services) and net income flows.
Understanding the Question
Part (a) asks for two reasons for a current account deficit and then to consider whether the government is likely to be concerned. The command 'explain' requires a chain of reasoning for each reason. 'Consider' requires a short evaluation – a judgment about the level of concern, not a simple statement. The mark scheme awards up to 3 marks for AO1 (knowledge), 3 for AO2 (analysis of reasons), and 2 for AO3 (evaluation).
Approach
First, define the current account and deficit. Then, choose two distinct reasons – one supply-side (competitiveness) and one demand-side (strong growth). For each, explain the causal mechanism. Finally, evaluate the government's concern by introducing criteria: size, duration, cause. Show that concern varies.
Step-by-Step Reasoning
- Start with a clear definition: current account deficit is when payments abroad exceed receipts from abroad.
- Reason 1: Low international competitiveness – if domestic prices are high or quality low, exports fall, imports rise. This can be due to inflation, poor productivity, or exchange rate overvaluation. The chain: low competitiveness -> lower export demand and higher import demand -> trade balance worsens -> current account deficit.
- Reason 2: Strong domestic growth – higher incomes increase demand for imports (assuming high income elasticity). If trading partners grow slowly, export demand doesn't keep up. The chain: growth -> higher MP import -> imports rise faster than exports -> deficit.
- Evaluation: The government's concern depends on whether the deficit is temporary (e.g., due to capital goods imports that boost future capacity) or persistent (due to structural problems). Persistent deficits may lead to currency depreciation, inflation, loss of investor confidence. However, a temporary deficit may be acceptable. So the answer should state that concern is conditional.
Key Takeaways
- A current account deficit has multiple causes; always link to the underlying economic conditions.
- Evaluation requires more than stating both sides; it requires a justified judgment using criteria.
- Use chains of reasoning: cause -> mechanism -> effect.
Common Mistakes
- Only listing reasons without explanation (chain of reasoning missing).
- Failing to provide a clear answer to 'consider' – just saying 'the government might be concerned' without conditionality.
- Using incorrect terminology (e.g., confusing current account with trade account).
Things to Be Careful About
- Ensure each reason is fully developed: name the mechanism, show the impact on imports/exports.
- For evaluation, avoid fence-sitting; give a clear conditional conclusion.
- Use the mark scheme's guidance: up to 2 marks for evaluation, so a short paragraph is sufficient.
Assess whether it is better to use protectionist policies or contractionary policies to reduce a deficit on the current account of the balance of payments.
Introduction
A current account deficit arises when a country imports more than it exports. Two broad approaches to reduce it are protectionist policies (tariffs, quotas) and contractionary macroeconomic policies (fiscal tightening or monetary tightening). This essay assesses which is better.
Protectionist policies
Tariffs and quotas directly reduce the volume of imports. They can be targeted quickly and may protect domestic industries, allowing them to grow and eventually export more. However, they raise consumer prices, reduce producer surplus, and risk retaliation from trading partners, which could harm exports. Moreover, they do not address the underlying competitiveness problem and may lead to inefficiency.
Contractionary policies
Contractionary fiscal or monetary policy reduces aggregate demand, lowering imports as incomes fall. This can also help control inflation and support the exchange rate. However, it slows economic growth and increases unemployment. The import reduction may be temporary if the economy recovers and imports rebound. Also, it does not directly promote exports.
Evaluation
Protectionism works faster and can be targeted, but risks retaliation and long-term inefficiency. Contractionary policies address the macroeconomic imbalance but at the cost of output and employment. The better policy depends on the cause of the deficit: if it is due to unsustainably high demand, contractionary policy is more fundamental; if it is due to structural uncompetitiveness, protectionism might provide temporary relief but supply-side policies would be better. In most cases, contractionary policies are less distortionary and avoid trade wars, but they are politically painful. Therefore, a combination may be optimal: short-term contractionary demand management to reduce the deficit, accompanied by supply-side reforms to improve competitiveness, while avoiding protectionism to maintain open trade.
Conclusion
Overall, contractionary policies are generally superior because they address the root cause of excess demand without inviting retaliation, though they come with output costs. Protectionist policies should be avoided unless necessary as a temporary measure.
Contractionary policies are generally better because they tackle the underlying cause of excess demand and avoid trade retaliation, though they involve output costs; protectionism may be used temporarily but has significant drawbacks.
Background Concept
A current account deficit can be reduced by either reducing imports or increasing exports. Protectionist policies directly restrict imports, while contractionary policies reduce domestic demand and thus import demand. Both have side effects: protectionism can trigger retaliation and inefficiency; contractionary policies can cause unemployment and slower growth. The choice depends on the nature of the deficit and the priorities of policymakers.
Understanding the Question
Part (b) asks to 'assess whether it is better to use protectionist policies or contractionary policies to reduce a deficit on the current account'. This is an evaluative question requiring two-sided analysis and a justified conclusion. The mark scheme uses level descriptors: top level requires detailed knowledge, developed analysis, and a justified conclusion with well-supported evaluative comments. A one-sided response gets zero for evaluation.
Approach
Structure the answer as an essay:
- Introduction: define the deficit and the two policy types.
- First side: advantages and disadvantages of protectionist policies (tariffs, quotas, etc.).
- Second side: advantages and disadvantages of contractionary policies (fiscal and monetary).
- Evaluation: compare them using criteria like speed, effectiveness, side effects, sustainability, political economy. Bring in the cause of the deficit (demand-pull vs structural).
- Conclusion: give a clear, justified judgment, perhaps with a conditional statement.
Step-by-Step Reasoning
- Start with knowledge: current account deficit, protectionism (tariffs, quotas), contractionary policy (higher taxes, lower govt spending, higher interest rates).
- Protectionist arguments: Tariffs raise price of imports -> quantity demanded falls -> import value falls (if demand elastic enough). Also, domestic firms gain market share, potentially increasing future exports. But: retaliation, higher consumer prices, inefficiency.
- Contractionary arguments: Higher interest rates or reduced govt spending -> lower aggregate demand -> lower income -> reduces import demand. Also helps inflation, may appreciate exchange rate (if interest rates rise) which could harm exports. Slows growth, increases unemployment.
- Evaluation: Compare on criteria: speed (protectionism can be immediate, contractionary takes time), durability (contractionary may be reversed when economy recovers), side effects (protectionism risks trade war, contractionary risks recession). The cause matters: if deficit is due to high demand (e.g., boom), contractionary is appropriate; if due to poor competitiveness, protectionism might offer temporary relief but supply-side policies are better. Therefore, contractionary policies are generally preferable because they address the imbalance without distorting trade, but their cost must be weighed.
- Conclusion: Generally, contractionary policies are better because they target the root cause (excess aggregate demand) and avoid retaliation, though they come with short-run output losses. Protectionism should be a last resort.
Key Takeaways
- Always evaluate policies by considering both intended effects and unintended consequences.
- Use criteria such as speed, effectiveness, equity, sustainability, and political feasibility.
- A justified conclusion requires a clear choice supported by reasoning.
Common Mistakes
- One-sided response: only discussing protectionism or only contractionary policies, losing all AO3 marks.
- Describing policies without linking to the current account deficit (e.g., general discussion of inflation or growth).
- Conclusion that is vague or simply 'it depends' without specifying on what it depends and what the best option is.
- Not using economic terminology (e.g., 'aggregate demand', 'import elasticity', 'retaliation').
Things to Be Careful About
- Ensure the analysis is firmly rooted in the context of reducing a current account deficit, not a general policy discussion.
- Use chains of reasoning for each policy: e.g., tariffs -> higher import prices -> lower import quantity -> reduced deficit (if PED > 1).
- For evaluation, mention that the answer may depend on assumptions like elasticities, trade partner responses, and the state of the economy.
- Provide a clear, justified conclusion that directly answers the question.