Economics 9708/22 — October/November 2025
Cambridge AS Level · AS Level Data Response and Essays · worked solutions for every part, with the mark scheme
Topics Elasticities of Demand · Demand and Supply · Market Equilibrium and the Price Mechanism · Methods of Government Intervention in Markets · International Trade and Comparative Advantage · Consumer and Producer Surplus · +9 more
How do we make sure cocoa bean farmers get paid a living wage?
Chocolate is very big business.
[Content removed due to copyright restrictions.]
Perhaps the long-term solution is to reduce the country's dependence on cocoa bean exports and diversify into other products that can offer more and better paid job opportunities.
Source: Adapted from Reuters, 4 April 2023
Identify one possible reason for the value of price elasticity of demand (PED) for chocolate.
Answer
Chocolate has few close substitutes, so its price elasticity of demand is relatively inelastic.
Inelastic demand due to few substitutes.
Background Concept
Price elasticity of demand (PED) measures the responsiveness of quantity demanded to a change in price. Demand is inelastic when PED < 1, meaning consumers are relatively unresponsive to price changes. Factors that make demand inelastic include: few close substitutes, necessity, small proportion of income, and addiction.
Understanding the Question
The question asks to identify one possible reason for the value of PED for chocolate. The value is likely inelastic (less than 1), so we need to give a reason why chocolate demand is inelastic.
Approach
Think of the characteristics of chocolate: it is a luxury but addictive, has few substitutes, and is a small part of most consumers' budgets. Any one of these can be given as a reason.
Step-by-Step Reasoning
- Recognise that chocolate has few close substitutes (other sweets are not perfect substitutes).
- This means consumers cannot easily switch to alternatives when the price rises, so demand is inelastic.
- Alternatively, the addictive nature of chocolate makes consumers less responsive to price changes.
- Therefore, the PED for chocolate is relatively inelastic.
Key Takeaways
- PED is influenced by availability of substitutes, necessity, proportion of income, and addiction.
- Inelastic demand means quantity demanded changes proportionally less than price.
Common Mistakes
- Giving a reason without stating that demand is inelastic.
- Confusing PED with other elasticities.
Things to Be Careful About
- Ensure the reason is clearly linked to inelasticity.
- Only one reason is required; do not list multiple unless asked.
Calculate the percentage change in the value of global sales of chocolate between 2017 and 2026, as shown in Table 1.1.
Working
Percentage change = ((Value in 2026 - Value in 2017) / Value in 2017) x 100 = 58.8% (or 59%).
Answer
58.8%
58.8%
Background Concept
Percentage change measures the relative change in a value over time. Formula: ((New value - Old value) / Old value) x 100.
Understanding the Question
The question requires calculating the percentage change in global sales of chocolate from 2017 to 2026 using data from Table 1.1. The answer is approximately 59% increase.
Approach
Identify the sales values for 2017 and 2026 from the table, subtract the earlier from the later, divide by the earlier, and multiply by 100.
Step-by-Step Reasoning
- Locate the value of global sales in 2017 (e.g., $X billion) and the projected value in 2026 (e.g., $Y billion) from Table 1.1.
- Calculate the change: Y - X.
- Divide by the original value (X) to get the relative change.
- Multiply by 100 to express as a percentage.
- The result is 58.8%, indicating a significant increase.
Key Takeaways
- Percentage change is a useful tool for comparing data over time.
- Always use the earlier value as the denominator.
Common Mistakes
- Using the later value as the denominator (gives a different percentage).
- Forgetting to multiply by 100.
- Reporting a negative value if the sign is wrong.
Things to Be Careful About
- Ensure you use the correct values from the table.
- The answer can be given as 58.8%, 58.82%, or 59%.
- Do not include a negative sign unless the change is negative.
With the help of a demand and supply diagram, demonstrate why cocoa bean prices continued to fall in 2023.
Answer
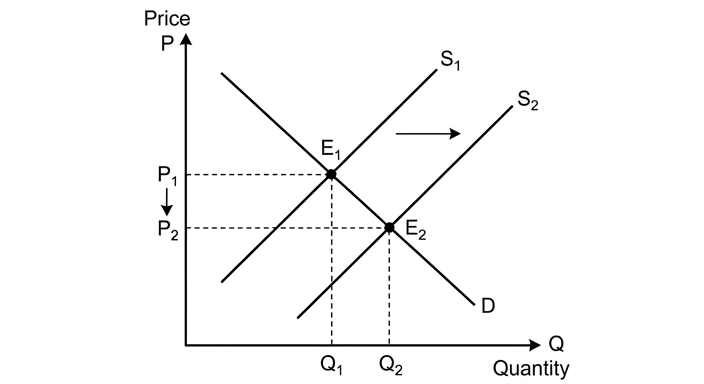
The diagram shows the market for cocoa beans. The supply curve shifts to the right from S1 to S2, for example due to increased production from better harvests or improved technology. With demand unchanged, the equilibrium price falls from P1 to P2, and the quantity traded rises from Q1 to Q2. This demonstrates why cocoa bean prices continued to fall in 2023.
Supply increase caused price to fall.
Background Concept
The demand and supply model shows how prices are determined in a market. Equilibrium price and quantity occur where demand equals supply. A shift in supply (due to changes in production costs, technology, weather, etc.) changes the equilibrium.
Understanding the Question
The question asks to use a diagram to demonstrate why cocoa bean prices fell in 2023. The extract likely indicates that supply increased (e.g., good harvests) or demand decreased, but the mark scheme suggests supply shifted right more than demand. We assume supply increased.
Approach
Draw a standard demand and supply diagram. Show the supply curve shifting to the right. With demand constant, the new equilibrium has a lower price and higher quantity. Label all axes and curves.
Step-by-Step Reasoning
- Draw the axes: Price on the vertical axis, Quantity on the horizontal axis.
- Draw a downward-sloping demand curve (D).
- Draw an upward-sloping supply curve (S1).
- Mark the initial equilibrium (E1) at intersection, with price P1 and quantity Q1.
- Draw a new supply curve (S2) to the right of S1, indicating an increase in supply.
- The new equilibrium (E2) is at the intersection of D and S2, with price P2 (lower) and quantity Q2 (higher).
- Explain that the increase in supply (e.g., due to favourable weather) caused the price to fall.
Key Takeaways
- An increase in supply, ceteris paribus, leads to a lower equilibrium price and higher quantity.
- Diagrams must be fully labelled to earn marks.
Common Mistakes
- Drawing a shift in demand instead of supply.
- Not labelling axes or curves.
- Showing a movement along the curve instead of a shift.
- Not explaining the diagram in words.
Things to Be Careful About
- The diagram alone with appropriate annotation is enough for 2 marks, but it is good practice to include a brief explanation.
- Ensure the shift is clearly indicated with an arrow or labels S1 and S2.
- The price decrease must be evident from the diagram.
Consider whether a buffer stock system controlled by the government of Ivory Coast would be likely to prevent fluctuations in the price of cocoa beans.
Answer
A buffer stock system aims to stabilise prices within a target range. The government sets a minimum price and a maximum price. If the market price falls below the minimum, the government buys cocoa beans, reducing supply and raising the price. If the price rises above the maximum, the government sells from its stocks, increasing supply and lowering the price. This could prevent fluctuations if the government has sufficient storage and funds. However, cocoa beans are perishable and costly to store, and the government may lack the budget to buy large surpluses. An illegal market could also undermine the scheme. Therefore, while a buffer stock could reduce fluctuations, it is unlikely to prevent them entirely.
Evaluation: On balance, a buffer stock system is unlikely to completely prevent price fluctuations for cocoa beans due to storage difficulties, perishability, and financial constraints.
Buffer stock system unlikely to prevent fluctuations due to storage and budget issues.
Background Concept
A buffer stock scheme is a government intervention to stabilise commodity prices. It involves buying when prices are low and selling when prices are high, using a physical stock. It requires the commodity to be storable, sufficient financial resources, and effective enforcement.
Understanding the Question
The question asks to consider whether a buffer stock system controlled by the Ivory Coast government would likely prevent fluctuations in cocoa bean prices. We need to explain how it works and then evaluate its feasibility for cocoa beans.
Approach
First, explain the mechanism of a buffer stock. Then, evaluate the specific challenges for cocoa beans: perishability, storage costs, budget constraints, and potential illegal markets. Conclude with a judgement.
Step-by-Step Reasoning
- Define buffer stock: government sets a price band; buys at minimum price, sells at maximum price.
- Explain how it stabilises prices: purchases reduce supply when price is low, sales increase supply when price is high.
- Analyse why it might work: if the government has enough storage and funds, it can smooth price fluctuations.
- Analyse why it might not work: cocoa beans are perishable (difficult to store long-term), storage is expensive, the government may not have the budget to buy large surpluses, and an illegal market could bypass the scheme.
- Conclude that while it could reduce fluctuations, it is unlikely to prevent them entirely.
Key Takeaways
- Buffer stock schemes require storable goods, adequate funding, and enforcement.
- Perishable commodities like cocoa beans are less suitable.
- Evaluation must consider practical constraints.
Common Mistakes
- Only describing the mechanism without evaluation.
- Ignoring the specific characteristics of cocoa beans.
- One-sided answer (only advantages or only disadvantages).
Things to Be Careful About
- The evaluation mark can be awarded even without full analysis, but it's better to include both.
- Link evaluation to the context of Ivory Coast (developing country, budget constraints).
- Do not confuse buffer stock with minimum price alone.
Assess the extent to which the use of a minimum pricing policy would be the best way to ensure cocoa bean farmers get paid a living wage.
Answer
A minimum price for cocoa beans would be set above the equilibrium market price. This guarantees farmers a higher price per unit, increasing their revenue and helping to ensure a living wage. It also reduces income instability from price fluctuations. However, a minimum price can lead to a surplus if supply increases and demand falls, requiring government purchase of the surplus, which is costly. If the government cannot afford to buy the surplus, the scheme collapses. Farmers may become complacent and fail to invest, reducing long-term incomes. Alternatives such as direct income subsidies or transfer payments might be more cost-effective and avoid market distortion.
Evaluation: On balance, while a minimum price can raise incomes in the short term, it is not necessarily the best way due to the risk of surplus, budget constraints, and potential inefficiency. A combination of policies, including subsidies and diversification, may be more effective in ensuring a living wage.
Minimum pricing is not the best sole method; subsidies or diversification may be more effective.
Background Concept
A minimum price (price floor) is a government-imposed price above the equilibrium. It is intended to raise incomes for producers. It leads to a surplus if the price is set above equilibrium, as quantity supplied exceeds quantity demanded. The government may need to buy the surplus to maintain the price.
Understanding the Question
The question asks to assess the extent to which a minimum pricing policy would be the best way to ensure cocoa bean farmers get a living wage. We need to analyse both the benefits and drawbacks, and compare with alternatives, then conclude.
Approach
First, explain how a minimum price could help farmers (higher price, stable income). Then, explain the problems (surplus, cost, enforcement, complacency). Consider alternatives like subsidies or direct transfers. Evaluate based on effectiveness, cost, and sustainability. Conclude with a judgement.
Step-by-Step Reasoning
- Define minimum price and show on a diagram (optional but helpful).
- Explain that a minimum price above equilibrium raises the price farmers receive, increasing their revenue if demand is inelastic.
- It also provides income stability, encouraging production.
- However, the higher price reduces quantity demanded, creating a surplus.
- The government must buy the surplus, which is expensive and may be unsustainable.
- If the government cannot afford it, the price falls back to equilibrium, defeating the purpose.
- Farmers may become complacent and not invest, harming long-term productivity.
- Alternatives: direct income subsidies (less market distortion, targeted), diversification to reduce dependence.
- Evaluate: minimum price can help but has significant drawbacks; it is not the best way alone.
Key Takeaways
- Minimum prices can raise producer incomes but create surpluses.
- Government budget constraints are a major limitation.
- Evaluation should consider alternatives and long-term effects.
Common Mistakes
- One-sided analysis (only benefits or only drawbacks).
- No conclusion or a vague conclusion.
- Confusing minimum price with minimum wage.
- Not considering the specific context of cocoa beans in a developing country.
Things to Be Careful About
- The question asks 'the best way', so comparison with alternatives is important.
- Ensure evaluation addresses the extent to which it is the best.
- The conclusion should be justified based on the analysis.
Assess the advantages and disadvantages of Ivory Coast continuing to specialise in the production and export of cocoa beans.
Answer
Advantages: Ivory Coast has a comparative advantage in cocoa production, so specialisation allows efficient use of resources, lower costs, and higher output. It can benefit from growing global demand for chocolate, increasing export revenue and promoting economic growth. Specialisation also enables economies of scale and learning by doing.
Disadvantages: Over-specialisation makes the economy vulnerable to price fluctuations, crop failures, and changes in global demand. It reduces diversification, risking food security and long-term growth. The terms of trade may deteriorate if cocoa prices fall. Dependence on a single export also exposes the economy to external shocks.
Evaluation: On balance, while specialisation has brought significant benefits to Ivory Coast, the risks of dependence suggest that the country should gradually diversify its economy to ensure sustainable development and reduce vulnerability.
Specialisation has short-term benefits but long-term risks; diversification is recommended.
Background Concept
Comparative advantage means a country can produce a good at a lower opportunity cost than others. Specialisation according to comparative advantage leads to increased total output and gains from trade. However, over-specialisation can make an economy vulnerable to external shocks, price volatility, and structural changes.
Understanding the Question
The question asks to assess the advantages and disadvantages of Ivory Coast continuing to specialise in cocoa beans. We need to analyse both sides and conclude whether it is beneficial overall.
Approach
First, explain the advantages: efficiency, export revenue, growth. Then, explain the disadvantages: vulnerability, lack of diversification, terms of trade risk. Evaluate based on the trade-off between short-term gains and long-term stability. Conclude with a recommendation.
Step-by-Step Reasoning
- Define comparative advantage and specialisation.
- Advantages:
- Ivory Coast has a comparative advantage in cocoa (climate, land, labour).
- Specialisation leads to efficient production and lower costs.
- Increased exports generate foreign exchange and can fund imports.
- Growing global demand for chocolate boosts revenue.
- Specialisation can lead to economies of scale and productivity improvements.
- Disadvantages:
- Dependence on one crop makes the economy vulnerable to price falls, crop diseases, or demand shifts.
- Lack of diversification means other sectors are underdeveloped, limiting long-term growth.
- Food security may be compromised if land is used for cocoa instead of food crops.
- Terms of trade may worsen if cocoa prices decline relative to manufactured goods.
- External shocks (e.g., climate change, global recession) can have severe impacts.
- Evaluation:
- In the short run, specialisation is profitable and supports economic growth.
- In the long run, the risks of over-dependence are significant.
- Ivory Coast should continue to benefit from cocoa but invest in diversification to reduce vulnerability.
- Conclusion: Continuing to specialise is advantageous but not without risks; diversification is advisable for sustainable development.
Key Takeaways
- Specialisation according to comparative advantage brings gains from trade.
- Over-specialisation carries risks of vulnerability and instability.
- Evaluation should consider both short-term and long-term perspectives.
Common Mistakes
- One-sided answer (only advantages or only disadvantages).
- No conclusion or a conclusion that does not follow from the analysis.
- Ignoring the specific context of Ivory Coast.
- Confusing absolute and comparative advantage.
Things to Be Careful About
- The question asks to assess both advantages and disadvantages, so both must be covered.
- The conclusion should be justified and address the balance.
- Use economic terminology (comparative advantage, terms of trade, diversification).
With the help of a diagram, explain the difference between producer surplus and consumer surplus and consider the extent to which producers always gain when the price of a product increases due to higher costs of production.
Answer
AO1: Knowledge and Understanding
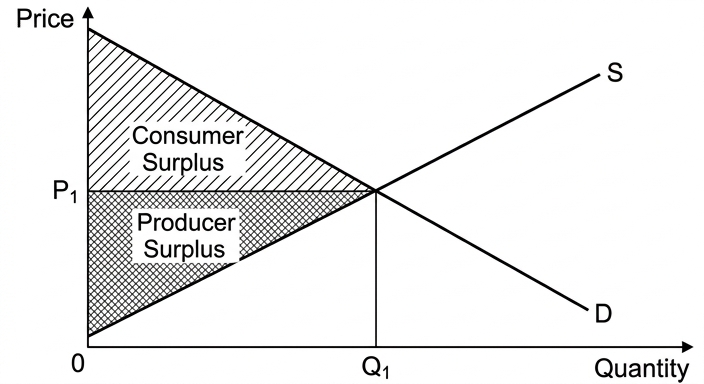
Consumer surplus is the difference between the maximum price a consumer is willing to pay for a product and the market price they actually pay. It is the area below the demand curve and above the market price. Producer surplus is the difference between the market price a producer receives and the minimum price they are willing to accept to supply the product. It is the area above the supply curve and below the market price.
AO2: Analysis
When the cost of production increases, the supply curve shifts leftwards from S1 to S2. This raises the market price from P1 to P2 and reduces the equilibrium quantity from Q1 to Q2.
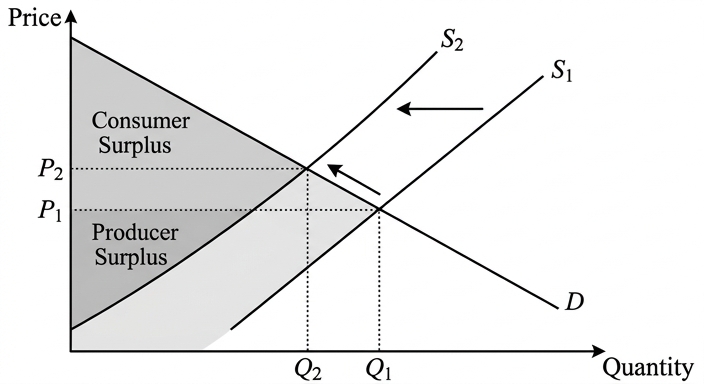
Whether the producer gains overall depends on the price elasticity of demand (PED) for the product. If demand is price inelastic (PED < 1), the percentage increase in price is greater than the percentage fall in quantity demanded. Total revenue (price x quantity) will rise. The new producer surplus may be larger than the original, so the producer gains. If demand is price elastic (PED > 1), the percentage fall in quantity demanded is greater than the percentage rise in price. Total revenue falls, and producer surplus is likely to fall, so the producer loses.
The price elasticity of supply (PES) also matters. If supply is inelastic, the price rise is larger and the quantity fall is smaller, which may help the producer. If supply is elastic, the price rise is smaller and the quantity fall is larger, which may harm the producer.
AO3: Evaluation
Producers do not always gain when the price rises due to higher costs. The outcome depends critically on PED. Only when demand is sufficiently inelastic will the price rise more than compensate for the lost sales, increasing total revenue and producer surplus. When demand is elastic, the producer loses. The time period also matters: in the long run, demand may become more elastic as consumers find substitutes, reducing any initial gain. Therefore, the statement that producers always gain is incorrect; the extent of any gain is conditional on the elasticities involved.
Producers do not always gain when the price of a product increases due to higher costs of production. The outcome depends on the price elasticity of demand and supply. If demand is inelastic, total revenue and producer surplus may rise, but if demand is elastic, they will fall. In the long run, demand may become more elastic, further reducing any potential gain.
Background Concept
Consumer surplus and producer surplus are measures of the welfare that consumers and producers gain from participating in a market. Consumer surplus arises because consumers value a product at more than its market price; they would have been willing to pay more. Producer surplus arises because producers are willing to supply at a price lower than the market price; they receive more than their minimum acceptable price. Together, they form the total welfare (or social surplus) in a market.
The price elasticity of demand (PED) measures the responsiveness of quantity demanded to a change in price. It determines how total revenue changes when price changes. The price elasticity of supply (PES) measures the responsiveness of quantity supplied to a change in price. It determines how much the equilibrium quantity changes when supply shifts.
Understanding the Question
This question has two distinct parts. First, you must explain the difference between producer surplus and consumer surplus, using a diagram. This is a knowledge and understanding task (AO1). Second, you must consider the extent to which producers always gain when the price of a product increases due to higher costs of production. This is an analysis (AO2) and evaluation (AO3) task. The command word "consider the extent to which" requires you to examine both sides of the argument and reach a justified conclusion. The word "always" is an absolute, so the counter-case is central to the answer.
The mark scheme allocates up to 3 marks for AO1 (the diagram and definitions), up to 3 marks for AO2 (analysing the impact of a cost increase using the diagram and elasticity), and up to 2 marks for AO3 (evaluating the extent to which producers always gain and reaching a conclusion).
Approach
- AO1: Draw a standard demand and supply diagram showing the equilibrium price and quantity. Shade and label the areas for consumer surplus (below the demand curve, above the price) and producer surplus (above the supply curve, below the price). Provide clear definitions of each.
- AO2: Draw a second diagram showing the effect of an increase in costs of production. Shift the supply curve leftwards (from S1 to S2). Show the new equilibrium with a higher price (P2) and lower quantity (Q2). Explain that the impact on the producer depends on PED: if demand is inelastic, total revenue rises; if elastic, total revenue falls. Also mention the role of PES.
- AO3: Challenge the absolute claim "always gain". State that the outcome depends on PED and PES. Provide a reasoned conclusion: producers do not always gain; they only gain when demand is inelastic enough. Consider the time period as a further evaluative point.
Step-by-Step Reasoning
Step 1: Defining and illustrating consumer and producer surplus (AO1)
- Consumer surplus is the difference between what a consumer is willing to pay (the demand curve) and what they actually pay (the market price). It is the area below the demand curve and above the price line.
- Producer surplus is the difference between what a producer is willing to accept (the supply curve) and what they actually receive (the market price). It is the area above the supply curve and below the price line.
- On a standard demand and supply diagram, label the demand curve D, the supply curve S, the equilibrium price P1, and the equilibrium quantity Q1. Shade the triangle above the price and below the demand curve as consumer surplus. Shade the triangle below the price and above the supply curve as producer surplus.
Step 2: Analysing the effect of a cost increase (AO2)
- An increase in the costs of production (e.g., higher raw material prices, higher wages) reduces the profitability of supplying the product at any given price. This causes the supply curve to shift to the left (from S1 to S2).
- At the original price P1, there is now excess demand. This puts upward pressure on the price. The market moves to a new equilibrium at a higher price (P2) and a lower quantity (Q2).
- The impact on the producer (specifically on producer surplus and total revenue) is not straightforward. The producer now receives a higher price per unit but sells fewer units. The net effect depends on the price elasticity of demand (PED).
- If demand is price inelastic (PED < 1): The percentage increase in price is greater than the percentage decrease in quantity demanded. Total revenue (P x Q) increases. The new producer surplus area may be larger than the original, so the producer gains.
- If demand is price elastic (PED > 1): The percentage decrease in quantity demanded is greater than the percentage increase in price. Total revenue falls. The new producer surplus area is likely to be smaller, so the producer loses.
- The price elasticity of supply (PES) also plays a role. If supply is inelastic, the shift in supply causes a larger price increase and a smaller quantity decrease, which is more favourable to the producer. If supply is elastic, the price increase is smaller and the quantity decrease is larger, which is less favourable.
Step 3: Evaluating the extent to which producers always gain (AO3)
- The statement "producers always gain" is an absolute and is incorrect. The analysis above shows that the outcome is conditional on the elasticities.
- Case for the statement: If demand is highly inelastic (e.g., for a necessity like insulin or petrol with few substitutes), the price rise will significantly increase total revenue and producer surplus. The producer clearly gains.
- Case against the statement: If demand is elastic (e.g., for a luxury good or a product with many substitutes), the fall in quantity demanded will outweigh the price rise, reducing total revenue and producer surplus. The producer loses.
- Further evaluative points: The time period matters. In the short run, demand may be inelastic, but in the long run, consumers can adjust their behaviour and find substitutes, making demand more elastic. This could turn an initial gain into a loss. Also, the nature of the cost increase matters: if it affects all firms equally, the price rise may be passed on; if it only affects one firm, that firm may lose market share.
- Conclusion: Producers do not always gain. The extent of any gain depends primarily on the price elasticity of demand for their product. Only when demand is sufficiently inelastic will the producer benefit from a cost-induced price increase. In many real-world markets, demand is elastic enough that producers will lose out.
Key Takeaways
- Consumer surplus and producer surplus are key welfare concepts in microeconomics.
- A shift in supply due to higher costs leads to a higher price and lower quantity.
- The impact on producer welfare (total revenue and producer surplus) depends on the price elasticity of demand and supply.
- When evaluating an absolute statement like "always", you must find the counter-example and provide a conditional conclusion.
- Elasticity analysis is a powerful tool for predicting the outcomes of market changes.
Common Mistakes
- Omitting the diagram: The question explicitly asks for a diagram. Failing to include one will lose marks for AO1 and AO2.
- Drawing an inaccurate diagram: The diagram must clearly show the areas for consumer and producer surplus. The second diagram must show a leftward shift of the supply curve and the new equilibrium.
- Not explaining the diagram: The diagram must be explained in the text. Simply drawing it is not enough.
- One-sided evaluation: The question asks you to "consider the extent to which producers always gain". A one-sided answer that only argues they gain (or only argues they lose) will not score full marks for AO3. You must discuss both possibilities and reach a conclusion.
- Confusing total revenue with profit: The question asks about the producer's gain. While total revenue is a key component, a full answer could also consider costs. However, the mark scheme focuses on revenue and surplus.
- Ignoring the role of PES: The mark scheme explicitly mentions PES as a factor. A strong answer will include it.
Things to Be Careful About
- Label your diagrams clearly: Label all axes (Price, Quantity), curves (D, S1, S2), equilibrium points (P1, Q1, P2, Q2), and the areas for consumer and producer surplus.
- Use the correct terminology: Use terms like "price inelastic", "price elastic", "total revenue", "producer surplus", "cost-push inflation" (if applicable).
- Structure your answer: Follow the AO breakdown. Clearly separate the definition/diagram (AO1), the analysis (AO2), and the evaluation (AO3).
- Reach a justified conclusion: The final mark for AO3 is reserved for a conclusion that is reasoned and addresses the specific question. Do not just summarise; state your judgement.
Assess the view that a business should be more concerned about the income elasticity of demand for its product than its cross elasticity of demand when incomes are falling.
Introduction
Income elasticity of demand (YED) measures the responsiveness of demand for a product to a change in consumer income. Cross elasticity of demand (XED) measures the responsiveness of demand for one product to a change in the price of another product. When incomes are falling, a business must understand how its sales will be affected. This essay assesses whether YED is more important than XED in this context.
The Case for YED Being More Important
When incomes fall, YED directly predicts the change in demand for a business's product. For a normal good (positive YED), demand will fall as incomes fall. The size of the YED coefficient indicates the magnitude of the fall: a luxury good with a high YED will see a large drop in demand, while a necessity with a low YED will see a smaller drop. For an inferior good (negative YED), demand will actually rise as incomes fall. This knowledge is crucial for production planning, inventory management, and marketing strategy. A business producing luxury cars (high positive YED) knows it must cut production and reduce prices during a recession, while a business selling own-brand supermarket products (negative YED) knows it should increase supply. YED provides a direct, income-focused forecast.
The Case for XED Being More Important
XED is also vital during a period of falling incomes because consumer behaviour changes in complex ways. A fall in income may cause consumers to switch to cheaper substitutes. A business with a high positive XED for its product relative to a cheaper rival will lose significant market share as consumers switch. For example, if a premium coffee brand has a high positive XED with a cheaper own-brand coffee, a fall in income will cause a large shift in demand towards the cheaper option. Furthermore, XED helps a business understand the impact of competitors' pricing strategies. If a rival cuts its price during a recession, a high XED means the business's own demand will fall sharply. XED also captures the effect on complementary products: if incomes fall, demand for a complement (e.g., cars and petrol) may fall together, and a business selling one must be aware of the other. XED provides a competitive and market-structure perspective that YED alone misses.
Evaluation
Both elasticities are important, but their relative importance depends on the specific circumstances of the business. For a business producing a single, well-defined product (e.g., a luxury car manufacturer), YED is arguably more important because the direct income effect is the dominant driver of demand changes during a recession. The business's primary concern is how much its own sales will fall, and YED gives a direct answer.
However, for a business operating in a highly competitive market with many close substitutes (e.g., a supermarket or a clothing retailer), XED may be more important. The key risk is not just that total market demand falls (captured by YED), but that consumers switch to competitors' products (captured by XED). A business with a high positive XED with its rivals must be extremely concerned about competitive pricing and product differentiation.
Furthermore, the reliability of the data matters. YED can be difficult to estimate accurately, especially for new products or during unprecedented economic shocks. XED data may be more readily available from market research on competitor pricing. The time period also matters: in the short run, YED may be the primary driver, but in the long run, consumers may make more fundamental switches between substitutes, making XED more significant.
Conclusion
It is not accurate to say that a business should be more concerned about YED than XED when incomes are falling. The relative importance depends on the market structure and the nature of the product. For a business with few competitors and a product with a clear income elasticity (e.g., a luxury good), YED is paramount. For a business in a competitive market with many substitutes, XED is at least as important, if not more so, because the risk of losing market share to competitors is the primary threat. A prudent business should monitor both elasticities closely.
A business should not necessarily be more concerned about YED than XED when incomes are falling. The relative importance depends on the market structure and product type. For a business with a clear income-elastic product in a less competitive market, YED is paramount. For a business in a competitive market with many substitutes, XED is at least as important because the risk of losing market share to competitors is the primary threat. Both elasticities should be monitored.
Background Concept
Income elasticity of demand (YED) is calculated as the percentage change in quantity demanded divided by the percentage change in income. A positive YED indicates a normal good (demand rises with income), and a negative YED indicates an inferior good (demand falls as income rises). The magnitude indicates whether the good is a necessity (0 < YED < 1) or a luxury (YED > 1).
Cross elasticity of demand (XED) is calculated as the percentage change in quantity demanded of good A divided by the percentage change in the price of good B. A positive XED indicates substitutes (a rise in the price of B increases demand for A), and a negative XED indicates complements (a rise in the price of B decreases demand for A). The magnitude indicates the strength of the relationship.
When incomes are falling, a business faces a complex environment. Its own sales may fall due to the direct income effect (YED), but also due to consumers switching to cheaper alternatives (XED). The question asks which elasticity should be the business's primary concern.
Understanding the Question
This is a 12-mark essay question (AO1+AO2 out of 8, AO3 out of 4). The command word is "Assess the view that...". This requires you to present a balanced argument, considering both sides, and then reach a justified conclusion. The specific context is "when incomes are falling". The mark scheme explicitly states that answers that do not refer to falling incomes cannot gain more than a mid-Level 2 mark. The top band (Level 3) requires a detailed, developed, and balanced analysis, with a clear conclusion.
The question is not asking which elasticity is better in general, but which is more important in the specific scenario of falling incomes. This is a comparative judgement.
Approach
- Introduction: Define YED and XED. State the context (falling incomes). Outline the essay's structure: first, the case for YED being more important; second, the case for XED being more important; then an evaluation weighing the two; and finally a conclusion.
- First side (YED is more important): Explain how YED directly predicts the change in demand for the business's own product. Use examples: a luxury car (high positive YED) will see a large fall; an inferior good (negative YED) will see a rise. Argue that this direct prediction is the most fundamental concern for production planning.
- Second side (XED is more important): Explain that falling incomes change consumer behaviour in ways beyond the direct income effect. Consumers actively seek cheaper substitutes. A high positive XED with a rival means the business will lose market share. Use the example of a premium brand vs. a cheaper own-brand. Also mention the role of complements.
- Evaluation: Weigh the two arguments. The key criterion is the market structure and product type. For a business with few substitutes, YED dominates. For a business in a competitive market, XED is critical. Also consider data reliability and the time period.
- Conclusion: State that the relative importance is conditional. A business should not be more concerned about one than the other without considering its specific circumstances. A justified conclusion should state that both are important, but the balance shifts depending on the market.
Step-by-Step Reasoning
Step 1: Define the concepts and set the context (Introduction)
- Define YED and XED with their formulae and interpretations.
- State the context: a period of falling incomes (e.g., a recession).
- State the thesis: the essay will assess whether YED is more important than XED for a business in this context.
Step 2: Develop the case for YED being more important (First side)
- Direct prediction: YED directly links a change in income to a change in demand for the business's product. This is the most fundamental question a business faces: "How much will my sales change?"
- Production planning: If YED is high and positive, the business knows to cut production, reduce inventory, and possibly lay off workers. If YED is negative, the business knows to ramp up production.
- Pricing strategy: For a luxury good, the business may need to cut prices aggressively to stimulate demand. For an inferior good, the business may be able to maintain or even raise prices.
- Example: A company selling high-end sports cars (YED = +3.0) knows that a 10% fall in income will lead to a 30% fall in demand. This is a critical piece of information that directly drives business strategy.
- Limitation of this view: YED assumes that the only thing changing is income. It does not account for changes in relative prices or competitor behaviour.
Step 3: Develop the case for XED being more important (Second side)
- Competitive dynamics: When incomes fall, consumers become more price-sensitive and actively search for cheaper alternatives. XED captures this switching behaviour. A business with a high positive XED with a cheaper rival will see its demand fall even if total market demand for the product category is stable.
- Market share risk: The primary risk for many businesses during a recession is not that the market shrinks, but that they lose market share to more aggressive or lower-cost competitors. XED is the tool to measure this risk.
- Complementary products: A business selling a product that is a complement to another good (e.g., a coffee machine and coffee pods) must be aware of the XED. If incomes fall, demand for the complement may fall, which will in turn reduce demand for the business's product.
- Example: A premium coffee brand has a high positive XED with a supermarket's own-brand coffee. When incomes fall, consumers switch to the cheaper own-brand. The premium brand's sales fall sharply, even if total coffee consumption remains the same. XED is the critical metric here.
- Limitation of this view: XED does not capture the overall market contraction. A business could maintain its market share but still see falling sales because the entire market is shrinking.
Step 4: Evaluate the two sides (Evaluation)
- Criterion 1: Market structure. In a market with few substitutes (e.g., a local utility company), YED is the dominant concern. In a market with many close substitutes (e.g., a supermarket), XED is at least as important.
- Criterion 2: Product type. For a luxury good with a high YED, the income effect is so large that it dwarfs substitution effects. For a necessity with a low YED, substitution effects may be more important.
- Criterion 3: Data reliability. Both elasticities are estimates. YED can be difficult to estimate during a unique recession. XED data may be more readily available from market research on competitor pricing.
- Criterion 4: Time period. In the short run, consumers may not immediately switch substitutes, so YED may dominate. In the long run, consumers make more fundamental switches, making XED more significant.
- Synthesis: The view that a business should be more concerned about YED is too simplistic. The correct answer is "it depends". A business must analyse its own market position to determine which elasticity is the more pressing concern.
Step 5: Reach a justified conclusion (Conclusion)
- The conclusion must directly answer the question. It should not be a fence-sitting "both are important" without a judgement.
- A strong conclusion: "A business should not necessarily be more concerned about YED than XED when incomes are falling. For a business with a clear income-elastic product in a less competitive market, YED is paramount. However, for a business in a competitive market with many substitutes, XED is at least as important because the risk of losing market share to competitors is the primary threat. Therefore, the relative importance is conditional on the specific market circumstances, and a prudent business should monitor both."
Key Takeaways
- YED and XED are both crucial for business decision-making, but they answer different questions.
- The importance of each elasticity is context-dependent, especially on market structure and product type.
- When evaluating a comparative statement, you must weigh the arguments on a clear criterion and reach a conditional conclusion.
- The specific context of the question ("when incomes are falling") must be central to the analysis.
- A one-sided answer cannot score high marks for evaluation.
Common Mistakes
- Not referring to falling incomes: The question is specifically about a period of falling incomes. A generic answer about YED and XED will be penalised (max mid-Level 2).
- One-sided argument: Only arguing that YED is more important (or only that XED is more important) will lose all marks for AO3.
- Descriptive rather than analytical: Simply defining YED and XED is not enough. The analysis must explain why one might be more important than the other in the given context.
- Lack of development: Each point must be explained with a chain of reasoning. For example, "YED is important because it predicts demand" is too simple. You must explain how it predicts demand and why that matters for business decisions.
- No conclusion or a vague conclusion: The top band for AO3 requires a justified conclusion. A conclusion like "both are important" is too vague. You must state which one is more important and under what conditions.
- Ignoring the comparative nature of the question: The question asks which a business should be more concerned about. The answer must make a comparison and a judgement.
Things to Be Careful About
- Use the correct formulae and terminology: YED = %ΔQd / %ΔY; XED = %ΔQd of A / %ΔP of B. Use terms like "normal good", "inferior good", "substitute", "complement".
- Structure your essay clearly: Use paragraphs and signposting (e.g., "On the one hand...", "On the other hand...", "In evaluation...").
- Provide specific examples: Examples make the analysis concrete and demonstrate application. Use examples relevant to the context of falling incomes (e.g., luxury goods, own-brand products, premium brands).
- Focus on the business perspective: The question is about what a business should be concerned about. The analysis should be from the viewpoint of a business manager making strategic decisions.
- Reach a clear, justified conclusion: The conclusion should state your judgement and the reasoning behind it. It should not be a simple restatement of the arguments.
With the help of a diagram, explain the difference between a movement along a production possibility curve (PPC) and a shift of this curve and consider whether a decision to produce more of one product will always incur an equal opportunity cost.
Answer
A movement along a PPC occurs when the economy reallocates resources from one product to another, changing the combination of goods produced. A shift of the PPC happens when the economy's productive capacity changes, allowing more (or less) of both goods to be produced.
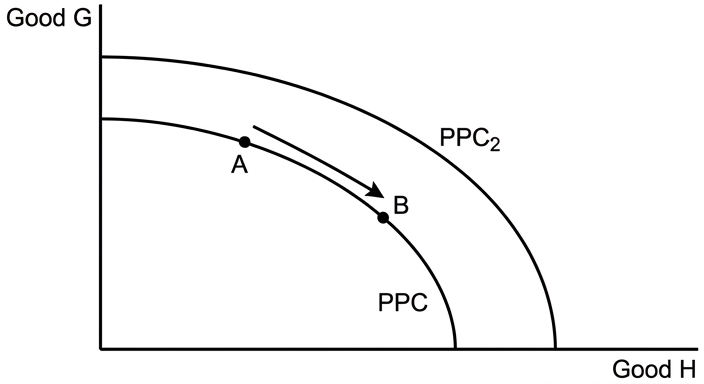
The diagram shows a PPC with two goods, Good G and Good H. The initial PPC is the curve. A movement from point A to point B along the curve represents producing more of Good H and less of Good G. A shift outward to a new PPC (PPC2) shows that the economy can now produce more of both goods due to increased resources or improved technology.
Opportunity cost is the next best alternative forgone when a choice is made. On a straight-line PPC, the opportunity cost of producing one more unit of H is constant because the slope is constant. On a bowed-out PPC, the opportunity cost rises as more of H is produced because resources are not equally suited to both goods. Whether the opportunity cost is equal depends on the ease of transferring resources between products. In most real economies, PPCs are bowed outward due to increasing opportunity cost, so a decision to produce more of one product will not always incur an equal opportunity cost. The conclusion is that it is not always equal; the shape of the PPC and the ease of resource transfer determine the outcome.
No, it is not always equal because the opportunity cost depends on the shape of the PPC and the ease of transferring resources between products.
Background Concept
The production possibility curve (PPC) shows the maximum combinations of two goods an economy can produce with its existing resources and technology. A movement along the PPC represents a change in the allocation of resources between the two goods (e.g., more of one good and less of the other). A shift of the PPC represents a change in the economy's capacity to produce, allowing more (or less) of both goods. Opportunity cost is the cost of the next best alternative forgone. The shape of the PPC reflects the nature of opportunity cost: a straight line indicates constant opportunity cost; a bowed-out curve indicates increasing opportunity cost.
Understanding the Question
The question asks you to explain the difference between a movement along a PPC and a shift of the PPC, using a diagram. It then asks you to consider whether a decision to produce more of one product will always incur an equal opportunity cost. This is a two-part question: first explain and illustrate, then evaluate. The command word 'consider' signals that evaluation is required. The marking scheme allocates 3 marks for knowledge and understanding (AO1), 3 marks for analysis (AO2), and 2 marks for evaluation (AO3).
Approach
First, draw a labelled PPC diagram showing both a movement along the curve and an outward shift. Explain each clearly. Then, define opportunity cost and explain how the shape of the PPC determines whether opportunity cost is constant or increasing. For the evaluation, discuss that whether opportunity cost is equal depends on the PPC's shape and the ease of transferring resources. Conclude that it is not always equal.
Step-by-Step Reasoning
- Draw the diagram: Label axes with two goods (e.g., Good G and Good H). Draw a downward-sloping, bowed-out curve. Mark a point A on the curve. Draw an arrow along the curve from A to B, indicating movement. Draw a second outward curve (PPC2) to the right. Label both curves.
- Explain movement along: At point A, the economy produces a certain combination. Moving to B means producing more of H and less of G. This is a reallocation of existing resources.
- Explain shift outward: The economy can now produce more of both goods because of increased resources (e.g., more labour, capital) or better technology. This is an increase in productive capacity.
- Define opportunity cost: The next best alternative forgone when a choice is made. On a PPC, the opportunity cost of producing one more unit of H is the amount of G given up.
- Explain constant vs increasing opportunity cost: On a straight-line PPC, the slope is constant, so the opportunity cost of each additional unit of H is the same. On a bowed-out PPC, the slope becomes steeper as more H is produced, so opportunity cost increases. This is because resources are not equally suited to producing both goods.
- Evaluate: The question asks whether the opportunity cost is always equal. The answer is no. It depends on the shape of the PPC. In most real-world economies, PPCs are bowed outward due to increasing opportunity cost, so the opportunity cost of producing more of one product typically increases. Additionally, the ease of transferring resources affects opportunity cost: if resources are easily transferable, opportunity cost may be more constant. A justified conclusion states that it is not always equal.
Key Takeaways
- A movement along a PPC is a reallocation of resources; a shift is a change in capacity.
- Opportunity cost can be constant or increasing depending on the PPC's shape.
- The shape of the PPC reflects the ease of transferring resources between products.
- Evaluation requires a balanced consideration and a justified conclusion.
Common Mistakes
- Confusing a movement along with a shift: e.g., saying an increase in resources causes a movement along the curve.
- Drawing a PPC without labels or with incorrect shape (e.g., upward sloping).
- Forgetting to include the diagram when the question requires it.
- Not explaining the diagram, just drawing it.
- Giving a one-sided answer to the 'consider' part: e.g., claiming opportunity cost is always equal without considering the shape.
- Not reaching a conclusion or stating a vague conclusion.
Things to Be Careful About
- Label axes with specific products (not X and Y) to earn the mark.
- Show both movement and shift clearly on the diagram.
- Explain the diagram in words.
- For the evaluation, explicitly address the 'always' part and give a clear conclusion.
- Use correct economic terminology: 'movement along', 'shift', 'opportunity cost', 'constant/increasing opportunity cost'.
Assess the extent to which it is always necessary to increase the size of the labour factor of production in order to cause an outward shift of the production possibility curve.
Introduction
The production possibility curve (PPC) shows the maximum possible output of two goods given available resources and technology. An outward shift of the PPC represents an increase in potential output, i.e., economic growth. This essay assesses whether it is always necessary to increase the size of the labour factor to achieve such a shift. While increasing the number of workers can directly raise output, other factors such as capital, technology, and labour quality can also cause an outward shift. The essay will analyse both sides and reach a justified conclusion.
The case for increasing the size of the labour force
An increase in the size of the labour force provides more workers, which directly increases the economy's ability to produce goods and services, assuming other factors are maintained. Policies such as raising the retirement age, encouraging higher female labour participation, or increasing immigration can expand the labour force. This is a straightforward way to shift the PPC outward. For example, an economy with a young population and underutilised labour can increase its potential output by bringing more people into the workforce.
The case against the necessity of increasing the labour force
However, an outward shift of the PPC can also be achieved without increasing the number of workers. Improving the quality of labour through education and training can raise productivity per worker, allowing more output with the same number of workers. Investment in capital goods (machinery, equipment, infrastructure) enhances the productivity of labour, leading to higher potential output. Technological progress can improve efficiency across all factors. Enterprise and innovation can also create new ways to produce more with existing resources. For instance, the development of automation and artificial intelligence has increased potential output in many economies without a corresponding increase in the labour force. Additionally, simply increasing the number of workers without complementary capital may lead to diminishing returns, limiting the effectiveness of this approach.
Evaluation
The extent to which increasing the labour force is necessary depends on the specific circumstances of the economy. In economies with high unemployment or a large inactive population, expanding the labour force may be a key driver of growth. In economies with full employment and aging populations, increasing the labour force may be difficult and costly, making other factors relatively more important. Moreover, the quality of labour and the availability of capital and technology are often more important determinants of long-run growth than the sheer number of workers. A balanced approach, combining investment in human capital, physical capital, and technology, is likely to be more effective than focusing solely on labour quantity.
Conclusion
It is not always necessary to increase the size of the labour factor to cause an outward shift of the PPC. While increasing the labour force can contribute to growth, improvements in the quality of labour, capital accumulation, technological progress, and better use of other factors of production can also achieve outward shifts. The necessity of increasing the labour force depends on the specific economic context, including the availability of other factors and the stage of development. Therefore, the proposition that it is always necessary is rejected.
It is not always necessary to increase the size of the labour factor; outward shifts can also be achieved through improvements in the quality of labour, capital accumulation, technological progress, and better use of other factors of production, depending on the economy's circumstances.
Background Concept
The production possibility curve (PPC) illustrates the concept of scarcity and choice. An outward shift of the PPC represents an increase in the economy's productive capacity, which can be caused by increases in the quantity or quality of factors of production (land, labour, capital, enterprise) or improvements in technology. The labour factor includes both the number of workers (size) and their skills and productivity (quality). Other factors, such as physical capital (machines, factories) and human capital (education, training), are also critical.
Understanding the Question
The question asks: 'Assess the extent to which it is always necessary to increase the size of the labour factor of production in order to cause an outward shift of the production possibility curve.' This is a levels-marked essay (12 marks) with two assessment objectives: AO1+AO2 (8 marks) and AO3 (4 marks). The command word 'assess' requires a balanced analysis and a justified conclusion. The top band demands detailed knowledge, developed analysis, and a reasoned evaluative conclusion. The question contains the absolute 'always', so the counter-case is precisely the challenge to that absolute.
Approach
First, define the PPC and outward shift. Then, present the case for increasing labour force size: how it can cause an outward shift, with examples. Then, present the counter-case: other factors (capital, technology, labour quality) can also cause outward shifts, and sometimes more effectively. Then, evaluate the relative importance: when is labour size necessary? When are other factors more important? Finally, reach a justified conclusion that answers the question directly: it is not always necessary; it depends on the context.
Step-by-Step Reasoning
- Introduction: Define PPC, outward shift, and the labour factor. State the question and outline the essay structure.
- For increasing labour force size:
- More workers directly increase total output if other factors are constant.
- Example: immigration policy expands labour supply, shifts PPC outward.
- This is a direct mechanism.
- Against necessity:
- Labour quality: education and training raise productivity without increasing numbers.
- Capital accumulation: investment in machinery increases output per worker.
- Technology: innovation can increase potential output without more labour.
- Enterprise: entrepreneurial activity can reorganise production more efficiently.
- Example: Japan's economic growth after WWII came from capital and technology, not a large increase in labour force size.
- Evaluation:
- Consider the specific economic context: developing economies with surplus labour may benefit from increasing labour force size; developed economies with aging populations may need to focus on productivity.
- Diminishing returns: adding more labour without capital can lead to lower marginal productivity.
- Synergies: often, a combination of factors is needed.
- Conclusion: It is not always necessary; the extent depends on the economy's circumstances. The absolute claim is rejected.
Key Takeaways
- Outward shift of PPC can be caused by multiple factors: quantity and quality of all factors of production, and technology.
- Increasing the size of the labour force is one way, but not the only way.
- Evaluation requires considering the specific context and relative importance of different factors.
- A justified conclusion must directly address the 'always' in the question.
Common Mistakes
- One-sided response: only arguing that labour size is important without discussing other factors, losing all evaluation marks.
- Descriptive rather than analytical: listing factors without explaining how they cause a shift.
- No conclusion or vague conclusion: e.g., 'it depends' without specifying on what.
- Ignoring the absolute 'always' and not directly challenging it.
- Using irrelevant examples or not applying economic concepts accurately.
Things to Be Careful About
- Clearly define the PPC and the concept of outward shift.
- Use economic terminology: 'factors of production', 'diminishing returns', 'human capital', 'physical capital'.
- Ensure the evaluation is developed and supported with reasoning.
- The conclusion must be justified, not just a summary.
- Avoid being too general; stay focused on the specific question about the size of the labour factor.
Explain three components of the current account of the balance of payments and consider the extent to which a depreciation in the exchange rate will always lead to a surplus on the current account.
Answer
AO1: Three components of the current account
- Trade in goods: the value of physical exports and imports of tangible items, such as machinery, food, and oil.
- Trade in services: the value of invisible exports and imports, e.g., tourism, insurance, and financial services.
- Primary income: income earned from investments abroad (e.g., dividends, interest, and profits) and remittances, minus similar payments to foreign investors.
(Secondary income, such as foreign aid or worker remittances, is also a valid component.)
AO2: Effect of a depreciation on the current account
A depreciation of the exchange rate makes domestic exports cheaper in foreign currency and imports more expensive in domestic currency. This should increase the volume of exports and reduce the volume of imports. The net effect on the current account balance depends on the price elasticities of demand for exports and imports (the Marshall-Lerner condition). If the sum of these elasticities exceeds 1, the trade balance improves. Additionally, other components of the current account (primary and secondary income) are not directly affected by the exchange rate, so even if the trade balance improves, the overall current account may not move into surplus.
AO3: Evaluation and conclusion
A depreciation will not always lead to a surplus. First, if PEDs are low in the short run, the trade balance may initially worsen (J-curve effect). Second, the other components of the current account may offset any improvement in the trade balance. Third, the effect depends on the extent of the depreciation and the responsiveness of domestic firms. Therefore, a depreciation is not a guaranteed route to a surplus.
Conclusion: A depreciation can help reduce a deficit but does not always lead to a surplus; it depends on the price elasticities, the time period, and the behaviour of the other current account components.
A depreciation does not always lead to a current account surplus; it depends on the price elasticities of demand for exports and imports, the time period considered, and the behaviour of the other components of the current account.
Background Concept
The current account of the balance of payments records the net flow of goods, services, primary income, and secondary income between a country and the rest of the world. A deficit means the country is spending more on these items than it is earning. The exchange rate is the price of one currency in terms of another. A depreciation makes the currency cheaper, so exports become cheaper for foreigners and imports become more expensive for domestic residents. This is expected to improve the trade balance, but the outcome is not guaranteed because it depends on how responsive buyers are to price changes—captured by price elasticity of demand (PED). The Marshall-Lerner condition states that a depreciation improves the trade balance only if the sum of the absolute values of the PED for exports and imports is greater than 1.
Understanding the Question
Part (a) has two requirements: (1) Explain three components of the current account. (2) Consider the extent to which a depreciation in the exchange rate will always lead to a surplus on the current account. The command word "consider" indicates that a short evaluation is required, including a conclusion. The question contains an absolute claim ("always"), so the evaluation must challenge that claim by showing conditions under which the outcome does not hold. The mark scheme allocates 3 marks for AO1 (knowledge of the three components), 3 marks for AO2 (analysis of the depreciation effect), and 2 marks for AO3 (evaluation and conclusion).
Approach
First, identify three components from the current account: trade in goods, trade in services, and primary income (or secondary income). Provide a brief definition and example for each. This earns the AO1 marks. Then, for AO2, explain the mechanism of a depreciation: cheaper exports and dearer imports lead to a change in trade volumes, and the net effect depends on the Marshall-Lerner condition. Also note that other components of the current account are not directly affected. For AO3, evaluate the absolute claim: mention the J-curve effect, the importance of PED values, and the role of other components. End with a clear conclusion stating that it is not always the case. The answer should be concise but cover all points.
Step-by-Step Reasoning
-
Three components:
- Trade in goods: record the value of physical exports and imports. Example: exporting cars, importing oil.
- Trade in services: record the value of intangible exports and imports. Example: tourism, banking, insurance.
- Primary income: records income from investments abroad (dividends, interest, profits) and payments to foreign investors. Example: a UK company receiving dividends from its US subsidiary.
(Secondary income is also a component: transfers like foreign aid, but three are enough.)
-
Effect of depreciation:
- A depreciation means the domestic currency becomes less valuable relative to foreign currencies. For example, if the US dollar depreciates against the euro, US exports become cheaper for European buyers, and European imports become more expensive for US buyers.
- This price change should lead to an increase in the quantity of exports demanded and a decrease in the quantity of imports demanded, assuming normal demand behavior.
- The net effect on the trade balance (value of exports minus value of imports) depends on the price elasticities. If demand for exports is elastic (PED > 1), the percentage increase in quantity outweighs the percentage decrease in price, so export revenue rises. Similarly, if demand for imports is elastic, import expenditure falls. The Marshall-Lerner condition states that the trade balance improves if the sum of the absolute values of the two elasticities is greater than 1.
- However, the current account also includes primary and secondary income, which are not directly influenced by the exchange rate. So even if the trade balance improves, the overall current account may not move into surplus if, for example, primary income payments are large.
-
Evaluation of "always":
- The Marshall-Lerner condition may not be satisfied in the short run because demand elasticities are often low (e.g., consumers need time to adjust), leading to the J-curve effect: the trade balance initially worsens before improving.
- The other components of the current account can offset the trade improvement. For instance, if a country has large outflows of primary income (e.g., profit repatriation), the current account may remain in deficit even if the trade balance improves.
- The size of the depreciation matters: a small depreciation may not be enough to change trade flows significantly.
- There may be retaliation from trade partners, preventing the full benefit.
-
Conclusion: A depreciation is not a guaranteed route to a surplus. It can help, but the outcome depends on elasticities, time, and other components. Therefore, the statement is not always true.
Key Takeaways
- The current account has four components: trade in goods, trade in services, primary income, secondary income.
- A depreciation makes exports cheaper and imports more expensive, but the effect on the trade balance depends on the Marshall-Lerner condition (sum of PEDs > 1).
- The J-curve effect illustrates that the short-run impact may be negative.
- Other components of the current account are not directly affected by the exchange rate.
- When evaluating an absolute claim ("always"), look for exceptions and conditions that limit the statement.
Common Mistakes
- Listing only one or two components of the current account. Ensure three are named and briefly explained.
- Confusing the current account with the capital/financial account.
- Stating that depreciation always improves the trade balance without considering PEDs.
- Ignoring the other components of the current account (primary and secondary income) when evaluating the overall current account.
- Providing a one-sided evaluation that does not address the "always" claim.
- Forgetting to include a conclusion, which is reserved 1 mark.
Things to Be Careful About
- Use precise terminology: "depreciation" (for floating exchange rates) rather than "devaluation" (fixed rates).
- When explaining the Marshall-Lerner condition, do not calculate PEDs unless asked; just state the principle.
- The conclusion should be a clear judgement, not a summary. For example, say "A depreciation does not always lead to a surplus because..."
- Keep the answer focused on the question: do not discuss other policies or unrelated topics.
- The AO1 part is straightforward: identify and explain three components. Make sure each is distinct.
- The evaluation part is worth 2 marks, so keep it concise but include a developed point and a conclusion.
Assess the extent to which the use of supply-side policy would be the best way to reduce a deficit on the current account of the balance of payments.
Introduction
Supply-side policy refers to measures aimed at increasing the productive capacity of the economy, shifting the LRAS curve to the right. A current account deficit occurs when a country's payments for imports, income, and transfers exceed its earnings from exports, income, and transfers. This essay will assess whether supply-side policy is the best way to reduce such a deficit.
The case for supply-side policy
Supply-side policies can improve the competitiveness of domestic industries. For example:
- Investment in education and training raises worker productivity, reducing unit labour costs. Lower costs allow firms to lower export prices, increasing export volume and revenue.
- Investment in infrastructure (e.g., transport, digital networks) reduces production and distribution costs, again improving competitiveness.
- Subsidies to domestic firms (e.g., R&D tax credits) can help develop new products that are more attractive in export markets.
- Deregulation and reducing red tape lowers administrative costs and encourages competition, which can reduce prices and improve quality.
These policies address the root cause of a deficit—lack of competitiveness—rather than just suppressing demand. They are likely to be sustainable in the long run and avoid retaliation from trade partners, unlike protectionist measures. Moreover, they can have positive spillover effects on economic growth and employment.
The case against supply-side policy
However, supply-side policies have significant drawbacks:
- Time lags: Effects take years to materialise (e.g., training workers, building infrastructure). In the short run, the deficit may persist or worsen as imports continue to be demanded.
- Opportunity cost: Spending on training and infrastructure requires government expenditure, which may necessitate higher taxes or borrowing, potentially crowding out private investment.
- Uncertainty of outcome: The link between supply-side policy and export competitiveness is not guaranteed. For example, if the deficit is caused by a high propensity to import (e.g., due to consumer preferences), even improved domestic products may not substantially reduce imports.
- Not suitable for all types of deficit: If the deficit is due to a cyclical downturn (more imports due to high consumption), supply-side policy is less effective than demand-side measures.
Evaluation of alternative policies
Other policies can also reduce a current account deficit:
- Contractionary fiscal/monetary policy: Reduces aggregate demand, lowering imports. This works quickly but can cause a recession and unemployment.
- Depreciation of the currency: Makes exports cheaper and imports dearer, but depends on elasticities (Marshall-Lerner) and may cause inflation.
- Protectionism (tariffs, quotas): Can reduce imports quickly but invites retaliation, reduces consumer choice, and may lead to inefficiency.
Compared to these, supply-side policy is more sustainable and avoids many negative side effects, but it is slower. The "best" way depends on the time horizon: for a short-term reduction, demand-side policies or depreciation may be more effective; for a long-term solution, supply-side policy is superior.
Conclusion
Supply-side policy is the best way to reduce a current account deficit in the long run because it addresses the underlying competitiveness problem without causing demand-side contractions or retaliation. However, it is not the best in the short run, where other policies may be needed more urgently. The extent to which it is the best depends on the nature of the deficit (structural vs. cyclical) and the time available. A combination of policies, with supply-side measures as the core long-term strategy, is often the most effective approach.
Supply-side policy is the best way to reduce a current account deficit in the long run by improving competitiveness, but it is not the best in the short run where other policies may be more effective; a combination of policies is often necessary.
Background Concept
The current account deficit is a component of the balance of payments. It can be caused by low competitiveness (high costs, poor quality), a high propensity to import, a strong currency, or a domestic boom. Supply-side policy aims to increase the economy's productive potential by improving the quantity and quality of factors of production. This shifts the LRAS curve to the right, leading to lower prices and higher output, which can improve competitiveness in international markets. Other policies include demand-side (fiscal/monetary), exchange rate, and protectionist measures.
Understanding the Question
The question asks: "Assess the extent to which the use of supply-side policy would be the best way to reduce a deficit on the current account of the balance of payments." This is a levels-marked essay (12 marks). The command word "assess" requires a balanced evaluation and a justified conclusion. The answer must consider both the strengths and weaknesses of supply-side policy and compare it with alternative policies. The top band (AO1/AO2) requires detailed knowledge and fully developed analysis, with a well-organised, focused response. The AO3 band requires developed evaluative comments and a justified conclusion. A one-sided response will score zero for evaluation. The question also implies a comparison: "the best way" means we must judge whether supply-side policy is superior to other options.
Approach
Structure the essay as follows:
- Introduction: Define supply-side policy and current account deficit, state the scope of the essay.
- The case for supply-side policy: Explain how various supply-side tools can reduce the deficit, using chains of reasoning (e.g., training -> lower costs -> cheaper exports -> higher export revenue).
- The case against supply-side policy: Discuss limitations (time lags, opportunity cost, uncertain effectiveness).
- Evaluation of alternative policies: Briefly compare with demand-side, depreciation, and protectionism, highlighting their respective strengths and weaknesses.
- Conclusion: Give a justified judgement on the extent to which supply-side policy is the best, based on the criteria discussed (time horizon, nature of deficit).
Ensure that analysis is developed: do not just list policies, but explain the mechanism linking each policy to the current account deficit. Use examples where appropriate (e.g., investment in infrastructure in a specific country). The conclusion must be specific to the question and not just a summary.
Step-by-Step Reasoning
-
Introduction: Define supply-side policy as measures to increase productivity and shift LRAS right. Define current account deficit as a situation where imports exceed exports (plus net income/transfers). State that the essay will assess the effectiveness of supply-side policy relative to other policies.
-
The case for supply-side:
- Training and education: improves human capital -> higher productivity -> lower unit labour costs -> firms can reduce export prices -> quantity of exports demanded rises (assuming PED elastic) -> export revenue increases. Also, better quality products may lead to higher demand even at higher prices, increasing export revenue.
- Infrastructure: reduces transport and communication costs -> lower production costs -> same effect as above.
- Subsidies for R&D: innovation leads to new products that are more competitive in global markets -> increase exports. Also, import substitution becomes more viable as domestic firms produce goods previously imported.
- Deregulation: encourages competition -> firms must become more efficient -> lower costs and better quality -> benefits both exports and import substitution.
- These policies are sustainable because they increase the economy's supply capacity without causing inflation (in fact, they may be disinflationary). They also avoid the negative effects of protectionism (retaliation) and demand-side contraction (recession).
-
The case against supply-side:
- Time lags: education and infrastructure take years to yield results. In the interim, the deficit may persist or worsen, especially if demand-side policies are not used.
- Opportunity cost: government spending on supply-side measures may require higher taxes or borrowing, which could crowd out private investment or reduce consumption, potentially offsetting some of the benefits.
- Uncertain effectiveness: if the deficit is due to a high propensity to import (e.g., consumers prefer foreign goods regardless of price), supply-side policies may not significantly reduce imports. Also, if the deficit is caused by a strong currency, supply-side policy alone may not offset the price disadvantage.
- Not a quick fix: for a country facing an immediate crisis, supply-side policy is too slow.
-
Evaluation of alternatives:
- Contractionary fiscal policy (cut spending/raise taxes) reduces aggregate demand, lowering imports. Works quickly but can cause unemployment and recession. Also, it may not improve the structure of the economy.
- Contractionary monetary policy (raise interest rates) reduces consumption and investment, reducing imports. But higher interest rates may attract capital inflows, causing currency appreciation, which worsens the trade balance.
- Depreciation: makes exports cheaper and imports dearer. Can work quickly but depends on elasticities (Marshall-Lerner). May cause inflation and reduce real incomes. Also, depreciation does not address the underlying competitiveness issues.
- Protectionism: tariffs/quota reduce imports but invite retaliation, reduce consumer surplus, and may lead to inefficiency and lack of innovation.
-
Weighing the evidence:
- For a long-term structural deficit, supply-side policy is the best because it addresses the root cause. It is sustainable and has positive side effects on growth.
- For a short-term cyclical deficit, demand-side policies or depreciation are more effective in the short run, but they may have negative side effects.
- Therefore, the extent to which supply-side policy is the best depends on the time horizon and the nature of the deficit. In many cases, a combination of policies is optimal: supply-side for the long run, and demand-side/currency adjustments for immediate relief.
-
Conclusion: Supply-side policy is the best way to reduce a current account deficit in the long run because it improves competitiveness without causing recession or retaliation. However, it is not the best in the short run, and other policies may be needed. The extent depends on the specific circumstances.
Key Takeaways
- Supply-side policy can improve the trade balance by increasing competitiveness, but it takes time.
- A balanced evaluation must consider both the strengths and weaknesses of a policy.
- When comparing policies, consider criteria such as speed, sustainability, side effects, and appropriateness for the specific deficit.
- The conclusion must be justified and answer the specific question about the "extent" to which supply-side policy is the best.
- Avoid one-sided arguments; always present both sides for evaluation.
Common Mistakes
- Writing a one-sided answer that only explains the benefits of supply-side policy without considering its limitations or alternatives. This forfeits all evaluation marks.
- Failing to link supply-side policy specifically to the current account deficit. For example, discussing how supply-side policy increases GDP growth without mentioning the impact on exports and imports.
- Providing a list of policies without explanation of the mechanism (e.g., "training reduces costs" without explaining how that leads to higher exports).
- Ignoring alternative policies or not comparing them meaningfully.
- Giving a vague conclusion like "it depends" without specifying on what it depends and which way it leans.
- Not addressing the command word "assess" which requires a judgement.
Things to Be Careful About
- Ensure the analysis is developed: each point should include a chain of reasoning (e.g., policy -> effect on costs -> effect on prices -> effect on export volumes -> effect on current account).
- Use specific examples of supply-side policies (e.g., investment in high-speed rail, vocational training, tax incentives for R&D).
- When evaluating, use criteria such as time period, magnitude of effect, and side effects.
- The conclusion should clearly state the extent to which supply-side policy is the best, based on the arguments made.
- Keep the essay focused on the current account deficit; do not diverge into unrelated areas like inflation or unemployment unless they are directly relevant.
- The response should be well-organised with clear sections and logical flow.
With the help of an aggregate demand and aggregate supply (AD/AS) diagram, explain why two components of AD may increase and consider the extent to which an increase in AD will always lead to inflation.
Answer
An accurately labelled AD/AS diagram shows an increase in AD from AD1 to AD2, raising the price level from P1 to P2 and real GDP from Y1 to Y2, assuming an upward-sloping short-run AS curve.
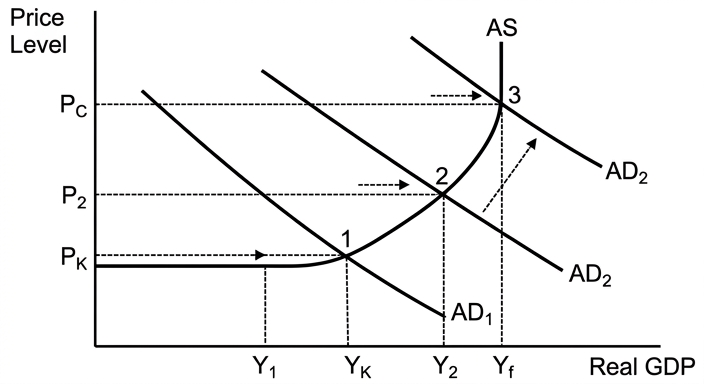
Two components of AD that may increase are consumption and investment. Consumption may rise due to a decrease in interest rates or an increase in consumer confidence. Investment may rise due to lower interest rates, improved business confidence, or technological advances that raise expected profitability.
An increase in AD shifts the AD curve to the right, leading to demand-pull inflation as the price level rises, provided the economy is not at full capacity. However, the extent to which inflation occurs depends on the shape of the aggregate supply curve. If the economy is in the Keynesian range of AS (horizontal), the increase in AD will raise real output with little or no rise in the price level, so no inflation. If the economy is at full capacity (vertical LRAS), the increase in AD will only raise the price level, causing inflation. Additionally, if the increase in AD is accompanied by supply-side policies that shift LRAS to the right, the inflationary pressure may be offset.
Therefore, an increase in AD does not always lead to inflation. It depends on the position of the economy on the AS curve and the presence of supply-side effects that can increase productive capacity. While demand-pull inflation is a possible outcome, it is not inevitable.
An increase in AD does not always lead to inflation; it depends on the slope of the AS curve and supply-side effects.
Background Concept
Aggregate demand (AD) is the total planned spending in an economy, comprising consumption (C), investment (I), government spending (G), and net exports (X-M). The AD curve slopes downward mainly because of the real balance effect, interest rate effect, and international trade effect. Aggregate supply (AS) shows the total output firms are willing to produce at different price levels. In the short run, the AS curve is typically upward sloping, but it can be horizontal (Keynesian range) when there is spare capacity, or vertical (classical range) at full employment. Demand-pull inflation occurs when AD increases and the economy is near or at full capacity, pushing up the price level.
Understanding the Question
This question has two parts: first, explain why two components of AD may increase; second, consider the extent to which an increase in AD will always lead to inflation. The command word "explain" requires a clear chain of reasoning, and "consider the extent" requires evaluation. The phrase "always" is an absolute claim, so the evaluation must provide circumstances where inflation does not occur. The question explicitly requires a diagram, which must be accurately labelled and explained.
Approach
Start by choosing two components of AD (e.g., consumption and investment). For each, state a reason for its increase (e.g., lower interest rates, higher confidence). Then draw the AD/AS diagram, showing the shift of AD to the right. Explain that the effect on the price level depends on the slope of AS: if AS is horizontal, output increases with no inflation; if AS is vertical, only price level rises; if AS is upward sloping, both output and price level rise. Also consider supply-side effects that could shift LRAS right, offsetting inflation. Conclude that the increase does not always lead to inflation.
Step-by-Step Reasoning
-
Two components of AD:
- Consumption (C) can increase due to lower interest rates, which reduce the cost of borrowing and encourage spending; or due to higher consumer confidence, which reduces precautionary saving.
- Investment (I) can increase due to lower interest rates, making borrowing cheaper for capital purchases; or due to technological improvements that raise the expected rate of return on investment.
-
Diagram: Draw an AD/AS diagram with price level on the vertical axis and real GDP on the horizontal axis. Draw an initial AD curve (AD1) and an upward-sloping short-run AS curve (SRAS). Show AD1 shifting right to AD2. The new equilibrium is at a higher price level (P2) and higher output (Y2). However, if the SRAS curve is horizontal (Keynesian range), the price level remains unchanged while output increases. If the SRAS curve is vertical (classical range), only the price level increases.
-
Analysis of inflation: A rightward shift of AD creates excess demand at the original price level, putting upward pressure on prices. This is demand-pull inflation. But if the economy is in a deep recession with high unemployment, the increase in AD translates into higher output and employment without inflation because firms can expand production without raising wages. Conversely, at full capacity, firms cannot increase output, so the increase in AD only bids up prices.
-
Supply-side effects: If the increase in AD is accompanied by government policies that enhance productivity (e.g., investment in infrastructure, tax incentives), the LRAS curve may shift right. This increases potential output and can absorb the increase in AD without raising the price level, or even reduce inflationary pressure.
-
Conclusion: The statement is not always true. The extent of inflation depends on the slope of the AS curve, which reflects the amount of spare capacity, and on supply-side responses.
Key Takeaways
- The AD/AS model is essential for analysing the effects of changes in aggregate demand on output and the price level.
- The shape of the AS curve determines whether an increase in AD leads to inflation, output growth, or both.
- Absolute claims in economics ("always", "never") should be challenged with counter-examples.
- Diagrams must be fully explained in the text to earn marks.
Common Mistakes
- Drawing a diagram without labels or without explaining the shift in the text.
- Only mentioning one component of AD instead of two.
- Stating that an increase in AD always causes inflation, ignoring the Keynesian range.
- Providing a one-sided evaluation without a conclusion.
- Confusing a movement along the AD curve with a shift of the AD curve.
Things to Be Careful About
- Label the axes correctly: Price Level (or Average Price Level) and Real GDP (or Real National Output).
- Label the equilibrium points and the direction of the shift.
- Distinguish between short-run AS and long-run AS.
- Ensure the evaluation directly addresses the "always" claim.
- Reserve 1 mark for a clear conclusion in the answer.
Assess the view that the effects of a high rate of inflation are always more damaging for consumers than for firms.
Introduction
High inflation is a sustained rise in the general price level. The statement claims that its effects are always more damaging for consumers than for firms. This essay will examine the effects on both groups and assess the validity of this claim.
Effects on consumers
High inflation erodes the real purchasing power of money, harming those on fixed incomes or with weak wage bargaining power. Shoe-leather costs arise as people make more trips to avoid holding cash. Fiscal drag may push individuals into higher tax brackets if nominal incomes rise. Loss of consumer confidence may reduce spending and saving.
However, consumers with debts (e.g., mortgages) gain as the real value of their debts falls. Homeowners and other asset owners see the nominal value of their assets rise, which may offset some losses. Consumers with strong wage bargaining power may negotiate wage increases that keep pace with inflation.
Effects on firms
Firms face menu costs from changing prices, loss of international competitiveness if domestic prices rise faster than abroad, and increased costs of raw materials and wages. Inflationary noise makes it harder to distinguish changes in relative prices, leading to poor investment decisions. Uncertainty reduces investment and long-term planning.
However, if inflation is demand-led, firms may sell more at higher prices, increasing profits. If costs rise slower than prices, profit margins increase. Firms with market power may pass on cost increases more easily. Exporters may benefit if the exchange rate depreciates in nominal terms.
Evaluation
The view that inflation is always more damaging to consumers is not fully accurate. The impact depends on the type of inflation (demand-pull vs cost-push), the speed of wage and price adjustment, the distribution of assets and debts, and the market power of firms. For example, a pensioner on a fixed income suffers greatly, while a firm with index-linked contracts may be less affected. Conversely, a firm with high import costs and no pricing power may suffer more than a consumer with flexible wages. High inflation is damaging to both, but which group is more hurt depends on relative bargaining power and financial positions.
Conclusion
The statement is an oversimplification. While consumers on fixed incomes are particularly vulnerable, firms can also be severely damaged by inflation, especially if they are internationally exposed or have weak pricing power. Therefore, the view that inflation is always more damaging for consumers is not justified. The distribution of the damage depends on the specific circumstances of each group.
The view that high inflation is always more damaging for consumers than for firms is not justified; the impact depends on the type of inflation, the ability of consumers and firms to adjust, and their respective financial positions. Both groups can suffer significantly, and the relative damage varies.
Background Concept
Inflation is a sustained increase in the general price level. It has various effects on different economic agents. Consumers experience a loss of purchasing power, especially if their incomes are fixed. Firms face rising costs and uncertainty about future prices. The consequences of inflation are not uniform; they depend on factors such as the rate of inflation, its cause, and the ability of agents to adjust. High inflation is particularly disruptive because it distorts decision-making, reduces the real value of savings, and can lead to economic instability.
Understanding the Question
The question asks to assess the view that the effects of a high rate of inflation are always more damaging for consumers than for firms. The command word "assess" requires a balanced analysis and a justified conclusion. The word "always" indicates an absolute claim, so the evaluation must provide conditions where the claim does not hold. The question is levels-marked, so the answer must be well-organised, develop both sides, and reach a clear conclusion. A one-sided response will score zero for evaluation.
Approach
Structure the essay in three parts: effects on consumers, effects on firms, and evaluation. For each group, first present the damaging effects, then consider counter-arguments (e.g., how consumers with debts gain, how firms with pricing power benefit). In the evaluation, weigh the two sides using criteria such as the type of inflation, the bargaining power of different groups, and the time period. Conclude that the statement is not always true; the relative damage depends on specific circumstances.
Step-by-Step Reasoning
-
Effects on consumers:
- Loss of purchasing power: Fixed-income earners (pensioners, workers without indexation) see their real income fall.
- Shoe-leather costs: People hold less cash and make more trips to the bank, reducing efficiency.
- Fiscal drag: As nominal incomes rise, individuals may move into higher tax brackets, reducing real disposable income.
- Uncertainty: High inflation reduces consumer confidence, leading to lower spending and saving.
- Counter: Debtors benefit because the real value of their debt falls. Homeowners see rising house prices, increasing their wealth.
-
Effects on firms:
- Menu costs: Firms must update prices frequently, incurring costs.
- Loss of competitiveness: If domestic inflation is higher than abroad, exports become more expensive in foreign currency, leading to falling sales and profits.
- Rising costs: Wages and raw material costs increase, squeezing profit margins unless firms can pass on costs.
- Inflationary noise: Firms find it harder to distinguish between changes in relative prices and general price rises, leading to misallocation of resources.
- Uncertainty: Future costs and revenues become harder to predict, reducing investment.
- Counter: If inflation is demand-pull, firms may experience higher sales and profits. If costs lag behind prices, profit margins increase. Firms with market power can pass on cost increases.
-
Evaluation:
- The type of inflation matters: Cost-push inflation hurts firms more directly through rising input costs, while demand-pull inflation may benefit firms.
- The bargaining power of consumers: Workers with strong unions can negotiate wage increases, protecting their real income. Consumers with debts (e.g., mortgages) are better off.
- The market structure: Firms in competitive markets cannot easily pass on cost increases, so they suffer more. Monopolistic firms may fare better.
- The time period: In the short run, consumers may suffer more due to fixed nominal contracts; in the long run, wages and prices adjust, and firms may face more persistent damage to competitiveness.
- The conclusion: The statement is an oversimplification. The relative damage depends on the specific characteristics of the economy and the groups involved.
Key Takeaways
- Inflation effects are not uniformly distributed; the impact depends on the economic position of the agent.
- Absolute claims like "always" should be challenged with counter-examples and conditions.
- A balanced discussion requires developing both sides of the argument.
- A clear, justified conclusion is essential for top-band marks.
Common Mistakes
- Writing a one-sided answer that only discusses the damaging effects on consumers, ignoring the counter-arguments and the effects on firms. This loses all evaluation marks.
- Describing the effects of inflation in general without linking them to the specific groups of consumers and firms.
- Failing to reach a conclusion or providing a vague conclusion (e.g., "it depends") without justification.
- Not addressing the word "always" – the answer must show that the claim is not always true.
- Confusing nominal and real values; e.g., stating that rising prices always reduce real incomes without considering indexation.
Things to Be Careful About
- Ensure the evaluation directly compares the two groups and reaches a verdict on the claim.
- Use specific examples (e.g., pensioners, firms in export markets) to support the analysis.
- Organise the essay logically: one section for consumers, one for firms, then evaluation.
- Avoid assertions without explanation; each point should be developed with a chain of reasoning.
- The conclusion should address the specific claim and state whether it is justified, and under what conditions.