Economics 9708/14 — October/November 2025
Cambridge AS Level · AS Level Multiple Choice · answer key with instant marking and worked solutions
Topics Exchange Rates · Methods of Government Intervention in Markets · Fiscal Policy · Classification of Goods and Services · Elasticities of Demand · Price Stability · +17 more
Tap an option under each question to check it — your score builds as you go.
What is characterised as a free good?
Options
A one that has zero opportunity cost
B one that is non-excludable and non-rivalrous
C one that is supplied by the government with no charge
D one that receives a 100% government subsidy
Answer
A free good is defined in economics as a good that has zero opportunity cost because it is abundant in relation to demand and does not require scarce resources for its production. Option A correctly expresses this definition. Therefore, the correct answer is A.
A
Background Concept
In economics, goods are classified by their relationship to scarcity. Most goods are economic goods – they are scarce and therefore entail an opportunity cost when consumed or produced. A free good, by contrast, is one that is abundant relative to the demand for it. Because there is enough for everyone without anyone having to forgo something else, the opportunity cost of using a free good is zero. Common examples include air, sunlight, and seawater in ordinary circumstances.
It is essential to distinguish a free good from a public good. A public good is non-excludable and non-rivalrous, but it is still an economic good: its provision uses scarce resources (e.g., defence, street lighting), so it has a positive opportunity cost. A free good, however, involves no sacrifice of resources. Goods provided free of charge by the government (e.g., state education) are not free goods – they still consume scarce resources such as labour and capital, and therefore have an opportunity cost.
Understanding the Question
The question asks: "What is characterised as a free good?" The command word is "characterised", meaning you must identify the defining feature of a free good from the options given. This is a pure recall (AO1) question testing your knowledge of the definitional distinction between free goods and other categories.
Each option describes a different concept:
- Option A: zero opportunity cost – this is the textbook definition of a free good.
- Option B: non-excludable and non-rivalrous – this defines a public good, not a free good.
- Option C: supplied by government with no charge – a government-provided good that still uses resources; not a free good.
- Option D: receives a 100% government subsidy – still an economic good; subsidy doesn't make it free; it still uses scarce resources.
Approach
To answer correctly, recall the precise definition of a free good from the syllabus: it is a good with zero opportunity cost. Then check each option against that definition. Eliminate any that describe a different category (public good, government-provided good, subsidised good). Only option A matches the definition exactly.
Step-by-Step Reasoning
-
Recall the definition: A free good is one that is not scarce; hence, it has zero opportunity cost. Using or consuming a free good does not require giving up any alternative because it is available in unlimited quantities.
-
Evaluate Option A: "one that has zero opportunity cost" – This is a direct match to the definition. Correct.
-
Evaluate Option B: "one that is non-excludable and non-rivalrous" – This defines a public good. While public goods may be free at the point of use, they are not free goods because they require resources to provide (e.g., a lighthouse uses labour and materials). Therefore, they have a positive opportunity cost. Incorrect.
-
Evaluate Option C: "one that is supplied by the government with no charge" – The government might charge zero price for certain services (e.g., primary education), but the production of those services uses scarce resources (teachers, buildings). The opportunity cost is positive. Thus, not a free good. Incorrect.
-
Evaluate Option D: "one that receives a 100% government subsidy" – A subsidy reduces the price paid by consumers but does not eliminate the use of scarce resources. The good remains an economic good. The opportunity cost is still positive. Incorrect.
-
Conclusion: Only option A is correct.
Key Takeaways
- The fundamental characteristic of a free good is zero opportunity cost, stemming from its abundance relative to demand.
- A good can be provided free of charge by the government and still be an economic good if its production uses scarce resources.
- Public goods (non-excludable and non-rivalrous) are not free goods; they involve opportunity cost.
- Always return to the scarcity-based distinction: if something is scarce, it has an opportunity cost and is not a free good.
Common Mistakes
- Confusing free goods with public goods: Many students choose Option B because they recall that public goods are "free" at the point of use. However, economics defines free goods by opportunity cost, not by the pricing mechanism.
- Assuming government provision implies zero opportunity cost: Government spending uses tax revenue that could have been used elsewhere. The opportunity cost is the best alternative forgone, so government-provided goods are not free goods.
- Thinking subsidies make a good free: A subsidy covers part of the cost, but the good still uses resources in production, so an opportunity cost exists.
Things to Be Careful About
- Always define a free good in terms of opportunity cost, not the price charged.
- Remember that even abundant goods can become scarce (e.g., clean air in polluted cities) and cease to be free goods.
- In multiple-choice questions, read each option carefully; some distractors are designed to test your understanding of related but distinct concepts like public goods or subsidised goods.
- The phrase "free good" in everyday language often means "no monetary cost", but in economics it means "no opportunity cost". Never mix the two meanings.
Which combination correctly identifies the rewards to each factor of production?
Options
| capital | enterprise | labour | land | |
|---|---|---|---|---|
| A | interest | profit | rent | wages |
| B | interest | profit | wages | rent |
| C | profit | interest | wages | rent |
| D | rent | wages | interest | profit |
Answer
Land earns rent, labour earns wages, capital earns interest, and enterprise earns profit. Option B matches this combination.
B
Background Concept
In economics, the factors of production are the inputs used to produce goods and services. The four factors are land, labour, capital, and enterprise. Each factor earns a reward for its contribution to production. Land earns rent (the payment for the use of natural resources). Labour earns wages (the payment for human effort). Capital earns interest (the payment for the use of physical and financial capital). Enterprise earns profit (the residual reward for risk-taking and organising the other factors).
Understanding the Question
This question presents a table with four columns (capital, enterprise, labour, land) and four rows (A, B, C, D) each showing a different ordering of the rewards (interest, profit, rent, wages). The task is to select the row that correctly matches each reward to its factor.
Approach
Recall the standard reward for each factor: land -> rent, labour -> wages, capital -> interest, enterprise -> profit. Then check each option to see which one pairs each factor with the correct reward. Option B is the only one that matches: capital (interest), enterprise (profit), labour (wages), land (rent).
Step-by-Step Reasoning
- Land: the payment for the use of natural resources is rent. So land should be paired with 'rent'. In the table, land is the fourth column. In option B, the fourth column is 'rent', which is correct. In option A, land is paired with 'wages', incorrect. Option C pairs land with 'rent' (correct), but that option's capital column is 'profit' (incorrect) and enterprise column is 'interest' (incorrect). Option D: land is 'profit', incorrect.
- Labour: the reward is wages. In option B, the third column (labour) is 'wages', correct.
- Capital: the reward is interest. In option B, the first column (capital) is 'interest', correct.
- Enterprise: the reward is profit. In option B, the second column (enterprise) is 'profit', correct.
Thus, option B is the correct combination.
Key Takeaways
- The four factors of production and their rewards are a foundational concept in economics.
- Land -> rent, Labour -> wages, Capital -> interest, Enterprise -> profit.
- This simple association is often tested in multiple-choice questions.
Common Mistakes
- Confusing the reward for capital (interest) with the reward for enterprise (profit). Capital refers to physical and financial assets, while enterprise is the human function of risk-taking and organisation.
- Mixing up the reward for land (rent) with the reward for labour (wages).
Things to Be Careful About
- Read the table carefully: the columns are in order capital, enterprise, labour, land. Option B shows interest, profit, wages, rent – exactly matching the correct order.
A government wants to move its economy away from central planning towards a market economy.
Which policy would be consistent with this aim?
Options
A introduce tariffs on imported goods
B privatise the ownership of electricity generation
C provide free education for primary school pupils
D reduce prices of foods such as wheat and rice
Answer
Moving from central planning to a market economy requires reducing government control and increasing the role of market forces. Privatisation transfers ownership of state-owned enterprises to private individuals, aligning with market principles. The other options involve government intervention: tariffs restrict trade, free education is state provision, and price controls are direct intervention. Therefore, the correct answer is B.
B
Background Concept
In a centrally planned economy, the government owns the factors of production and makes all decisions about resource allocation. In a market economy, private individuals and firms own resources, and prices serve as signals to allocate goods and services. Transitioning from planning to a market economy typically involves policies such as privatisation, deregulation, price liberalisation, and removal of trade barriers. Each policy reduces the role of the state and expands the scope of market forces.
Understanding the Question
The question asks which policy would be consistent with the aim of moving from central planning to a market economy. It is a multiple-choice question with four options. The correct answer must be a policy that reduces government control and increases reliance on markets. The other three options represent forms of government intervention that would either maintain or increase central planning.
Approach
To identify the correct answer, evaluate each option against the goal of reducing central planning:
- A – Introducing tariffs is a form of protectionism that increases government intervention in international trade. This is inconsistent with a market-oriented transition.
- B – Privatising electricity generation transfers ownership from the state to private firms. This reduces government control and allows market forces to determine production and pricing. It is consistent with the aim.
- C – Providing free education is a government provision of a service. It expands the state's role in the economy, which is inconsistent with moving towards a market economy.
- D – Reducing the prices of foods such as wheat and rice implies government price controls, a direct intervention in markets. This is opposite to market liberalisation.
Only option B satisfies the condition.
Step-by-Step Reasoning
- Understand the aim: moving from central planning to a market economy means reducing government ownership and decision-making, and increasing the role of private property and price signals.
- Examine each option:
- Option A: Tariffs are government-imposed taxes on imports. They restrict free trade and are a form of intervention. Not consistent.
- Option B: Privatisation transfers state-owned enterprises to private ownership. Private owners respond to market incentives, so this is a core market reform. Consistent.
- Option C: Free education is a government-funded service. It increases the size of the public sector. Not consistent.
- Option D: Government-mandated price reductions are price controls. They prevent markets from reaching equilibrium. Not consistent.
- Conclude that B is the only policy that aligns with the aim.
Key Takeaways
- Transition from central planning to a market economy involves reducing state ownership and control.
- Privatisation is a key policy in such transitions.
- Policies that increase government intervention (tariffs, free provision, price controls) are inconsistent with the goal of moving towards a market economy.
Common Mistakes
- Confusing a policy that lowers prices (D) with a market-friendly policy. In a market economy, prices are determined by supply and demand, not by government decree.
- Thinking that free education is a good thing in general and therefore must be consistent with a market economy. That is a value judgement; the question is about the direction of economic system change, not about welfare.
- Overlooking that tariffs are a form of government intervention, not a free-market policy.
Things to Be Careful About
- Read the question precisely: it asks for a policy consistent with the aim of moving towards a market economy, not simply any policy that might be beneficial.
- Ensure you understand the difference between a market economy and a mixed economy. The question specifically mentions movement away from central planning, so the correct answer must reduce the role of the state.
- In multiple-choice questions, eliminate clearly wrong options first. Here, options A, C, and D are all interventionist, leaving B as the only plausible choice.
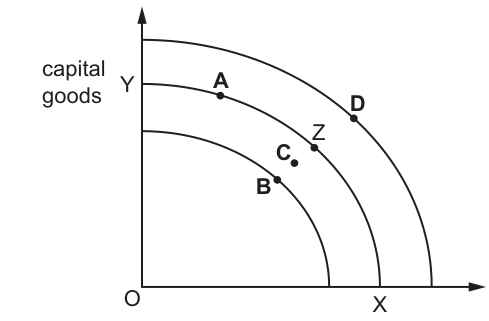
A country is currently producing at output Z on production possibility curve XY. Its annual economic growth rate is forecast to decline over the next ten years to 5% per year.
If the forecast is correct, which point represents its most likely economic output in 10 years?
Options
A point A on Fig. 4.1
B point B on Fig. 4.1
C point C on Fig. 4.1
D point D on Fig. 4.1
Reasoning
Economic growth increases an economy's productive capacity, causing the entire production possibility curve (PPC) to shift outward (away from the origin). The original PPC is XY, with point Z on it representing current output. Point A is on the original XY curve, so represents no growth. Point B is inside XY, representing underutilisation of resources, not growth. Point C is on a slightly outward-shifted curve, inconsistent with the magnitude of 5% annual growth over 10 years. Point D is on the outermost PPC, representing the full outward shift from 10 years of economic growth.
Answer
D
D
Background Concept
A production possibility curve (PPC) is a fundamental economic model that shows the maximum possible output combinations of two goods or services an economy can produce when all its resources (land, labour, capital, enterprise) are fully and efficiently utilised, given the current state of technology. The curve is typically concave to the origin due to increasing opportunity cost: as production of one good increases, the opportunity cost (the output of the other good sacrificed) rises because resources are not equally suited to producing both goods.
Points on the PPC represent efficient use of resources, as the economy cannot produce more of one good without producing less of the other. Points inside the PPC represent inefficient or underutilised resources (for example, due to high unemployment or idle factory capacity), meaning the economy could produce more of both goods without extra resources. Points outside the PPC are unattainable with the economy's current resource stock and technology.
Economic growth is defined as an increase in an economy's productive capacity over time. It can be caused by factors such as growth in the size or quality of the labour force, increases in the capital stock, technological progress, or improvements in the education and skills of the workforce. When economic growth occurs, the entire PPC shifts outward (away from the origin), as the economy can now produce more of both goods than was previously possible. The magnitude of the outward shift depends on the size and duration of the growth rate.
Understanding the Question
The question describes a country currently producing at point Z on its existing PPC, labelled XY. It states that the country's annual economic growth rate is forecast to be 5% per year for the next 10 years, and asks which point (A, B, C or D) will represent its most likely output after 10 years if the forecast is correct.
This is a 1-mark multiple-choice question testing knowledge of the relationship between economic growth and the PPC. The key task is to link the forecast growth to the resulting change in the PPC, then match that change to the correct point on the diagram. The diagram shows three concentric PPCs: the original innermost XY, a middle PPC slightly further from the origin, and the outermost PPC furthest from the origin. Points A and Z lie on XY, B lies inside XY, C lies on the middle PPC, and D lies on the outermost PPC.
Approach
To solve this question, first recall the core effect of economic growth on the PPC: it causes an outward shift of the entire curve, as productive capacity increases. Next, eliminate incorrect options based on their position relative to the original PPC:
- Eliminate points on the original XY curve (A and Z): these represent the same productive capacity as today, with no growth, so they cannot be the output after 10 years of growth.
- Eliminate point B, which lies inside XY: this represents underutilisation of existing resources (for example, during a recession), not an increase in productive capacity from growth, so it is incorrect.
- Compare points C and D: both lie on PPCs shifted outward from XY, but 5% annual growth compounded over 10 years equals a total growth factor of (1.05)^10 ≈ 1.63, meaning the economy's productive capacity will be ~63% higher after 10 years. This is a substantial increase, so the PPC will shift to the outermost curve, making point D the correct answer.
Step-by-Step Reasoning
- First, define the PPC context: it shows the maximum possible output of capital goods (vertical axis) and consumer goods (horizontal axis) the economy can produce with its current resources and technology, assuming full and efficient use of those resources.
- Economic growth is an increase in the economy's long-run productive capacity, meaning it can produce more of both goods than before. This is represented by an outward shift of the entire PPC, not just a movement along the existing curve. A movement along the curve only changes the mix of outputs (e.g. producing more capital goods and fewer consumer goods), it does not represent growth in total capacity.
- The original PPC is XY, with point Z on it representing the country's current efficient output.
- Point A is on the original XY curve: this would mean the economy's productive capacity is unchanged after 10 years, which contradicts the forecast of positive economic growth, so A is incorrect.
- Point B lies inside the original XY curve: this represents a situation where resources are not fully or efficiently used, not an increase in the economy's ability to produce, so B is incorrect.
- Point C lies on a PPC that is only slightly further from the origin than XY. This would represent very small growth over 10 years, which is inconsistent with a 5% annual growth rate. Compounding 5% growth for 10 years results in a total output capacity more than 1.5 times the original, which requires a much larger outward shift than the middle PPC shows, so C is incorrect.
- Point D lies on the outermost PPC, which is the furthest shift away from the origin. This represents the largest increase in productive capacity, matching the effect of 10 years of sustained 5% annual economic growth. Points on this curve are efficient output combinations that were unattainable before the growth occurred.
- Therefore, point D is the most likely output of the economy after 10 years of growth.
Key Takeaways
- Economic growth is always represented by an outward shift of the entire PPC, as it increases the economy's maximum possible output of all goods.
- The position of a point relative to the PPC tells us about resource utilisation: on the curve = efficient, inside = inefficient, outside = unattainable with current resources.
- The magnitude of the outward shift depends on the size and length of the growth period: higher growth rates over longer periods lead to larger shifts.
Common Mistakes
- Confusing a movement along the PPC with a shift of the curve: a movement along the curve (e.g. from Z to A) only changes the mix of capital and consumer goods produced, it does not represent economic growth, which is a shift of the entire curve.
- Choosing point C: failing to account for the compounding effect of 5% annual growth over 10 years, which leads to a much larger outward shift than the middle PPC shows.
- Choosing point B: confusing economic growth with underutilisation of resources. Point B represents a recession or idle resources, not an increase in the economy's capacity to produce.
- Choosing point A: assuming that growth means producing more of one good, rather than more of both, which requires a shift of the entire curve.
Things to Be Careful About
- Always remember that economic growth increases the productive capacity of the economy for all goods, so the entire PPC shifts outward, not just a single point moving along the existing curve.
- When calculating the total effect of annual growth over multiple years, use compounding: 5% annual growth over 10 years is not 50% total growth, but (1.05)^10 - 1 ≈ 63% total growth, which is a large enough increase to shift the PPC to the outermost curve shown.
- Ensure you match the magnitude of the growth to the size of the PPC shift: small growth over a short period would lead to a small outward shift, but 5% per year for a decade is substantial growth, requiring the largest shift shown.
Which statement about factors of production is correct?
Options
A In the short run all factors are fixed; in the long run all factors are varied.
B In the short run at least one factor is fixed; in the long run all factors can be varied.
C In the short run at least one factor is varied; in the long run all factors are fixed.
D In the short run at least one factor is varied; in the long run at least one factor is fixed.
Answer
In economics, the short run is defined as the period of time in which at least one factor of production is fixed, typically capital. The long run is defined as the period of time in which all factors of production can be varied. Therefore, option B correctly states this distinction.
Answer
B
B
Background Concept
In production theory, economists distinguish between the short run and the long run based on the flexibility of factor inputs. The short run is not a specific calendar length but a period during which at least one factor of production (usually capital, such as machinery or factory size) is fixed and cannot be changed. Firms can only adjust variable inputs like labour or raw materials. The long run is a period long enough for all factors, including capital, to be varied. This distinction is crucial for understanding cost curves, production decisions, and market behaviour.
Understanding the Question
This multiple-choice question tests the candidate's knowledge of the basic definitions of short run and long run. It presents four options that mix the concepts of 'fixed' and 'varied' factors. The correct answer must match the standard economic definitions.
Approach
Recall the standard definitions: short run – at least one factor fixed; long run – all factors variable. Then evaluate each option against these definitions.
Step-by-Step Reasoning
-
Option A (Incorrect): 'In the short run all factors are fixed; in the long run all factors are varied.' This is wrong because in the short run, not all factors are fixed; only at least one is fixed. Variable factors, such as labour, can be changed.
-
Option B (Correct): 'In the short run at least one factor is fixed; in the long run all factors can be varied.' This matches the standard definitions exactly.
-
Option C (Incorrect): 'In the short run at least one factor is varied; in the long run all factors are fixed.' This reverses the definitions; the long run is about flexibility, not fixity.
-
Option D (Incorrect): 'In the short run at least one factor is varied; in the long run at least one factor is fixed.' This fails because in the long run all factors can be varied; no factor is permanently fixed.
Key Takeaways
- The short run has at least one fixed factor; the long run has all factors variable.
- This distinction is foundational for understanding production costs, supply elasticity, and firm behaviour.
- The time period is conceptual, not clock-based; it varies by industry.
Common Mistakes
- Confusing the definitions: thinking that the short run means all factors are fixed (option A) or that the long run still has some fixed factors (option D).
- Assuming that the short run is a fixed calendar length, rather than a period defined by factor fixity.
Things to Be Careful About
- Remember that the short run always has at least one fixed factor, but not all factors are fixed.
- The long run is not about 'all factors fixed' but about 'all factors variable'.
- The distinction is about the ability to change factor inputs, not about time per se.
Diagrams
No diagram is required for this question.
Which factor affects the price elasticity of supply of a product?
Options
A availability of stocks
B percentage of income spent on the product
C price of substitutes
D wage rate
Answer
Price elasticity of supply (PES) measures the responsiveness of quantity supplied to a change in price. A key factor determining PES is the availability of stocks. If a firm holds large stocks of the finished product, it can increase supply quickly when price rises, making supply more elastic. The other options — percentage of income spent on the product and price of substitutes — affect price elasticity of demand, not supply. The wage rate affects costs of production and thus the position of the supply curve, but not its elasticity.
Answer
A
A
Background Concept
Price elasticity of supply (PES) is defined as:
PES = % change in quantity supplied / % change in price
It measures how responsive producers are to price changes. Supply is elastic (PES > 1) when firms can increase output easily, and inelastic (PES < 1) when they cannot. The main factors affecting PES are:
- Availability of stocks: If firms hold inventories, they can release them onto the market quickly when price rises, making supply more elastic.
- Spare production capacity: Firms with unused capacity can increase output without large cost increases.
- Time period: In the short run, supply tends to be more inelastic because it takes time to increase production; in the long run, firms can expand capacity, making supply more elastic.
- Ease of factor substitution: If inputs can be switched easily, supply is more elastic.
- Complexity of production: Simple production processes allow quicker output changes.
Understanding the Question
This is a straightforward multiple-choice question asking which factor affects the price elasticity of supply. The four options are:
A. availability of stocks
B. percentage of income spent on the product
C. price of substitutes
D. wage rate
The question tests whether the student can distinguish between factors that affect supply elasticity and those that affect demand elasticity or the position of the supply curve.
Approach
Recall the list of factors that determine PES. Then evaluate each option:
- Option A is a standard factor affecting PES.
- Options B and C are factors affecting price elasticity of demand (PED).
- Option D affects the cost of production and therefore shifts the supply curve, but does not affect its elasticity.
Step-by-Step Reasoning
-
Option A — availability of stocks: This is correct. If a firm has large stocks, it can increase supply quickly when price rises, making supply more elastic. Conversely, if stocks are low, supply is more inelastic.
-
Option B — percentage of income spent on the product: This is a factor affecting PED. Products that take up a large proportion of income tend to have more elastic demand because consumers are more sensitive to price changes. It has no bearing on supply elasticity.
-
Option C — price of substitutes: This is also a factor affecting PED. The availability of close substitutes makes demand more elastic. It does not affect supply elasticity.
-
Option D — wage rate: The wage rate is a cost of production. A change in the wage rate shifts the supply curve (e.g., higher wages reduce supply at each price), but it does not change the responsiveness of quantity supplied to price changes — i.e., it does not affect PES.
Therefore, the correct answer is A.
Key Takeaways
- Factors affecting PES are about the producer's ability to change output quickly: stocks, spare capacity, time, and ease of factor substitution.
- Factors affecting PED are about consumer responsiveness: availability of substitutes, necessity vs. luxury, proportion of income, and time.
- A change in costs shifts the supply curve but does not change its elasticity.
Common Mistakes
- Confusing factors that affect PES with those that affect PED. Options B and C are common distractors because students may mix up the two elasticities.
- Thinking that a change in costs (like wage rates) changes elasticity. It changes the position of the supply curve, not its slope.
Things to Be Careful About
- Read the question carefully: it asks about price elasticity of supply, not demand.
- Remember that elasticity is about responsiveness, not about the direction of a shift.
- The availability of stocks is a classic factor for PES — it is often the first one taught.
A firm sells 10 000 units of a product which has an estimated income elasticity of demand of -0.4.
If incomes have fallen by 10%, what is the new quantity demanded?
Options
A 9000
B 9600
C 10 000
D 10 400
Working
Income elasticity of demand (YED) = % change in quantity demanded / % change in income.
Rearranging: % change in quantity demanded = YED × % change in income = (-0.4) × (-10%) = +4%.
The negative sign of YED indicates the product is an inferior good, so a fall in income leads to an increase in quantity demanded.
New quantity demanded = 10,000 × (1 + 0.04) = 10,400.
Answer
D
D
Background Concept
Income elasticity of demand (YED) measures the responsiveness of quantity demanded of a good to a change in consumers' income. It is calculated as the percentage change in quantity demanded divided by the percentage change in income. The sign of YED tells us whether the good is a normal good (positive YED) or an inferior good (negative YED). For normal goods, an increase in income leads to an increase in quantity demanded. For inferior goods, an increase in income leads to a decrease in quantity demanded. The magnitude of YED indicates the degree of responsiveness: if |YED| > 1, demand is income elastic; if |YED| < 1, it is income inelastic.
Understanding the Question
The question gives us: initial quantity = 10,000 units, YED = -0.4, and income has fallen by 10%. We need to find the new quantity demanded. The negative YED tells us that the good is an inferior good, so a fall in income will increase the quantity demanded. We need to calculate the percentage change in quantity demanded using the YED formula, then apply it to the initial quantity.
Approach
We will use the formula for YED: %ΔQd / %ΔIncome = YED. Rearranging gives %ΔQd = YED × %ΔIncome. We plug in the given values, being careful with signs: YED = -0.4, %ΔIncome = -10% (a fall is negative). Multiply to get %ΔQd = (-0.4) × (-10%) = +4%. Then apply this percentage increase to the initial quantity: new quantity = 10,000 × (1 + 0.04) = 10,400. The answer is D.
Step-by-Step Reasoning
- Recall the formula for YED: YED = (Percentage change in quantity demanded) / (Percentage change in income).
- We are given YED = -0.4 and percentage change in income = -10% (since income fell). Note: a fall is represented by a negative percentage change.
- Rearranging: Percentage change in quantity demanded = YED × Percentage change in income.
- Substitute: %ΔQd = (-0.4) × (-10%) = +4%. The negative signs cancel, giving a positive 4% change. This is consistent with an inferior good: when income falls, quantity demanded rises.
- Now calculate the new quantity demanded: initial quantity = 10,000. A 4% increase means new quantity = 10,000 × (1 + 0.04) = 10,000 × 1.04 = 10,400.
- Therefore, the correct option is D (10,400).
Key Takeaways
- YED is a measure of how quantity demanded responds to changes in income.
- The sign of YED is crucial: positive for normal goods, negative for inferior goods.
- When calculating, always pay attention to the signs of both the coefficient and the percentage change in income.
- The formula works both ways: if you know YED and the % change in income, you can find the % change in quantity demanded.
Common Mistakes
- Incorrectly applying the sign: forgetting that a fall in income is a negative change, or neglecting the negative YED sign, could lead to a decrease in quantity demanded (e.g., 10,000 – 400 = 9,600, option B). This is a common error.
- Using the formula incorrectly: some might think that YED = %ΔQd * %ΔIncome, but that is wrong.
- Misinterpreting the sign: not understanding that a negative YED means the good is inferior, so a fall in income leads to a rise in quantity demanded.
Things to Be Careful About
- Always include the sign of the percentage change in income: a fall is negative, a rise is positive.
- The product of two negatives gives a positive, so the quantity demanded changes in the opposite direction to income for an inferior good.
- The calculation is straightforward, but the sign interpretation is key.
- Ensure you apply the percentage change to the initial quantity correctly: new quantity = initial × (1 + % change/100).
The diagram shows the market for fresh fruit in an economy. Fruit has a positive income elasticity of demand and is mainly imported. The original equilibrium is at X.
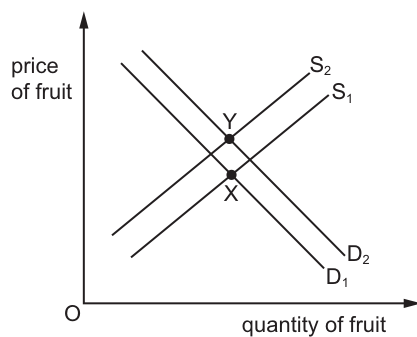
What is the most likely cause of the equilibrium point moving from X to Y?
Options
A a fall in real income and a depreciation of the exchange rate
B a fall in real income and an appreciation of the exchange rate
C a rise in real income and a depreciation of the exchange rate
D a rise in real income and an appreciation of the exchange rate
Reasoning
Fruit has a positive income elasticity of demand, so it is a normal good. A rise in real income increases demand, shifting the demand curve right from D1 to D2. As fruit is mainly imported, a depreciation of the exchange rate raises import costs, reducing supply and shifting the supply curve left from S1 to S2. The diagram shows equilibrium moving from X (D1/S1) to Y (D2/S2) with a higher price, which matches this combination. A fall in income would shift demand left, and an appreciation would shift supply right, neither of which fits the diagram.
Answer
C
C
Background Concept
Income elasticity of demand (YED) measures the responsiveness of the quantity demanded of a good to a change in real consumer income, calculated as the percentage change in quantity demanded divided by the percentage change in real income. A positive YED indicates the good is a normal good: demand rises when real income rises, and falls when real income falls. A negative YED indicates an inferior good, where demand moves opposite to changes in real income.
The exchange rate is the price of one country's currency in terms of another's. A depreciation occurs when the domestic currency loses value relative to foreign currencies, meaning more domestic currency is needed to buy a given amount of foreign currency. For goods that are mainly imported, this raises the cost of purchasing them from abroad, so domestic suppliers are willing to sell less at every domestic price, shifting the supply curve left. An appreciation is the opposite: the domestic currency gains value, imports become cheaper, and the supply of imported goods increases, shifting the supply curve right.
In a demand and supply model, a rightward shift in demand (increase in demand) raises both equilibrium price and quantity, all else equal. A leftward shift in supply (decrease in supply) raises equilibrium price but lowers equilibrium quantity. When both shifts occur simultaneously, the equilibrium price will definitely rise (as both shifts put upward pressure on price), but the change in equilibrium quantity is ambiguous, depending on the relative size of the two shifts.
Understanding the Question
The question provides a demand and supply diagram for fresh fruit, with original equilibrium X at the intersection of demand curve D1 and supply curve S1, and new equilibrium Y at the intersection of D2 (to the right of D1) and S2 (to the left of S1). This tells us demand has increased (shifted right) and supply has decreased (shifted left), leading to a higher equilibrium price at Y than at X. Two key facts about fruit are given: it has a positive income elasticity of demand (so it is a normal good), and it is mainly imported. The task is to identify which combination of a change in real income and a change in the exchange rate would cause the observed shifts in demand and supply. This is a multiple-choice question requiring application of demand and supply theory and exchange rate effects to interpret the diagram.
Approach
We will solve this by testing each causal link separately, then combining them to match the diagram:
- First, use the positive income elasticity of demand to determine how a change in real income affects the demand for fruit, and match this to the observed demand shift (D1 to D2, rightward).
- Second, use the fact that fruit is mainly imported to determine how a change in the exchange rate affects the supply of fruit, and match this to the observed supply shift (S1 to S2, leftward).
- Eliminate any options that do not match both shifts, and confirm the price change in the diagram is consistent with the remaining option.
Step-by-Step Reasoning
- Effect of real income on demand: The question states fruit has a positive income elasticity of demand. By definition, this means fruit is a normal good: when real income rises, consumers have greater purchasing power and buy more fruit at every price, so demand increases and the demand curve shifts right. When real income falls, demand decreases and the demand curve shifts left.
The diagram shows demand has shifted right from D1 to D2, so this must be caused by a rise in real income. This immediately eliminates options A and B, both of which state a fall in real income, as they would shift demand left, not right. - Effect of exchange rate on import supply: Fruit is mainly imported, so its domestic supply depends on the cost of purchasing it from foreign producers. The exchange rate determines how much domestic currency is required to buy foreign currency to pay for these imports.
- A depreciation of the exchange rate means the domestic currency has fallen in value relative to foreign currencies. To buy the same quantity of imported fruit, domestic suppliers now need to spend more domestic currency, raising their costs. At every possible domestic price, they are willing to supply less fruit, so the supply curve shifts left from S1 to S2, which exactly matches the diagram.
- An appreciation of the exchange rate (the opposite of depreciation) would make imports cheaper, lowering suppliers' costs and shifting the supply curve right, which does not match the diagram. This eliminates option D.
- Confirming the price effect: Both a rightward demand shift and a leftward supply shift put upward pressure on the equilibrium price. The diagram clearly shows equilibrium Y has a higher price than X, which is consistent with the combination of a rise in real income and a depreciation. If we had a fall in income (demand left) and appreciation (supply right), price would fall, which does not fit the diagram.
- The only option that explains both the rightward demand shift and leftward supply shift, and matches the higher equilibrium price, is option C.
Key Takeaways
- The sign of the income elasticity of demand tells you whether a good is normal (positive YED) or inferior (negative YED), and therefore how demand responds to income changes.
- For imported goods, exchange rate movements directly affect domestic supply: depreciation reduces supply (left shift), appreciation increases supply (right shift). For exported goods, exchange rate movements affect demand instead.
- When analysing simultaneous demand and supply shifts, the direction of the equilibrium price change can confirm the correct combination of shifts, as some shift combinations lead to a certain price change even when the quantity change is ambiguous.
- Always use all given information in the question: the positive YED and the fact that fruit is imported are essential details, not extra context.
Common Mistakes
- Confusing depreciation and appreciation: Students often mix up which exchange rate change makes imports more expensive. Remember: depreciation means the domestic currency is weaker, so imports cost more; appreciation means the domestic currency is stronger, so imports cost less.
- Misapplying YED: A positive YED means demand rises with income, so a rise in income shifts demand right. Students sometimes incorrectly shift demand left for a normal good when income rises.
- Ignoring the import detail: If fruit were domestically produced, an exchange rate change would not directly affect the domestic supply curve. The "mainly imported" fact is critical for identifying the supply shift cause.
- Matching only one shift: Some students identify the demand shift right from higher income, but fail to check the supply shift, leading them to incorrectly choose option D (which has an appreciation, causing a rightward supply shift that does not fit the diagram).
- Forgetting to check the price change: The diagram clearly shows a higher price at Y, so any option that would lead to a lower price can be eliminated immediately, narrowing down the choices quickly.
Things to Be Careful About
- Always cross-reference both curve shifts in the diagram: the correct option must explain both the rightward demand shift and the leftward supply shift, not just one.
- Use the exact information given: do not assume fruit is inferior or domestically produced, even if that is common in some contexts — the question explicitly states it has positive YED and is mainly imported.
- For multiple-choice questions with diagrams, verify that the proposed cause matches every feature of the diagram (direction of both shifts, price change, quantity change if relevant) before selecting an answer.
- Remember that simultaneous shifts in opposite directions for demand and supply always lead to a certain price change (in this case, higher price) but an ambiguous quantity change, which can be used to check your reasoning.
What is a major function of the price mechanism?
Options
A providing incentives for government intervention to reduce income inequality
B removing shortages by creating incentives for market prices to fall
C removing surpluses by creating incentives for market prices to rise
D signalling changes in market conditions to producers and consumers
Reasoning
The price mechanism has three key functions: signalling, rationing, and incentivising. Option D correctly describes the signalling function – price changes signal changes in market conditions, guiding producers and consumers in their decisions. Option A is incorrect because the price mechanism itself does not provide incentives for government intervention; it is a market-based mechanism. Option B is incorrect: a shortage leads to excess demand, which pushes prices upward, not downward, and the higher price then incentivises increased supply. Option C is incorrect: a surplus leads to excess supply, which pushes prices downward, not upward, and the lower price incentivises decreased supply. Therefore, D is the correct answer.
Answer
D
D
Background Concept
The price mechanism is the system by which market prices allocate scarce resources among competing uses. In a free market, prices are determined by the interaction of demand and supply and perform three major functions:
- Signalling function: Price changes convey information about changes in market conditions. For example, a rise in price signals that demand has increased relative to supply, encouraging producers to produce more and consumers to consume less. A fall in price signals the opposite.
- Rationing function: Prices ration scarce goods to those who are willing and able to pay the market price. When demand exceeds supply, the price rises, rationing the limited supply to those who value it most (as measured by willingness to pay).
- Incentivising function: Prices create incentives for market participants to respond. Higher prices incentivise producers to increase supply and may encourage new firms to enter the market. Lower prices incentivise consumers to purchase more and may force inefficient producers to exit.
These functions work together to bring about a market equilibrium and to maintain stability in the allocation of resources.
Understanding the Question
The question asks: "What is a major function of the price mechanism?" It is a multiple-choice question with four options, each stating a different claimed function. The correct answer must match one of the standard functions. The distractors
- Option A: "providing incentives for government intervention to reduce income inequality"
- Option B: "removing shortages by creating incentives for market prices to fall"
- Option C: "removing surpluses by creating incentives for market prices to rise"
Note that options B and C both misstate the direction of price changes in response to shortages and surpluses. Option A introduces government intervention, which is not a function of the market price mechanism itself.
Approach
- Recall the three main functions of the price mechanism: signalling, rationing, and incentivising.
- Evaluate each option against these functions.
- Option D matches the signalling function.
- Option A is not a direct function – government intervention is a separate policy response.
- Option B: a shortage causes price to rise, not fall; the incentive is to increase supply, not to reduce price.
- Option C: a surplus causes price to fall, not rise; the incentive is to reduce supply, not to increase price.
- Conclude that D is correct.
Step-by-Step Reasoning
- Option A: "providing incentives for government intervention to reduce income inequality". The price mechanism does not inherently provide incentives for government intervention. Government intervention may occur to correct market failures or redistribute income, but that is a separate process. The price mechanism itself is about market signals, not government action. Hence, A is incorrect.
- Option B: "removing shortages by creating incentives for market prices to fall". A shortage occurs when quantity demanded exceeds quantity supplied at the current price. In a free market, this excess demand pushes the price upward. The higher price then incentivises producers to increase supply and consumers to reduce demand, ultimately eliminating the shortage. The price rises, not falls. Therefore B is incorrect.
- Option C: "removing surpluses by creating incentives for market prices to rise". A surplus occurs when quantity supplied exceeds quantity demanded. This excess supply pushes the price downward. The lower price incentivises consumers to buy more and producers to produce less, eliminating the surplus. The price falls, not rises. Therefore C is incorrect.
- Option D: "signalling changes in market conditions to producers and consumers". This is exactly the signalling function of the price mechanism. When demand or supply changes, the market price adjusts to reflect the new conditions, providing information to both sides of the market. This allows them to make informed decisions. Therefore D is correct.
Thus, the correct answer is D.
Key Takeaways
- The price mechanism performs three essential functions: signalling, rationing, and incentivising.
- Signalling refers to information conveyed by price changes; rationing allocates goods to those who value them most; incentivising motivates responses from producers and consumers.
- Understanding the direction of price movements in response to shortages and surpluses is fundamental: shortages lead to rising prices, surpluses lead to falling prices.
- The price mechanism is a market-based system; government intervention is a separate concept.
Common Mistakes
- Confusing the price direction: many students think that a shortage causes prices to fall, but the opposite is true. Similarly, a surplus causes prices to fall, not rise.
- Thinking that the price mechanism is about government action: the price mechanism is a feature of markets, not government policy.
- Overlooking the signalling function: some students may focus only on the incentive or rationing function and miss that signalling is a distinct and major function.
Things to Be Careful About
- Read the options carefully: option B and C both contain a correct concept (removing shortages/surpluses) but with the wrong direction of price change.
- Distinguish between the functions: signalling is about information, rationing is about allocation, incentivising is about motivation. The question specifically asks for a "major function" – all three are major, but only D correctly describes one.
- Avoid overcomplicating: the answer is straightforward once you recall the functions and check the direction of price changes.
In the diagram, D and S represent the initial demand and supply conditions for a good.
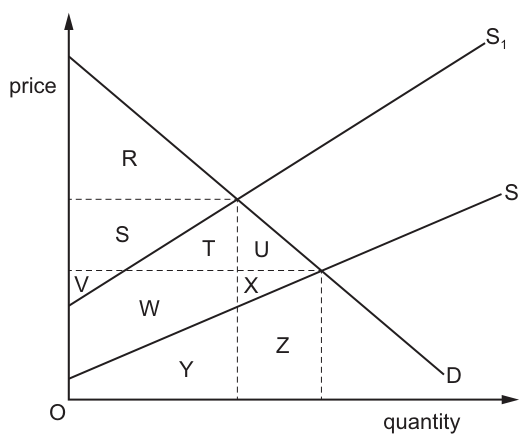
Which row correctly represents the change in consumer surplus and producer surplus if supply shifts to S1?
Options
| consumer surplus | producer surplus | |
|---|---|---|
| A | increases by U | increases by S + T + U |
| B | falls by S + T | falls by W + X |
| C | falls from S + T + U | falls by Y + Z |
| D | falls to R | falls to S + V |
Reasoning
A leftward shift of supply from S to S1 reduces supply, raising the equilibrium price from P1 to P2 and lowering the equilibrium quantity from Q1 to Q2.
Consumer surplus is the area under the demand curve and above the market price, up to the quantity purchased. Before the shift, with price P1 and quantity Q1, consumer surplus is the area R + S + T. After the shift, with higher price P2 and lower quantity Q2, consumer surplus is only the area R (the triangle above P2, below the demand curve), so it falls to R.
Producer surplus is the area above the supply curve and below the market price, up to the quantity sold. After the shift, with supply curve S1, price P2 and quantity Q2, producer surplus is the area above S1, below P2, up to Q2, which equals area S (the rectangle between P1 and P2, left of Q2) plus area V (the area between S1 and S below P1, left of Q2), so it falls to S + V.
This corresponds to row D.
Answer
D
D
Background Concept
Consumer surplus is the difference between the price a consumer is willing and able to pay for a good (represented by the demand curve) and the actual market price they pay. It measures the net benefit consumers gain from purchasing a good at the market price, and is represented graphically as the area under the demand curve and above the market price, up to the quantity purchased.
Producer surplus is the difference between the price a producer is willing and able to accept for a good (represented by the supply curve) and the actual market price they receive. It measures the net benefit producers gain from selling a good at the market price, and is represented graphically as the area above the supply curve and below the market price, up to the quantity sold.
A shift in the supply curve (e.g., a leftward shift representing a decrease in supply) changes the equilibrium price and quantity, which in turn changes the size of consumer and producer surplus.
Understanding the Question
This multiple-choice question provides a demand and supply diagram (Fig. 10.1) for a good, with initial demand (D) and supply (S) curves, and a new supply curve S1 (shifted leftward, indicating a decrease in supply). The question asks which row correctly describes the change in consumer surplus and producer surplus when supply shifts from S to S1. The options give the new level (or change) in each surplus measure, using the areas labelled on the diagram. The key task is to correctly identify the areas that represent consumer and producer surplus before and after the supply shift, and match this to the correct option.
Approach
To solve this, follow these steps:
- First, identify the direction of the supply shift and its effect on equilibrium: a leftward shift from S to S1 is a decrease in supply, which raises the equilibrium price and lowers the equilibrium quantity.
- Identify the original and new equilibrium points: original equilibrium is where D meets S (price P1, quantity Q1); new equilibrium is where D meets S1 (price P2, quantity Q2, with P2 > P1 and Q2 < Q1).
- Define the areas for original and new consumer surplus: CS is always the area under D, above the market price, up to the quantity sold. Calculate original CS (P1, Q1) and new CS (P2, Q2) using the labelled areas.
- Define the areas for original and new producer surplus: PS is always the area above the supply curve, below the market price, up to the quantity sold. Calculate original PS (S, P1, Q1) and new PS (S1, P2, Q2) using the labelled areas.
- Compare these results to the four options to find the correct match.
Step-by-Step Reasoning
- Effect of the supply shift: The supply curve shifts leftward from S to S1, meaning at every price, producers are willing to supply less output (or at every quantity, they require a higher price). This is a decrease in supply. Using the demand and supply model, a leftward supply shift raises the equilibrium price (from P1 to P2) and lowers the equilibrium quantity (from Q1 to Q2), as the new intersection of D and S1 is at a higher price and lower quantity than the original D-S intersection.
- Calculating consumer surplus (CS):
- CS is the net benefit to consumers: the difference between what they are willing to pay (given by the demand curve) and what they actually pay (the market price), summed over all units purchased. Graphically, this is the area under the demand curve, above the market price, up to the quantity purchased.
- Original CS (before the shift, price P1, quantity Q1): The market price is P1, quantity is Q1. The area under D, above P1, up to Q1 is the sum of areas R (the triangle above P2, left of Q2, below D), S (the rectangle between P1 and P2, left of Q2), and T (the triangle between Q2 and Q1, above P1, below D). So original CS = R + S + T.
- New CS (after the shift, price P2, quantity Q2): The market price is now higher at P2, and quantity purchased is lower at Q2. The area under D, above P2, up to Q2 is only the triangle R (since D intersects P2 at Q2, there is no area under D above P2 to the right of Q2). So new CS = R.
- This means consumer surplus falls to R (it decreases by S + T, but the option states the new level, which is R).
- Calculating producer surplus (PS):
- PS is the net benefit to producers: the difference between the price they receive (the market price) and the minimum price they are willing to accept (given by the supply curve), summed over all units sold. Graphically, this is the area above the supply curve, below the market price, up to the quantity sold.
- New PS (after the shift, supply curve S1, price P2, quantity Q2): The area above S1, below P2, up to Q2 can be split into two parts: (i) the rectangle S, which is the area between P1 and P2, left of Q2 (the extra revenue per unit from the higher price, for the units still sold), and (ii) the area V, which is the area between the new supply curve S1 and the original supply curve S, below P1, left of Q2 (the surplus on the units still sold, from the original supply curve up to the new one). Adding these gives new PS = S + V.
- This means producer surplus falls to S + V.
- Matching to the options: Option D states that consumer surplus falls to R and producer surplus falls to S + V, which matches our calculations exactly. All other options are incorrect: A claims both surpluses increase (impossible when supply decreases and price rises), B claims CS falls by S+T (which is the size of the fall, but the PS fall is not W+X), and C claims CS falls from S+T+U (which is not the original CS level) and PS falls by Y+Z (incorrect).
Key Takeaways
- A leftward (decrease) in supply raises equilibrium price and lowers equilibrium quantity.
- Consumer surplus always falls when supply decreases, as consumers pay a higher price and buy less output.
- The change in producer surplus from a supply shift is ambiguous in direction (it can rise or fall) depending on the size of the shift and elasticities, but in this case it falls because the quantity effect dominates.
- When calculating surplus changes from a diagram, always anchor the area to the correct boundaries: under D/above price for CS, above supply/below price for PS, and only up to the quantity transacted.
Common Mistakes
- Confusing a shift in supply with a movement along the supply curve: a shift is caused by a non-price determinant of supply (e.g., input costs, technology), while a movement along is caused by a change in the good's own price.
- Misidentifying the boundaries of consumer and producer surplus: for example, including areas to the right of the new quantity in CS (which are not purchased, so not part of surplus) or including areas below the supply curve in PS (which are part of the producer's cost, not surplus).
- Misreading the direction of the supply shift: a shift to S1 is a leftward/decrease in supply here, not a rightward/increase, which would lower price and raise quantity.
- Mixing up the new level of surplus with the change in surplus: option D states the new level ("falls to R") not the amount of the fall, which is a common point of confusion.
Things to Be Careful About
- Always confirm the direction of the curve shift: S1 is above S, so it is a leftward (decrease) in supply, leading to higher prices.
- When identifying surplus areas, ensure you only include units that are actually purchased (up to the equilibrium quantity) — areas beyond the equilibrium quantity are not part of either surplus, as those units are not traded.
- Check whether the option refers to the change in surplus or the new level of surplus: this question asks for the change, but the options use "falls to" (new level) or "falls by" (change), so read the wording carefully.
- Ensure axis and curve labels are correct: price is on the vertical axis, quantity on the horizontal, D is downward sloping, S and S1 are upward sloping.
What is a characteristic of a public good?
Options
A Households cannot accurately value the benefits of a good.
B Households cannot be excluded from consuming the good.
C The amount of the good available diminishes as households consume it.
D Households are rivals in the consumption of the good.
Reason
Public goods are defined by two key characteristics: non-rivalry (consumption by one does not reduce availability for others) and non-excludability (it is impossible or very costly to exclude anyone from consuming the good). The question asks for a characteristic. Option B correctly states the non-excludability feature: households cannot be excluded from consuming the good. This is a fundamental characteristic of a public good.
Answer
B
B
Background Concept
A public good is a good that is both non-rival and non-excludable. Non-rivalry means that one person's consumption does not reduce the amount available for others. Non-excludability means that once the good is provided, it is impossible or very costly to prevent anyone from consuming it. Because of these features, public goods suffer from the free-rider problem: individuals can enjoy the benefits without paying, so private firms have little incentive to provide them. This leads to market failure and often requires government provision. Examples include national defence, street lighting, and lighthouses.
Understanding the Question
This question asks for a characteristic of a public good. It is a straightforward multiple-choice question that tests your knowledge of the defining features of public goods. The four options present different statements: one is correct, the others are either incorrect or describe private goods or merit goods.
Approach
Recall the two key characteristics of a public good: non-rivalry and non-excludability. Then evaluate each option against these characteristics. The correct answer will be the one that matches one of these defining features.
Step-by-Step Reasoning
- Option A: "Households cannot accurately value the benefits of a good." This is not a characteristic of public goods. It may relate to merit goods (where consumers have imperfect information) or to the difficulty of valuing public goods, but it is not a defining feature. So incorrect.
- Option B: "Households cannot be excluded from consuming the good." This directly states non-excludability, which is a key characteristic of a public good. Correct.
- Option C: "The amount of the good available diminishes as households consume it." This describes a rival good (private good). For a public good, the amount does not diminish (non-rivalry). So this is the opposite of a public good characteristic.
- Option D: "Households are rivals in the consumption of the good." This also describes a rival good. Public goods are non-rival, so this is incorrect.
Therefore, the correct answer is B.
Key Takeaways
- Public goods are non-rival and non-excludable.
- Private goods are rival and excludable.
- The free-rider problem arises because of non-excludability.
- Understanding these characteristics is essential for analysing market failure and government intervention.
Common Mistakes
- Confusing non-rivalry with non-excludability. Both are needed for a pure public good, but the question only asks for ONE characteristic. Option B is one of them.
- Thinking that non-excludability means the good is free. Actually, it means it is impossible to prevent people from consuming it, so they may not pay.
- Selecting Option C or D because they sound like 'public' in the sense of 'shared' but they actually describe rival goods.
Things to Be Careful About
- Read each option carefully. The question asks for a characteristic, not necessarily the only characteristic. Option B is correct because it accurately states non-excludability.
- Do not overthink: the defining characteristics are well-established.
- Remember that public goods are not provided by the market due to the free-rider problem, but that is a consequence, not a characteristic itself.
A government imposes a specific indirect tax on a product that has an inelastic demand curve.
What is the incidence of tax in this case?
Options
A The tax falls entirely on the consumer.
B The tax falls entirely on the producer.
C The tax falls to a greater extent on the consumer than on the producer.
D The tax falls to a smaller extent on the consumer than on the producer.
The incidence of a specific indirect tax is determined by the relative price elasticities of demand and supply. When demand is inelastic, consumers are less responsive to price changes, so they bear a larger proportion of the tax burden than producers. The tax does not fall entirely on either party; rather, the consumer bears a greater share.
Answer
C
C
Background Concept
Tax incidence refers to the division of the burden of a tax between buyers and consumers (or between consumers and producers). For a specific indirect tax (a fixed amount per unit), the supply curve shifts vertically upward by the amount of the tax. The new equilibrium price paid by consumers rises, and the price received by producers falls. The extent to which each side bears the tax depends on the price elasticities of demand and supply. The more inelastic side bears a larger share of the tax because it is less able to adjust its quantity in response to the price change.
Understanding the Question
The question states that a government imposes a specific indirect tax on a product, and that the product has an inelastic demand curve. It asks: what is the incidence of the tax? The options range from the tax falling entirely on the consumer, entirely on the producer, to a greater extent on the consumer, or to a smaller extent on the consumer. The key is that when demand is inelastic, consumers bear more of the tax than producers, but not necessarily all of it.
Approach
To answer this, recall the general rule of tax incidence: the side of the market with the more inelastic curve bears a larger share of the tax. Here, demand is given as inelastic; supply elasticity is not specified, but regardless, the inelastic side (consumers) will bear more. The correct answer is therefore that the tax falls to a greater extent on the consumer than on the producer.
Step-by-Step Reasoning
- A specific indirect tax increases the cost of production by a fixed amount per unit. This shifts the supply curve upward by the amount of the tax.
- The new equilibrium quantity falls, and the price paid by consumers rises. The price received by producers falls.
- The difference between the price paid by consumers (Pc) and the price received by producers (Pp) is exactly the tax per unit.
- The distribution of the tax between consumers and producers is determined by the price elasticities of demand and supply.
- If demand is inelastic (|PED| < 1), consumers are relatively unresponsive to price changes. Therefore, the quantity demanded does not fall much when the price rises. Consequently, the price paid by consumers rises almost as much as the tax, and the price received by producers falls only slightly. Consumers bear most of the tax.
- If demand were elastic, consumers would bear a smaller share.
- Since the question states that demand is inelastic, consumers bear a larger share than producers. The tax does not fall entirely on consumers because producers still bear some burden (the fall in price they receive). Hence, option C is correct.
Key Takeaways
- Tax incidence depends on the relative elasticities of demand and supply.
- The more inelastic side bears a larger share of the tax.
- For a specific indirect tax, the burden is shared between consumers and producers; it rarely falls entirely on one side unless the other side is perfectly elastic.
Common Mistakes
- Choosing option A (tax falls entirely on the consumer) – this would only happen if demand were perfectly inelastic (vertical) or supply were perfectly elastic. The question says demand is inelastic, not perfectly inelastic, so the consumer does not bear the entire tax.
- Confusing a specific indirect tax with an ad valorem tax (percentage of price) – the reasoning is similar, but the shift is parallel for a specific tax.
- Forgetting that both sides share the burden unless one side has extreme elasticity.
Things to Be Careful About
- The term "inelastic demand" means |PED| < 1, not zero. So the consumer bears more, but not all.
- The question does not specify supply elasticity, but the conclusion that consumers bear more than producers is still valid because the inelastic side gains the larger share regardless of the other side's elasticity (unless supply is perfectly elastic, but that is not given).
- In multiple-choice questions, read each option carefully. The phrasing "to a greater extent" is key; it does not say "entirely".
- Always distinguish between the price paid by consumers and the price received by producers; the tax is the difference.
What is an example of direct public provision of goods and services?
Options
A a charity hospital funded by public donations that offers free treatment to the rural poor
B a mobile government library that travels to rural villages offering access to books
C a private-sector pharmacy that provides treatment directly to the public
D a private school that offers free places to children of low income families
Reasoning
Direct public provision means the government itself produces and supplies the good or service, using its own resources and employees. Option B – a mobile government library – is an example of the government directly providing a service. Options A, C, and D involve non-government entities (charity, private firm, private school) even if they offer free or subsidised access; they are not direct public provision.
Answer
B
B
Background Concept
Direct public provision is a method of government intervention in which the state itself produces and supplies goods or services, rather than relying on private firms, charities, or subsidies. It is commonly used for merit goods (e.g., education, healthcare) and public goods (e.g., national defence, street lighting), where the private market may under-provide due to non-excludability or positive externalities. The government finances the provision through taxation and employs its own workforce to deliver the service.
Understanding the Question
This question asks you to identify which option is an example of direct public provision. The key is to look for a case where the government is the direct producer and provider, not just a funder, regulator, or partner. The options include a charity hospital, a government library, a private pharmacy, and a private school offering free places. Only the government library is directly provided by the state.
Approach
For each option, ask: Is the government the entity that produces and supplies the service? If the service is provided by a non-government body (charity, private firm), even if it is free or subsidised, it is not direct public provision. The correct answer is the one where the government itself operates the service.
Step-by-Step Reasoning
- Option A: A charity hospital funded by public donations. The provider is a charity, not the government. The government is not involved in production or supply. This is not direct public provision.
- Option B: A mobile government library. The government runs the library, employs the staff, and supplies the service. This is a clear example of direct public provision.
- Option C: A private-sector pharmacy. This is a private business, not government provision. The government may regulate or subsidise, but does not directly provide the service.
- Option D: A private school offering free places to low-income families. The school is private; the government may fund the places (e.g., through vouchers or grants), but the school itself is not a government entity. This is not direct public provision.
Therefore, only option B satisfies the condition.
Key Takeaways
- Direct public provision means the government produces and supplies the good/service using its own resources.
- It is distinct from government funding (subsidies, grants, vouchers) or regulation.
- Common examples include public libraries, state schools, public hospitals, and national defence.
Common Mistakes
- Confusing government funding with direct provision. For example, a private school that receives government money to offer free places is still not direct provision; the government is not the provider.
- Assuming that any free service is government-provided. Charity hospitals are free but not government-run.
Things to Be Careful About
- Read the description carefully: 'direct public provision' emphasises the government's role as the producer, not just the funder.
- Distinguish between the public sector (government) and the voluntary sector (charities) or private sector.
When is a minimum wage most likely to help reduce the problem of income inequality?
Options
A Higher paid workers maintain pay differentials.
B Labour mobility is low.
C The informal economy is small.
D The minimum wage leads to increased unemployment.
Answer
A minimum wage is most likely to help reduce income inequality when the informal economy is small (Option C). If the informal economy is large, many workers are not covered by the minimum wage, so it has little impact on the lowest paid. A small informal economy means most low-paid workers are covered, so the policy can effectively raise the incomes of the lowest earners relative to higher earners, reducing inequality. The other options would not help: Option A (maintaining pay differentials) would prevent narrowing of gaps; Option B (low labour mobility) might reduce employment but does not help inequality; Option D (increased unemployment) would harm the low-paid and worsen inequality.
C
Background Concept
A minimum wage is a government-imposed price floor in the labour market, set above the equilibrium wage rate. It aims to raise the incomes of low-paid workers, thereby reducing income inequality. However, its effectiveness depends on several factors, including the extent of coverage. The informal economy (also called the shadow or black market) consists of economic activities that are not regulated by the government and where workers are often not covered by labour laws, including minimum wage legislation. If the informal economy is large, many low-paid workers are excluded from the policy, limiting its impact on overall inequality.
Understanding the Question
This multiple-choice question asks: "When is a minimum wage most likely to help reduce the problem of income inequality?" It provides four possible conditions. The task is to identify which condition makes the minimum wage policy more effective in narrowing the gap between low and high incomes. The command word "help reduce" implies we need to choose the scenario that enhances the redistributive effect.
Approach
We evaluate each option in turn:
- Option A: Maintaining pay differentials – this would prevent the wage gap from narrowing, so it does not help inequality.
- Option B: Low labour mobility – this might reduce employment opportunities but does not directly affect inequality; it could even worsen it.
- Option C: Small informal economy – this means most low-paid workers are covered, so the policy can effectively raise their incomes.
- Option D: Increased unemployment – this would harm the low-paid, likely increasing inequality.
The correct answer is C.
Step-by-Step Reasoning
-
Option A: "Higher paid workers maintain pay differentials." If higher-paid workers maintain their wage premium, the gap between low and high earners does not narrow. The minimum wage raises the floor, but if the ceiling is also raised proportionally, inequality may not decrease. Thus, this condition does not help reduce inequality.
-
Option B: "Labour mobility is low." Low labour mobility means workers find it difficult to move between jobs or regions. This could lead to higher unemployment if the minimum wage prices workers out of jobs, but it does not directly help reduce inequality. In fact, it might worsen inequality by trapping workers in low-wage jobs or increasing unemployment among the low-skilled.
-
Option C: "The informal economy is small." The informal economy includes jobs not covered by minimum wage laws. If the informal economy is small, most low-paid workers are in the formal sector and thus benefit from the minimum wage. Their incomes rise, narrowing the gap with higher earners. This is the condition that most directly enhances the redistributive effect.
-
Option D: "The minimum wage leads to increased unemployment." This is a negative consequence. If the minimum wage causes unemployment among low-skilled workers, their incomes fall (or they lose income entirely), which likely increases inequality, not reduces it. Therefore, this condition does not help.
Thus, the only option that makes the minimum wage more likely to reduce inequality is a small informal economy.
Key Takeaways
- The effectiveness of a minimum wage in reducing inequality depends crucially on its coverage. A large informal economy undermines the policy.
- Other factors, such as pay differentials, labour mobility, and unemployment effects, can offset the redistributive benefits.
- When evaluating policies, it is important to consider real-world conditions that affect their outcomes.
Common Mistakes
- Assuming that a minimum wage always reduces inequality without considering coverage or unintended consequences.
- Confusing the informal economy with low labour mobility; they are distinct concepts.
- Thinking that maintaining pay differentials helps reduce inequality; in fact, it prevents narrowing of gaps.
- Ignoring that increased unemployment can worsen inequality, even if the minimum wage is intended to help the poor.
Things to Be Careful About
- The question asks for the condition that makes the policy "most likely" to help, not a guarantee.
- Distinguish between nominal and real income: a minimum wage might raise nominal income but if inflation is high, real income may not rise.
- The informal economy is not the same as the underground economy; it refers to unregulated labour markets.
- Consider the possibility that even with a small informal economy, a very high minimum wage could cause unemployment; but the question is about the condition that helps, not the wage level.
What is not true about subsidies?
Options
A They are paid to firms.
B They have to be paid back.
C They reduce the cost of production.
D They shift the supply curve to the right.
Answer
A subsidy is a payment from the government to firms, which reduces the cost of production and shifts the supply curve to the right. Subsidies are grants, not loans, and do not have to be repaid. Therefore, option B is not true.
Answer: B
B
Background Concept
A subsidy is a payment from the government to producers (or sometimes consumers) to encourage production or consumption of a good. It reduces the cost of production, so firms are willing to supply more at each price, shifting the supply curve to the right. Subsidies are a form of government intervention, often used for merit goods, to support industries, or to achieve social objectives. Unlike loans, subsidies do not need to be repaid; they are grants.
Understanding the Question
The question asks which statement is not true about subsidies. It is a multiple-choice question testing basic knowledge of the characteristics of subsidies. The four options cover typical features: they are paid to firms, they reduce costs, they shift supply, and they have to be paid back. The false statement is that they have to be paid back; subsidies are not loans.
Approach
We need to recall the definition and economic effects of a subsidy. Evaluate each option: A is true, C is true, D is true, B is false. The correct answer is B.
Step-by-Step Reasoning
- Option A: "They are paid to firms." True. Subsidies are typically paid to producers to lower their costs. (Sometimes subsidies can be paid to consumers, but the standard economic model for a subsidy to production is a payment to firms.)
- Option B: "They have to be paid back." False. A subsidy is a grant, not a loan. The government does not expect repayment. This distinguishes subsidies from loans or other forms of financial assistance that require repayment.
- Option C: "They reduce the cost of production." True. By providing money per unit or lump sum, subsidies lower the per-unit cost of production, allowing firms to produce more profitably.
- Option D: "They shift the supply curve to the right." True. Because the cost of production falls, producers are willing to supply more at each price, so the supply curve shifts right. This is the standard supply-side effect of a subsidy.
Thus, the only false statement is B.
Key Takeaways
- Subsidies are a form of government intervention that reduces production costs and increases supply.
- They are not repayable; they are grants.
- Understanding the difference between subsidies and loans is important in economic policy.
- The effect on supply curve is a rightward shift.
Common Mistakes
- Confusing subsidies with loans: some students may think subsidies are like financial aid that must be repaid, but they are not.
- Thinking subsidies are paid to consumers: while consumer subsidies exist, the typical microeconomic model focuses on producer subsidies.
- Misunderstanding the direction of supply shift: subsidies shift supply right, not left.
Things to Be Careful About
- The question says "What is not true?" so we must identify the false statement.
- Some subsidies may be conditional, but they are still not required to be paid back.
- The supply curve shift to the right is due to lower costs, not an increase in demand.
The diagram shows three groups of people with four possible flows between them.
Which flow indicates that people have become discouraged from seeking work?
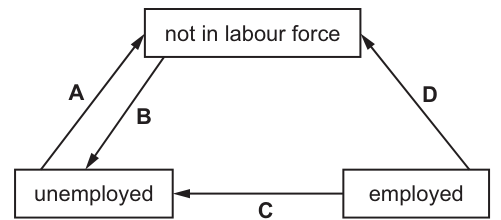
Options
A flow A on Fig. 16.1
B flow B on Fig. 16.1
C flow C on Fig. 16.1
D flow D on Fig. 16.1
Working
Discouraged workers are unemployed people who stop seeking work because they believe no jobs are available. When they stop looking, they are no longer counted as unemployed and move from the 'unemployed' category to 'not in the labour force'. In Fig. 16.1, flow A shows the movement from unemployed to not in labour force.
Answer
A
A
Background Concept
The labour force of an economy consists of people who are either employed or unemployed. The 'not in labour force' category includes everyone of working age who is neither employed nor unemployed. To be counted as unemployed, a person must be without work, actively seeking work, and available to start work. Discouraged workers are people who are unemployed but have stopped looking for work because they believe no jobs are available for them. Although they remain without work, they are reclassified from 'unemployed' to 'not in labour force'. This is important because the official unemployment rate only counts those actively seeking work, so discouraged workers are not reflected in the unemployment statistics, causing the measured rate to understate true unemployment.
Understanding the Question
The question presents a flow diagram showing movements between three labour market states: 'not in labour force', 'unemployed', and 'employed'. It asks which flow indicates that people have become discouraged from seeking work. This requires understanding what happens to discouraged workers in terms of labour force classification: they move from being unemployed (actively seeking) to not being in the labour force (no longer seeking). The command word is implicit identification, requiring application of the definition of discouraged workers to the diagram.
Approach
First, define discouraged workers precisely: individuals who were unemployed (actively seeking work) but have ceased their job search due to belief that no work is available. Then, identify the direction of this transition in the diagram. Flow A moves from 'unemployed' to 'not in labour force', which matches this definition. Verify by eliminating other flows: Flow B represents people entering unemployment from inactivity (new or returning job seekers); Flow C represents job losers moving from employment to unemployment; Flow D represents people leaving employment for inactivity (retirement, education, etc.), not discouraged workers.
Step-by-Step Reasoning
- Labour force classification: The working-age population is divided into three groups. The 'employed' have jobs. The 'unemployed' have no job but are actively seeking work and are available to start. The 'not in labour force' have no job and are not seeking work.
- Definition of discouraged workers: These are people who are without work and want to work, but have stopped actively seeking employment because they believe no jobs are available for them. Because they are no longer actively seeking, they are classified as 'not in labour force' rather than unemployed.
- Analyse Flow A: This arrow points from 'unemployed' to 'not in labour force'. This represents people who were previously counted as unemployed but have stopped looking for work. This is exactly the definition of discouraged workers.
- Analyse Flow B: This arrow points from 'not in labour force' to 'unemployed'. This represents people who were not seeking work but have started looking (e.g., new entrants to the labour market, or people returning after a period of inactivity). This is the opposite of becoming discouraged.
- Analyse Flow C: This arrow points from 'employed' to 'unemployed'. This represents people who lose their jobs and begin looking for new ones (or are laid off). These people are actively seeking work, so they are not discouraged.
- Analyse Flow D: This arrow points from 'employed' to 'not in labour force'. This represents people who leave employment and do not seek work (e.g., retirees, full-time students, or people taking voluntary career breaks). These people were employed, not unemployed, so they cannot be discouraged workers.
- Conclusion: Only Flow A represents the transition from unemployment to inactivity due to discouragement about job prospects.
Key Takeaways
- Discouraged workers are a hidden form of unemployment because they are not counted in the official unemployment statistics.
- When many people become discouraged, the official unemployment rate falls even if the number of people without work has not changed, which can mask labour market weakness.
- The labour force participation rate (the percentage of the working-age population in the labour force) falls when discouraged workers exit the labour force.
- Understanding the distinction between 'unemployed' and 'not in labour force' is essential for interpreting labour market data accurately.
Common Mistakes
- Selecting Flow D: Some students confuse discouraged workers with people who retire or leave work voluntarily. Discouraged workers must come from the unemployed pool, not the employed pool. Flow D starts from 'employed', so it cannot represent discouraged workers.
- Selecting Flow C: Students may think that losing a job makes someone discouraged. However, Flow C represents people who become unemployed, which means they are actively seeking work. Discouraged workers stop seeking, so they do not enter unemployment; they leave it.
- Selecting Flow B: This is the reverse of the correct flow. Students may confuse 'becoming discouraged' with 'starting to look for work'.
- Ignoring directionality: The arrows show the direction of movement. It is essential to note that Flow A specifically moves from 'unemployed' to 'not in labour force', not the other way around.
Things to Be Careful About
- Arrow direction: Always check which box the arrow starts from and which it points to. Flow A starts at 'unemployed' and ends at 'not in labour force'.
- Definition precision: Discouraged workers are specifically unemployed people who stop looking. They are not employed people who retire, nor are they people who start looking for work.
- Statistical implication: Remember that discouraged workers are excluded from the unemployment count, which means the official unemployment rate may understate the true level of joblessness during economic downturns.
What is required to prevent a rising price level due to an increase in aggregate demand?
Options
A Additional productive capacity must be created.
B Government investment must remain at a constant level to stabilise supply.
C Greater reliance must be placed on imported goods to overcome any domestic shortfalls.
D Wage rates must change more frequently to maintain levels of employment and output.
Answer
A rightward shift of the AD curve raises the price level unless the LRAS curve also shifts rightwards, increasing the economy's productive capacity. Option A correctly identifies that additional productive capacity must be created to accommodate the higher AD without inflation.
A
Background Concept
The AD/AS model is the core framework for analysing macroeconomic equilibrium. The Aggregate Demand (AD) curve shows the total planned spending in the economy at each price level. The Aggregate Supply (AS) curve shows the total output firms are willing to produce at each price level. In the short run, the SRAS curve is upward-sloping, so a rightward shift of AD raises both real output and the price level. In the long run, the LRAS curve is vertical at the economy's full-employment level of output (Yf), determined by the quantity and productivity of factors of production. A rightward shift of AD in the long run, with a fixed LRAS, only raises the price level — output cannot increase beyond Yf. For output to rise without inflation, the LRAS must also shift rightwards, meaning the economy's productive capacity must increase.
Understanding the Question
The question asks what is required to prevent a rising price level when AD increases. This is a direct test of the AD/AS model. The key insight is that an increase in AD, by itself, will always put upward pressure on the price level (demand-pull inflation). To prevent this, the economy's ability to supply goods and services must increase at the same time. The correct answer is the one that identifies the need for an increase in productive capacity.
Approach
- Identify the initial shock: an increase in AD (a rightward shift of the AD curve).
- Trace the effect in the AD/AS model: with a given SRAS/LRAS, the new equilibrium has a higher price level.
- Identify the condition for the price level to remain unchanged: the AS curve must also shift rightwards by an equivalent amount.
- Evaluate each option against this condition.
Step-by-Step Reasoning
- The initial shock: An increase in AD could be caused by any of its components (C, I, G, X-M). The question does not specify the cause, only that AD rises.
- The effect without a supply response: In the AD/AS diagram, the AD curve shifts right. The new equilibrium is at a higher price level and a higher level of real output (in the short run). In the long run, if the economy is at full capacity, the price level rises further and output returns to Yf.
- The condition for price stability: For the price level to remain unchanged, the increase in demand must be matched by an equal increase in supply. This means the LRAS curve must shift rightwards, representing an increase in the economy's productive capacity.
- Evaluating the options:
- A: Additional productive capacity must be created. This is correct. An increase in LRAS (productive capacity) allows the economy to produce more output at the same price level, absorbing the increased AD without inflation.
- B: Government investment must remain at a constant level to stabilise supply. This is incorrect. Constant government investment does not increase supply. To prevent inflation, supply must increase, not just remain stable.
- C: Greater reliance must be placed on imported goods to overcome any domestic shortfalls. This is incorrect. While imports can temporarily relieve domestic supply constraints, they do not increase the domestic economy's productive capacity. They also worsen the current account balance. The question asks what is required to prevent a rising price level, implying a sustainable, long-run solution.
- D: Wage rates must change more frequently to maintain levels of employment and output. This is incorrect. More frequent wage changes do not increase productive capacity. In fact, if wages rise in response to the increased demand, this could fuel cost-push inflation, making the price level problem worse.
Key Takeaways
- An increase in AD alone causes demand-pull inflation (a rising price level).
- To achieve non-inflationary economic growth, the increase in AD must be matched by an increase in LRAS (productive capacity).
- Supply-side policies (e.g., investment, training, technology) are the tools to shift LRAS rightwards.
- The AD/AS model is the essential tool for analysing the impact of demand and supply shocks on the price level and real output.
Common Mistakes
- Confusing short-run and long-run effects: A student might think that an increase in AD only raises output, forgetting that in the long run, with a fixed LRAS, it only raises prices.
- Focusing on the wrong variable: A student might choose option B (constant government investment) because they think stability is the goal, but the question asks for what is required to prevent a rising price level, which requires an increase in supply.
- Misunderstanding the role of imports: A student might think imports solve the problem, but they are a leakage from the circular flow and do not increase the domestic economy's capacity to produce.
Things to Be Careful About
- Read the question carefully: it asks what is required to prevent a rising price level. This implies a necessary condition, not just a possible outcome.
- Distinguish between a movement along the AS curve and a shift of the AS curve. An increase in AD causes a movement along the AS curve; an increase in productive capacity causes a shift of the LRAS curve.
- Remember that the LRAS curve is vertical at the full-employment level of output. Any increase in AD beyond this point is purely inflationary in the long run unless LRAS also shifts.
An open economy with a government is in equilibrium at a national income of $900 million.
Households spend $700 million and save $50 million.
Firms spend $100 million on investment.
The government spends $150 million and has a balanced budget.
How much is spent on exports and imports?
Options
| export spending ($ million) | import spending ($ million) | |
|---|---|---|
| A | 100 | 100 |
| B | 100 | 50 |
| C | 50 | 100 |
| D | 50 | 50 |
Working
National income identity: Y = C + I + G + (X - M)
Given Y = 900, C = 700, I = 100, G = 150.
900 = 700 + 100 + 150 + (X - M)
900 = 950 + (X - M)
X - M = -50
Injections = Leakages: I + G + X = S + T + M
S = 50, T = G = 150 (balanced budget)
100 + 150 + X = 50 + 150 + M
250 + X = 200 + M
X - M = -50
Only option C gives X - M = -50 (X = 50, M = 100).
Answer
C
C
Background Concept
The circular flow of income model shows the flows of spending, income, and output in an economy. In an open economy with a government, the key identity is that national income (Y) equals total spending on domestically produced goods and services: Y = C + I + G + (X - M), where C is consumption, I is investment, G is government spending, X is exports, and M is imports. An alternative approach is the injections-leakages approach: in equilibrium, total injections (I + G + X) must equal total leakages (S + T + M), where S is saving and T is taxation. Both approaches are equivalent and can be used to find missing values.
Understanding the Question
The question provides data for an open economy with a government in equilibrium at a national income of $900 million. We are given consumption ($700m), saving ($50m), investment ($100m), government spending ($150m), and that the government has a balanced budget (so tax revenue equals government spending, $150m). We need to find the values of export spending and import spending. The answer must be one of the four pairs in the options.
Approach
We can use either the national income identity or the injections-leakages approach. Both will give the same relationship between exports and imports. Since we have two unknowns (X and M) but only one equation from each approach, we need to use the fact that the correct pair must satisfy the equation. We can derive X - M = -50 from either method, then check which option gives that difference.
Step-by-Step Reasoning
- Write the national income identity: Y = C + I + G + (X - M).
- Substitute the given values: 900 = 700 + 100 + 150 + (X - M).
- Simplify the right-hand side: 700 + 100 + 150 = 950, so 900 = 950 + (X - M).
- Rearrange: X - M = 900 - 950 = -50. This means net exports are -50, i.e., imports exceed exports by $50 million.
- Alternatively, use injections-leakages: I + G + X = S + T + M.
- Substitute: 100 + 150 + X = 50 + 150 + M.
- Simplify: 250 + X = 200 + M, so X - M = 200 - 250 = -50. Same result.
- Now check each option:
- Option A: X=100, M=100 => X-M=0 (not -50).
- Option B: X=100, M=50 => X-M=50 (not -50).
- Option C: X=50, M=100 => X-M=-50 (matches).
- Option D: X=50, M=50 => X-M=0 (not -50).
- Therefore, the correct answer is C.
Key Takeaways
- The national income identity and the injections-leakages approach are two sides of the same equilibrium condition.
- In an open economy with government, the equilibrium condition can be used to find missing components.
- The balanced budget condition (T = G) simplifies the injections-leakages equation.
- When given multiple unknowns, the options can be tested against the derived relationship.
Common Mistakes
- Forgetting that the government has a balanced budget, so T = G = 150. Some might assume T is zero or different.
- Using the identity incorrectly: Y = C + I + G + X - M, not Y = C + I + G + X + M.
- Confusing injections and leakages: I, G, X are injections; S, T, M are leakages.
- Not checking all options; some might stop after finding X - M = -50 and guess without verifying.
Things to Be Careful About
- Ensure you correctly identify which variables are given: consumption is $700m, saving is $50m (not part of the identity directly but used in leakages).
- The balanced budget means tax revenue equals government spending, so T = G = 150.
- The units are consistent ($ million), so no conversion needed.
- The question asks for both export and import spending; the answer is a pair, not just the difference.
Which increase makes cost-push inflation less likely to happen?
Options
A indirect tax rates
B raw material shortages
C the foreign exchange rate
D trade union power
Reasoning
Cost-push inflation arises from an increase in the costs of production, such as wages, raw materials, or taxes. An increase in the foreign exchange rate (appreciation) makes imports cheaper, reducing the cost of imported inputs. This lowers production costs and makes cost-push inflation less likely. Therefore, the correct answer is C.
Answer
C
C
Background Concept
Cost-push inflation occurs when the overall price level rises due to increases in the costs of production. These costs include wages, raw materials, energy, and taxes. When firms face higher costs, they pass them on to consumers in the form of higher prices, leading to inflation. An appreciation of the domestic currency (an increase in the exchange rate) makes imports cheaper, reducing the cost of imported inputs and thus lowering production costs. This can help mitigate cost-push pressures.
Understanding the Question
The question asks which of the four options, if increased, would make cost-push inflation less likely. We need to evaluate each option's effect on production costs. Options A, B, and D are known to increase costs, while option C (an increase in the foreign exchange rate) reduces the cost of imported inputs, making cost-push inflation less likely.
Approach
We will examine each option in turn:
- A: Indirect tax rates – an increase raises the cost of production.
- B: Raw material shortages – drive up input prices.
- C: The foreign exchange rate – an increase (appreciation) lowers import costs.
- D: Trade union power – stronger unions can push up wages, raising costs.
Only option C reduces costs, so it is the correct answer.
Step-by-Step Reasoning
-
Define cost-push inflation: It is inflation caused by an increase in the costs of production, shifting the short-run aggregate supply (SRAS) curve leftwards, leading to a higher price level and lower real output.
-
Evaluate each option:
- A: Indirect tax rates – An increase in indirect taxes (e.g., VAT, excise duties) raises the cost of production for firms, as they must pay more tax on inputs or final goods. This is a direct cost increase, making cost-push inflation more likely.
- B: Raw material shortages – Shortages of raw materials (e.g., oil, metals) drive up their prices. Since raw materials are inputs, higher input costs increase production costs, again making cost-push inflation more likely.
- C: The foreign exchange rate – An increase in the exchange rate means the domestic currency appreciates. This makes imports cheaper because each unit of domestic currency buys more foreign currency. Imported raw materials, components, and finished goods become less expensive. For firms that rely on imported inputs, this reduces production costs, thereby making cost-push inflation less likely. This is the only option that reduces costs.
- D: Trade union power – Increased trade union power often leads to higher wage demands. If unions successfully negotiate higher wages, firms face higher labour costs. This increases production costs and makes cost-push inflation more likely.
-
Conclusion: Only an increase in the foreign exchange rate (appreciation) reduces production costs and thus makes cost-push inflation less likely. Therefore, the correct answer is C.
Key Takeaways
- Cost-push inflation is driven by rising production costs.
- Exchange rate appreciation reduces the cost of imported inputs, helping to control cost-push inflation.
- Other factors such as higher taxes, raw material shortages, and stronger trade unions increase production costs and exacerbate cost-push inflation.
- Understanding the direction of causality is crucial: an increase in the exchange rate (appreciation) is disinflationary for cost-push reasons.
Common Mistakes
- Confusing cost-push inflation with demand-pull inflation. Demand-pull inflation is caused by excess aggregate demand, not cost increases.
- Thinking that an appreciation of the currency always causes inflation. In fact, appreciation reduces imported inflation and can lower the price level.
- Misinterpreting 'increase in the foreign exchange rate' as depreciation. An increase means the domestic currency is worth more, i.e., appreciation.
- Assuming that all taxes increase costs equally; indirect taxes directly affect production costs, while direct taxes (e.g., income tax) do not.
Things to Be Careful About
- Always clarify the direction of change: 'increase' in exchange rate = appreciation.
- Distinguish between cost-push and demand-pull inflation clearly.
- Remember that exchange rate changes affect both export and import prices, but for cost-push inflation, the import side is most relevant.
- In multiple-choice questions, eliminate options that clearly increase costs, leaving the one that reduces costs.
When calculating national income by the income method, what would not be included?
Options
A income from abroad
B profits of private sector businesses
C rent from the ownership of land
D transfer payments
Reasoning
The income method of calculating national income sums all factor incomes earned from the production of goods and services within the domestic economy. Factor incomes include wages, rent, interest, and profit. Transfer payments, such as welfare benefits or pensions, are not payments for current productive activity; they are redistributions of existing income and therefore are excluded from national income calculations.
Income from abroad (A) is included in Gross National Income (GNI) but not in Gross Domestic Product (GDP) measured by the income method — however, the question asks about national income, which can refer to GNI, so this is not the best answer. Profits (B) and rent (C) are clearly factor incomes. Transfer payments (D) are never included in any measure of national income by the income method.
Answer
D
D
Background Concept
National income can be measured using three approaches: the output method, the expenditure method, and the income method. The income method sums all factor incomes earned by residents in the production of goods and services. Factor incomes are payments to the owners of factors of production: wages and salaries (labour), rent (land), interest (capital), and profit (enterprise).
Crucially, only incomes that arise from current productive activity are included. Transfer payments — such as state pensions, unemployment benefits, child benefit, or student grants — are not payments for any current contribution to output. They are simply transfers of income from taxpayers to recipients. Including them would lead to double-counting because the income that is transferred has already been counted when it was earned as factor income.
Understanding the Question
This is a multiple-choice question testing knowledge of what is and is not included when national income is calculated using the income method. The question asks specifically for the item that would NOT be included. The four options are:
- A: income from abroad
- B: profits of private sector businesses
- C: rent from the ownership of land
- D: transfer payments
A student needs to know the definition of factor income and the boundary of the income method. The trick is that "income from abroad" is included in Gross National Income (GNI) but not in Gross Domestic Product (GDP) — but the question says "national income", which is a broader term that can encompass GNI. The clearest and most unambiguous answer is transfer payments, which are never included in any measure of national income by the income method.
Approach
- Recall the definition of the income method: sum of factor incomes from current production.
- Identify which of the four options is NOT a factor income.
- Eliminate options that clearly are factor incomes (profits, rent).
- Consider whether "income from abroad" is included — it is included in GNI, so it is not the best answer.
- Confirm that transfer payments are never included.
Step-by-Step Reasoning
- Option B (profits of private sector businesses): Profit is the reward to enterprise, a factor of production. It is a factor income and is included in the income method. Eliminate.
- Option C (rent from the ownership of land): Rent is the reward to land, a factor of production. It is a factor income and is included. Eliminate.
- Option A (income from abroad): This refers to income earned by residents from overseas investments or work abroad. This is included in Gross National Income (GNI) but not in Gross Domestic Product (GDP). Since the question says "national income" rather than "GDP", income from abroad is part of national income (GNI). Therefore it would be included, not excluded. Eliminate.
- Option D (transfer payments): These are payments made by the government to individuals without any corresponding productive activity. Examples include welfare benefits, pensions, and grants. They are not factor incomes and are never included in the income method. This is the correct answer.
Key Takeaways
- The income method of measuring national income includes only factor incomes: wages, rent, interest, and profit.
- Transfer payments are excluded because they do not represent payment for current production.
- Income from abroad is included in GNI but not in GDP — the term "national income" typically refers to GNI.
- Double-counting is avoided by excluding transfer payments.
Common Mistakes
- Confusing GDP and GNI: Some students might think income from abroad is excluded from all measures of national income, but it is included in GNI. The question's use of "national income" rather than "GDP" is a subtle clue.
- Thinking transfer payments are a form of income: While recipients receive money, it is not factor income — it is a redistribution of existing income.
- Overthinking: Some students might wonder about illegal income or the informal sector, but the question is straightforward about standard national accounting conventions.
Things to Be Careful About
- Read the question carefully: it asks what would NOT be included.
- Know the difference between GDP (domestic) and GNI (national) — income from abroad is included in the latter.
- Remember that transfer payments are never included in any measure of national income by the income method.
What is an example of expansionary fiscal policy?
Options
A an increase in income tax
B an increase in private sector investment
C an increase in spending on public goods
D an increase in the money supply
Reasoning
Expansionary fiscal policy involves increasing government spending and/or reducing taxes to stimulate aggregate demand.
- Option C, an increase in spending on public goods, is an example of increased government spending, which is a key component of expansionary fiscal policy.
- Option A (increase in income tax) is contractionary, as it reduces disposable income and consumption.
- Option B (increase in private sector investment) is not a government policy action; it may result from other factors.
- Option D (increase in the money supply) is an example of monetary policy, not fiscal policy.
Answer
C
C
Background Concept
Fiscal policy refers to the use of government spending and taxation to influence the economy. Expansionary fiscal policy aims to increase aggregate demand and is used during periods of recession or low economic growth. It consists of either increasing government spending, reducing taxes, or a combination of both. The goal is to boost consumption and investment, raise output, and reduce unemployment. In contrast, contractionary fiscal policy (reducing spending or raising taxes) is used to cool an overheating economy and control inflation.
Understanding the Question
The question asks for an example of expansionary fiscal policy from a list of four options. It is a straightforward test of knowledge: can the candidate distinguish between fiscal and monetary policy, and between expansionary and contractionary fiscal actions? The correct choice must be a government action that increases aggregate demand.
Approach
To answer correctly, first recall the definition of expansionary fiscal policy: any increase in government spending or decrease in taxes. Then examine each option to see if it fits this description. Eliminate those that are contractionary (tax increases), not a government action (private sector investment), or not fiscal policy at all (money supply).
Step-by-Step Reasoning
-
Option A: an increase in income tax. This is a tax increase, which reduces disposable income and consumption. This decreases aggregate demand, so it is contractionary fiscal policy. Incorrect.
-
Option B: an increase in private sector investment. Private sector investment is spending by firms on capital goods, not by the government. While it may be influenced by government policy, it is not itself an example of fiscal policy. Incorrect.
-
Option C: an increase in spending on public goods. Public goods (such as defence, law and order, street lighting) are provided by the government because they are non‑rival and non‑excludable and would be underprovided by the market. An increase in such spending directly injects money into the economy, raises aggregate demand, and is a classic example of expansionary fiscal policy. Correct.
-
Option D: an increase in the money supply. This is a tool of monetary policy, typically implemented by the central bank (e.g., through open market operations or lowering interest rates). While it may also aim to stimulate the economy, it is not a fiscal policy action. Incorrect.
Therefore, only option C satisfies the definition of expansionary fiscal policy.
Key Takeaways
- Expansionary fiscal policy = increase in government spending or decrease in taxes.
- Contractionary fiscal policy = decrease in government spending or increase in taxes.
- Fiscal policy is conducted by the government (treasury). Monetary policy is conducted by the central bank and affects money supply and interest rates.
- To identify examples, focus on who is acting (government) and what they are doing (spending/taxing).
Common Mistakes
- Confusing fiscal policy with monetary policy: option D (money supply) is a common trap. Remember: fiscal policy = government budget; monetary policy = central bank control of money and credit.
- Mixing up expansionary and contractionary: a tax increase reduces demand, so it is contractionary. Always check the direction of the effect on aggregate demand.
- Mistaking private sector actions for government policy: option B may appear to be an increase in investment, which is part of aggregate demand, but it is not a fiscal policy tool.
Things to Be Careful About
- Expansionary fiscal policy can also include transfer payments (e.g., welfare benefits) which increase spending, but the question specifically used “spending on public goods”. This is a clear example of government current or capital spending.
- Remember that ‘expansionary’ refers to the effect on economic activity, not the size of the government budget. A deficit (spending > revenue) is typically expansionary, but a balanced budget expansionary policy is also possible if spending is increased and taxes are raised by the same amount (balanced budget multiplier). However, that nuance is beyond this simple MCQ.
- Always read the options carefully: sometimes a tax cut is also expansionary, but here it was not listed. The one correct option is the increase in government spending.
An economy has both increasing imported raw material prices and demand-pull inflation.
Which combination of policies is most likely to help its government achieve its macroeconomic objective of price stability?
Options
| budget deficit | exchange rate | rate of interest | |
|---|---|---|---|
| A | decreases | depreciates | decreases |
| B | decreases | appreciates | increases |
| C | increases | depreciates | decreases |
| D | increases | appreciates | increases |
Answer
The economy suffers from both cost-push inflation (rising imported raw material prices) and demand-pull inflation. To achieve price stability, the government needs to reduce aggregate demand (AD) to tackle demand-pull inflation, but must also be careful not to worsen cost-push inflation. An appreciation of the exchange rate reduces the cost of imported raw materials, directly reducing cost-push pressure. A decrease in the budget deficit (contractionary fiscal policy) and an increase in the rate of interest (contractionary monetary policy) both reduce AD, helping to control demand-pull inflation. Therefore, option B (decreases budget deficit, appreciates exchange rate, increases rate of interest) is the most appropriate combination.
B
Background Concept
Inflation is a sustained increase in the general price level. Demand-pull inflation occurs when aggregate demand (AD) rises faster than aggregate supply, pulling up prices. Cost-push inflation occurs when the costs of production (e.g., wages, raw materials) rise, shifting the short-run aggregate supply (SRAS) leftwards, pushing up prices. To achieve price stability, the government can use demand-side policies (fiscal, monetary) to reduce AD, and supply-side policies to shift LRAS. However, cost-push inflation is not directly reduced by reducing AD; in fact, reducing AD in the face of cost-push inflation may cause a recession. Therefore, a policy that directly reduces the cost push (e.g., an appreciation of the exchange rate, lowering import costs) is beneficial. An appreciation makes imports cheaper, reducing the cost of imported raw materials, which shifts SRAS rightwards, lowering the price level.
Understanding the Question
The question presents an economy experiencing both increasing imported raw material prices (cost-push) and demand-pull inflation. The government's objective is price stability. Four policy combinations are given, each specifying changes in the budget deficit, the exchange rate, and the rate of interest. We need to determine which combination is most likely to help achieve price stability. The correct answer must address both types of inflation: reducing demand-pull inflation (by reducing AD) and mitigating cost-push inflation (by reducing import costs). Expansionary policies (increasing budget deficit, depreciating exchange rate, decreasing interest rate) would worsen demand-pull inflation and could exacerbate cost-push (depreciation raises import costs). Therefore, contractionary policies are needed, but with an appreciation to help with cost-push.
Approach
Evaluate each policy change in isolation:
- Budget deficit: A decrease (surplus or smaller deficit) is contractionary fiscal policy, reducing AD, which helps to lower demand-pull inflation. An increase is expansionary and would worsen demand-pull inflation.
- Exchange rate: An appreciation makes imports cheaper, reducing the cost of imported raw materials, thus shifting SRAS right, lowering cost-push inflation. A depreciation raises import costs, worsening cost-push inflation.
- Rate of interest: An increase is contractionary monetary policy, reducing AD (through lower consumption and investment), helping to reduce demand-pull inflation. A decrease is expansionary and would worsen demand-pull inflation.
For the combination to be most effective, it should include contractionary fiscal and monetary policies to reduce demand-pull inflation, and an appreciation to reduce cost-push inflation. Option B is the only one with all three: decrease budget deficit, appreciate exchange rate, increase interest rate.
Step-by-Step Reasoning
- Identify the nature of inflation: both cost-push (from imported raw materials) and demand-pull (from excess AD).
- The government's objective is price stability, i.e., to reduce the inflation rate.
- To reduce demand-pull inflation, the government should reduce AD. This can be achieved by:
- Contractionary fiscal policy: decrease budget deficit (increase taxes or reduce government spending).
- Contractionary monetary policy: increase interest rates, which reduces consumption and investment.
- To reduce cost-push inflation, the government should aim to reduce production costs. An appreciation of the exchange rate reduces the price of imported raw materials, lowering firms' costs and shifting SRAS right, reducing the price level.
- Now evaluate each option:
- Option A: decrease budget deficit (good for demand-pull), depreciate exchange rate (bad for cost-push, increases import costs), decrease interest rate (bad for demand-pull, expansionary). Not appropriate.
- Option B: decrease budget deficit (good), appreciate exchange rate (good), increase interest rate (good). This combination addresses both types of inflation.
- Option C: increase budget deficit (bad, expansionary), depreciate exchange rate (bad), decrease interest rate (bad). All expansionary, would worsen inflation.
- Option D: increase budget deficit (bad), appreciate exchange rate (good), increase interest rate (good). The appreciation and interest rate increase are good, but the expansionary fiscal policy (increasing deficit) would increase AD, potentially offsetting the contractionary effect of higher interest rates and worsening demand-pull inflation. Therefore, not the best combination.
- Thus, option B is the most likely to help achieve price stability.
Key Takeaways
- Cost-push inflation requires policies that reduce production costs, such as an appreciation of the exchange rate (if imports are a significant cost) or supply-side policies.
- Demand-pull inflation requires policies that reduce aggregate demand, such as contractionary fiscal and monetary policy.
- A policy mix that combines both types of measures can be more effective when both types of inflation are present.
- Expansionary policies (increasing budget deficit, depreciating currency, lowering interest rates) are generally counterproductive for reducing inflation.
Common Mistakes
- Thinking that a depreciation of the exchange rate helps reduce inflation (it actually increases import costs and worsens cost-push inflation).
- Believing that increasing the budget deficit is expansionary and helps reduce inflation (it is expansionary and increases demand-pull inflation).
- Assuming that reducing interest rates is contractionary (it is expansionary).
- Overlooking the need to address both types of inflation simultaneously; choosing a combination that only addresses one type.
- Not considering the trade-off: reducing demand-pull inflation through contractionary policy may cause unemployment, but in this context, the government's objective is price stability, so that trade-off is accepted.
Things to Be Careful About
- Distinguish between demand-pull and cost-push inflation; they require different policy responses.
- Understand the direction of policy changes: a decrease in budget deficit is contractionary; an increase in interest rate is contractionary; an appreciation of the exchange rate is contractionary for AD (reduces net exports) but also reduces cost-push inflation.
- In multiple-choice questions, read the options carefully; all three policies must be considered together.
- The question asks for the combination "most likely to help" – it does not require perfect achievement, but the best among the given options.
What is an example of a supply-side policy?
Options
A an import quota to restrict the supply of goods
B a rise in interest rates to encourage the supply of savings
C a specific tax on the supply of goods to raise revenue
D a subsidy to businesses to promote the supply of training courses
Supply-side policy aims to increase the productive capacity of the economy by shifting the LRAS curve to the right. One tool is government spending on training to improve the skills of the labour force, thereby increasing labour productivity. A subsidy to businesses to promote training courses directly encourages such investment in human capital. Option A (import quota) is a protectionist measure, option B (rise in interest rates) is monetary policy, and option C (specific tax) is a fiscal policy. Therefore, the correct answer is D.
Answer
D
D
Background Concept
Supply-side policy refers to government measures designed to increase the productive capacity of the economy, i.e., to shift the long-run aggregate supply (LRAS) curve to the right. This is achieved by improving the quantity or quality of factors of production, such as labour, capital, and technology. Common tools include training and education to enhance human capital, infrastructure investment, and support for research and development. These policies aim to boost potential output, reduce unemployment, and achieve sustainable economic growth without causing inflation.
Understanding the Question
This multiple-choice question asks: "What is an example of a supply-side policy?" The candidate must select the option that best fits the definition of supply-side policy. The four options are:
- A: an import quota to restrict the supply of goods
- B: a rise in interest rates to encourage the supply of savings
- C: a specific tax on the supply of goods to raise revenue
- D: a subsidy to businesses to promote the supply of training courses
The correct answer is D, as it directly targets the improvement of labour productivity through training, a classic supply-side tool.
Approach
First, recall the definition and key objectives of supply-side policy. Then evaluate each option against this definition. Options A, B, and C involve policies that do not aim to increase productive capacity: A is a protectionist trade barrier, B is a monetary policy tool, and C is a fiscal policy (taxation). Only D aligns with the goal of enhancing the supply side of the economy through investment in human capital.
Step-by-Step Reasoning
-
Option A: import quota – This is a protectionist measure that restricts the quantity of imports. It does not increase the economy's productive capacity; instead, it may reduce competition and efficiency. It is not a supply-side policy.
-
Option B: rise in interest rates – This is a monetary policy tool used to control inflation by reducing aggregate demand. It does not directly affect the supply side or productive capacity. It is not a supply-side policy.
-
Option C: specific tax on supply – This is a fiscal policy (indirect tax) that increases production costs, potentially reducing supply. It does not aim to increase productive capacity. It is not a supply-side policy.
-
Option D: subsidy to businesses for training courses – This directly encourages firms to invest in training, improving the skills and productivity of the labour force. This enhances the quality of labour, a factor of production, thereby shifting the LRAS curve rightwards. This is a clear example of supply-side policy.
Thus, only option D is correct.
Key Takeaways
- Supply-side policy focuses on long-run productive capacity, not short-run demand management.
- Common tools include training, infrastructure, and technology support.
- Distinguish supply-side policies from fiscal, monetary, and protectionist measures.
Common Mistakes
- Confusing a supply-side policy with a policy that affects the supply of a specific good (e.g., import quota, tax on supply). The key is the impact on the economy's overall productive capacity, not the supply of a particular product.
- Mistaking interest rate changes as supply-side because they affect the supply of savings or loans. However, interest rates are primarily a monetary policy tool targeting aggregate demand.
Things to Be Careful About
- Understand that supply-side policies aim to shift the LRAS curve, not the AD curve.
- Be precise: training improves labour productivity, which is a supply-side measure; a general subsidy to businesses (without conditions) might be considered supply-side only if it incentivises investment in production capacity.
- In the exam, read all options carefully; watch for distractors that sound like they affect supply but are not supply-side policies in the macroeconomic sense.
A worker earns $10 000 and pays $1000 in income tax.
Another worker earns $30 000 and pays $4500 in income tax.
A third worker earns $150 000 and pays $50 000 in income tax.
Which type of tax is this?
Options
A indirect
B progressive
C proportional
D regressive
Working
Worker 1: average tax rate = $1000 / $10 000 = 10%
Worker 2: average tax rate = $4500 / $30 000 = 15%
Worker 3: average tax rate = $50 000 / $150 000 = 33.3%
As income rises, the average tax rate rises. This is the definition of a progressive tax.
Answer
B
B
Background Concept
A tax system is classified by how the average (or effective) tax rate changes as income changes. The average tax rate is the total tax paid divided by total income, usually expressed as a percentage. There are three main types:
- Progressive tax: the average tax rate increases as income increases. Higher earners pay a larger proportion of their income in tax.
- Proportional tax: the average tax rate is constant across all income levels. Everyone pays the same proportion of their income.
- Regressive tax: the average tax rate decreases as income increases. Lower earners pay a larger proportion of their income in tax, even if the absolute amount paid is smaller.
Note that this classification is about the average rate, not the marginal rate (the rate on the next dollar earned). A progressive tax system typically has increasing marginal rates, but the defining feature is the rising average rate.
Understanding the Question
The question provides three income-tax pairs:
- $10 000 income, $1000 tax
- $30 000 income, $4500 tax
- $150 000 income, $50 000 tax
We are asked to identify which type of tax this is: indirect, progressive, proportional, or regressive. The answer depends on calculating the average tax rate for each worker and seeing how it changes with income.
Approach
- Calculate the average tax rate for each worker: tax paid / income.
- Compare the rates: do they rise, stay the same, or fall as income increases?
- Match the pattern to the definition of progressive, proportional, or regressive.
- Eliminate 'indirect' because the tax is clearly on income (a direct tax), not on spending.
Step-by-Step Reasoning
Worker 1: $1000 / $10 000 = 0.10 = 10%
Worker 2: $4500 / $30 000 = 0.15 = 15%
Worker 3: $50 000 / $150 000 = 0.333... = 33.3%
The average tax rate rises from 10% to 15% to 33.3% as income rises from $10 000 to $30 000 to $150 000. This is the defining characteristic of a progressive tax.
Checking the other options:
- Indirect (A): An indirect tax is levied on spending (e.g., VAT, excise duty), not on income. The question describes an income tax, which is a direct tax. So A is incorrect.
- Proportional (C): A proportional tax would have the same average rate for all workers, e.g., 10% for everyone. Here the rates differ, so C is incorrect.
- Regressive (D): A regressive tax would have a falling average rate as income rises. Here the rate rises, so D is incorrect.
Therefore, the correct answer is B, progressive.
Key Takeaways
- To classify a tax system, always calculate the average tax rate at different income levels and observe the trend.
- Progressive = rising average rate; proportional = constant average rate; regressive = falling average rate.
- The classification depends on the average rate, not the marginal rate, although they are related.
- Income tax is a direct tax; indirect taxes are on expenditure.
Common Mistakes
- Confusing progressive with proportional: a proportional tax has a constant rate, not a rising one.
- Thinking that a regressive tax means the rich pay less in absolute terms. A regressive tax means the rich pay a smaller proportion of their income, even if the absolute amount is larger.
- Miscalculating the average tax rate (e.g., dividing income by tax instead of tax by income).
- Choosing 'indirect' because the question mentions 'income tax' but the student misreads the options.
Things to Be Careful About
- Always compute the average rate as a percentage to make comparison easy.
- The numbers in this question are deliberately chosen to give clear, increasing percentages. In other questions, the pattern may be less obvious, so calculate precisely.
- Remember that 'progressive', 'proportional', and 'regressive' refer to the relationship between the tax rate and income, not to the absolute amount of tax paid.
An increase in interest rates is an example of which type of policy?
Options
A contractionary fiscal policy
B contractionary monetary policy
C expansionary monetary policy
D restrictive supply-side policy
Answer
Interest rates are a tool of monetary policy, not fiscal policy or supply-side policy. An increase in interest rates is designed to reduce aggregate demand to control inflation, making it a contractionary monetary policy. Therefore, the correct option is B.
B
Background Concept
Monetary policy refers to the actions of a central bank (or monetary authority) to control the money supply and interest rates to achieve macroeconomic objectives such as price stability, low unemployment, and economic growth. The main tools of monetary policy include interest rates, open market operations, and reserve requirements. An increase in interest rates makes borrowing more expensive and saving more attractive, which reduces consumption and investment, thereby decreasing aggregate demand. This is known as contractionary monetary policy, typically used to combat inflation. In contrast, fiscal policy involves government spending and taxation decisions made by the government, not the central bank. Supply-side policy aims to increase the productive capacity of the economy by shifting the long-run aggregate supply curve through measures such as training, infrastructure, and deregulation.
Understanding the Question
The question asks: "An increase in interest rates is an example of which type of policy?" This is a straightforward classification task. It tests whether you know that interest rates are a monetary policy instrument and whether you can distinguish between expansionary and contractionary actions. The options include both fiscal and monetary policies, as well as supply-side policy, so you must be able to eliminate the incorrect categories.
Approach
- Identify the nature of the policy tool: interest rates are set by the central bank, so they belong to monetary policy, not fiscal policy or supply-side policy.
- Determine the direction: an increase in interest rates is contractionary because it reduces aggregate demand; a decrease would be expansionary.
- Match the correct option: Contractionary monetary policy (Option B).
Step-by-Step Reasoning
- Option A: Contractionary fiscal policy – Fiscal policy involves changes in government spending and taxation. Interest rates are not a fiscal tool; they are a monetary policy instrument. Therefore, A is incorrect.
- Option B: Contractionary monetary policy – This is correct. An increase in interest rates is a typical contractionary monetary policy action. It raises the cost of borrowing, discourages investment and consumption, and reduces aggregate demand, helping to control inflation.
- Option C: Expansionary monetary policy – This would involve a decrease in interest rates to stimulate borrowing and spending. An increase does the opposite, so C is incorrect.
- Option D: Restrictive supply-side policy – Supply-side policies aim to increase the economy's productive capacity. They do not directly involve interest rates. Restrictive supply-side policy is not a standard term; supply-side policies are generally expansionary in terms of potential output. Thus, D is incorrect.
Therefore, the only correct answer is B.
Key Takeaways
- Interest rates are a tool of monetary policy, not fiscal or supply-side policy.
- An increase in interest rates is contractionary; a decrease is expansionary.
- Always distinguish between the different policy types and their instruments.
Common Mistakes
- Confusing fiscal policy with monetary policy: some students think interest rates are set by the government (fiscal authority), but they are actually set by the central bank.
- Mixing up expansionary and contractionary: an increase in interest rates is contractionary, not expansionary.
- Thinking that interest rates can be part of supply-side policy: supply-side policy focuses on productivity and efficiency, not on interest rates.
Things to Be Careful About
- Remember that the central bank (monetary authority) is responsible for interest rates, not the government's fiscal policy.
- In some contexts, interest rates can be influenced by other factors, but in standard macroeconomic policy classification, they are exclusively monetary.
- Pay attention to the direction of the change: increasing vs decreasing. The word "increase" clearly indicates contractionary.
For which government measure would both the outcomes shown be likely to benefit its economy?
Options
| government measure | outcome 1 | outcome 2 | |
|---|---|---|---|
| A | embargoes | protect against import of harmful materials | encourage illegal trade and corruption |
| B | export subsidies | give home producers a cost advantage | are a drain on government expenditure |
| C | import quotas | restrict volume of expensive imports | reduce balance of payments deficit |
| D | tariffs | protect some jobs by raising import prices | cause unemployment due to rising costs of imported raw materials |
Answer
The question asks for a measure where both outcomes are likely to benefit its economy. Evaluate each option:
- Option A (embargoes): Outcome 1 – protect against import of harmful materials: could be beneficial. Outcome 2 – encourage illegal trade and corruption: harmful. Not both beneficial.
- Option B (export subsidies): Outcome 1 – give home producers a cost advantage: beneficial for producers. Outcome 2 – are a drain on government expenditure: harmful. Not both beneficial.
- Option C (import quotas): Outcome 1 – restrict volume of expensive imports: beneficial if it reduces import expenditure. Outcome 2 – reduce balance of payments deficit: beneficial. Both outcomes are beneficial.
- Option D (tariffs): Outcome 1 – protect some jobs by raising import prices: beneficial for some. Outcome 2 – cause unemployment due to rising costs of imported raw materials: harmful. Not both beneficial.
Therefore, the correct answer is C.
Answer
C
C
Background Concept
Protectionism refers to government policies that restrict international trade to protect domestic industries from foreign competition. Common measures include tariffs, quotas, export subsidies, and embargoes. Each has different effects on the economy, with some outcomes being beneficial and others detrimental. The question requires evaluating both outcomes listed for each measure and determining whether both are likely to be beneficial.
Understanding the Question
This is a multiple-choice question that asks: "For which government measure would both the outcomes shown be likely to benefit its economy?" The table matches each measure (embargoes, export subsidies, import quotas, tariffs) with two outcomes. The candidate must assess each outcome to see if it is a benefit to the economy. The correct answer is the one where both outcomes are positive. The marking scheme indicates answer C.
Approach
We need to examine each option's two outcomes and decide if they are both likely to benefit the economy. Benefits can be defined as improvements in economic welfare, such as increased efficiency, higher output, lower unemployment, improved balance of payments, etc. However, some outcomes may be ambiguous – for example, protecting jobs could be beneficial in the short run but may lead to inefficiency. The question likely expects a straightforward interpretation: "benefit" means a positive effect from the perspective of the domestic economy. We will evaluate each option.
Step-by-Step Reasoning
Option A: Embargoes
- Outcome 1: "protect against import of harmful materials". This could be beneficial if it prevents the import of goods that are dangerous or undesirable (e.g., hazardous waste). However, embargoes are often broad and can harm the economy by reducing trade.
- Outcome 2: "encourage illegal trade and corruption". This is clearly detrimental. Illegal trade undermines the rule of law and can lead to economic losses. So not both beneficial.
Option B: Export subsidies
- Outcome 1: "give home producers a cost advantage". This can be beneficial for domestic producers as it lowers their costs, making them more competitive internationally. This could boost exports and production.
- Outcome 2: "are a drain on government expenditure". Subsidies require government spending, which must be financed by taxes or borrowing, imposing a cost on the economy. This is a negative outcome. Thus not both beneficial.
Option C: Import quotas
- Outcome 1: "restrict volume of expensive imports". By limiting the quantity of imports, the government can reduce the amount of foreign currency spent on imports, which might improve the current account. It also protects domestic industries from competition. Although restricting imports can lead to higher prices for consumers, the outcome as stated is "restrict volume of expensive imports", which can be seen as beneficial if it reduces expenditure on imports.
- Outcome 2: "reduce balance of payments deficit". A reduction in the balance of payments deficit is typically a positive outcome for an economy, as it means the country is spending less abroad relative to its earnings. So both outcomes are beneficial: reducing import volumes and improving the balance of payments. Therefore, this is the correct answer.
Option D: Tariffs
- Outcome 1: "protect some jobs by raising import prices". Tariffs can protect domestic jobs in industries that compete with imports, as they make imports more expensive. This is a benefit for those workers and industries.
- Outcome 2: "cause unemployment due to rising costs of imported raw materials". Tariffs on inputs raise costs for domestic producers, potentially leading to job losses in downstream industries. This is harmful. So not both beneficial.
Thus, only option C has both outcomes likely to benefit the economy.
Key Takeaways
- Protectionist measures often have mixed effects: some are beneficial, others harmful.
- The question tests the ability to distinguish between positive and negative outcomes of trade policies.
- Import quotas can reduce import volumes and improve the balance of payments, making them potentially beneficial in both respects.
- Other measures like embargoes, subsidies, and tariffs have clear negative side effects.
Common Mistakes
- Assuming that any outcome that seems positive (like protecting jobs) is automatically beneficial to the whole economy, ignoring the second outcome.
- Misinterpreting the outcomes: for example, thinking that "restrict volume of expensive imports" is always bad because it reduces consumer choice, but the question asks for "likely to benefit its economy", which might include protecting domestic industries and improving the trade balance.
- Getting confused by the table format and not reading both outcomes.
Things to Be Careful About
- Read each outcome carefully: "encourage illegal trade" is clearly negative, "drain on government expenditure" is negative, "cause unemployment" is negative.
- The wording "both the outcomes shown" means we need both outcomes to be beneficial.
- The answer is C because it is the only one where both outcomes are positive.
The table shows the terms of trade for an economy expressed as an index number for the period 2019 to 2021.
| year | terms of trade index (2018 = 100) |
|---|---|
| 2019 | 101 |
| 2020 | 104 |
| 2021 | 109 |
What can be concluded from the table?
Options
A The quantity of imports rose relative to the quantity of exports.
B The price of exports rose relative to the price of imports.
C The price of imports rose relative to the price of exports.
D The value of exports rose relative to the value of imports.
Reasoning
Terms of trade is defined as:
( \text{Terms of Trade Index} = \frac{\text{Index of Export Prices}}{\text{Index of Import Prices}} \times 100 ).
An increase in the index from 101 in 2019 to 109 in 2021 (base 2018 = 100) means that export prices have risen relative to import prices. This could occur because export prices increased faster than import prices, or import prices fell relative to export prices. Either way, the ratio has improved.
Therefore, the correct conclusion is B: the price of exports rose relative to the price of imports.
Answer
B
B
Background Concept
The terms of trade measure the relative price of a country's exports compared to its imports. It is calculated as:
( \text{Terms of Trade Index} = \frac{\text{Index of Export Prices}}{\text{Index of Import Prices}} \times 100 ).
A rise in the index (above 100) indicates that export prices have increased relative to import prices – often referred to as an 'improvement' in the terms of trade. A fall indicates the opposite. This measurement uses index numbers to track changes over time, with a base year set to 100.
Understanding the Question
The table gives the terms of trade index for 2019-2021, with 2018 as the base year (100). The index rises from 101 to 104 to 109. We are asked what can be concluded from these numbers. The four options are statements about changes in prices or quantities of exports and imports. The correct answer must be logically deduced from the definition of the terms of trade.
Approach
- Recall the formula for the terms of trade index.
- Interpret the upward trend: the index increases, so the ratio of export prices to import prices has risen.
- Match this interpretation to the options:
- Option B: 'The price of exports rose relative to the price of imports' – this is exactly what an increase means.
- Option C: the opposite – rules out.
- Option A mentions quantities, not prices – irrelevant.
- Option D mentions value (price × quantity) – the index only covers prices, not quantities.
- Conclude that B is correct.
Step-by-Step Reasoning
- Given: Terms of trade index (2018=100): 2019=101, 2020=104, 2021=109.
- This index is calculated as (index of export prices / index of import prices) × 100.
- An increase from 100 to 109 means the numerator (export prices index) grew faster than the denominator (import prices index), or the denominator fell relative to the numerator.
- In plain terms: export prices became more expensive compared to import prices.
- Option A: 'The quantity of imports rose relative to the quantity of exports' – no, the index is about prices, not quantities. The table provides no data on quantities, so this cannot be concluded.
- Option B: 'The price of exports rose relative to the price of imports' – this is a direct restatement of the increase in the terms of trade. Correct.
- Option C: 'The price of imports rose relative to the price of exports' – that would be a decrease in the terms of trade (since the denominator would be rising relative to the numerator). The data shows an increase, so this is false.
- Option D: 'The value of exports rose relative to the value of imports' – value depends on both prices and quantities. The index only tracks prices, so we cannot conclude anything about values without quantity data. Therefore, false.
Thus, B is the only logically consistent conclusion.
Key Takeaways
- Terms of trade index measures relative export/import prices, not quantities or values.
- An increase in the index means export prices have risen relative to import prices (or import prices have fallen relative to export prices).
- A common misinterpretation is to think terms of trade improve when export prices rise in absolute terms; it is the ratio that matters.
- Index numbers simplify comparisons over time but require careful attention to base year.
Common Mistakes
- Confusing 'terms of trade' with 'balance of trade' (which is the difference between export and import values). The question is about prices, not trade balance.
- Thinking that a rising index means export prices are rising or import prices are falling in absolute terms. The index only tells us about the ratio; both could be rising but at different rates.
- Selecting option A or D because they mention 'exports' and 'imports' without distinguishing between price and quantity/value.
- Misinterpreting an index above 100 as an improvement in trade performance, whereas 'improvement' depends on context (e.g., if a country wants to export more, a higher terms of trade may actually worsen the trade balance due to price elasticity – but that is not relevant here).
Things to Be Careful About
- Always recall the exact formula for terms of trade – the ratio of export price index to import price index.
- The index only covers prices. Do not infer anything about quantities, values, or trade balances without additional data.
- The base year is set to 100; here 2018 is the base. The index values for 2019-2021 show changes relative to 2018.
- When the index rises above 100, export prices have risen relative to import prices compared to the base year. A fall below 100 would mean the opposite.
- In multiple-choice questions, eliminate options that introduce irrelevant variables (quantities, values) and focus on the precise definition.
Which explanation for a country choosing to engage in international trade is not valid?
Options
A Engaging in international trade enables the country to achieve a higher average standard of living.
B Other countries are more efficient at producing some goods.
C There are some products that the country cannot produce.
D The country has a comparative advantage in the production of all of its goods compared to other countries.
Answer
International trade is based on comparative advantage, not absolute advantage. A country can have an absolute disadvantage in all goods yet still gain from trade by specialising in the good where its comparative advantage (lowest opportunity cost) is greatest. Option D states that the country has a comparative advantage in all its goods, which is impossible — comparative advantage is a relative concept; a country cannot have a comparative advantage in everything. Therefore D is not a valid explanation for choosing to trade.
Answer
D
D
Background Concept
International trade theory, particularly the principle of comparative advantage (David Ricardo), explains why countries trade even when one country is more efficient at producing everything. The key insight is that trade is driven by differences in opportunity costs, not absolute productivity. A country has a comparative advantage in producing a good if it can produce it at a lower opportunity cost than another country. Even if a country is less efficient (has an absolute disadvantage) in all goods, it still benefits from specialising in the good where its disadvantage is smallest and trading for the rest.
Understanding the Question
The question asks which of four statements is NOT a valid explanation for a country choosing to engage in international trade. Three of the options are genuine reasons; one is a common misconception. The task is to identify the false one. The options are:
- A: Trade raises the average standard of living (true — trade allows consumption beyond the production possibility frontier).
- B: Other countries are more efficient at producing some goods (true — this is absolute advantage; trade allows the country to obtain those goods more cheaply than producing them domestically).
- C: Some products cannot be produced domestically (true — e.g. tropical products in a temperate climate, or certain natural resources).
- D: The country has a comparative advantage in all its goods compared to other countries (this is the invalid one).
Approach
Recall the definition of comparative advantage: it is a relative concept — it compares opportunity costs across goods within a country and then across countries. A country can have a comparative advantage in one good only if it has a comparative disadvantage in another. It is impossible to have a comparative advantage in everything because that would require the country to have a lower opportunity cost in every good, which is logically contradictory. The correct answer is D.
Step-by-Step Reasoning
-
Option A — Engaging in international trade enables a country to achieve a higher average standard of living. This is valid because trade allows a country to consume beyond its production possibility frontier (PPC). By specialising in goods where it has a comparative advantage and trading, the country can obtain more goods and services than it could produce on its own. This raises real income and living standards.
-
Option B — Other countries are more efficient at producing some goods. This is a valid reason based on absolute advantage. If another country can produce a good using fewer resources (lower absolute cost), it makes sense to import that good rather than produce it domestically. This is a straightforward reason for trade.
-
Option C — There are some products that the country cannot produce. This is valid due to natural endowments, climate, technology, or resource availability. For example, a landlocked country cannot produce tropical fruits; a country without oil reserves cannot produce petroleum. Trade allows access to such products.
-
Option D — The country has a comparative advantage in the production of all of its goods compared to other countries. This is invalid. Comparative advantage is defined relative to other goods within the same country. A country can have a comparative advantage in one good only if it has a comparative disadvantage in another. It is impossible to have a comparative advantage in everything because that would imply the country has a lower opportunity cost in every good, which is a contradiction — opportunity costs are measured relative to the next best alternative. If a country had a lower opportunity cost in all goods, it would mean it is more efficient in all goods (absolute advantage), but even then, comparative advantage would still be determined by the relative differences in efficiency. The correct statement is that a country can have an absolute advantage in all goods, but not a comparative advantage in all goods.
Key Takeaways
- Comparative advantage is about relative opportunity costs, not absolute productivity.
- A country cannot have a comparative advantage in everything; it always has a comparative disadvantage in some good.
- Trade is beneficial even for a country that is less efficient in everything (absolute disadvantage) because specialisation according to comparative advantage still yields gains.
- The question tests the ability to distinguish between absolute and comparative advantage and to spot a common logical error.
Common Mistakes
- Confusing absolute advantage with comparative advantage. A student might think that if a country is better at everything, it has no reason to trade — but that is incorrect; even an absolutely more efficient country gains from trade by specialising in its greatest comparative advantage.
- Thinking that a country with a comparative advantage in all goods is possible. This shows a misunderstanding of the concept — comparative advantage is inherently relative.
- Selecting option A, B, or C because they seem too obvious or because the student does not recognise the logical flaw in D.
Things to Be Careful About
- Read the question carefully: it asks for the explanation that is NOT valid.
- Remember that comparative advantage is about opportunity cost ratios, not absolute costs.
- The phrase "comparative advantage in all of its goods" is a contradiction in terms — it cannot happen.
- Do not overthink: the other three options are all standard, valid reasons for trade.
In which economic context is the term ‘protectionism’ usually applied?
Options
A the protection of consumers against excessive prices
B the protection of employees against exploitation by multinational companies
C the protection of local producers against international competitors
D the protection of the foreign exchange rate against currency speculators
Protectionism refers to policies that restrict international trade to protect domestic industries from foreign competition. Options A, B, and D refer to domestic consumer protection, labour rights, and exchange rate stability, which are not the primary context of protectionism. Therefore, option C is correct.
Answer
C
C
Background Concept
Protectionism is a set of government policies designed to restrict or discourage international trade, typically to shield domestic industries from foreign competition. Common protectionist measures include tariffs (taxes on imports), import quotas (quantitative limits on imports), and non-tariff barriers such as excessive regulations or subsidies for domestic producers. The term is exclusively used in the context of international trade, not in domestic policy areas like consumer protection, labour rights, or exchange rate management.
Understanding the Question
This multiple-choice question asks you to identify the economic context in which the term 'protectionism' is usually applied. It presents four options, each referring to a different type of 'protection'. The correct answer is the one that matches the standard definition used in economics. The question is straightforward recall: you need to know what protectionism means in the context of international trade.
Approach
Start by recalling the definition of protectionism from your syllabus. It is a trade policy aimed at protecting a country's domestic industries from foreign competition. Then examine each option: three of them refer to other types of protection (consumers, employees, exchange rate) that are not the primary meaning of protectionism. The remaining option (C) correctly identifies the context of international trade. Eliminate the distractors systematically.
Step-by-Step Reasoning
- Option A (protection of consumers against excessive prices) refers to consumer protection policies, such as price controls or competition law. This is not the context of protectionism, which is about trade barriers.
- Option B (protection of employees against exploitation by multinational companies) is about labour rights and corporate regulation, not trade policy.
- Option C (protection of local producers against international competitors) directly matches the definition of protectionism: shielding domestic firms from foreign competition through trade restrictions.
- Option D (protection of the foreign exchange rate against currency speculators) relates to exchange rate policy, such as using foreign exchange reserves or capital controls, which is separate from protectionism.
Only option C fits the standard economic definition, so it is the correct answer.
Key Takeaways
- Protectionism is a trade policy used to protect domestic industries from foreign competition.
- It is distinct from other forms of government intervention, such as consumer protection, labour regulation, or exchange rate management.
- Common protectionist measures include tariffs, quotas, and subsidies.
Common Mistakes
- Confusing protectionism with other policies that also involve the word 'protection'. Students may mistakenly think protectionism refers to protecting consumers or workers, but in economics it is specifically about trade.
- Overlooking the precise wording of the options: 'protection of local producers against international competitors' is the key phrase that signals the correct context.
Things to Be Careful About
- Always read the options carefully and match them to the exact definition from your syllabus.
- Remember that protectionism is part of the 'International Trade' topic, not a general concept of protection.
- In multiple-choice questions, use elimination to rule out clearly wrong options, then confirm the remaining one with your knowledge of the term.
Both the US and the EU operate in floating exchange rate markets.
The rate of exchange fluctuated greatly during the period shown.
| year | US dollar–euro rate of exchange |
|---|---|
| 2000 | 0.84 dollars per euro |
| 2008 | 1.59 dollars per euro |
| 2022 | 1.00 dollar per euro |
What would explain the changes in the US dollar–euro rate of exchange?
Options
A changes in the supply and demand for dollars and euros in the foreign exchange market
B continuous appreciation of the US dollar throughout the period
C continuous depreciation of the US dollar throughout the period
D restraints placed by trade agreements on the rate of exchange
Reasoning
The data shows the US dollar–euro rate fluctuating: 0.84 dollars per euro in 2000, 1.59 in 2008, and 1.00 in 2022. Under a floating exchange rate system, the rate is determined by the supply of and demand for the currency in the foreign exchange market. Therefore, option A is correct.
Answer
A
A
Background Concept
In a floating exchange rate system, the value of a currency is determined by the forces of supply and demand in the foreign exchange market. The exchange rate is the price of one currency in terms of another. For the US dollar–euro market, the supply of dollars comes from US residents buying foreign goods, services, or assets, or from foreign investors converting dollars. The demand for dollars comes from foreign residents buying US goods, services, or assets. Changes in factors such as interest rates, inflation, income levels, and capital flows shift the supply and demand curves, causing the equilibrium exchange rate to change. For example, a rise in US interest rates relative to the eurozone may increase demand for dollars, causing the dollar to appreciate (the exchange rate to fall if quoted as dollars per euro).
Understanding the Question
The question provides a table showing the US dollar–euro exchange rate for three years: 2000 (0.84 dollars per euro), 2008 (1.59), and 2022 (1.00). The rate fluctuated: it rose from 2000 to 2008 (dollar depreciated), then fell from 2008 to 2022 (dollar appreciated). The question asks what would explain these changes. The options are: A – changes in supply and demand for the currencies; B – continuous appreciation of the dollar; C – continuous depreciation of the dollar; D – restraints from trade agreements. The correct answer must be consistent with the observed fluctuations and the nature of a floating exchange rate.
Approach
First, interpret the data to see the pattern: the rate is not monotonic; it goes up then down. This rules out options B and C, which claim continuous movement in one direction. Next, recall that in a floating exchange rate system, the rate is determined by market forces, not by government or trade agreement restraints. Option A correctly identifies that changes in supply and demand for dollars and euros explain the changes. Options B and C are false because the data shows both appreciation and depreciation. Option D is false because floating rates are not restrained by trade agreements. The approach is to use the data to eliminate the incorrect options and confirm the correct one.
Step-by-Step Reasoning
-
Interpret the data: The exchange rate is quoted as dollars per euro. A rise in this rate means the euro is becoming more expensive (dollar depreciates), and a fall means the euro is cheaper (dollar appreciates).
- 2000: 0.84 dollars per euro
- 2008: 1.59 dollars per euro (rate increased, so dollar depreciated relative to euro)
- 2022: 1.00 dollars per euro (rate decreased, so dollar appreciated relative to euro)
Thus, the dollar depreciated then appreciated; it did not move continuously in one direction.
-
Evaluate option A: Changes in supply and demand for dollars and euros in the foreign exchange market. This is the fundamental mechanism under a floating exchange rate. Shifts in the determinants of supply and demand (e.g., relative interest rates, inflation, trade flows, capital flows) can cause the exchange rate to fluctuate. The observed pattern is consistent with such shifts. Therefore, option A is correct.
-
Evaluate option B: Continuous appreciation of the US dollar. The data shows the dollar depreciated from 2000 to 2008, so appreciation did not occur throughout. Hence, B is incorrect.
-
Evaluate option C: Continuous depreciation of the US dollar. The dollar appreciated from 2008 to 2022, so depreciation was not continuous. Hence, C is incorrect.
-
Evaluate option D: Restraints placed by trade agreements on the rate of exchange. In a floating exchange rate system, the rate is not set or restrained by trade agreements; it is determined by market forces. Even if trade agreements influence trade flows, they do not directly restrain the rate. Moreover, the observed fluctuations are not consistent with a restrained rate. Hence, D is incorrect.
Therefore, the only option that correctly explains the changes is A.
Key Takeaways
- Floating exchange rates are determined by the supply of and demand for currencies in the foreign exchange market.
- Changes in any factor that affects supply or demand (interest rates, inflation, income, expectations, etc.) will cause the exchange rate to change.
- Data can be used to test hypotheses about exchange rate movements; continuous appreciation or depreciation would require a sustained shift in supply or demand.
- Trade agreements do not directly set or restrain floating exchange rates.
Common Mistakes
- Misinterpreting the exchange rate quote: a rise in dollars per euro means the dollar is weakening, not strengthening. Some students might think a higher number means stronger dollar, which is incorrect.
- Assuming that floating exchange rates are fixed or managed, and therefore thinking that trade agreements or central banks always intervene.
- Ignoring the data and choosing a distractor that sounds plausible, such as “continuous depreciation” because the rate increased from 2000 to 2008, but failing to note the later decrease.
- Overlooking that the question asks for an explanation of the changes, not just a description of the trend.
Things to Be Careful About
- Always read the unit of the exchange rate carefully. Here it is “dollars per euro,” so an increase indicates a weaker dollar.
- Note that the period covers multiple years; a single snapshot is not enough to determine a trend.
- In a multiple-choice question, eliminate clearly false options using the data, then confirm the correct one with theory.
- Remember that “floating exchange rate” means market-determined, so option D is inconsistent with the system described.
Your score so far
Answer a question to start scoring
Your marks add up here as you work through the paper.