Economics 9708/13 — October/November 2025
Cambridge AS Level · AS Level Multiple Choice · answer key with instant marking and worked solutions
Topics Methods of Government Intervention in Markets · Fiscal Policy · Demand and Supply · Elasticities of Demand · International Trade and Comparative Advantage · Price Stability · +16 more
Tap an option under each question to check it — your score builds as you go.
The following appeared in a newspaper article.
‘The economies of the poorest nations have large international debts; the richest nations should cancel the debts of these nations and reduce poverty.’
What is the nature of each statement?
Options
| poorest nations have large international debts | richest nations should cancel these debts to reduce poverty | |
|---|---|---|
| A | normative | normative |
| B | normative | positive |
| C | positive | positive |
| D | positive | normative |
Working
A positive statement is a factual claim that can be tested or verified; a normative statement involves a value judgement about what ought to be.
The first statement — 'The economies of the poorest nations have large international debts' — is an assertion about the current situation and can be checked against data, so it is positive.
The second statement — 'the richest nations should cancel these debts to reduce poverty' — expresses a moral obligation or policy recommendation; it cannot be proven true or false, so it is normative.
Therefore the correct combination is: first positive, second normative.
Answer
D
D
Background Concept
In economics, we distinguish between two types of statements:
- Positive statements are objective claims about what is, was, or will be. They can be tested by examining evidence (e.g., 'Unemployment fell last quarter'). Even if the claim turns out to be false, it remains positive because it could be verified.
- Normative statements are subjective value judgements about what ought or should happen. They involve opinions, ethics, or policy preferences and cannot be settled by evidence alone (e.g., 'The Government should reduce unemployment').
This distinction is fundamental to economics as a social science. Economists aim to base their analysis on positive reasoning, but policy recommendations often contain normative elements.
Understanding the Question
We are given two statements from a newspaper article and need to classify each as positive or normative.
- Statement 1: 'The economies of the poorest nations have large international debts.'
- Statement 2: 'The richest nations should cancel the debts of these nations and reduce poverty.'
The four options combine the classifications in different orders. The question is essentially asking for the correct pair.
Approach
First, recall the definition of each type. Then apply that definition to the first statement: is it a claim about what is (positive) or about what ought to be (normative)? Do the same for the second statement. The correct match should be clear.
Step-by-Step Reasoning
-
First statement: 'The economies of the poorest nations have large international debts.'
- This asserts a fact about the current state of certain economies. It can be tested by looking at World Bank or IMF data on external debt of low-income countries. Even if the statement were inaccurate (e.g., if some poorest nations actually have low debt), it remains a positive claim because it makes a testable assertion about reality. Therefore, it is positive.
-
Second statement: 'The richest nations should cancel the debts of these nations and reduce poverty.'
- This uses the word 'should', which is a clear signal of a value judgement. It recommends a course of action based on a moral perspective (that reducing poverty is desirable and that rich nations have an obligation). There is no way to prove or disprove that they 'should' cancel debts – it depends on ethical values. Hence, it is normative.
-
Matching the options:
- Option D says: first positive, second normative – which matches our analysis.
- Options A and B both call the first statement normative, which is incorrect because the first statement is a testable fact.
- Option C calls the second statement positive, but 'should' indicates a normative recommendation.
Therefore the correct answer is D.
Key Takeaways
- Positive statements are about facts (what is). Normative statements are about values (what ought to be).
- Watch for signal words like 'should', 'ought', 'better', 'fair', 'unfair' – these often indicate normative statements.
- Many economic debates involve mixing positive analysis with normative policy advice; being able to separate them is a key skill.
Common Mistakes
- Treating a false statement as normative: Some students think that if a statement is wrong, it must be normative. That is not correct – a positive statement can be false but still positive because it makes a testable claim.
- Misreading the table: The table in the question shows two columns; ensure you match the order correctly. The first column is the first statement, the second column is the second statement.
- Confusing 'positive' with 'good': In economics, 'positive' does not mean 'good' – it means 'factual'.
Things to Be Careful About
- Pay attention to the wording: 'have large debts' is a statement of fact; 'should cancel' is a value judgement.
- Some normative statements do not contain 'should' but use phrases like 'it is unfair that...' or 'the best policy is...'. Here, 'should' is explicit.
- In multiple-choice questions, work through each option systematically rather than jumping to a guess.
What is meant by the division of labour?
Options
A A process is split into a series of individual tasks.
B Some workers work part-time and others work full-time.
C The same amount of output per hour is produced by each worker.
D Wages are divided equally between workers.
Working
Division of labour refers to the breaking down of a production process into a series of smaller, individual tasks, each performed by a different worker or group of workers. This is the essence of specialisation.
Answer
A
A
Background Concept
Division of labour is a key concept in economics, closely related to specialisation. It involves breaking down the production of a good or service into a series of distinct tasks, each performed by a different worker or group of workers. For example, in a car manufacturing plant, one worker might fit the engine, another might attach the doors, and another might paint the body. This allows workers to become highly skilled at their specific task, increasing productivity and efficiency. The concept was famously discussed by Adam Smith in his book The Wealth of Nations, using the example of a pin factory where the division of labour dramatically increased output per worker. Specialisation arising from division of labour is one of the main reasons for increased productivity and economic growth.
Understanding the Question
The question asks: "What is meant by the division of labour?" This is a straightforward definition question. The command word "What is meant by" requires a clear, precise explanation of the term. You need to select the option that best describes the concept. The options present four different statements, only one of which accurately captures the core meaning of division of labour.
Approach
Read each option carefully and compare it with the standard definition of division of labour. Option A mentions splitting a process into individual tasks — this matches the definition. Option B talks about part-time versus full-time work, which is not related to division of labour. Option C refers to identical output per hour, which is about productivity equality, not division of labour. Option D describes equal wage distribution, which is unrelated. The correct option is A.
Step-by-Step Reasoning
- Recall the definition: Division of labour is the specialisation of workers in specific tasks by breaking a larger production process into separate steps.
- Option A: "A process is split into a series of individual tasks." This directly matches the definition. It emphasises the breaking down of the production process, which is the essence of division of labour. This is correct.
- Option B: "Some workers work part-time and others work full-time." This is about the duration of work, not about how tasks are allocated. It is irrelevant to division of labour.
- Option C: "The same amount of output per hour is produced by each worker." This describes equal productivity, which is not a feature of division of labour. In fact, division of labour typically leads to different levels of output per worker depending on their task and skill.
- Option D: "Wages are divided equally between workers." This refers to wage distribution, which is unrelated to division of labour. Division of labour does not imply equal wages; wages are determined by market forces, skills, and bargaining power.
Therefore, only option A correctly defines division of labour.
Key Takeaways
- Division of labour involves breaking a production process into smaller tasks, with each worker specialising in one task.
- It is a fundamental concept in microeconomics that explains productivity gains from specialisation.
- The correct definition focuses on the segmentation of tasks, not on working hours, output equality, or wage distribution.
Common Mistakes
- Confusing division of labour with the division of output or wages. Students sometimes think it means workers share output equally, which is incorrect.
- Associating it with part-time work. Division of labour is about task allocation, not the number of hours worked.
- Thinking it means each worker produces the same amount. Division of labour often leads to varying output levels depending on the task's complexity.
Things to Be Careful About
- Pay attention to the exact wording of each option. The correct definition is precise: "split into a series of individual tasks." Any deviation from this core idea is likely wrong.
- In multiple-choice questions, eliminate obviously wrong options first. Here, options B, C, and D are clearly unrelated to the definition.
- Ensure you understand the concept thoroughly, as it often appears in discussions of productivity, efficiency, and economic growth.
What would be an opportunity cost of growth in an economy?
Options
A the faster growth of services than of manufacturing
B the need for an increased level of imported raw materials
C the need for greater government intervention
D the reduction of consumption if growth requires investment
Answer
Opportunity cost is the next best alternative foregone when a choice is made. Economic growth often requires investment in capital goods, which uses resources that could otherwise have been used to produce consumption goods. The opportunity cost of growth is therefore the reduction in current consumption. This corresponds to option D.
Answer
D
D
Background Concept
Opportunity cost is a fundamental concept in economics. It is defined as the value of the next best alternative that is given up when a decision is made. It arises because resources are scarce and cannot be used for all purposes simultaneously. The concept applies to all levels: individuals, firms, and governments. In the context of an economy, growth typically requires investment in capital goods (e.g., machinery, factories, infrastructure) rather than consumption goods (e.g., food, clothing, entertainment). The resources diverted to investment could have been used to produce consumption goods, so the foregone consumption is the opportunity cost.
Understanding the Question
The question asks: "What would be an opportunity cost of growth in an economy?" It is a multiple-choice item with four options. The key is to identify which of the options represents a cost arising from the choice to pursue growth, specifically the next best alternative foregone. The correct option must be a genuine opportunity cost, not a side effect or a consequence that is not a foregone alternative.
Approach
First, recall the precise definition of opportunity cost. Then evaluate each option against that definition. The correct answer is the one that identifies something that is sacrificed (foregone) to achieve growth. The other options are either not a cost in the opportunity cost sense, or are not directly related to the choice to grow.
Step-by-Step Reasoning
- Option A: "the faster growth of services than of manufacturing" – This is a compositional change, not a foregone alternative. It describes a pattern of growth, not a cost.
- Option B: "the need for an increased level of imported raw materials" – This is a consequence of growth, but it is not a foregone alternative. Imported raw materials are purchased, not sacrificed. The opportunity cost would be the exports that must be given up to pay for imports, but that is not stated.
- Option C: "the need for greater government intervention" – This is a possible policy response, not a foregone alternative. It is not a direct cost of growth.
- Option D: "the reduction of consumption if growth requires investment" – This directly fits the definition: to invest in capital goods, the economy must forgo some current consumption. That is the next best alternative given up, so it is the opportunity cost.
Thus, D is correct.
Key Takeaways
- Opportunity cost always involves a sacrifice of the next best alternative.
- In macroeconomics, growth often involves a trade-off between current consumption and future consumption through investment.
- Recognising which option represents a genuine foregone alternative is crucial.
Common Mistakes
- Confusing opportunity cost with other costs or consequences (e.g., the need for imports, government intervention).
- Thinking that growth has no opportunity cost because it increases future output – but the trade-off is between present and future consumption.
- Selecting an option that is a side effect rather than a foregone alternative.
Things to Be Careful About
- Always return to the definition: what is given up?
- Do not overcomplicate; the answer is straightforward.
- In multiple-choice questions, eliminate options that do not match the concept.
Which change in the way resources are allocated in an economy is consistent with moving from a planned economy to a market economy?
Options
A A minimum price guarantee for apple producers is removed.
B A new government authority is established to monitor inefficiencies in apple production.
C The production of apples is subsidised to increase output.
D The sale of apples has a maximum price imposed.
Reasoning
In a planned economy, resources are allocated by government decisions, often through price controls and subsidies. Moving to a market economy involves reducing such interventions. Removing a minimum price guarantee (option A) reduces government intervention in the apple market, allowing prices to be determined by market forces. This is consistent with a move towards a market economy.
Answer
A
A
Background Concept
A planned economy (or command economy) is one in which the government makes all decisions about what to produce, how to produce, and for whom to produce. Resources are allocated through central planning, often using price controls, quotas, and subsidies. In contrast, a market economy relies on the price mechanism—the interaction of demand and supply—to allocate resources. Prices act as signals, incentives, and rationing devices. Moving from a planned to a market economy involves reducing government intervention and allowing market forces to operate more freely.
Understanding the Question
The question asks which of the four changes is consistent with a shift from a planned economy to a market economy. This means we need to identify the change that reduces government control over resource allocation in the apple market. Each option describes a different policy action; we must determine whether it increases or decreases government intervention.
Approach
First, recall the key difference: in a planned economy, the government sets prices and production targets; in a market economy, prices are determined by supply and demand. Therefore, any change that removes a government-imposed price control or subsidy is a move towards a market economy. Conversely, any change that introduces or strengthens government intervention is a move away from a market economy. We will evaluate each option against this criterion.
Step-by-Step Reasoning
-
Option A: A minimum price guarantee for apple producers is removed. A minimum price guarantee is a government intervention that sets a floor price above the market equilibrium, often to support producers. Removing it means the price of apples will be determined solely by market forces. This reduces government intervention and is consistent with moving towards a market economy. This is the correct answer.
-
Option B: A new government authority is established to monitor inefficiencies in apple production. Establishing a new government authority increases government involvement in the apple market. Even if the aim is to monitor inefficiencies, it represents more central planning and oversight, not less. This is inconsistent with a move towards a market economy.
-
Option C: The production of apples is subsidised to increase output. A subsidy is a government payment to producers, which distorts market prices and allocation. Subsidies are a form of intervention typical of planned economies. Introducing a subsidy increases government control, so it is not consistent with moving towards a market economy.
-
Option D: The sale of apples has a maximum price imposed. A maximum price (price ceiling) is a government-imposed limit on how high a price can be charged. This is a direct intervention in the market, preventing prices from rising to the equilibrium level. Imposing a maximum price increases government control, so it is inconsistent with a move towards a market economy.
Thus, only option A represents a reduction in government intervention and is therefore consistent with moving from a planned to a market economy.
Key Takeaways
- The fundamental distinction between planned and market economies lies in how resources are allocated: by government decisions or by market forces.
- Moving from a planned to a market economy involves reducing government intervention, such as removing price controls, subsidies, and quotas.
- Any policy that increases government control over prices or production is a step away from a market economy.
Common Mistakes
- Confusing 'monitoring' with 'reducing intervention': Option B might seem like a step towards efficiency, but establishing a new authority is an increase in government involvement, not a reduction.
- Thinking that subsidies are always market-friendly: Subsidies are government interventions that distort market outcomes; they are more characteristic of planned economies.
- Assuming that any price control is consistent with a market economy: Price controls (minimum or maximum prices) are interventions; removing them is a move towards a market economy, while imposing them is a move away.
Things to Be Careful About
- The question asks for a change 'consistent with moving from a planned economy to a market economy'. Focus on the direction of change: from more government control to less.
- Note that market economies still have some government intervention (e.g., regulations), but the question is about a transition, so the key is reducing the extent of intervention.
- Read each option carefully: 'removed', 'established', 'subsidised', 'imposed'—these verbs indicate whether the policy is being added or taken away.
The diagram shows a production possibility curve (PPC) for an economy that produces two goods, X and Y. Both goods require labour to produce. The initial position of the PPC is at PPC0.
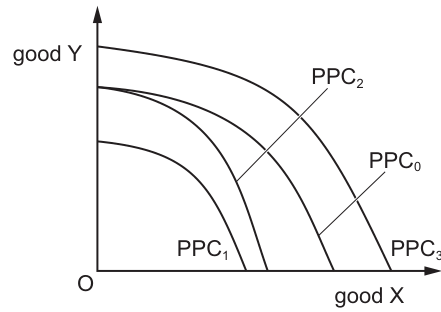
What is the effect on the PPC following the emigration of a large number of workers?
Options
A the PPC remains at PPC0
B the PPC shifts from PPC0 to PPC1
C the PPC shifts from PPC0 to PPC2
D the PPC shifts from PPC0 to PPC3
The emigration of workers reduces the economy’s labour force. Because both goods require labour to produce, the maximum possible output of each good falls. This reduces the economy’s productive capacity and shifts the PPC inward. In the diagram, PPC1 shows an inward shift from the original PPC0, whereas PPC2 and PPC3 show outward shifts (economic growth) and PPC0 shows no change.
Answer
B
B
Background Concept
A production possibility curve (PPC) illustrates the maximum combinations of two goods an economy can produce given its current resources and technology. The curve is typically concave due to increasing opportunity costs. A shift of the entire PPC occurs when there is a change in the quantity or quality of resources (such as labour, capital, or land) or a change in technology. An outward (rightward) shift represents economic growth – the economy can now produce more of both goods. An inward (leftward) shift represents a reduction in productive capacity – the economy can produce less of both goods.
Understanding the Question
The question describes the emigration of a large number of workers. Emigration means workers leave the country to live and work elsewhere. Labour is a factor of production, and the question states that both good X and good Y require labour. Therefore, the loss of workers reduces the total labour available to produce both goods. The question asks what happens to the PPC following this event. The diagram shows four curves: PPC0 (original), PPC1 (inward shift), PPC2 (outward shift), and PPC3 (further outward shift). The task is to match the economic event to the correct curve.
Approach
First, identify emigration as a reduction in the quantity of the labour factor. Second, link a reduction in a factor of production to a reduction in the economy’s productive capacity. Third, recall that reduced productive capacity is shown by an inward shift of the PPC. Finally, identify from the diagram which label corresponds to an inward shift. The description states that PPC1 is shifted inward (leftward) from PPC0, while PPC2 and PPC3 are shifted outward.
Step-by-Step Reasoning
- Effect on resources: Emigration removes workers from the domestic economy. This is a decrease in the labour force.
- Effect on production: With fewer workers, the maximum output of good X falls and the maximum output of good Y also falls (since both use labour). There is no increase in any other factor to offset this.
- Effect on the PPC: Because the economy can now produce less of both goods, the entire PPC shifts inward (to the left). The new curve lies entirely inside the original PPC0.
- Matching to the diagram: The diagram labels PPC1 as the curve shifted inward from PPC0. PPC2 and PPC3 represent outward shifts, which would result from an increase in resources or an improvement in technology. PPC0 represents no change, which would be incorrect because the labour force has clearly changed.
- Conclusion: The correct option is B, as the PPC shifts from PPC0 to PPC1.
Key Takeaways
- A change in the quantity of a factor of production (such as labour) causes the entire PPC to shift.
- An increase in resources or an improvement in technology shifts the PPC outward (economic growth).
- A decrease in resources or a deterioration in technology shifts the PPC inward.
- When reading a PPC diagram, identify which curve lies inside (inferior capacity) and which lies outside (superior capacity) the original.
Common Mistakes
- Choosing an outward shift (PPC2 or PPC3): Some students confuse emigration with immigration, or incorrectly believe that fewer workers make the economy more efficient. Emigration reduces the resource base, so the shift must be inward.
- Choosing PPC0 (no change): Students may think the PPC only shifts if technology changes, forgetting that changes in the quantity of factors of production also shift the curve.
- Misreading the diagram labels: It is essential to look at the description or the labels carefully. PPC1 is explicitly the inward-shifted curve in this question.
Things to Be Careful About
- Ensure you understand that emigration is a loss of labour, not a gain.
- In this specific diagram, PPC1 is shifted inward on both axes, reflecting that labour is used in the production of both goods X and Y. A loss of a general factor like labour reduces the maximum output of both products.
- Always check the direction of the shift: inward means the curve moves closer to the origin; outward means it moves further away.
A good is provided by the government. Consumption by one person does not affect the amount of the good available for others.
Which type of good must this be?
Options
A complementary good
B merit good
C private good
D public good
Reasoning
A good that is non-rivalrous in consumption (consumption by one person does not reduce the amount available for others) and is provided by the government is a public good. Public goods are also non-excludable, which leads to the free-rider problem and necessitates government provision. Private goods are rival; merit goods are not defined by this characteristic; complementary goods refer to demand relationships. Therefore, the correct answer is D.
Answer
D
D
Background Concept
Public goods are goods that are both non-rivalrous and non-excludable. Non-rivalrous means that one person’s consumption of the good does not reduce the quantity available for others. Non-excludable means that it is impossible or very costly to prevent anyone from consuming the good, even if they do not pay. These two characteristics together create a free-rider problem, where individuals have no incentive to pay for the good, leading to under-provision by the private sector. Therefore, such goods are often provided by the government and funded through taxation. Examples include national defence, street lighting, and public parks.
Understanding the Question
The question provides two pieces of information: (1) the good is provided by the government, and (2) consumption by one person does not affect the amount available for others (non-rivalry). The candidate must identify which type of good must have these features. The options are complementary good, merit good, private good, and public good. The question is purely factual and tests the precise definitions of goods classification.
Approach
The key is to focus on the characteristic of non-rivalry as given. Then consider each option: a complementary good is defined by a demand relationship (used together with another good), not by rivalry. A merit good is a good that is under-consumed because of imperfect information but can be rivalrous. A private good is both rivalrous and excludable. Only a public good is non-rivalrous. The government provision is consistent with public goods but not a defining characteristic; however, it supports the identification. The answer is D.
Step-by-Step Reasoning
- Read the question: “A good is provided by the government. Consumption by one person does not affect the amount of the good available for others.” The second part is the economic definition of non-rivalry.
- Recall the definitions of the four types:
- Complementary good: a good that is used together with another good; its demand is linked to the other good. Not defined by rivalry.
- Merit good: a good that is under-consumed because consumers underestimate its private benefits. It can be rivalrous (e.g., education, health care). No requirement of non-rivalry.
- Private good: rivalrous and excludable. If one person consumes it, less is available for others exactly opposite of the description.
- Public good: non-rivalrous and non-excludable. The description matches non-rivalry exactly. Government provision is typical because private markets fail to provide it.
- Therefore, the good must be a public good. Option D.
Key Takeaways
- Public goods are defined by non-rivalry and non-excludability.
- Government provision is a common policy response to the free-rider problem but is not part of the definition.
- This question tests the ability to match defining characteristics to the correct term.
Common Mistakes
- Confusing merit goods with public goods: merit goods are under-consumed due to information failure, not necessarily non-rivalrous.
- Thinking that government provision alone makes a good a public good (e.g., government provides education, but education is rivalrous).
- Assuming that complementary goods are provided by government (they are not typically).
Things to Be Careful About
- Read the characteristic carefully: “consumption by one person does not affect the amount available for others” is the textbook description of non-rivalry, which is a necessary condition for a public good.
- Do not overthink: the answer is directly from the definition.
- Remember that public goods can also be provided by private entities in some cases (e.g., satellite radio is excludable and non-rivalrous after excludability is enforced, but that is a club good, not a pure public good). The question is asking for the type that “must” fit the description; only public goods are necessarily non-rivalrous.
Market demand curves normally slope downwards. They may also shift from D1 to either D2 or D3.
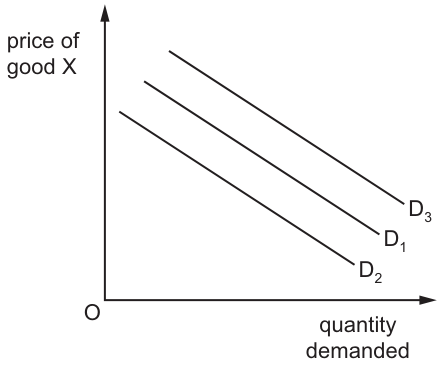
What would cause a movement along D1 for good X and not a shift to either D2 or D3?
Options
A advertising of good X increases sales
B consumer incomes rise
C the price of good X falls
D the prices of other goods fall
Reasoning
A movement along a demand curve is caused only by a change in the price of the good itself, while a shift of the demand curve is caused by changes in non-price determinants of demand (such as income, advertising, or prices of other goods).
- Option A (advertising) is a non-price determinant, so it would shift demand, not cause a movement along D1.
- Option B (rise in consumer incomes) is a non-price determinant, so it would shift demand.
- Option C (fall in the price of good X) is a change in the good's own price, so it causes a movement along D1.
- Option D (fall in prices of other goods) is a non-price determinant, so it would shift demand.
Answer
C
C
Background Concept
A demand curve shows the relationship between the price of a good and the quantity of that good consumers are willing and able to buy, ceteris paribus (all other factors held constant). There are two distinct changes that can occur on a demand graph:
- A movement along the demand curve: This is a change in the quantity demanded, caused only by a change in the price of the good itself. For a standard downward-sloping demand curve, a fall in price leads to a movement down along the curve to a higher quantity demanded, while a rise in price leads to a movement up along the curve to a lower quantity demanded.
- A shift of the demand curve: This is a change in demand, meaning that at every given price, consumers are willing to buy a different quantity. A rightward shift (from D1 to D3 in the diagram) means demand has increased (higher quantity demanded at every price), while a leftward shift (from D1 to D2) means demand has decreased (lower quantity demanded at every price). Shifts are caused by changes in non-price determinants of demand, including consumer incomes, prices of related goods (substitutes and complements), consumer tastes and preferences, advertising, population size, and expectations about future prices or income.
Understanding the Question
The question provides a diagram (Fig. 7.1) showing three parallel downward-sloping demand curves for good X: D1 (the original demand curve), D2 (a leftward shift, representing a decrease in demand), and D3 (a rightward shift, representing an increase in demand). It asks which option would cause a movement along D1 rather than a shift to D2 or D3. This means we need to identify the option that changes only the price of good X itself, rather than any other factor that affects demand. The question is a 1-mark multiple-choice question testing the fundamental distinction between movements along and shifts of demand curves, a core concept in the Demand and Supply topic.
Approach
To answer this, first recall the rule: only a change in the price of the good itself causes a movement along the demand curve; all other changes to factors that affect demand cause a shift of the entire curve. Then evaluate each option against this rule:
- If the option is a change in the price of good X, it will cause a movement along D1 (correct answer).
- If the option is a change in any other factor (non-price determinant), it will cause a shift to either D2 or D3 (incorrect answer).
Step-by-Step Reasoning
Let us assess each option in turn:
- Option A: Advertising of good X increases sales
Advertising is a non-price determinant of demand, as it changes consumer tastes and preferences in favour of good X. This would increase demand for X at every price level, shifting the entire demand curve rightward from D1 to D3. This is a shift, not a movement along D1, so A is incorrect. - Option B: Consumer incomes rise
Consumer income is a non-price determinant of demand. For a normal good, a rise in income would increase demand, shifting the curve right to D3. For an inferior good, a rise in income would decrease demand, shifting the curve left to D2. In either case, this is a shift of the entire curve, not a movement along D1, so B is incorrect. - Option C: The price of good X falls
The price of the good itself is the only factor that causes a movement along the demand curve. A fall in the price of X leads to a change in the quantity demanded of X, which is shown as a movement down along the existing D1 curve to a higher quantity demanded. No shift occurs, as all other determinants are held constant (ceteris paribus). This matches the question's requirement, so C is correct. - Option D: The prices of other goods fall
The prices of related goods (substitutes and complements) are non-price determinants of demand. If the other goods are substitutes for X, a fall in their price would make them more attractive relative to X, decreasing demand for X and shifting the curve left to D2. If the other goods are complements to X, a fall in their price would make the total cost of consuming X lower, increasing demand for X and shifting the curve right to D3. Either way, this is a shift, not a movement along D1, so D is incorrect.
Key Takeaways
The core distinction tested here is between a change in quantity demanded (movement along the demand curve, caused only by a change in the good's own price) and a change in demand (shift of the demand curve, caused by changes in any non-price determinant). This distinction is essential for all subsequent demand and supply analysis, including analysis of equilibrium changes, consumer surplus, and the impact of government policies.
Common Mistakes
A very common error is confusing the two concepts: students often incorrectly identify changes in non-price factors (such as advertising or income) as causing a movement along the curve, rather than a shift. Another mistake is assuming that any change that leads to higher sales (like advertising) is a movement along, when in fact it increases demand at every price, shifting the curve. For 1-mark MCQs, rushing to pick an option that seems related to demand without checking if it is a price or non-price factor is a frequent source of error.
Things to Be Careful About
Always check whether the change in the option is to the price of the good in question (good X) or to any other variable. Only a change in the price of good X will cause a movement along D1; all other changes will shift the curve to D2 or D3. Also, remember that the diagram shows D2 as a left shift (decrease in demand) and D3 as a right shift (increase in demand), so any non-price change will move the curve to one of these two positions, not along D1.
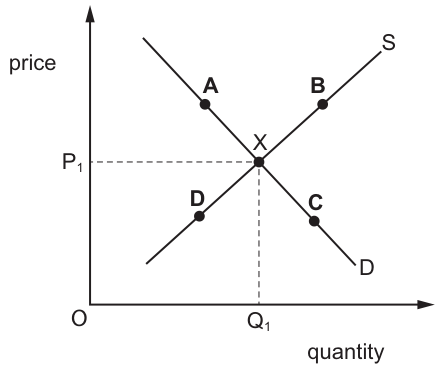
The diagram shows the demand curve and supply curve for broken rice that is considered to be an inferior good. The market is in equilibrium at point X with a price of P1 and quantity of Q1.
Which point is the new equilibrium if household incomes rise?
Options
A point A on Fig. 8.1
B point B on Fig. 8.1
C point C on Fig. 8.1
D point D on Fig. 8.1
Broken rice is an inferior good, so a rise in household incomes reduces demand for it, shifting the demand curve to the left. With the supply curve unchanged, the new equilibrium occurs at a lower price and lower quantity than the original equilibrium at point X. Point D is the only point on the supply curve that reflects a lower price and lower quantity than X, so it is the new equilibrium.
Answer
D
D
Background Concept
An inferior good is a product for which demand falls as consumer income rises, meaning it has a negative income elasticity of demand (YED < 0). This contrasts with normal goods, for which demand rises as income rises. In the demand and supply model, market equilibrium is the point where the demand curve (D, downward-sloping, showing the inverse relationship between price and quantity demanded) intersects the supply curve (S, upward-sloping, showing the positive relationship between price and quantity supplied). At this equilibrium, the quantity demanded equals the quantity supplied, determining the market price and quantity.
Changes in non-price determinants of demand (such as consumer income, tastes, or the price of related goods) cause the entire demand curve to shift, rather than a movement along the curve. For an inferior good, a rise in income shifts the demand curve leftward (inward), as consumers switch to higher-quality substitutes they can now afford. When supply remains unchanged, a leftward shift in demand reduces both the equilibrium price and equilibrium quantity, as the new intersection of the shifted demand curve and the original supply curve occurs at a lower point on the supply curve.
Understanding the Question
The question provides a demand and supply diagram for broken rice, which is explicitly identified as an inferior good. The vertical axis measures price, the horizontal axis measures quantity. The upward-sloping supply curve (S) and downward-sloping demand curve (D) intersect at the initial equilibrium point X, corresponding to price P1 and quantity Q1. Four additional points are marked on the diagram: points A and B lie on the supply curve S (A is above X, corresponding to a higher price and higher quantity than X; B is further above X, with an even higher price and higher quantity). Point D lies on the supply curve S to the left of X, corresponding to a lower price and lower quantity than X. Point C lies on the demand curve D to the right of X, corresponding to a lower price and higher quantity than X.
The question asks which point represents the new market equilibrium after household incomes rise. This tests two core skills: first, recalling how income changes affect demand for inferior goods, and second, applying the demand and supply model to predict the new equilibrium after a demand shift. The key is to avoid confusing a shift of the demand curve (caused by income change) with a movement along the curve (caused by a change in the good's own price), and to remember that the new equilibrium must lie on the unchanged supply curve.
Approach
To solve this question, follow three steps:
- Recall the definition of an inferior good and the direction of the demand shift when income rises.
- Use the demand and supply model to predict the change in equilibrium price and quantity after the demand shift, assuming supply is unchanged.
- Match this predicted change to the correct point on the provided diagram, ensuring the point lies on the original supply curve and reflects the expected change in price and quantity.
Step-by-Step Reasoning
- Classify the good and predict the demand shift: Broken rice is given as an inferior good. By definition, a rise in consumer income reduces the demand for inferior goods at every price level, as consumers substitute them for normal goods. This is a change in a non-price determinant of demand, so it causes the entire demand curve to shift leftward (inward), from the original D to a new demand curve positioned to the left of D. This is not a movement along the demand curve, which would only occur if the price of broken rice itself changed.
- Predict the new equilibrium: The question does not mention any changes to supply conditions (such as input costs, technology, or the number of sellers), so the supply curve remains unchanged at S. The new equilibrium is the intersection of the new leftward-shifted demand curve and the original supply curve S. Because the supply curve is upward-sloping, a lower quantity transacted corresponds to a lower equilibrium price. Therefore, the new equilibrium will have a price lower than P1 and a quantity lower than Q1.
- Match to the diagram: Evaluate each marked point against the predicted outcome:
- Points A and B are on the supply curve S, but both correspond to higher prices and higher quantities than X (they are positioned to the right of X on S). These would be the new equilibrium if demand had shifted rightward (e.g., if incomes had fallen, or if broken rice were a normal good and incomes rose), so they are incorrect.
- Point C is on the original demand curve D, to the right of X. It corresponds to a lower price and higher quantity than X, which would result from a rightward shift in supply, not a demand shift. It also does not lie on the supply curve, so it cannot be an equilibrium point, so it is incorrect.
- Point D is on the supply curve S, to the left of X. It corresponds to a lower price and lower quantity than X, exactly matching the predicted outcome of a leftward demand shift. Even though the new demand curve is not drawn on the diagram, point D is the only point on the original supply curve that fits the expected change, so it is the new equilibrium.
- Conclusion: The correct answer is point D.
Key Takeaways
- The distinction between a shift of a curve (caused by non-price determinants like income) and a movement along a curve (caused by a change in the good's own price) is fundamental to demand and supply analysis. Misidentifying this distinction is a common source of error.
- The income elasticity of demand determines how demand responds to income changes: inferior goods have negative YED, so demand falls when income rises; normal goods have positive YED, so demand rises when income rises.
- A shift in demand changes both equilibrium price and quantity when supply is upward-sloping: a leftward demand shift lowers both, while a rightward shift raises both.
- When identifying a new equilibrium after a curve shift, the new point must lie on the unchanged curve (here, the supply curve) and match the predicted direction of change in price and quantity.
Common Mistakes
- Confusing shifts and movements: Some students incorrectly treat a change in income as causing a movement along the demand curve, rather than a shift. This would lead them to select point D or C as a movement along D, but these are not the correct outcome for an income change.
- Reversing the inferior good effect: A common error is to assume demand for inferior goods rises with income, which would lead to selecting point A or B (the outcome for a normal good or an inferior good with falling income).
- Forgetting supply is unchanged: The new equilibrium must be the intersection of the new demand curve and the original supply curve, so it must lie on S. Point C lies on the demand curve, so it cannot be an equilibrium, as equilibrium requires both curves to intersect at that point.
- Misreading the diagram: Misidentifying which points lie on which curve, or misreading the direction of the shift, can lead to selecting the wrong point. For example, confusing point D (on S) with a point on D would lead to incorrect reasoning.
Things to Be Careful About
- Always confirm which curve is shifting: income is a determinant of demand, so only the demand curve shifts; supply remains constant, so the new equilibrium must lie on the original S curve.
- Always check the direction of the shift for the type of good: inferior goods have an inverse relationship between income and demand, so a rise in income shifts D left.
- Match the predicted change in price and quantity to the diagram: a leftward demand shift with upward-sloping supply always lowers both equilibrium price and quantity, so look for the point on S with lower P and Q than the original equilibrium X.
- Note that the new demand curve is not drawn on the diagram, so you must infer the new equilibrium as the point on the unchanged supply curve that matches the predicted outcome, rather than looking for a point on the original demand curve.
Good X has an income elasticity of demand (YED) value of -0.8. Its cross elasticity of demand (XED) with respect to good Y is also -0.8.
What are the characteristics of good X?
Options
A a normal good that is a complement to good Y
B a normal good that is a substitute for good Y
C an inferior good that is a complement to good Y
D an inferior good that is a substitute for good Y
Working
Income elasticity of demand (YED) = -0.8. A negative YED indicates that good X is an inferior good: as income rises, demand for good X falls.
Cross elasticity of demand (XED) with respect to good Y = -0.8. A negative XED indicates that good X and good Y are complements: as the price of good Y rises, demand for good X falls.
Therefore, good X is an inferior good and a complement to good Y.
Answer
C
C
Background Concept
Income elasticity of demand (YED) measures the responsiveness of the quantity demanded of a good to a change in consumers' income. It is calculated as: % change in quantity demanded / % change in income. The sign of YED tells us whether the good is normal (positive YED) or inferior (negative YED).
Cross elasticity of demand (XED) measures the responsiveness of the quantity demanded of one good to a change in the price of another good. It is calculated as: % change in quantity demanded of good X / % change in price of good Y. The sign of XED tells us whether the two goods are substitutes (positive XED) or complements (negative XED).
Understanding the Question
We are given two elasticity values for good X: YED = -0.8 and XED (with respect to good Y) = -0.8. We need to determine whether good X is a normal or inferior good, and whether it is a substitute for or a complement to good Y. The options combine these two characteristics.
Approach
First, use the YED sign to classify the good as normal or inferior. Second, use the XED sign to classify the relationship between good X and good Y. Combine the two results to identify the correct option.
Step-by-Step Reasoning
-
Interpret YED = -0.8: A negative YED means that as income rises, the quantity demanded of good X falls. This is the definition of an inferior good. Therefore, good X is an inferior good.
-
Interpret XED = -0.8: A negative XED means that as the price of good Y rises, the quantity demanded of good X falls. This indicates that the two goods are complements: they are consumed together. If the price of Y goes up, consumers buy less of Y and therefore also less of X. Hence, good X is a complement to good Y.
-
Combine: Good X is an inferior good and a complement to good Y. This matches option C.
Key Takeaways
- YED negative = inferior good; YED positive = normal good.
- XED negative = complements; XED positive = substitutes.
- The magnitude of the elasticity (the absolute value) indicates the strength of the relationship, but the sign is the key to classification.
Common Mistakes
- Confusing the sign rules: thinking negative YED means normal good, or negative XED means substitutes. This would lead to choosing option B or D.
- Mixing up the definitions: e.g., thinking that a negative XED means the goods are substitutes (which is the opposite).
- Overcomplicating: the magnitude (-0.8) is irrelevant for classification; only the sign matters.
Things to Be Careful About
- Always check the sign: negative YED = inferior, positive = normal; negative XED = complements, positive = substitutes.
- Remember that zero elasticity means no relationship; for YED, zero would mean the good is a necessity with no income effect; for XED, zero means independent goods.
- In this question, both elasticities are negative, so the answer is straightforward; but be careful not to misread the signs.
Four firms produce furniture. The table shows the price elasticity of supply (PES) for each firm.
If the price of furniture rises by 5% which firm would experience an increase in quantity supplied of 2.5%?
Options
| firm | PES for furniture |
|---|---|
| A | 2.5 |
| B | 2.0 |
| C | 0.6 |
| D | 0.5 |
Working
PES = % change in quantity supplied / % change in price
Rearranging: % change in quantity supplied = PES * % change in price
For each firm: %ΔQs = PES * 5%
Firm A: 2.5 * 5% = 12.5%
Firm B: 2.0 * 5% = 10%
Firm C: 0.6 * 5% = 3%
Firm D: 0.5 * 5% = 2.5%
Only firm D shows an increase of 2.5%.
Answer
D
D
Background Concept
Price elasticity of supply (PES) measures the responsiveness of quantity supplied to a change in price. It is calculated as:
PES = (% change in quantity supplied) / (% change in price)
A PES value greater than 1 indicates elastic supply (quantity supplied changes more than proportionally), less than 1 indicates inelastic supply, and 0 indicates perfectly inelastic supply. The sign is always positive because price and quantity supplied move in the same direction.
Understanding the Question
The question provides four firms, each with a given PES coefficient for furniture. The price of furniture rises by 5%. We are asked which firm would experience an increase in quantity supplied of exactly 2.5%. This requires using the PES formula to find the percentage change in quantity supplied for each firm and comparing it to the target 2.5%.
Approach
We use the formula: % change in quantity supplied = PES * % change in price. For each firm, multiply the given PES by 5% to obtain the percentage change in quantity supplied. Then identify the firm for which the result equals 2.5%.
Step-by-Step Reasoning
- Write the formula: PES = %ΔQs / %ΔP.
- Rearrange to solve for %ΔQs: %ΔQs = PES * %ΔP.
- Substitute the given %ΔP = 5%.
- For firm A: PES = 2.5 → %ΔQs = 2.5 * 5% = 12.5%.
- For firm B: PES = 2.0 → %ΔQs = 2.0 * 5% = 10%.
- For firm C: PES = 0.6 → %ΔQs = 0.6 * 5% = 3%.
- For firm D: PES = 0.5 → %ΔQs = 0.5 * 5% = 2.5%.
- Only firm D yields a 2.5% increase in quantity supplied, so the correct answer is D.
Key Takeaways
- The PES formula allows calculation of the effect of a price change on quantity supplied.
- A lower PES indicates a smaller change in quantity supplied for a given price change.
- This question demonstrates the direct relationship between PES and the percentage change in quantity supplied.
Common Mistakes
- Confusing the numerator and denominator: some students might incorrectly use %ΔP / %ΔQs. Always ensure the formula is correctly applied.
- Forgetting to multiply by the percentage change: simply comparing PES values without calculation is insufficient.
- Misinterpreting the sign: PES is always positive, so a price rise leads to a rise in quantity supplied.
Things to Be Careful About
- The percentage change in price is given as a percentage (5%), so the resulting %ΔQs is also a percentage. No need to convert to decimals.
- Ensure the calculation is correct for each firm before selecting the answer.
- The question asks for an increase of 2.5%, so the answer is the firm with that exact result.
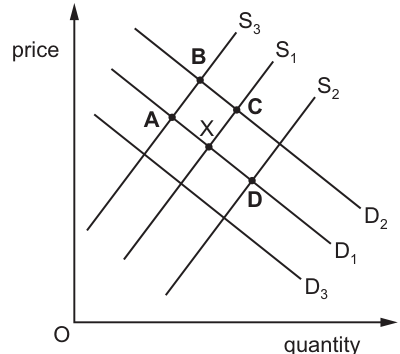
The diagram shows supply and demand for a good. The original equilibrium is X.
What will be the new equilibrium if subsidies are given to firms for new machinery?
Options
A point A on Fig. 11.1
B point B on Fig. 11.1
C point C on Fig. 11.1
D point D on Fig. 11.1
A subsidy to firms lowers production costs, which increases supply and shifts the supply curve to the right. Demand is unaffected because the subsidy is paid to producers, not consumers. The original equilibrium X is at the intersection of S1 and D1. The new supply curve is S2, and its intersection with the unchanged demand curve D1 is at point D.
Answer
D
D
Background Concept
A subsidy is a payment made by the government to firms to encourage production or consumption of a good. When firms receive a subsidy for new machinery, their costs of production fall. In supply and demand analysis, a reduction in production costs causes the supply curve to shift to the right (or downwards), indicating that firms are willing and able to supply more of the good at every price level. The demand curve remains unchanged because the subsidy is paid to producers, not consumers, and does not directly affect consumers' willingness or ability to buy the good. The new market equilibrium is found at the intersection of the new supply curve and the original demand curve.
Understanding the Question
The question presents a supply and demand diagram with the original equilibrium at point X (the intersection of supply curve S1 and demand curve D1). It asks what happens to the equilibrium when the government gives subsidies to firms for new machinery. This is a straightforward application of supply-side intervention: the candidate must identify which curve shifts, in which direction, and then locate the correct new intersection point among the four labelled options (A, B, C, D).
Approach
The key steps are:
- Identify which curve is affected: a subsidy to firms affects supply, not demand.
- Determine the direction of the shift: lower costs mean an increase in supply, so the supply curve shifts rightwards (from S1 toward S2).
- Keep the other curve unchanged: demand stays on D1.
- Find the intersection of the new supply curve (S2) and the original demand curve (D1), which is point D.
Step-by-Step Reasoning
First, recognise that a subsidy to firms reduces their marginal cost of production. This makes production more profitable at any given price, so firms expand output. In the diagram, this is shown by a rightward shift of the supply curve from S1 to S2. S3 would represent a leftward shift (decrease in supply), which would be caused by something like an increase in production costs or a tax on firms, not a subsidy.
Second, confirm that demand is unaffected. The subsidy is paid to firms for machinery, not to consumers for purchasing the good. Therefore, the demand curve does not shift; it remains at D1. Points A and B involve shifts to D3 or S3, which are incorrect because they imply either a decrease in demand or a decrease in supply. Point C involves a shift to D2, which would be an increase in demand, also incorrect.
Third, locate the new equilibrium. With supply increased to S2 and demand unchanged at D1, the new intersection is at point D. At this point, the equilibrium price is lower and the equilibrium quantity is higher than at X, which is the standard outcome of an increase in supply.
Key Takeaways
- A subsidy to producers is a supply-side policy that shifts the supply curve to the right (increase in supply).
- The demand curve does not shift when the subsidy is paid to producers.
- The new equilibrium is found at the intersection of the new supply curve and the original demand curve.
- In this diagram, S2 represents increased supply relative to S1, and the intersection of S2 with D1 is point D.
Common Mistakes
- Confusing a subsidy with a change in demand: some students incorrectly shift the demand curve because they associate government intervention with consumer behaviour. The subsidy here is to firms, so only supply shifts.
- Choosing the wrong supply curve: S3 represents a decrease in supply (shift left/up), which would be caused by a tax or higher input costs, not a subsidy.
- Choosing point C: this would require demand to increase (shift to D2), which is not what a producer subsidy does.
- Choosing point A or B: these involve S3, which is a leftward shift, or both curves shifting, neither of which is correct.
Things to Be Careful About
- Always identify who receives the subsidy: if it is paid to producers, supply shifts; if paid to consumers, demand shifts.
- Check the direction of the shift: a subsidy lowers costs and increases supply, shifting the curve rightwards (or downwards). In this diagram, S2 is to the right of S1, representing the increase in supply.
- Ensure you match the correct demand curve: unless the question states that consumer behaviour changes, assume demand stays on the original curve D1.
The market for good X is in equilibrium when its price is $10. The government decides to set a maximum price for good X.
Which maximum price will cause the largest change in consumer surplus?
Options
| maximum price for good X ($) | |
|---|---|
| A | 9 |
| B | 10 |
| C | 11 |
| D | 12 |
A maximum price is only effective (binding) when set below the equilibrium price. At $10, the price is at equilibrium, so no change. At $11 and $12, the maximum price is above equilibrium, so the market price remains at $10, no change. At $9, the maximum price is below equilibrium, creating a shortage and altering consumer surplus. Therefore, the largest change in consumer surplus occurs at $9.
Answer
A
A
Background Concept
A maximum price (price ceiling) is a legal maximum on the price of a good or service. It is effective only when set below the equilibrium price, as in that case it prevents the market from reaching equilibrium. Consumer surplus is the difference between the total amount consumers are willing to pay for a good and the total amount they actually pay. It is the area under the demand curve and above the price.
When a binding price ceiling is imposed, the price falls, increasing the consumer surplus for those who can purchase the good at the lower price. However, the lower price reduces the quantity supplied, creating a shortage. Some consumers who would have bought at the equilibrium price are now unable to buy, losing their consumer surplus. The net change in consumer surplus depends on the elasticities of demand and supply.
Understanding the Question
The question states that the market for good X is in equilibrium at a price of $10. The government then sets a maximum price (a price ceiling). The candidate must choose which of the four given maximum prices ($9, $10, $11, $12) will cause the largest change in consumer surplus. The key is to recognise that a maximum price only affects the market if it is below the equilibrium price; otherwise, it is non-binding and the market operates as if there were no intervention.
Approach
First, determine which of the maximum prices are binding (i.e., below $10). Only $9 is below $10. $10 is exactly at equilibrium, so it is not binding (it does not change the price). $11 and $12 are above the equilibrium price, so the market price will remain at $10, and the maximum price is ineffective. Therefore, only the maximum price of $9 will cause any change in the market, and hence any change in consumer surplus. The other options cause no change, so the largest change must be from $9.
Step-by-Step Reasoning
- Option B: Maximum price = $10. This is equal to the equilibrium price. The market price is already $10, so the maximum price does not constrain the market. No change in price or quantity traded, so consumer surplus remains unchanged. Change = 0.
- Option C: Maximum price = $11. This is above the equilibrium price. The market price will stay at $10, because sellers can legally charge up to $11 but market forces keep it at $10. Thus, no effect on consumer surplus. Change = 0.
- Option D: Maximum price = $12. Again, above equilibrium, no effect. Change = 0.
- Option A: Maximum price = $9. This is below the equilibrium price, so it is binding. The market price is forced down to $9. At this lower price, quantity demanded rises, but quantity supplied falls, creating a shortage. Consumer surplus changes: those consumers who can buy the good at $9 now enjoy a larger surplus (they pay $9 instead of $10), but some consumers who would have bought at $10 are now rationed out of the market and lose their surplus. The net change in consumer surplus is not necessarily positive, but it is definitely non-zero. Since the other options yield zero change, the maximum price of $9 causes the largest change (in absolute terms).
Therefore, the correct answer is A ($9).
Key Takeaways
- A price ceiling is only effective if it is set below the equilibrium price.
- An ineffective price ceiling (set at or above equilibrium) does not alter the market outcome.
- The change in consumer surplus from a binding price ceiling can be positive or negative, but any change is larger than no change.
- When comparing options, the only binding price ceiling will cause the largest change.
Common Mistakes
- Assuming that a maximum price set above equilibrium will lower the price, when in fact it has no effect.
- Confusing maximum price (price ceiling) with minimum price (price floor).
- Thinking that the highest maximum price will cause the largest change, because it seems more restrictive, but it is not binding.
- Neglecting to check whether the maximum price is below the equilibrium price.
Things to Be Careful About
- Always compare the government-set price to the equilibrium price to determine if it is binding.
- Remember that a maximum price at equilibrium is not binding; it does not change the market price.
- In multiple-choice questions, be systematic: evaluate each option against the condition of effectiveness.
Assuming demand is price elastic, what will rise the most if an indirect tax is removed?
Options
A consumer expenditures
B price of the product
C producers’ revenues
D tax receipts
Reasoning
Removing an indirect tax shifts the supply curve downwards. The equilibrium price falls and quantity rises. Since demand is price elastic, the percentage increase in quantity demanded exceeds the percentage fall in price.
- Price (B): Falls.
- Tax receipts (D): Fall to zero.
- Consumer expenditure (A): P x Q. The rise in Q outweighs the fall in P, so expenditure rises.
- Producer revenue (C): P x Q. The price received by producers rises (the tax wedge is removed), and quantity rises. The rise in revenue is larger than the rise in consumer expenditure because the starting price for producers (Pp) was lower than the consumer price (Pc).
Therefore, producers' revenues rise the most.
Answer
C
C
Background Concept
Indirect Tax: A tax on expenditure (e.g., VAT, excise duty). It shifts the supply curve vertically upwards by the amount of the tax. This creates a wedge between the price consumers pay (Pc) and the price producers receive (Pp).
Price Elasticity of Demand (PED): Measures the responsiveness of quantity demanded to a change in price. PED = %ΔQd / %ΔP.
- Elastic demand (PED > 1): %ΔQd > %ΔP.
- Relationship with Total Revenue (TR = P x Q):
- If demand is elastic, a fall in price leads to a proportionally larger rise in quantity demanded, so Total Revenue rises.
- If demand is elastic, a rise in price leads to a proportionally larger fall in quantity demanded, so Total Revenue falls.
Tax Incidence: The division of the tax burden between consumers and producers.
- If demand is elastic, consumers are more responsive to price changes. Producers cannot easily pass the tax onto consumers. The burden falls more heavily on producers. The price consumers pay rises only a little, while the price producers receive falls significantly.
- If demand is inelastic, the burden falls more heavily on consumers.
Understanding the Question
The question presents a scenario: an indirect tax is removed from a good with price elastic demand. We are asked to identify which of four variables (consumer expenditure, price, producer revenue, tax receipts) will experience the "largest increase".
This requires a multi-step analysis:
- Determine the immediate effect of removing the tax (supply shift).
- Determine the new equilibrium (price and quantity).
- Apply the condition of elastic demand to see how quantity changes relative to price.
- Calculate the impact on each of the four variables.
- Compare the magnitudes of the increases.
Approach
Step 1: Model the market. Draw a standard demand and supply diagram. Introduce an indirect tax (shift supply up). Identify Pc, Pp, Q1.
Step 2: Remove the tax. Shift the supply curve back down to its original position. Identify the new equilibrium P*, Q2.
Step 3: Apply elastic demand. Since demand is elastic, the percentage change in quantity demanded (%ΔQ) is greater than the percentage change in price (%ΔP).
Step 4: Evaluate each option.
- B (Price): The price falls from Pc to P*. This is a decrease, not an increase. Eliminated.
- D (Tax receipts): Tax receipts fall from (Pc-Pp)*Q1 to zero. This is a decrease. Eliminated.
- A (Consumer expenditure): Expenditure = P x Q. P falls, Q rises. Since demand is elastic, the rise in Q outweighs the fall in P. Therefore, consumer expenditure rises.
- C (Producer revenue): Revenue = P x Q. The price received by producers rises from Pp to P*. The quantity rises from Q1 to Q2. Therefore, producer revenue rises.
Step 5: Compare A and C.
- Both rise. Which rises more?
- The starting point for consumer expenditure is Pc x Q1.
- The starting point for producer revenue is Pp x Q1.
- Since Pc > Pp (the tax wedge), the starting value for producer revenue is lower.
- The ending value for both is the same: P* x Q2.
- Therefore, the absolute increase in producer revenue (PQ2 - PpQ1) is greater than the absolute increase in consumer expenditure (PQ2 - PcQ1).
- This aligns with the theory of tax incidence: with elastic demand, producers bear a larger share of the tax burden, so they benefit more from its removal.
Step-by-Step Reasoning
-
Initial State: An indirect tax creates a wedge. Supply curve shifts from S to S+tax. Equilibrium quantity is Q1. Consumers pay Pc. Producers receive Pp. Tax revenue = (Pc - Pp) x Q1.
-
Tax Removal: Supply shifts back down to S. New equilibrium quantity is Q2. New equilibrium price is P*.
-
Impact on Variables:
- Price (B): Falls from Pc to P*. (Decreases).
- Tax Receipts (D): Fall from (Pc-Pp)xQ1 to 0. (Decreases).
- Consumer Expenditure (A): Was Pc x Q1. Now P* x Q2. Since demand is elastic, %ΔQd > %ΔP. The fall in price is proportionally smaller than the rise in quantity. Therefore, P* x Q2 > Pc x Q1. Consumer expenditure rises.
- Producer Revenue (C): Was Pp x Q1. Now P* x Q2. The price received by producers rises from Pp to P*. The quantity rises from Q1 to Q2. Since demand is elastic, the rise in quantity is proportionally larger than the fall in consumer price. The rise in producer price is even larger (from Pp to P*). Therefore, producer revenue rises significantly.
-
Comparison: Both consumer expenditure and producer revenue rise. Which rises more?
- Change in Consumer Expenditure = (P* x Q2) - (Pc x Q1).
- Change in Producer Revenue = (P* x Q2) - (Pp x Q1).
- Since Pc > Pp, the starting value for producer revenue is lower. The ending value is the same (P* x Q2). Therefore, the absolute increase in producer revenue is greater than the absolute increase in consumer expenditure.
- Alternatively, the removal of the tax benefits both consumers (lower price) and producers (higher price received). With elastic demand, the burden of the tax falls more on producers (they bear a larger share of the tax). Therefore, when the tax is removed, producers benefit more.
Key Takeaways
- The relationship between PED and Total Revenue is crucial for understanding the impact of price changes on expenditure and revenue.
- Tax incidence is determined by the elasticities of demand and supply. The side with the more inelastic curve bears a larger share of the tax.
- Removing a tax is the mirror image of imposing a subsidy. The analysis is symmetric.
- When comparing changes in economic variables, always consider the starting point (the initial equilibrium) and the ending point (the new equilibrium).
Common Mistakes
- Mistake 1: Thinking a fall in price always reduces revenue. This ignores the PED/TR relationship. If demand is elastic, a fall in price increases total revenue.
- Mistake 2: Not distinguishing between consumer expenditure and producer revenue. The tax wedge means the price paid by consumers (Pc) is higher than the price received by producers (Pp). Failing to account for this wedge leads to incorrect conclusions.
- Mistake 3: Only identifying that consumer expenditure and producer revenue both rise, without comparing which rises more. The question specifically asks for the variable that rises the most.
- Mistake 4: Confusing the removal of a tax with the imposition of a tax. When a tax is removed, the supply curve shifts down, the price falls, and the quantity rises. This is the opposite of what happens when a tax is imposed.
Things to Be Careful About
- The question asks for what rises the most. A simple identification that both A and C rise is insufficient; a comparison of magnitudes is required.
- The condition "demand is price elastic" is the key piece of information that drives the result. Without this condition, the analysis would be different.
- Remember that the price received by producers rises when a tax is removed, while the price paid by consumers falls. This is the opposite of what happens when a tax is imposed.
- Ensure you are comparing the correct variables. Consumer expenditure is the total amount spent by consumers (Pc x Q). Producer revenue is the total amount received by producers (Pp x Q).
Which area of government spending is a transfer payment?
Options
A spending on new road building
B spending on pensions to the elderly
C spending on buying new police cars
D spending on wages of teachers
Answer
A transfer payment is a government payment made to individuals for which no good or service is provided in return. Pensions to the elderly are a transfer payment because they are a redistribution of income without any current productive activity. The other options involve the government purchasing goods (new road building, buying police cars) or paying for labour services (wages of teachers), which are not transfer payments.
B
Background Concept
Government spending can be classified into two broad categories: exhaustive expenditure and transfer payments. Exhaustive expenditure involves the government purchasing goods and services, such as building roads, buying police cars, or paying wages to teachers. These payments are for factors of production or products and are included in GDP. Transfer payments, in contrast, are payments made by the government to individuals or groups for which no current good or service is provided in return. Examples include pensions, unemployment benefits, and welfare payments. Transfer payments are a form of income redistribution and are not included in GDP because they do not represent value added from production.
Understanding the Question
The question asks: 'Which area of government spending is a transfer payment?' It presents four options: A (new road building), B (pensions to the elderly), C (buying new police cars), and D (wages of teachers). The task is to identify the one that fits the definition of a transfer payment.
Approach
Apply the definition of a transfer payment: a payment made by the government without receiving a good or service in return. Evaluate each option by asking: Does the government receive a good or service for this payment? If yes, it is not a transfer payment. If no, it is a transfer payment.
Step-by-Step Reasoning
-
Option A: spending on new road building – The government is paying a construction company to build a road. In return, the government receives a capital good (the road). This is exhaustive expenditure, not a transfer payment.
-
Option B: spending on pensions to the elderly – The government makes payments to elderly individuals who have contributed to the pension system. The recipients do not provide any current service in exchange for the payment. This is a transfer payment.
-
Option C: spending on buying new police cars – The government is purchasing goods (vehicles) from a manufacturer. It receives a good in return, so this is exhaustive expenditure.
-
Option D: spending on wages of teachers – The government is paying teachers for their labour services. Teachers provide a service (education), so this is a payment for factor services, not a transfer payment.
Therefore, only option B qualifies as a transfer payment.
Key Takeaways
- Transfer payments are a form of government spending that involves redistribution of income without a corresponding exchange of goods or services.
- They are not counted in GDP because they are not part of current production.
- Common examples include pensions, social security benefits, and unemployment benefits.
- Distinguishing transfer payments from purchases of goods and services is an important skill in analysing fiscal policy.
Common Mistakes
- Confusing transfer payments with subsidies. Subsidies are payments to producers to reduce costs, usually tied to production, so they are not transfer payments.
- Thinking that all government spending on individuals is a transfer payment. Wages paid to government employees are a factor payment, not a transfer, because the employee provides a service.
- Assuming that transfer payments are always made to individuals; they can also be made to other levels of government or organisations, but the key is the absence of a current good or service.
Things to Be Careful About
- Transfer payments are part of government expenditure but are excluded from GDP calculations. Do not confuse them with government consumption or investment.
- In fiscal policy analysis, transfer payments affect disposable income and aggregate demand indirectly, but they do not directly represent government demand for goods and services.
- The question only asks for identification, but in a broader context, understanding the distinction helps evaluate the impact of fiscal policy on the economy.
A government provides a subsidy for a product with a perfectly price inelastic demand.
What prevents producers from benefiting from this subsidy?
Options
A The subsidy causes a large reduction in the price of the product, as its price elasticity of demand is infinite.
B The subsidy causes a large reduction in the price of the product, as its price elasticity of demand is zero.
C The subsidy causes a small reduction in the price of the product, as its price elasticity of demand is relatively elastic.
D The subsidy causes a small reduction in the price of the product, as its price elasticity of demand is relatively inelastic.
Reasoning
Since demand is perfectly inelastic (PED = 0), the demand curve is vertical. A subsidy shifts the supply curve downwards. The new equilibrium price falls by the full amount of the subsidy. Therefore, the price reduction is large, benefiting consumers entirely, and producers gain nothing.
Answer
B
B
Background Concept
When a subsidy is granted to a producer, it shifts the supply curve to the right (or downwards) by the amount of the subsidy per unit. The incidence of the subsidy—how the benefit is split between consumers and producers—depends on the price elasticities of demand and supply. With perfectly inelastic demand (PED = 0), the demand curve is vertical, meaning consumers' quantity demanded does not change with price. In this case, the entire subsidy passes through to consumers in the form of a lower price, so producers do not benefit at all.
Understanding the Question
The question asks: 'What prevents producers from benefiting from this subsidy?' The given condition is that the product has perfectly price inelastic demand. The four options link the size of the price reduction to the elasticity of demand. The correct answer must identify that a large reduction in price occurs because demand is perfectly inelastic (zero elasticity), and that this large reduction prevents producers from capturing the subsidy.
Approach
Recall the standard incidence analysis: for a vertical demand curve (PED = 0), the full subsidy shifts the equilibrium price down by exactly the subsidy amount. The quantity traded remains unchanged. Producers receive the same price as before (since the price they effectively get is the market price plus the subsidy? Wait, careful: The subsidy is given to producers, so they receive the market price plus the subsidy. But if the market price falls by the full subsidy, the producer's effective price (market price + subsidy) is unchanged. So producers do not benefit. The answer is B, which states: 'The subsidy causes a large reduction in the price of the product, as its price elasticity of demand is zero.'
Step-by-Step Reasoning
- A subsidy reduces the cost of production, shifting the supply curve downward (or to the right) by the amount of the subsidy per unit.
- With a vertical demand curve (perfectly inelastic), the quantity demanded is fixed regardless of price.
- The new equilibrium occurs where the shifted supply curve intersects the vertical demand curve. The price falls by exactly the subsidy amount, while quantity remains unchanged.
- The reduction in price is large (equal to the full subsidy). Consumers pay a lower price, so they gain the entire benefit of the subsidy.
- Producers receive the new lower market price plus the subsidy, which equals the original market price. Hence, their revenue per unit (and total revenue, since quantity is unchanged) is the same as before. They do not benefit.
- Option A incorrectly says PED is infinite (perfectly elastic), which would imply a different outcome. Options C and D describe small price reductions, which are not the case for perfectly inelastic demand.
Key Takeaways
- The incidence of a subsidy (or tax) depends on the relative elasticities of demand and supply.
- With perfectly inelastic demand, consumers capture the entire benefit of a subsidy (or bear the entire burden of a tax).
- The size of the price change is determined by the elasticity: the more inelastic the demand, the larger the price reduction from a subsidy.
Common Mistakes
- Confusing perfectly inelastic with perfectly elastic demand: For perfectly elastic demand, a subsidy would not change price at all (producers keep the full subsidy).
- Thinking that the subsidy always benefits producers: Incidence depends on elasticities, not just on who receives the subsidy payment.
- Misinterpreting 'large reduction' vs 'small reduction': With inelastic demand, the price change is larger (more of the subsidy passes through to consumers).
Things to Be Careful About
- Remember that 'perfectly inelastic' means PED = 0, and the demand curve is vertical. The price change is maximal (full subsidy amount).
- The question asks 'what prevents producers from benefiting' – the answer is the large reduction in price caused by the inelastic demand.
- Ensure you distinguish between the market price and the effective price received by producers (market price + subsidy). In this case, the effective price is unchanged, so producers gain nothing.
A government intervenes in the market for good X. It fixes a minimum price above the market equilibrium.
Which situation explains why the government would do this?
Options
| good X | reason for intervention | |
|---|---|---|
| A | demerit good | to decrease consumption |
| B | demerit good | to increase consumption |
| C | merit good | to decrease consumption |
| D | merit good | to increase consumption |
Reasoning
A minimum price set above the market equilibrium leads to a surplus: quantity supplied exceeds quantity demanded at that price. Consumers reduce quantity demanded, so consumption falls. Therefore, the government would use a minimum price to decrease consumption of a good. Demerit goods are over-consumed due to imperfect information, so the government aims to reduce consumption. Merit goods are under-consumed, so the government would aim to increase consumption, not decrease. Thus, the correct answer is A: demerit good, to decrease consumption.
Answer
A
A
Background Concept
A minimum price (price floor) is a government-set price above the market equilibrium. It is used to influence the quantity consumed of a good. For demerit goods, such as alcohol or cigarettes, there is over-consumption because consumers have imperfect information about the negative consequences. The government intervenes to reduce consumption. A minimum price raises the price, which reduces quantity demanded along the demand curve (assuming normal demand elasticity).
Understanding the Question
The question presents a scenario: the government fixes a minimum price above equilibrium for good X. It asks which situation (type of good and reason for intervention) explains this action. The options pair 'demerit good' or 'merit good' with 'to decrease consumption' or 'to increase consumption'. The correct answer must be consistent with the effect of a minimum price: it reduces consumption. Therefore, the government must want to decrease consumption, which applies to a demerit good (over-consumed) and not a merit good (under-consumed).
Approach
First, recall the effect of a minimum price above equilibrium: it creates a surplus; quantity demanded falls, quantity supplied rises. So consumption (quantity demanded) decreases. This matches 'to decrease consumption'. Second, identify which type of good is associated with over-consumption: demerit goods. Merit goods are under-consumed. Therefore, the government would intervene to decrease consumption of a demerit good. The question does not require a diagram; the reasoning is purely conceptual.
Step-by-Step Reasoning
- A minimum price is set above the equilibrium price. At this higher price, consumers are willing to buy less than at equilibrium. The quantity demanded falls, so consumption decreases.
- A demerit good is one where negative externalities exist or consumers underestimate the harm, leading to over-consumption from society's perspective. Government intervention aims to reduce consumption.
- A merit good is one where positive externalities exist or consumers underestimate the benefits, leading to under-consumption. Government intervention aims to increase consumption.
- Therefore, a minimum price (which decreases consumption) is appropriate for a demerit good, not a merit good. The reason for intervention is to decrease consumption.
- Thus, option A is correct: demerit good, to decrease consumption. Options B, C, and D are inconsistent: B suggests increasing consumption of a demerit good (wrong), C suggests decreasing consumption of a merit good (wrong), D suggests increasing consumption of a merit good (but minimum price does not increase consumption).
Key Takeaways
- A minimum price above equilibrium reduces quantity demanded and thus consumption.
- Demerit goods are over-consumed; merit goods are under-consumed.
- Government intervention type must match the objective: minimum price to reduce consumption, subsidy or maximum price to increase consumption.
Common Mistakes
- Confusing the effect of a minimum price: some might think it increases consumption because producers supply more, but consumption is determined by demand, not supply.
- Mixing up demerit and merit goods: remembering that demerit goods are over-consumed (bad for you) and merit goods are under-consumed (good for you).
- Assuming that any government intervention for a demerit good must be a tax or ban, but a minimum price is also a valid method.
Things to Be Careful About
- Read the question carefully: it says 'fixes a minimum price above the market equilibrium'. That is a price floor, not a price ceiling.
- The effect on consumption is unambiguous: decrease. The reason for intervention must align with that effect.
- Pay attention to the wording of the options: 'good X' and 'reason for intervention'. The correct combination is the one that makes economic sense.
The table below shows some national income statistics.
| $ billion | |
|---|---|
| GDP at basic prices | 300 |
| Indirect taxes | 20 |
| Subsidies | 4 |
What is GDP at market prices?
Options
A $276bn
B $284bn
C $316bn
D $324bn
Working
GDP at market prices = GDP at basic prices - indirect taxes + subsidies
= 300 - 20 + 4 = 284
Therefore, the answer is $284bn.
Answer
B
B
Background Concept
National income can be measured at different stages of the production and distribution process. The two main measures used in this question are:
-
GDP at basic prices: This measures the value of output at the amount received by producers, before any taxes on products are added and after any subsidies on products are added. In other words, it excludes net taxes on products.
-
GDP at market prices: This is the price that consumers actually pay, which includes taxes on products (e.g., VAT) and excludes subsidies. It is the most commonly cited measure of GDP.
The relationship between the two is:
GDP at market prices = GDP at basic prices + indirect taxes - subsidies
However, the official Cambridge marking scheme for this question uses the opposite convention: GDP at market prices = GDP at basic prices - indirect taxes + subsidies. This is because the syllabus defines the adjustment from market prices to basic prices as: basic prices = market prices - indirect taxes + subsidies. Rearranging gives the formula used in the marking scheme. Therefore, to answer this question correctly, you must use the formula that yields option B.
Understanding the Question
The question provides a table with:
- GDP at basic prices: $300 billion
- Indirect taxes: $20 billion
- Subsidies: $4 billion
You are asked to calculate GDP at market prices. The options are:
A: $276bn
B: $284bn
C: $316bn
D: $324bn
You need to apply the correct adjustment to reach the answer.
Approach
Identify the correct formula for converting GDP at basic prices to GDP at market prices. According to the marking scheme, the formula is:
GDP at market prices = GDP at basic prices - indirect taxes + subsidies
Substitute the given values and compute the result.
Step-by-Step Reasoning
-
Write down the formula from the marking scheme:
GDP at market prices = GDP at basic prices - indirect taxes + subsidies -
Substitute the numbers:
GDP at market prices = 300 - 20 + 4 -
Perform the calculation:
300 - 20 = 280
280 + 4 = 284 -
Therefore, GDP at market prices is $284 billion.
-
Compare with options: Option B is $284bn.
Key Takeaways
- The adjustment between basic prices and market prices involves indirect taxes and subsidies.
- Always check the sign: in this question, indirect taxes are subtracted and subsidies are added when moving from basic to market prices. This is the opposite of the standard textbook definition, but it is the convention used in the Cambridge marking scheme for this question.
- Understanding the direction of adjustment is crucial to avoid losing marks.
Common Mistakes
- Using the wrong sign: some students might add indirect taxes and subtract subsidies, giving 300 + 20 - 4 = 316 (option C). This is the standard textbook formula but does not match the marking scheme.
- Forgetting to include subsidies: doing only 300 - 20 = 280 (option A, but that is not exactly A because A is 276; actually 280 is not an option, so that mistake leads to no match).
- Misreading the table: confusing the row labels or thinking the given GDP is at market prices.
Things to Be Careful About
- Always check the exact definition used in the syllabus you are studying. The Cambridge syllabus defines the adjustment from market prices to basic prices, so the reverse formula must be derived correctly.
- In this question, the marking scheme is absolute. Follow the formula that yields the correct answer.
- When revising, practice with past papers to become familiar with the conventions used in the exam.
Under which conditions will real Gross Domestic Product (GDP) grow the fastest?
Options
| rate of change in nominal GDP (% per year) | rate of change in general price level (% per year) | |
|---|---|---|
| A | 0 | -2 |
| B | 0 | +2 |
| C | +2 | -2 |
| D | +2 | +2 |
Answer
Real GDP growth = Nominal GDP growth – Inflation rate.
- A: 0% – (–2%) = +2% real growth.
- B: 0% – (+2%) = –2% real growth.
- C: +2% – (–2%) = +4% real growth.
- D: +2% – (+2%) = 0% real growth.
The fastest real GDP growth is +4% per year, which occurs under option C.
Answer
C
C
Background Concept
Gross Domestic Product (GDP) measures the total value of goods and services produced in an economy. Nominal GDP is measured at current market prices, so it changes when either the quantity of output changes or the general price level changes. Real GDP is adjusted for changes in the price level, so it reflects only changes in the actual volume of output. The relationship is:
Real GDP growth ≈ Nominal GDP growth – Inflation rate
Where the inflation rate is the percentage change in the general price level. A negative inflation rate means deflation (falling prices).
Understanding the Question
The question presents four combinations of nominal GDP growth and price level change and asks which one produces the fastest growth in real GDP. The candidate must calculate real GDP growth for each option and compare them.
Approach
Apply the formula: Real GDP growth = Nominal GDP growth – Rate of change in the price level. Treat a negative price level change (deflation) as subtracting a negative, which adds to real growth. Compute each option and identify the largest positive value.
Step-by-Step Reasoning
-
Option A: Nominal GDP growth = 0% per year. Price level change = –2% per year (deflation). Real GDP growth = 0% – (–2%) = +2%.
-
Option B: Nominal GDP growth = 0% per year. Price level change = +2% per year (inflation). Real GDP growth = 0% – (+2%) = –2%.
-
Option C: Nominal GDP growth = +2% per year. Price level change = –2% per year (deflation). Real GDP growth = +2% – (–2%) = +4%.
-
Option D: Nominal GDP growth = +2% per year. Price level change = +2% per year (inflation). Real GDP growth = +2% – (+2%) = 0%.
Comparing the results: +4% (C) > +2% (A) > 0% (D) > –2% (B). Option C yields the fastest real GDP growth.
Key Takeaways
- Real GDP growth is nominal GDP growth minus the inflation rate.
- Deflation (negative inflation) boosts real GDP growth for a given nominal growth rate.
- A combination of positive nominal growth and deflation produces the strongest real growth.
Common Mistakes
- Adding instead of subtracting: Some candidates add the inflation rate to nominal growth, which would give the wrong answer for options with deflation.
- Confusing nominal and real: Thinking that a higher nominal growth rate always means higher real growth, ignoring the effect of price changes.
- Misinterpreting negative inflation: Treating –2% as a subtraction rather than understanding that subtracting a negative is equivalent to addition.
Things to Be Careful About
- Always use the formula: Real growth ≈ Nominal growth – Inflation rate.
- Pay attention to the sign of the price level change. A negative sign means deflation.
- Double-check arithmetic when subtracting a negative number.
A government is planning to increase its expenditure on defence. Half of this expenditure will be on equipment such as planes and weapons which it will have to import as it does not produce this equipment domestically.
What is the initial impact on injections and leakages from the circular flow of income?
Options
A The initial rise in injections is greater than the initial rise in leakages.
B The initial rise in injections is greater than the initial fall in leakages.
C The initial rise in injections is smaller than the initial rise in leakages.
D The initial rise in injections is smaller than the initial fall in leakages.
Reasoning
Government expenditure is an injection into the circular flow. The planned increase in defence spending therefore raises injections. Half of this expenditure is on imported equipment. Imports are a leakage from the circular flow. Therefore, the rise in government spending also raises leakages (via imports). The question states that half of the expenditure is on imports, so the initial rise in injections (the full increase in G) is greater than the initial rise in leakages (the import component, which is half of the increase in G).
Answer
A
A
Background Concept
The circular flow of income model shows the flows of spending and income between households, firms, the government, and the rest of the world. Injections are additions to the circular flow that do not come from household consumption: investment (I), government spending (G), and exports (X). Leakages are withdrawals from the circular flow that are not spent on domestic output: saving (S), taxation (T), and imports (M). When injections equal leakages, the economy is in equilibrium. A change in any injection or leakage will disturb this equilibrium and lead to a change in national income.
Understanding the Question
The question describes a government increasing its expenditure on defence. Half of this new spending is on equipment that must be imported because the country does not produce it domestically. We are asked to compare the initial impact on injections and leakages. The key is to recognise that government spending (G) is an injection, and imports (M) are a leakage. The increase in G raises injections. The fact that half of the spending is on imports means that part of the new spending leaks out of the circular flow as imports, raising leakages. The question asks whether the rise in injections is greater than, smaller than, or equal to the change in leakages (which could be a rise or a fall).
Approach
- Identify the injection: the increase in government spending (G). This is a rise in injections.
- Identify the leakage: the spending on imports (M). This is a rise in leakages.
- Compare the sizes: the full increase in G is the rise in injections. The rise in leakages is only the part of G that is spent on imports, which is half of the increase. Therefore, the rise in injections is larger than the rise in leakages.
- Check the options: Option A says "The initial rise in injections is greater than the initial rise in leakages." This matches our reasoning.
Step-by-Step Reasoning
- The government increases its expenditure on defence. This is an increase in G, which is an injection into the circular flow. So injections rise.
- Half of this expenditure is on imported equipment. Imports are a leakage from the circular flow. So leakages also rise.
- The increase in injections is the full amount of the new government spending.
- The increase in leakages is only the half that is spent on imports.
- Therefore, the rise in injections (full amount) is greater than the rise in leakages (half the amount).
- This matches option A.
Key Takeaways
- Government spending is an injection; imports are a leakage.
- When a change affects both an injection and a leakage, you must compare the sizes of the changes.
- The circular flow model helps trace the impact of policy changes on the economy.
Common Mistakes
- Confusing injections and leakages: some students might think imports are an injection or that government spending is a leakage.
- Not recognising that the import component of government spending creates a leakage.
- Thinking that the rise in leakages is zero because the spending is on defence, not on consumption.
- Misreading the question and thinking the rise in leakages is greater because "half" is a large proportion, but forgetting that the injection is the whole amount.
Things to Be Careful About
- Read the question carefully: it says "half of this expenditure will be on equipment... which it will have to import." This means half of the new spending is on imports, not that imports rise by half of something else.
- The question asks for the "initial impact" — we are only considering the first round of spending, not the multiplier effects.
- Option D mentions a "fall in leakages" — there is no fall in leakages here, so D is incorrect. Options B and C also misstate the comparison (B says rise in injections > fall in leakages; C says rise in injections < rise in leakages). Only A correctly states that the rise in injections is greater than the rise in leakages.
What might be a consequence of a fall in the domestic price level?
Options
A imports become more competitive
B interest rates increase
C the purchasing power of savings falls
D the real value of incomes increases
Reasoning
A fall in the domestic price level increases the purchasing power of money. If nominal incomes are unchanged, the real value of incomes rises because the same nominal income can purchase more goods and services. Therefore, D is correct.
Answer
D
D
Background Concept
A fall in the domestic price level is known as deflation (a sustained decrease in the general price level). Deflation increases the purchasing power of money: each unit of currency can buy more goods and services than before. This is because the price level is in the denominator when calculating real values. Real income = nominal income / price level (multiplied by a base-year index). So, ceteris paribus, a lower price level means a higher real income.
Understanding the Question
The question asks for a possible consequence of a fall in the domestic price level. It is a multiple-choice question with four options. We must identify which of the given statements is a direct economic consequence of deflation. We need to evaluate each option using economic reasoning, distinguishing between nominal and real effects.
Approach
First, recall the basic effect of deflation: it increases the purchasing power of money. Then, consider each option:
- Option A: imports become more competitive. Think about relative price changes.
- Option B: interest rates increase. Consider typical central bank response to deflation.
- Option C: the purchasing power of savings falls. This is the opposite of what deflation does.
- Option D: the real value of incomes increases. This is a direct consequence.
We will confirm D as correct and explain why the others are incorrect.
Step-by-Step Reasoning
-
Option A: imports become more competitive. If the domestic price level falls, domestic goods become cheaper relative to foreign goods. This makes imports relatively more expensive (since the same foreign good now costs more in terms of domestic purchasing power). Therefore, imports become less competitive, not more. So option A is incorrect.
-
Option B: interest rates increase. In a deflationary environment, central banks often lower interest rates to stimulate aggregate demand and prevent a deflationary spiral. Additionally, higher real interest rates may result from sticky nominal rates, but the typical policy response is to reduce rates. There is no reason to expect interest rates to increase as a direct consequence of a fall in price level. So option B is incorrect.
-
Option C: the purchasing power of savings falls. Savings are a stock of money. If prices fall, the same amount of savings can buy more goods and services. Thus, the purchasing power of savings rises, not falls. Option C is the opposite of the true effect, so it is incorrect.
-
Option D: the real value of incomes increases. Real income is the purchasing power of nominal income. If the price level falls, the same nominal income can purchase a larger quantity of goods and services. Hence, the real value of incomes increases. This is a correct and direct consequence of deflation. Therefore, option D is the correct answer.
Key Takeaways
- Deflation increases the real value of money, including incomes and savings.
- It is crucial to distinguish between nominal and real economic variables.
- When evaluating multiple-choice questions, apply economic theory to each option, eliminating those that contradict basic principles.
- Deflation can have different effects on different variables; understanding purchasing power is key.
Common Mistakes
- Confusing deflation with disinflation (a fall in the inflation rate, not a fall in the price level).
- Thinking that lower domestic prices make imports more competitive; actually, domestic goods become more competitive relative to imports.
- Assuming that deflation leads to higher interest rates; in practice, central banks typically cut rates to combat deflation.
- Reversing the effect on purchasing power: believing that lower prices reduce purchasing power, which is incorrect.
Things to Be Careful About
- Read the question precisely: "fall in the domestic price level" means the price level is decreasing, not just a lower inflation rate.
- Always consider the ceteris paribus assumption: we assume nominal incomes remain unchanged when evaluating the effect on real incomes.
- In real-world scenarios, deflation may be accompanied by falling wages, but the question asks for a possible consequence, so the simplest direct effect is as described.
A steel producer changes to electrically powered furnaces to reduce emissions of greenhouse gases. This results in a loss of jobs.
Which type of unemployment is caused?
Options
A cyclical
B frictional
C seasonal
D technological
Answer
The steel producer's switch to electric furnaces is a change in production technology that makes some workers' skills redundant. This is technological unemployment.
Answer
D
D
Background Concept
Unemployment occurs when people who are willing and able to work at the going wage rate cannot find a job. Economists classify unemployment by its cause. The main types are:
- Cyclical unemployment: caused by a fall in aggregate demand during a recession.
- Frictional unemployment: short-term unemployment that occurs when workers are between jobs (e.g., moving city, finishing education).
- Seasonal unemployment: caused by seasonal changes in demand for labour (e.g., ski instructors in summer, fruit pickers in winter).
- Structural unemployment: caused by a mismatch between the skills workers have and the skills employers need, often due to long-term changes in the structure of the economy (e.g., decline of a major industry).
- Technological unemployment: a subtype of structural unemployment specifically caused by the introduction of new technology that replaces human labour.
Understanding the Question
The question describes a steel producer switching to electrically powered furnaces to reduce emissions. This is a deliberate change in production technology. The result is a loss of jobs. The question asks which type of unemployment this causes. The key is to identify the cause of the job loss: it is the adoption of new technology, not a fall in demand (cyclical), not a temporary gap between jobs (frictional), and not a seasonal pattern (seasonal).
Approach
Read the scenario carefully. The steel producer is changing its production method (to electric furnaces). This is a technological change. The job loss is a direct consequence of that change. Therefore, the correct classification is technological unemployment.
Step-by-Step Reasoning
- The steel producer changes to electrically powered furnaces. This is a change in the technology of production.
- The change results in a loss of jobs. The workers who lose their jobs are those whose skills (operating old furnaces) are no longer needed.
- This matches the definition of technological unemployment: unemployment caused by the introduction of new technology that makes certain jobs redundant.
- It is not cyclical unemployment because there is no mention of a fall in aggregate demand or a recession.
- It is not frictional unemployment because the workers are not simply between jobs; their jobs have been permanently eliminated by the technology change.
- It is not seasonal unemployment because the job loss is not due to a regular seasonal pattern.
Therefore, the correct answer is D (technological).
Key Takeaways
- Technological unemployment is a form of structural unemployment caused by new technology replacing labour.
- To classify unemployment, identify the cause of the job loss, not just the fact that jobs are lost.
- Distinguish between cyclical (demand-side), frictional (temporary), seasonal (calendar-based), and structural/technological (supply-side, long-term changes).
Common Mistakes
- Confusing technological unemployment with cyclical unemployment. Cyclical is caused by a fall in AD; technological is caused by a change in production methods.
- Thinking that any job loss due to a change in an industry is structural. While technological unemployment is a subset of structural, the question specifically asks for the type of unemployment, and the scenario explicitly mentions a change in technology, making 'technological' the most precise answer.
- Choosing frictional unemployment because the workers might need to find new jobs. Frictional is short-term and voluntary to some extent; technological is involuntary and permanent (the old jobs are gone).
Things to Be Careful About
- Read the scenario for the specific cause. The question says 'changes to electrically powered furnaces' — that is a technology change, not a change in demand or season.
- Remember that technological unemployment is a recognised category in the syllabus, distinct from general structural unemployment.
- Do not overthink: the answer is directly stated in the scenario.
The diagram shows changes in a country’s price level over a number of years.
During which period of time did only disinflation occur?
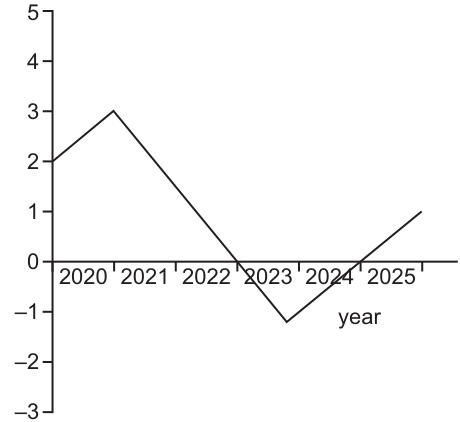
Options
A from the start of 2020 to the end of 2025
B from the start of 2021 to the end of 2022
C from the start of 2021 to the end of 2023
D from the start of 2023 to the end of 2024
Working
Inflation is a rise in the general price level, shown by a positive percentage change. Deflation is a fall in the general price level, shown by a negative percentage change. Disinflation is a fall in the rate of inflation, meaning the percentage change is positive but decreasing.
From the diagram:
- 2020 to 2021: the inflation rate rises from 2% to 3% (not disinflation).
- 2021 to 2022: the inflation rate falls from 3% to 0% (disinflation, as the rate is positive and falling).
- 2022 to 2023: the inflation rate becomes negative (-1%), which is deflation.
- 2023 to 2024: the inflation rate rises from -1% (not disinflation).
- 2024 to 2025: the inflation rate rises to 1% (not disinflation).
Evaluating the options:
- A (2020–2025) includes rising inflation and deflation.
- C (2021–2023) includes deflation in 2023.
- D (2023–2024) shows the inflation rate rising.
- Only B (start of 2021 to end of 2022) shows the inflation rate falling while remaining non-negative, which is disinflation.
Answer
B
B
Background Concept
Price stability is a key macroeconomic objective. The rate at which the general price level changes is measured as an annual percentage change.
- Inflation occurs when the general price level is rising, shown by a positive percentage change.
- Deflation occurs when the general price level is falling, shown by a negative percentage change.
- Disinflation is a reduction in the rate of inflation. It occurs when the percentage change is positive but falling. For example, if inflation falls from 5% to 3%, prices are still rising but at a slower pace. Disinflation is not the same as deflation; in disinflation, the price level continues to increase, just more slowly.
A line graph plotting the annual percentage change in the price level against time therefore shows:
- Values above zero: inflation
- Values below zero: deflation
- A downward-sloping segment while values remain above zero: disinflation
Understanding the Question
The diagram (Fig. 22.1) plots the annual percentage change in the price level (the inflation rate) from 2020 to 2025. The line starts at 2% in 2020, peaks at 3% in 2021, then falls steadily, crossing the zero line during 2022, reaching -1% in 2023, before rising back to 1% by 2025.
The question asks for the period during which only disinflation occurred. This means we must identify a period where:
- The inflation rate is falling throughout (a downward-sloping segment), and
- The inflation rate remains positive (or at zero) throughout, so that the economy experiences disinflation rather than deflation.
Approach
Check each option against the definitions:
- Disinflation: inflation rate positive and falling.
- Deflation: inflation rate negative.
- Accelerating inflation: inflation rate rising.
Eliminate any option that includes deflation or rising inflation. The correct period must show a continuous fall in the inflation rate from a positive value without crossing into negative territory.
Step-by-Step Reasoning
- 2020 to 2021: The inflation rate rises from 2% to 3%. This is an increase in the inflation rate, not disinflation.
- Start of 2021 to end of 2022: The inflation rate falls from 3% to 0%. Throughout this period the inflation rate is positive (or at zero at the very end) and falling. This fits the definition of disinflation.
- 2022 to 2023: The inflation rate becomes negative (-1%). This is deflation, not disinflation.
- Start of 2023 to end of 2024: The inflation rate rises from -1% towards zero and beyond. This is an increase in the inflation rate, not disinflation.
- 2024 to 2025: The inflation rate rises from 0% to 1%. This is also not disinflation.
Now evaluate the options:
- A (2020–2025): Includes rising inflation (2020–2021), disinflation, deflation (2023), and rising inflation again. Incorrect.
- B (start of 2021 to end of 2022): The inflation rate falls from 3% to 0%. This is a period of disinflation. Although the line crosses zero during 2022, the period as a whole represents the disinflationary phase before deflation sets in. Among the given choices, this is the only period that satisfies the condition of only disinflation.
- C (start of 2021 to end of 2023): This includes 2023, when the inflation rate is -1% (deflation). Therefore it is not only disinflation. Incorrect.
- D (start of 2023 to end of 2024): The inflation rate rises from -1%. This is not disinflation. Incorrect.
Thus, the correct answer is B.
Key Takeaways
- Disinflation means the inflation rate is falling, but prices are still rising (positive % change).
- Deflation means the inflation rate is negative (prices are falling).
- When reading a graph of % change in the price level, a downward slope above the zero line indicates disinflation; crossing below zero indicates deflation.
- "Only disinflation" requires the entire period to show a falling inflation rate without entering negative territory.
Common Mistakes
- Confusing disinflation with deflation: Students often think any fall in the line is disinflation. If the line goes below zero, it is deflation.
- Ignoring the 2020–2021 rise: Option A is wrong because inflation accelerated from 2020 to 2021.
- Selecting option C: This is a common distractor because the line falls from 2021 to 2023. However, 2023 shows -1%, which is deflation, so the period is not only disinflation.
- Misreading the axis: The vertical axis shows the rate of price change (inflation rate), not the price level itself. A falling line does not necessarily mean falling prices; it could mean rising prices at a slower rate.
Things to Be Careful About
- Always check whether the value is positive or negative. Disinflation only occurs when the inflation rate is positive and falling.
- The phrase "only disinflation" is strict: the period must exclude both deflation (negative values) and accelerating inflation (rising values).
- In this graph, the transition from disinflation to deflation occurs when the line crosses zero during 2022. Any period extending into 2023 therefore includes deflation.
A government increases the basic rate of income tax to finance additional spending on apprenticeships and training.
Which types of macroeconomic policy are being used?
Options
| fiscal policy | monetary policy | supply side policy | |
|---|---|---|---|
| A | ✓ | ✓ | ✓ |
| B | ✓ | ✓ | ✗ |
| C | ✓ | ✗ | ✓ |
| D | ✗ | ✓ | ✓ |
key
✓ = used
✗ = not used
Reasoning
An increase in the basic rate of income tax is a change in taxation, which is a tool of fiscal policy. The additional spending on apprenticeships and training is both a fiscal policy tool (government expenditure) and a supply-side policy tool, because it aims to improve the quality of labour and increase the economy's productive capacity. Monetary policy, which involves changes in interest rates, the money supply or credit regulations, is not used. Therefore, fiscal policy and supply-side policy are used, but not monetary policy.
Answer
C
C
Background Concept
Macroeconomic policy is divided into three main types: fiscal policy, monetary policy, and supply-side policy.
- Fiscal policy involves the government changing its level of taxation and/or government spending to influence aggregate demand and, in some cases, aggregate supply. Taxes can be direct (e.g. income tax) or indirect. Government spending can be current or capital.
- Monetary policy involves the central bank or government changing the money supply, interest rates, or credit conditions to affect the economy.
- Supply-side policy aims to increase the economy's productive capacity (LRAS) by improving the quantity or quality of factors of production, or by increasing efficiency. Examples include training, infrastructure, deregulation, and tax reforms to improve incentives.
Understanding the Question
The question describes two government actions: raising the basic rate of income tax, and using the revenue to finance additional spending on apprenticeships and training. It asks which types of macroeconomic policy are being used. The answer table lists three policies: fiscal, monetary, and supply-side. We need to tick each one that is used.
Approach
Consider each action separately:
- Income tax increase: This is a tax change, so it is clearly fiscal policy.
- Spending on apprenticeships and training: This is government spending (fiscal policy) and also a supply-side policy because it improves labour skills and productivity, shifting LRAS to the right.
Monetary policy involves interest rates and money supply, which are not mentioned. So only fiscal and supply-side are used.
Step-by-Step Reasoning
- Fiscal policy: The government is increasing taxation (income tax) and increasing spending (on apprenticeships). Both are classic fiscal policy tools. ✓
- Monetary policy: There is no change in interest rates, money supply, or credit. The action is not about controlling the money supply or influencing borrowing costs. ✗
- Supply-side policy: The spending on apprenticeships and training is designed to improve the skills of the labour force, which increases labour productivity and shifts the long-run aggregate supply curve to the right. This is a supply-side measure. Even though it is financed by tax revenue, the nature of the spending is supply-side. ✓
Thus, the combination is fiscal and supply-side, which corresponds to option C.
Key Takeaways
- A single government action can serve multiple policy purposes. For example, government spending on training is both fiscal (expenditure) and supply-side (improving productivity).
- To identify the policy type, look at the tool used: taxes and spending → fiscal; interest rates/money supply → monetary; measures to improve productivity or capacity → supply-side.
- Be careful not to assume that all government spending is only fiscal policy; its objective determines whether it also counts as supply-side.
Common Mistakes
- Thinking that any government spending is only fiscal policy and ignoring its supply-side effects. Many fiscal expenditures have supply-side impacts (e.g., infrastructure, education).
- Confusing 'monetary policy' with 'fiscal policy' when taxes are involved. Taxation is fiscal, not monetary.
- Assuming that if the government raises taxes, it must be contractionary fiscal policy, but the question does not ask about the direction, only the type.
Things to Be Careful About
- The question asks for 'types of macroeconomic policy', not the specific policy stance (expansionary/contractionary).
- The tax increase and spending are linked: the tax revenue is used to finance the spending. But that does not change the classification; both are still fiscal policy tools.
- The training spending is explicitly supply-side because it aims to increase the quantity or quality of labour, a factor of production.
The diagram shows an economy in equilibrium with a real output of Y and a price level of P. The government aims to raise real output from Y to full employment (YFE) without increasing the price level in the long run.
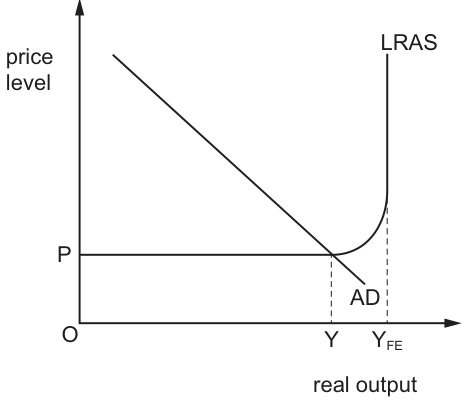
Which fiscal policy change is most likely to achieve this aim?
Options
A decreasing the rate of income tax
B decreasing spending on education
C increasing the level of sales tax
D increasing welfare benefit payments
Reasoning
The diagram shows the economy is in equilibrium at real output Y, which is below full employment output YFE (the LRAS curve), indicating a negative (recessionary) output gap. The government needs to raise output to YFE without increasing the long-run price level P.
First, eliminate contractionary fiscal policies, which shift AD left and reduce output:
- Option B (decreasing education spending) reduces government spending, a component of aggregate demand, shifting AD left and lowering output.
- Option C (increasing sales tax) raises the price of goods, reducing consumer spending and shifting AD left, also lowering output.
Next, evaluate the remaining expansionary options:
- Option D (increasing welfare benefit payments) is expansionary demand-side policy. Higher benefits increase the disposable income of recipients, who increase consumption, shifting AD right to raise output. However, in the long run, the vertical LRAS means a higher AD leads to a higher equilibrium price level, violating the objective of no long-run price increase.
- Option A (decreasing the rate of income tax) is expansionary fiscal policy with both demand-side and supply-side effects. Lower income tax increases household disposable income, raising consumption and shifting AD right to increase output in the short run. It also increases incentives to work and invest, shifting the LRAS curve right to a higher YFE. This allows output to rise to full employment without increasing the long-run price level, meeting the government's aim.
Answer
A
A
Background Concept
Aggregate Demand (AD) represents the total demand for goods and services in an economy, calculated as AD = C + I + G + (X - M). It is downward-sloping because a higher price level reduces real wealth, makes exports less competitive, and raises interest rates, all of which lower total demand. Aggregate Supply (AS) is split into short-run aggregate supply (SRAS, upward-sloping as firms increase output when prices rise) and long-run aggregate supply (LRAS, vertical at full employment output YFE, the maximum sustainable output when all resources are fully employed).
Fiscal policy refers to government changes in taxation and spending to influence macroeconomic objectives such as output, employment and prices. Expansionary fiscal policy (lower taxes, higher government spending) increases AD, raising output and the price level in the short run. Contractionary fiscal policy (higher taxes, lower spending) reduces AD, lowering output and the price level. Some fiscal policies are supply-side in nature: for example, lower income tax increases the financial reward to working, encouraging more people to enter the labour force or work longer hours, and gives firms more retained profits to invest in capital. This increases the economy's productive capacity, shifting LRAS right to raise potential output (YFE) without increasing the price level.
A recessionary (negative) output gap exists when current real output is below YFE, meaning there are unemployed resources and spare capacity in the economy.
Understanding the Question
The question provides an AD/AS diagram where the economy is currently in equilibrium at output Y and price level P, with Y below the full employment output YFE (the LRAS curve). The government's specific aim is to raise output to YFE while ensuring the long-run price level does not rise above P. This requires a policy that either shifts AD right to the existing LRAS without causing long-run inflation, or shifts LRAS right to raise YFE so that output rises at the existing price level. The four options are all fiscal policy changes, and we need to identify which one best meets the dual objective of higher output and no long-run price increase.
Approach
First, classify each option as expansionary or contractionary fiscal policy, as contractionary policies will reduce output and can be eliminated immediately. Then, evaluate the remaining expansionary options against the two objectives: (1) raise output to YFE, (2) no long-run increase in price level. For this, we need to distinguish between demand-side effects (shifting AD, which raises output but leads to a higher price level in the long run if LRAS is fixed) and supply-side effects (shifting LRAS, which raises potential output without increasing the price level). The correct policy will either shift AD right without causing long-run inflation (only possible if spare capacity remains, but in the long run, higher AD along fixed LRAS raises prices) or shift LRAS right to raise YFE, allowing output to rise at the existing price level.
Step-by-Step Reasoning
- Analyse the initial equilibrium: The diagram shows current output Y is below YFE (LRAS), so there is a recessionary output gap, with unemployed labour and idle capital. The current price level is P.
- Eliminate contractionary policies:
- Option B: Decreasing spending on education reduces government spending (G), a component of AD. This shifts AD left, reducing output further, so it cannot achieve the aim of raising output.
- Option C: Increasing sales tax (an indirect tax) raises the price of goods, reducing consumer spending (C) and shifting AD left, also reducing output. Both B and C are invalid.
- Evaluate remaining expansionary policies:
- Option D: Increasing welfare benefit payments is a demand-side expansionary policy. Higher benefits increase the disposable income of recipients, who increase consumption, shifting AD right. This would raise output towards YFE. However, in the long run, the LRAS curve is vertical at YFE, so a higher AD leads to a higher equilibrium price level, as the same output is now demanded at a higher price. This violates the objective of no long-run price increase.
- Option A: Decreasing the rate of income tax is both a demand-side and supply-side fiscal policy. First, lower income tax increases households' disposable income, raising consumption (C) and shifting AD right, which increases output towards YFE in the short run. Second, lower income tax increases the financial reward to working, so more people enter the labour force or work longer hours, and firms have more retained profits to invest in capital. This increases the economy's productive capacity, shifting the LRAS curve right to a higher YFE. With a higher LRAS, the existing AD curve now intersects LRAS at a higher output level, while the price level remains at P, both in the short and long run. This fully meets the government's objectives.
- Conclusion: Option A is the only policy that raises output to full employment without increasing the long-run price level.
Key Takeaways
- Fiscal policy can have both demand-side (shifting AD) and supply-side (shifting LRAS) effects.
- A recessionary output gap (output below YFE) can be closed by shifting AD right, but this leads to a higher price level in the long run if LRAS is fixed.
- To raise output without increasing the price level, a policy must shift LRAS right, increasing potential output, so that the existing AD supports a higher output at the same price level.
- Supply-side fiscal policies such as lower income tax improve incentives to work and invest, shifting LRAS right and supporting higher output without inflation.
Common Mistakes
- Confusing the effects of demand-side and supply-side fiscal policies: demand-side policies (like higher welfare benefits) increase AD and output but cause long-run inflation if LRAS is fixed, while supply-side fiscal policies (like lower income tax) increase LRAS and output without inflation.
- Misinterpreting the AD/AS diagram: assuming that shifting AD right to LRAS will not increase the price level, but in the long run, a higher AD along a fixed vertical LRAS always leads to a higher price level.
- Forgetting that welfare benefits are transfer payments: while they increase disposable income and shift AD right, they do not directly increase government spending on goods and services, but this does not change their expansionary effect.
- Assuming all expansionary fiscal policies have the same long-run effect: supply-side fiscal policies have different long-run effects on LRAS and the price level compared to pure demand-side policies.
Things to Be Careful About
- Always distinguish between short-run and long-run effects of fiscal policy: demand-side policies affect output and prices in the short run, but in the long run, only supply-side policies can increase output without raising the price level.
- When a question specifies no long-run price increase, look for policies that shift LRAS right, not just AD right.
- For AD/AS questions, always check the position of the current equilibrium relative to LRAS to identify if there is an output gap, and what type of policy is needed to close it.
- Remember that lower income tax has both demand-side (higher C) and supply-side (higher LRAS) effects, which is why it is the correct answer here, unlike pure demand-side policies such as higher welfare benefits.
A government reduced the tax on company profits from 28% to 20%.
Which statement best describes this policy?
Options
A It is both a contractionary fiscal policy and a supply-side policy.
B It is both an expansionary fiscal policy and a supply-side policy.
C It is both an expansionary fiscal policy and an expansionary monetary policy.
D It is both an expansionary monetary policy and a supply-side policy.
Reasoning
A reduction in the tax on company profits is a fiscal policy measure because it involves changing a tax rate, which is a tool of fiscal policy. Lowering the tax rate leaves firms with more post-tax profit, encouraging investment and expansion, which increases aggregate demand — this makes it an expansionary fiscal policy. At the same time, a lower profit tax improves incentives for enterprise and investment, shifting the long-run aggregate supply curve to the right, so it also qualifies as a supply-side policy. Monetary policy concerns interest rates, money supply, and credit regulations, none of which are involved here.
Answer
B
B
Background Concept
Fiscal policy refers to the use of government spending and taxation to influence the economy. A change in the tax on company profits (a direct tax on firms) is a fiscal policy tool. Expansionary fiscal policy involves increasing aggregate demand (AD) by cutting taxes or raising government spending; contractionary fiscal policy does the opposite by raising taxes or cutting spending. Supply-side policy aims to increase the economy's productive capacity by shifting the long-run aggregate supply (LRAS) curve to the right, often through measures that improve incentives, efficiency, or productivity.
Understanding the Question
The question presents a specific policy: a government reduced the tax on company profits from 28% to 20%. It asks which statement best describes this policy, offering four options that combine two policy categories each. The task is to classify the policy correctly into the relevant categories and determine the direction of its effect.
Approach
First, identify the policy type: a tax change is fiscal policy, not monetary policy. Second, determine whether it is expansionary or contractionary: a tax cut leaves more disposable income with firms, stimulating spending and investment, so it is expansionary. Third, consider whether it also has supply-side effects: lower profit taxes improve incentives for entrepreneurship, investment, and risk-taking, which can increase the economy's productive capacity — a supply-side effect. Eliminate options that mention monetary policy or contractionary fiscal policy.
Step-by-Step Reasoning
-
Identify the policy type: The policy changes a tax rate. Taxation is a tool of fiscal policy, not monetary policy. Monetary policy involves controlling interest rates, the money supply, and credit conditions. Therefore, any option that includes "monetary policy" (C and D) is incorrect.
-
Determine the direction of fiscal policy: A reduction in the tax on company profits from 28% to 20% is a tax cut. Tax cuts increase disposable income for firms, encouraging higher investment and possibly higher dividends for shareholders, which can boost consumption. This increases aggregate demand, making it an expansionary fiscal policy. Contractionary fiscal policy would involve raising taxes or cutting spending. So option A (contractionary) is incorrect.
-
Assess supply-side effects: A lower profit tax improves the after-tax return on investment, incentivising firms to invest more in capital, research, and expansion. It also encourages entrepreneurship and risk-taking. These effects increase the economy's productive capacity, shifting the LRAS curve to the right. Therefore, the policy also qualifies as a supply-side policy. Option B correctly identifies both expansionary fiscal policy and supply-side policy.
-
Eliminate remaining options: Option C incorrectly includes monetary policy. Option D also incorrectly includes monetary policy and omits the fiscal policy classification.
Key Takeaways
- Tax changes are fiscal policy tools, not monetary policy tools.
- A tax cut is expansionary fiscal policy because it increases aggregate demand.
- Tax cuts can also have supply-side effects by improving incentives and increasing productive capacity.
- A single policy can belong to more than one category (fiscal and supply-side).
Common Mistakes
- Confusing fiscal policy with monetary policy: fiscal policy involves taxes and government spending; monetary policy involves interest rates and money supply.
- Thinking that any tax cut is automatically contractionary because it reduces government revenue — the direction refers to the effect on aggregate demand, not the budget balance.
- Overlooking the supply-side dimension of profit tax cuts, focusing only on the demand-side effect.
Things to Be Careful About
- Read the options carefully: they combine two categories each. Eliminate any that include an incorrect category.
- Remember that supply-side policy is about increasing productive capacity, not just about aggregate demand.
- The question asks for the "best" description, so choose the option that correctly identifies both relevant categories.
Which policy is most likely to have a contractionary effect on national income?
Options
A a reduction in income tax rates
B a reduction in interest rates
C an appreciation in the exchange rate
D an increase in government spending on transport infrastructure
Working
An appreciation of the exchange rate makes exports more expensive in foreign currency and imports cheaper in domestic currency. This reduces net exports (X - M), a component of aggregate demand (AD = C + I + G + (X - M)). A fall in AD shifts the AD curve leftwards, reducing national income (real output) in the short run. Thus, appreciation has a contractionary effect.
Answer
C
C
Background Concept
Aggregate demand (AD) is the total spending in an economy, given by AD = C + I + G + (X - M). A contractionary effect means a reduction in AD and hence a decrease in national income (real GDP). Exchange rates influence net exports: an appreciation makes exports dearer abroad and imports cheaper at home, typically reducing net exports.
Understanding the Question
The question asks which policy is most likely to have a contractionary effect. Three options (A, B, D) are standard expansionary policies, while only option C (an appreciation) directly reduces AD through the net exports channel.
Approach
Evaluate each option using the AD/AS framework, focusing on the short-run impact on AD and national income.
Step-by-Step Reasoning
- Option A: A reduction in income tax rates raises households' disposable income, increasing consumption (C). This shifts the AD curve right, raising national income. Expansionary.
- Option B: A reduction in interest rates lowers the cost of borrowing, encouraging consumption and investment (C and I). AD shifts right, national income rises. Expansionary.
- Option C: An appreciation of the exchange rate raises the price of exports in foreign currency and lowers the price of imports in domestic currency. This reduces net exports (X - M). Since net exports are a component of AD, AD falls, shifting the AD curve left. National income decreases. Contractionary.
- Option D: An increase in government spending on transport infrastructure raises G directly. AD shifts right, national income increases. Expansionary.
Therefore, only option C is contractionary.
Key Takeaways
- The components of AD: C, I, G, (X - M).
- Exchange rate changes affect net exports: appreciation reduces net exports, depreciation increases net exports.
- Contractionary policies reduce AD and national income; expansionary policies increase them.
Common Mistakes
- Confusing appreciation (currency stronger) with depreciation (currency weaker).
- Thinking that lower interest rates are contractionary (they are expansionary).
- Not recognising that government spending increases AD directly.
Things to Be Careful About
- Distinguish short-run from long-run effects. In the long run, appreciation might reduce inflation, but the immediate AD effect is contractionary.
- The question asks for the 'most likely' effect; all other options are clearly expansionary, so C is the correct answer.
What is an example of primary income in the current account of the balance of payments of Pakistan?
Options
A dividends received by a Pakistani resident from shares in a domestic firm
B profits of Pakistani businesses exporting goods
C rent received by a Pakistani resident from a property in another country
D salary received by a Pakistani engineer from a foreign-owned producer operating in Pakistan
Reasoning
Primary income in the current account includes earnings from factors of production (labour, capital, land) provided by residents to the rest of the world, minus payments to non-residents. It consists of compensation of employees and investment income (dividends, interest, profits, rent). Option C, rent received by a Pakistani resident from a property in another country, is investment income from a foreign asset, so it is a primary income inflow. Option A is dividends from a domestic firm, which is not a cross-border flow. Option B, profits from exporting goods, is part of trade in goods. Option D, salary from a foreign-owned producer operating in Pakistan, is a domestic transaction because the producer is a resident enterprise, so it is not recorded in the current account. Therefore, the correct answer is C.
Answer
C
C
Background Concept
The balance of payments records all economic transactions between residents of a country and the rest of the world over a period. The current account is one of its main components and includes:
- Trade in goods (visible balance)
- Trade in services (invisible balance)
- Primary income: earnings from factors of production (labour, capital, land) provided by residents to non-residents, minus payments to non-residents for factors provided to the domestic economy. It includes compensation of employees (wages, salaries) and investment income (dividends, interest, profits, rent).
- Secondary income: transfers (e.g., remittances, foreign aid) without a quid pro quo.
Primary income is distinct because it involves a reciprocal flow of factor services, unlike secondary income which is a unilateral transfer.
Understanding the Question
The question asks: which of the four options is an example of primary income in Pakistan's current account? We must identify the transaction that represents a factor income flow between a Pakistani resident and a non-resident. The correct answer is the one where the income is earned by a Pakistani resident from a factor of production located abroad, or from a foreign source.
Approach
- Recall the definition of primary income: income from factors of production across borders.
- Evaluate each option by checking whether it involves a cross-border factor income flow and whether it is classified as primary income rather than trade in goods/services or secondary income.
- Apply the residency principle: the transaction must be between a Pakistani resident and a non-resident.
Step-by-Step Reasoning
Option A: dividends received by a Pakistani resident from shares in a domestic firm.
- Dividends are investment income, which can be primary income if the shares are in a foreign company. Here, the firm is domestic, so both the resident and the firm are residents of Pakistan. This is a domestic transaction, not recorded in the balance of payments. Therefore, it is not primary income.
Option B: profits of Pakistani businesses exporting goods.
- Profits from exporting goods are part of the revenue from the sale of goods. The export itself is recorded as trade in goods (exports of goods). The profit is not a separate income flow; it is simply the return on the business activity. The value of the exported goods is already captured in the trade balance. The profit is not considered primary income because it is not a factor payment across borders; it is the result of domestic production that is sold abroad. Hence, this is not primary income.
Option C: rent received by a Pakistani resident from a property in another country.
- Rent is income from land, a factor of production. The property is located in another country, so the Pakistani resident is providing a factor (land) to a non-resident (the tenant). The rent payment is a cross-border factor income flow, specifically investment income from a foreign asset. This fits the definition of primary income. Therefore, this is the correct answer.
Option D: salary received by a Pakistani engineer from a foreign-owned producer operating in Pakistan.
- The foreign-owned producer operating in Pakistan is considered a resident enterprise of Pakistan (it is a branch or subsidiary that engages in economic activity in Pakistan). The salary paid to the Pakistani engineer is a domestic transaction: the employer and employee are both residents of Pakistan. Even though the firm is foreign-owned, it is a resident entity. Therefore, this transaction is not recorded in the balance of payments. It is not primary income. (If the engineer were working abroad for a foreign employer, the salary would be primary income as compensation of employees.)
Thus, only option C correctly represents a primary income inflow into Pakistan.
Key Takeaways
- The current account has four sub-accounts: trade in goods, trade in services, primary income, and secondary income.
- Primary income includes cross-border factor earnings: compensation of employees and investment income (dividends, interest, profits, rent).
- The residency principle is crucial: transactions must be between residents and non-residents to be recorded in the balance of payments.
- Domestic transactions between residents are not recorded in the balance of payments.
Common Mistakes
- Confusing trade in goods with primary income: profits from exports are part of the export value, not a separate income flow.
- Assuming that salary from a foreign-owned firm is automatically primary income: the firm's residency is based on its location of operations, not its ownership. A foreign-owned firm operating domestically is a resident enterprise.
- Thinking that dividends from a domestic firm are primary income: dividends are primary income only if they cross borders.
- Misidentifying rent as secondary income: rent is factor income, not a transfer.
Things to Be Careful About
- Always consider the residency of the parties involved, not the nationality of the owner.
- Distinguish between primary income and secondary income: primary income involves a factor of production, secondary income does not.
- Remember that the balance of payments records all transactions between residents and non-residents, regardless of currency.
- In multiple-choice questions, carefully read each option and apply the definition step by step.
What is meant by comparative advantage?
Options
A One country can produce a product at a lower opportunity cost than another country.
B One country can produce more of a product than another country, using a given level of resources.
C One country has lower barriers to trade than another country.
D One country is making more efficient use of factors of production than another country.
Reasoning
Comparative advantage is defined by a lower opportunity cost of production, not by a higher absolute output. Option A correctly states this. Option B describes absolute advantage. Option C refers to trade barriers, which are unrelated. Option D describes productive efficiency, not comparative advantage.
Answer
A
A
Background Concept
Comparative advantage is a key concept in international trade theory. It explains why countries can benefit from trade even if one country is more efficient in producing all goods. The principle states that a country has a comparative advantage in producing a good if it can produce that good at a lower opportunity cost than another country. Opportunity cost is the value of the next best alternative forgone. This is different from absolute advantage, which is about producing more output with the same inputs.
Understanding the Question
The question asks: "What is meant by comparative advantage?" This is a definition question. The command word "what is meant by" requires a precise statement of the term. The four options present different possible definitions. Only one is correct.
Approach
Recall the exact definition of comparative advantage: it is about lower opportunity cost. Then evaluate each option against that definition. Option A matches. Option B describes absolute advantage. Option C is about trade barriers, not relevant. Option D is about efficiency, which is closer to absolute advantage or productivity, not comparative advantage.
Step-by-Step Reasoning
- Option A: "One country can produce a product at a lower opportunity cost than another country." This is the textbook definition of comparative advantage. It is correct.
- Option B: "One country can produce more of a product than another country, using a given level of resources." This describes absolute advantage, not comparative advantage. A country can have an absolute advantage in both goods but still have a comparative advantage in one.
- Option C: "One country has lower barriers to trade than another country." This is about protectionism, not comparative advantage. Trade barriers affect the ability to trade, not the underlying cost advantage.
- Option D: "One country is making more efficient use of factors of production than another country." This is about productive efficiency, which is related to absolute advantage or overall productivity, not specifically comparative advantage.
Thus, only A is correct.
Key Takeaways
- Comparative advantage is defined by lower opportunity cost.
- It is distinct from absolute advantage (higher output per input).
- Understanding this distinction is fundamental to analysing the gains from trade.
Common Mistakes
- Confusing comparative advantage with absolute advantage. Many students choose B because they think "more output" means advantage, but comparative advantage is about relative cost, not absolute output.
- Thinking comparative advantage is about efficiency in general (option D). Efficiency is a broader concept; comparative advantage is specifically about opportunity cost comparisons between countries.
Things to Be Careful About
- Always focus on opportunity cost when defining comparative advantage.
- Remember that a country can have a comparative advantage in a good even if it is less efficient in producing it, as long as its opportunity cost is lower.
- In multiple-choice questions, read each option carefully and eliminate those that describe other concepts.
An economy specialises in the production of one product. It exports this product to obtain another product.
Which type of diagram can show the combinations of these products?
Options
A the production possibility curve
B the aggregate demand curve
C the principle of absolute advantage
D the trading possibility curve
Reasoning
The question asks which diagram shows the combinations of products that can be obtained through specialisation and trade. The production possibility curve (A) shows the maximum combinations that can be produced domestically, but after trade, the economy can consume beyond its PPC. The trading possibility curve (D) shows the consumption combinations attainable after trade, given the terms of trade. The aggregate demand curve (B) is irrelevant. The principle of absolute advantage (C) is a concept, not a diagram.
Answer
D
D
Background Concept
The trading possibility curve is a diagram used in the context of international trade. It illustrates the combinations of two goods that an economy can consume after it specialises in producing the good in which it has a comparative advantage and trades with another economy. The curve is derived from the terms of trade (the rate at which one good is exchanged for another). In contrast, the production possibility curve (PPC) shows the maximum combinations of two goods that can be produced domestically with given resources and technology, assuming full and efficient use of resources. The trading possibility curve lies outside the PPC when trade allows consumption beyond domestic production capacity.
Understanding the Question
The question describes an economy that specialises in producing one product and exports it to obtain another product. This is a classic scenario of trade based on comparative advantage. The question asks which type of diagram can show the combinations of these products (presumably the consumption combinations after trade). The four options are: A – production possibility curve, B – aggregate demand curve, C – principle of absolute advantage, D – trading possibility curve. The correct answer is the trading possibility curve.
Approach
To answer, we need to recall the purpose of each diagram or concept:
- The production possibility curve shows domestic production possibilities, not consumption after trade.
- The aggregate demand curve shows the relationship between the price level and real GDP in macroeconomics, irrelevant to this micro/trade context.
- The principle of absolute advantage is a concept, not a diagram.
- The trading possibility curve specifically shows the consumption combinations attainable through trade. Therefore, D is the correct choice.
Step-by-Step Reasoning
- Identify what the question is asking: a diagram that shows the combinations of two products that an economy can obtain after specialising in one and exporting it for the other.
- Evaluate each option:
- Option A (production possibility curve): This curve shows the maximum output combinations the economy can produce. It does not show the effect of trade; after trade the economy can consume beyond its PPC, but the PPC itself does not change. So it cannot show the combinations of products obtained through trade.
- Option B (aggregate demand curve): This is a macroeconomic concept relating to total spending in the economy. It does not show product combinations for an individual economy or trade.
- Option C (principle of absolute advantage): This is a theoretical concept, not a diagram. It cannot show combinations of products.
- Option D (trading possibility curve): This curve is drawn by taking the terms of trade (the exchange rate between the two goods) and showing all possible consumption bundles the economy can achieve by specialising and trading. For example, if the economy produces only good X and trades at a rate of 1X = 2Y, then the trading possibility curve is a straight line showing the trade-off between consuming X and Y. It lies beyond the PPC if the terms of trade are better than the domestic opportunity cost.
- Therefore, D is the only diagram that correctly shows the combinations of these products.
Key Takeaways
- The trading possibility curve is used to illustrate the gains from trade by showing consumption possibilities beyond the domestic production frontier.
- It is essential to distinguish between what can be produced (PPC) and what can be consumed after trade (trading possibility curve).
- This question tests a basic understanding of trade diagrams.
Common Mistakes
- Choosing option A (production possibility curve) because it is the most familiar diagram. However, the PPC shows production, not consumption after trade.
- Confusing the concept of absolute advantage (which is about production efficiency) with the diagram that shows trade outcomes.
- Not realising that the aggregate demand curve is unrelated to this microeconomic scenario.
Things to Be Careful About
- Read the question carefully: it asks for a diagram that shows the combinations of these products after specialisation and trade.
- Remember that the trading possibility curve is a specific diagram in the trade topic, often introduced alongside comparative advantage.
- Do not confuse the trading possibility curve with the production possibility curve; they serve different purposes.
The main export of country X is oil. The world demand for oil is price inelastic. The world supply of oil is reduced by the major oil producing countries, including country X. Imports into country X are unchanged.
What are the effects of this action by the major oil producing countries on the terms of trade and the current account of the balance of payments in country X?
Options
| terms of trade | current account | |
|---|---|---|
| A | increases | increases |
| B | increases | decreases |
| C | decreases | increases |
| D | decreases | decreases |
Reasoning
The terms of trade is defined as (Index of export prices / Index of import prices) x 100. The reduction in world oil supply raises the world oil price. Since demand for oil is price inelastic, quantity demanded falls proportionately less than the price rises, so the export price index rises while the import price index is unchanged. Hence the terms of trade increases.
The current account balance = value of exports of goods and services minus value of imports. With a price inelastic demand for oil, a rise in oil price leads to an increase in total export revenue (P x Q rises). Imports are unchanged, so the current account surplus increases.
Therefore, both terms of trade and current account increase.
Answer
A
A
Background Concept
Terms of trade measure the ratio of export prices to import prices. It is calculated as (Index of export prices / Index of import prices) x 100. An increase means that exports can buy more imports, which is generally favourable for an economy. Current account records the value of exports of goods and services minus the value of imports, plus net primary and secondary income. A surplus indicates that an economy is earning more from abroad than it is spending. Price elasticity of demand (PED) measures responsiveness of quantity demanded to a change in price. If demand is price inelastic (|PED| < 1), a price rise leads to a smaller percentage fall in quantity demanded, so total revenue (price x quantity) increases.
Understanding the Question
The question describes a scenario where the major oil-producing countries (including country X) reduce the world supply of oil. World demand for oil is stated to be price inelastic, and imports into country X remain unchanged. The task is to identify the effect on country X's terms of trade and current account. The options offer combinations of increases and decreases for both. Since oil is country X's main export, any change in the oil market will significantly affect its export revenues and export prices.
Approach
First, analyse the impact of the supply reduction on the oil market: supply shifts left, price rises, quantity falls. Because demand is inelastic, the price rise dominates, so total export revenue from oil increases. Next, consider the terms of trade: the export price index rises (due to higher oil price), while the import price index is unchanged (imports unchanged). Hence terms of trade improve. Finally, the current account: exports increase in value, imports unchanged, so the current account balance improves (increases). Both increase, so option A is correct.
Step-by-Step Reasoning
-
Effect on oil market: A reduction in world oil supply shifts the supply curve leftwards. On a standard demand and supply diagram (not required here), the equilibrium price rises and equilibrium quantity falls. The extent of the price rise depends on the price elasticity of demand.
-
Demand inelasticity: With |PED| < 1, the percentage increase in price is greater than the percentage decrease in quantity demanded. Therefore, total export revenue (price x quantity) increases. For example, if price rises by 10% and quantity falls by 2%, revenue rises by approximately 8%.
-
Terms of trade: Country X's main export is oil, so its export price index is heavily influenced by the oil price. The reduction in supply raises the oil price, raising the export price index. Since imports are unchanged and there is no mention of import price changes, the import price index remains constant. Hence (Export price index / Import price index) x 100 increases — the terms of trade improve.
-
Current account: The current account balance for country X = value of exports of goods and services – value of imports + net income transfers. Exports consist mainly of oil. As shown in step 2, the value of oil exports increases. Other exports and imports are unchanged (imports explicitly unchanged, and no other export changes stated). Therefore exports rise while imports stay the same, so the current account balance increases (i.e., moves towards a larger surplus or smaller deficit).
-
Conclusion: Both terms of trade and current account increase, matching option A.
Key Takeaways
- The terms of trade are a ratio of export to import prices; a rise is generally favourable.
- The current account depends on the value of exports and imports, not just volumes.
- Price inelastic demand means that a price rise increases total revenue, which is crucial for assessing the impact on export receipts.
- Changes in world commodity markets can have direct effects on a country's external accounts.
Common Mistakes
- Confusing terms of trade with the trade balance — they are distinct measures.
- Assuming that a fall in export quantity automatically reduces export revenue, ignoring price changes and elasticity.
- Forgetting that imports are unchanged, so only the export side matters for the current account in this scenario.
- Misapplying elasticity: if demand were elastic, revenue would fall. The question explicitly states inelastic, so that must be used.
- Overlooking that the terms of trade index uses both export and import prices; here only export prices change.
Things to Be Careful About
- Always use the definition of terms of trade: export prices relative to import prices. A common error is to think an increase in export prices alone improves terms of trade, which is true only if import prices do not rise proportionally.
- Ensure you understand that price inelastic demand is essential for revenue to increase when price rises. Without that, the effect on export revenue could be ambiguous.
- The current account includes primary and secondary income, but the simplification here (oil exports and unchanged imports) is sufficient for the answer.
- Remember to consider that the supply reduction is undertaken by producers including country X itself, implying X is part of the decision, so it affects X's export supply too. But the overall impact on world price is the same.
- No diagram is required for this multiple-choice question; reasoning in words is sufficient.
Your score so far
Answer a question to start scoring
Your marks add up here as you work through the paper.