Economics 9708/12 — October/November 2025
Cambridge AS Level · AS Level Multiple Choice · answer key with instant marking and worked solutions
Topics Methods of Government Intervention in Markets · Fiscal Policy · Monetary Policy · Consumer and Producer Surplus · Elasticities of Demand · Market Equilibrium and the Price Mechanism · +14 more
Tap an option under each question to check it — your score builds as you go.
What is an example of a normative statement?
Options
A Government expenditure is an injection into the circular flow of income.
B Government expenditure in India in 2022 was 29% of gross domestic product.
C The best policy measure to reduce inflation is a reduction in government expenditure.
D The United States of America is the country with the highest military expenditure.
Reasoning
A normative statement expresses a value judgement about what ought to be, rather than a verifiable fact. Option C states that a particular policy is 'the best' — this is a subjective opinion, not a claim that can be tested against data. Options A, B and D are all positive statements: they describe what is, was, or how the economy functions, and each can in principle be verified or falsified by evidence.
Answer
C
C
Background Concept
Economics is a social science that aims to explain and predict economic behaviour. A fundamental distinction in economic methodology is between positive statements and normative statements.
-
Positive statements are objective claims about how the economy works. They describe 'what is', 'what was', or 'what will be'. They can be tested against factual evidence — data, observation, or logical reasoning — and can therefore be judged true or false. For example, 'The unemployment rate is 5%' is a positive statement because it can be verified by official statistics.
-
Normative statements are subjective value judgements about 'what ought to be'. They express opinions, beliefs, or ethical positions about economic policy or outcomes. They cannot be proven true or false by evidence alone because they depend on personal values. For example, 'The government should reduce unemployment' is normative because it prescribes a goal based on a value judgement.
The phrase 'ceteris paribus' (all other things being equal) is often used in positive analysis to isolate cause and effect, but the distinction between positive and normative is about testability versus opinion.
Understanding the Question
This question asks you to identify which of four statements is normative. You are given four options, each making a claim about the economy. The task is to apply the definition of a normative statement — a value judgement — and pick the one that expresses an opinion rather than a verifiable fact.
Approach
- Read each option carefully.
- Ask: 'Can this statement be proven true or false by checking data or logical reasoning?' If yes, it is positive. If the statement contains a value-laden word like 'best', 'should', 'ought', 'fair', 'unfair', 'too high', 'too low', or expresses a preference, it is normative.
- Eliminate the three positive statements. The remaining one is the answer.
Step-by-Step Reasoning
Option A: 'Government expenditure is an injection into the circular flow of income.'
- This is a statement of economic theory. It describes a relationship in the circular flow model. It can be verified by checking the definition of injections (spending not originating from households) and the circular flow diagram. It is a positive statement.
Option B: 'Government expenditure in India in 2022 was 29% of gross domestic product.'
- This is a factual claim about a specific statistic. It can be verified by looking up official data from India's government or international organisations like the IMF or World Bank. It is a positive statement.
Option C: 'The best policy measure to reduce inflation is a reduction in government expenditure.'
- The word 'best' is a value judgement. What is 'best' depends on one's criteria: is it speed, effectiveness, fairness, cost, or political feasibility? Different economists might disagree based on their values or theoretical perspectives. This statement cannot be proven true or false by evidence alone — it is a normative statement.
Option D: 'The United States of America is the country with the highest military expenditure.'
- This is a factual claim about a ranking. It can be verified by checking data from sources like the Stockholm International Peace Research Institute (SIPRI) or the World Bank. It is a positive statement.
Therefore, only Option C is normative.
Key Takeaways
- The key to distinguishing positive from normative statements is testability. Positive statements can be tested against evidence; normative statements cannot.
- Watch for value-laden words: 'should', 'ought', 'best', 'worst', 'fair', 'unfair', 'too high', 'too low', 'good', 'bad'.
- Many economic disagreements are normative — they are about what policy should be, not about how the economy works.
- Even a statement that sounds like a fact can be normative if it contains an implicit value judgement (e.g., 'The unemployment rate is too high' — 'too high' is a value judgement).
Common Mistakes
- Confusing a statement about policy with a normative statement. A statement like 'A reduction in government expenditure will reduce inflation' is positive because it makes a testable prediction. The normative element is the judgement that this is the 'best' policy.
- Thinking that any statement about 'should' or 'ought' is automatically normative. While true, some statements about 'should' can be part of a positive analysis if they are conditional on a given goal (e.g., 'If the goal is to reduce inflation, then the government should reduce expenditure' — this is a positive statement about means-ends relationships). The key is whether the statement itself expresses a value judgement or a testable claim.
- Overthinking: Option B is clearly a factual statistic, and Option D is a factual ranking. Option A is a standard textbook definition. Option C is the only one that expresses an opinion.
Things to Be Careful About
- The word 'best' is a strong signal of a normative statement. Other common signals include 'should', 'ought', 'must', 'ideal', 'preferable', 'desirable'.
- Be careful with statements that mix fact and opinion. For example, 'Because inflation is 5%, the government should raise interest rates' contains a positive part ('inflation is 5%') and a normative part ('should raise interest rates'). The question asks for an example of a normative statement, so the whole statement must be normative.
- In multiple-choice questions, read all options before deciding. Sometimes more than one option might seem normative, but only one will be clearly so.
A public good must both be non-rivalrous in consumption and have the characteristic of non-excludability.
Which situation meets both of these conditions?
Options
A a former nationalised rail network which has been privatised
B a good that has an opportunity cost
C the building of a new toll road which charges all users the same toll
D the provision of street lighting which improves a locality
Answer
A public good must be both non-rivalrous (one person's consumption does not reduce availability for others) and non-excludable (it is impossible or prohibitively costly to prevent anyone from consuming it).
- A – A privatised rail network is excludable (ticket barriers) and rivalrous (a seat taken by one passenger is not available to another).
- B – All economic goods have an opportunity cost; this is not a defining characteristic of a public good.
- C – A toll road is excludable (only those who pay the toll can use it).
- D – Street lighting is non-rivalrous (one person benefiting from the light does not reduce the light for others) and non-excludable (it is impractical to prevent anyone in the locality from receiving the light).
Therefore, D is the correct answer.
D
Background Concept
A public good is defined by two characteristics:
- Non-rivalry – consumption by one individual does not reduce the quantity or quality available for others. For example, a lighthouse beam: one ship using it does not diminish the light for another.
- Non-excludability – once the good is provided, it is impossible or prohibitively expensive to prevent anyone from consuming it, even if they have not paid. For example, national defence protects all residents regardless of contribution.
Goods that satisfy both conditions are called pure public goods. Goods that satisfy only one condition are called quasi-public goods (e.g., a toll road is excludable but non-rivalrous until congestion occurs). Goods that satisfy neither are private goods.
Understanding the Question
The question asks which of four situations meets both conditions of a public good. The stem reminds us that a public good must be both non-rivalrous and non-excludable. Each option describes a different type of good or service. We must test each against the two criteria.
Approach
For each option, ask two questions:
- Is it non-rivalrous? (Does one person's use reduce availability for others?)
- Is it non-excludable? (Can people be prevented from using it?)
Only if both answers are 'yes' is it a public good.
Step-by-Step Reasoning
Option A – a former nationalised rail network which has been privatised
- Rivalry? Yes. A train seat taken by one passenger is not available for another. At peak times, the service is congested, so consumption is rivalrous.
- Excludability? Yes. Ticket barriers and conductors can exclude non-payers.
- Conclusion: Not a public good.
Option B – a good that has an opportunity cost
- Rivalry? Not necessarily. Opportunity cost applies to all scarce goods, but a public good can also have an opportunity cost (e.g., resources used for street lighting could have been used for schools). This option does not test the two defining characteristics.
- Excludability? Not addressed.
- Conclusion: Irrelevant to the definition of a public good.
Option C – the building of a new toll road which charges all users the same toll
- Rivalry? Up to a point, non-rivalrous – one car using the road does not reduce space for others until congestion occurs. But at peak times it becomes rivalrous. However, the key issue is excludability.
- Excludability? Yes. Toll booths or electronic charging can exclude non-payers.
- Conclusion: Not a public good because it is excludable.
Option D – the provision of street lighting which improves a locality
- Rivalry? No. One person walking under a street light does not reduce the light for another. The light is a non-rivalrous benefit.
- Excludability? No. It is impractical to prevent anyone in the locality from receiving the light. Even if a resident does not pay local taxes, they still benefit from the street lighting.
- Conclusion: Meets both conditions – a pure public good.
Key Takeaways
- A pure public good must satisfy both non-rivalry and non-excludability.
- Private goods are rivalrous and excludable.
- Quasi-public goods satisfy only one condition (e.g., a toll road is excludable but non-rivalrous until congested).
- Opportunity cost is a feature of all scarce goods, not a defining characteristic of public goods.
Common Mistakes
- Confusing a merit good (e.g., education) with a public good. Merit goods are under-consumed due to imperfect information, but they are rivalrous and excludable.
- Thinking that a good provided by the government is automatically a public good. Many government-provided goods (e.g., healthcare, education) are private goods.
- Assuming that non-rivalry alone is sufficient – both conditions must hold.
Things to Be Careful About
- Read the question carefully: it asks for a situation that meets both conditions.
- Do not confuse 'public good' with 'good provided by the public sector'.
- Remember that excludability is about the possibility of exclusion, not whether exclusion is actually practised. Street lighting is non-excludable because it is impractical to exclude anyone, even if the local council wanted to.
What is not a characteristic of a planned economy?
Options
A Consumers have limited influence on what is produced.
B Profit is the motive for increasing output.
C Resources are owned by the government.
D There is limited competition in the market.
Answer
In a planned economy, the government makes all decisions about what, how and for whom to produce. Profit is not the motive for increasing output; instead, production targets are set by central planners. Therefore, option B is not a characteristic of a planned economy.
B
B
Background Concept
A planned economy (or command economy) is one in which the government or central authority makes all major decisions about resource allocation and production. The government owns most of the resources (land, capital, and often labour is directed) and decides what goods and services are produced, how they are produced, and who receives them. In contrast, a market economy relies on the price mechanism and profit motive to guide production, with consumers' preferences influencing what is produced.
Understanding the Question
The question asks: "What is not a characteristic of a planned economy?" This means we must identify the option that does NOT describe a feature typical of a planned economy. The options are:
- A: Consumers have limited influence on what is produced.
- B: Profit is the motive for increasing output.
- C: Resources are owned by the government.
- D: There is limited competition in the market.
We need to evaluate each option against the known characteristics of a planned economy.
Approach
We will review each option in turn:
- Option A: In a planned economy, consumers' preferences are not the main driver; the government decides what to produce. So limited consumer influence is a characteristic.
- Option B: In a planned economy, profit is not the motive for increasing output. The government sets production targets, and firms are not profit-driven. Therefore, this is NOT a characteristic.
- Option C: Government ownership of resources is a key feature of a planned economy. So this is a characteristic.
- Option D: In a planned economy, there is typically only one producer (the state) for many goods, so competition is limited or absent. So this is a characteristic.
Thus, the correct answer is B.
Step-by-Step Reasoning
- Recall the definition of a planned economy: central planning, government ownership, production targets, no profit motive, limited consumer sovereignty, and limited competition.
- Evaluate each option:
- A: "Consumers have limited influence on what is produced." This is true because the government decides what to produce, not consumer demand. So it is a characteristic.
- B: "Profit is the motive for increasing output." In a planned economy, the motive for increasing output is to meet plan targets, not to earn profit. Profit is the motive in a market economy. Therefore, this is NOT a characteristic.
- C: "Resources are owned by the government." This is a fundamental characteristic. So it is a characteristic.
- D: "There is limited competition in the market." In a planned economy, the government is the single producer, so there is no competition. So it is a characteristic.
- Since the question asks for what is NOT a characteristic, option B is the correct answer.
Key Takeaways
- Planned economies are characterised by government ownership, central planning, limited consumer sovereignty, and absence of profit motive.
- Market economies rely on profit motive, consumer sovereignty, and competition.
- When answering "not a characteristic" questions, it is helpful to list the features of the system and then check each option.
Common Mistakes
- Confusing features of planned and market economies: e.g., thinking profit motive exists in a planned economy because firms still produce goods. Actually, profit is not the motive; it is an outcome of meeting targets sometimes, but not the driving force.
- Misreading the question: missing the word "not" and selecting a characteristic instead of the non-characteristic. Always read the question carefully.
Things to Be Careful About
- Ensure you understand the command word: "What is not a characteristic" requires identifying the one that does not belong.
- Do not overthink: the answer is straightforward based on textbook definitions.
- In multiple-choice questions, eliminate the options that are clearly true characteristics, and the remaining one is the answer.
A student chooses to study for a degree in engineering at university rather than take a job working as an apprentice engineer. The apprenticeship lasts five years and involves training while working.
What will decrease the opportunity cost of this choice?
Options
A a decrease in the wages paid to apprentice engineers
B a decrease in the number of students studying engineering degrees
C a decrease in the number of top grade engineering degrees awarded
D a decrease in the length of an engineering apprenticeship to four years
Answer
The opportunity cost of studying for a degree is the next best alternative forgone, which is the apprenticeship. A decrease in the wages paid to apprentice engineers reduces the benefit of the next best alternative, thereby decreasing the opportunity cost of choosing the degree.
Answer
A
A
Background Concept
Opportunity cost is the cost of the next best alternative forgone when a choice is made. It is not the total cost of the chosen option, but the value of what you give up. For the student, the choice is between studying for a degree (option 1) and taking an apprenticeship (option 2). The opportunity cost of choosing the degree is the value of the apprenticeship that is given up. This value includes the wages earned during the apprenticeship, the experience gained, and any future career benefits from the apprenticeship.
Understanding the Question
The question asks what will decrease the opportunity cost of choosing the degree. This means we need to find an option that makes the apprenticeship less attractive (i.e., reduces the value of the next best alternative). The student's choice is between two alternatives: the degree and the apprenticeship. The opportunity cost of the degree is the value of the apprenticeship. So, anything that reduces the value of the apprenticeship will reduce the opportunity cost of the degree.
Approach
We evaluate each option to see if it reduces the value of the apprenticeship (the next best alternative).
- Option A: A decrease in wages paid to apprentice engineers. This directly reduces the financial benefit of the apprenticeship, making it less valuable. This would decrease the opportunity cost of the degree.
- Option B: A decrease in the number of students studying engineering degrees. This does not affect the value of the apprenticeship. It might affect the degree's value (e.g., more job opportunities for graduates), but that is not the opportunity cost. The opportunity cost is about the forgone alternative, not the chosen one.
- Option C: A decrease in the number of top grade engineering degrees awarded. This does not affect the value of the apprenticeship. It might affect the degree's value (e.g., a degree becomes more prestigious), but again, that is not the opportunity cost.
- Option D: A decrease in the length of an engineering apprenticeship to four years. This makes the apprenticeship shorter, which could be seen as more attractive (less time commitment). This would increase the opportunity cost of the degree, not decrease it.
Step-by-Step Reasoning
- Identify the choice: The student chooses the degree over the apprenticeship.
- Identify the next best alternative: The apprenticeship.
- Define the opportunity cost of the degree: The value of the apprenticeship that is given up.
- Analyze each option:
- A: Lower wages for apprentices means the apprenticeship is less valuable. Therefore, the opportunity cost of the degree is lower. This is correct.
- B: Fewer students studying degrees does not change the value of the apprenticeship. The opportunity cost remains the same.
- C: Fewer top grade degrees awarded does not change the value of the apprenticeship. The opportunity cost remains the same.
- D: A shorter apprenticeship makes it more attractive (less time, possibly earlier full-time work). This increases the value of the next best alternative, so the opportunity cost of the degree increases.
Key Takeaways
- Opportunity cost is always about the next best alternative, not the chosen option.
- To decrease the opportunity cost of a choice, you must make the next best alternative less attractive.
- Changes that affect the chosen option (like the degree's prestige or number of graduates) do not change the opportunity cost of choosing it.
Common Mistakes
- Confusing opportunity cost with the cost of the chosen option: Some students might think that a decrease in the number of top grade degrees (Option C) makes the degree less valuable, thus reducing its opportunity cost. But opportunity cost is about the forgone alternative, not the chosen one.
- Thinking that making the chosen option more attractive reduces its opportunity cost: This is a common error. Making the degree more attractive (e.g., more job prospects) does not change the value of what is given up (the apprenticeship).
- Misinterpreting the effect of a shorter apprenticeship: A shorter apprenticeship (Option D) makes it more attractive, so the opportunity cost of the degree increases, not decreases.
Things to Be Careful About
- Always focus on the next best alternative when calculating opportunity cost.
- Read the question carefully: it asks what will decrease the opportunity cost. This means we are looking for a change that makes the forgone alternative less valuable.
- Do not confuse the value of the chosen option with the opportunity cost. They are distinct concepts.
The diagram shows a production possibility curve (PPC) for a country that produces two goods, X and Y. The initial PPC is given by ST.
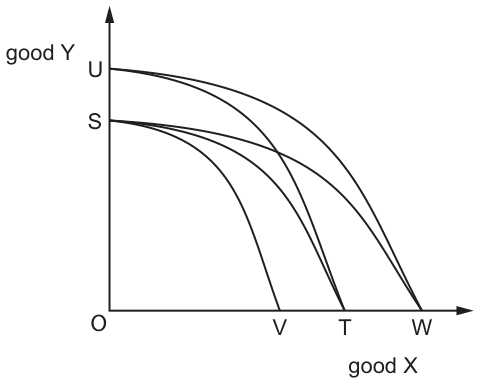
What is the effect on the PPC when the productivity of workers producing good X increases?
Options
A The PPC shifts from ST to SV.
B The PPC shifts from ST to SW.
C The PPC shifts from ST to UT.
D The PPC shifts from ST to UW.
Working
A production possibility curve (PPC) shows the maximum possible output combinations of two goods an economy can produce when all resources are fully and efficiently employed. The intercept of the PPC on the horizontal (good X) axis represents the maximum output of X achievable if all resources are devoted to X production. An increase in the productivity of workers producing good X raises the maximum output of X, so this intercept shifts to the right (further from the origin). The intercept on the vertical (good Y) axis remains unchanged, as the productivity of workers producing Y is unaffected. The initial PPC is ST, with S the Y intercept and T the X intercept. The only curve with the same Y intercept S and a rightward-shifted X intercept W is SW.
Answer
B
B
Background Concept
A production possibility curve (PPC, also called a production possibility frontier, PPF) is a core macroeconomic diagram that illustrates the trade-offs an economy faces when allocating its scarce resources between the production of two different goods or services. The curve is typically drawn concave to the origin, reflecting the law of increasing opportunity cost: as more of one good is produced, the opportunity cost (the amount of the other good that must be sacrificed) rises, because resources are not perfectly adaptable between the two goods.
The two intercepts of the PPC are of particular importance: the intercept on the vertical axis (for good Y in this diagram) shows the maximum output of Y the economy can produce if it devotes all its resources to Y production, while the intercept on the horizontal axis (for good X) shows the maximum output of X if all resources are devoted to X production. A shift of the entire PPC outward (away from the origin) represents an increase in the economy's productive capacity (economic growth), which can be caused by an increase in the quantity of resources (e.g. a larger labour force, more capital stock), an improvement in the quality of resources (e.g. better education and training for workers), or technological progress that makes production more efficient. A shift inward represents a reduction in productive capacity.
Understanding the Question
This is a 1-mark multiple-choice question that tests understanding of what causes a PPC to shift. The diagram shows an initial PPC labelled ST, where S is the intercept on the good Y axis (maximum Y output) and T is the intercept on the good X axis (maximum X output). The question asks what happens to the PPC if the productivity of workers producing good X increases. Productivity here refers to output per worker: a rise in X worker productivity means each worker assigned to X production can produce more X than before, with the same amount of labour resources. The task is to select the option that correctly shows the new PPC after this change.
Approach
To solve this, we apply the standard logic of PPC shifts:
- First, identify what the change affects: higher productivity of X workers increases the maximum possible output of X, so the intercept of the PPC on the good X axis will move outward (to the right, further from the origin).
- Second, identify what does not change: the productivity of workers producing good Y is unchanged, so the maximum possible output of Y (the Y-axis intercept) stays exactly the same.
- Match this description to the options: the correct new PPC must have the same Y intercept as the original ST (point S) and a rightward-shifted X intercept (further from the origin than T).
Step-by-Step Reasoning
Let us evaluate each option in turn to confirm the correct answer:
- Option A (shift to SV): The curve SV has the same Y intercept S, but its X intercept is V, which is to the left of T (closer to the origin). This would mean maximum X output has fallen, which is the opposite of what happens when X worker productivity rises. This option is incorrect.
- Option B (shift to SW): The curve SW has the same Y intercept S (so maximum Y output is unchanged, as expected since Y worker productivity is unaffected) and its X intercept is W, which is to the right of T (further from the origin). This matches the effect of higher X worker productivity: maximum X output increases, maximum Y output stays the same. This option is correct.
- Option C (shift to UT): The curve UT has a higher Y intercept U (so maximum Y output has increased) and the same X intercept T. This would be the result if the productivity of workers producing good Y increased, not good X. This option is incorrect.
- Option D (shift to UW): The curve UW has a higher Y intercept U and a rightward-shifted X intercept W. This would only be correct if the productivity of workers producing BOTH good X and good Y increased, which is not the case in the question. This option is incorrect.
The only correct answer is therefore B.
Key Takeaways
- The intercepts of a PPC represent the maximum output of each good when all resources are devoted to that good's production.
- A change in the productivity of workers producing one good only affects the intercept on that good's axis: higher productivity shifts the intercept outward (away from the origin), lower productivity shifts it inward (towards the origin).
- The intercept on the axis of the other good remains unchanged if its workers' productivity is unaffected.
- An outward shift of the entire PPC represents economic growth (increased productive capacity) for the good whose productivity has risen.
Common Mistakes
- Confusing which intercept changes: Some students incorrectly assume a productivity increase in X shifts the Y intercept, but this is only true if Y worker productivity rises.
- Getting the direction of the shift wrong: Higher productivity increases maximum output, so the intercept moves away from the origin, not towards it. Selecting an option with a leftward-shifted X intercept (like SV) is a common error.
- Selecting an option that shifts both intercepts: This would only be correct if productivity of both goods' workers increased, which is not stated in the question.
Things to Be Careful About
- Always match the axis labels to the goods: in this diagram, good X is on the horizontal axis, so its maximum output is shown by the x-axis intercept, while good Y is on the vertical axis, so its maximum output is the y-axis intercept.
- Do not confuse a shift of the PPC with a movement along the PPC: a movement along the curve represents a reallocation of existing resources between the two goods, while a shift of the entire curve represents a change in the economy's overall productive capacity.
- The concave shape of the PPC remains unchanged in this scenario, as the law of increasing opportunity cost still applies; only the position of the X intercept changes.
What is consumer surplus?
Options
A the amount of a consumer’s income less the amount paid in income tax
B the amount of a consumer’s income less the amount paid for goods and services
C the amount of a consumer’s income received in bonuses and overtime pay
D the amount a consumer is willing to pay for a product less the amount actually paid
Reasoning
Consumer surplus is the difference between the price a consumer is willing to pay for a product and the actual price paid. It measures the net benefit gained from buying at the market price. Option D correctly captures this definition. Options A, B, and C refer to disposable income or income after consumption, which are not the same as consumer surplus.
Answer
D
D
Background Concept
Consumer surplus is a microeconomic concept that measures the welfare gain consumers receive when they purchase a product for less than the maximum price they would be willing to pay. It is derived from the demand curve: each point on the demand curve shows the willingness to pay for the next unit. The area under the demand curve and above the market price represents total consumer surplus. This surplus arises because consumers value the product more highly than the price they actually pay, reflecting a net benefit from trade.
Understanding the Question
The question asks for the correct definition of consumer surplus. Four options are given, only one of which matches the standard economic definition. Options A, B, and C all relate to a consumer’s income minus some deduction, which are income-based concepts, not consumer surplus. Option D correctly references the difference between willingness to pay and actual payment.
Approach
Recall the precise definition of consumer surplus from economic theory. Examine each option against that definition. Eliminate any option that describes disposable income or after-expenditure income, as those are not consumer surplus. The correct option should mention willingness to pay and actual price paid.
Step-by-Step Reasoning
- Option A: “the amount of a consumer’s income less the amount paid in income tax” – This is disposable (post-tax) income. It is a flow of funds available for spending, not a measure of surplus from a transaction. Therefore incorrect.
- Option B: “the amount of a consumer’s income less the amount paid for goods and services” – This is savings (or after-consumption income). Again, it is an income-based concept, not consumer surplus. Incorrect.
- Option C: “the amount of a consumer’s income received in bonuses and overtime pay” – This describes additional earnings, part of income. Not consumer surplus. Incorrect.
- Option D: “the amount a consumer is willing to pay for a product less the amount actually paid” – This matches the precise economic definition of consumer surplus. For any unit purchased, the consumer gains the difference between the maximum they would pay (reservation price) and the market price. Summed over all units, this equals consumer surplus. Correct.
Thus option D is the answer.
Key Takeaways
- Consumer surplus is a welfare measure derived from the demand side of the market.
- It is defined as the difference between willingness to pay and actual expenditure.
- Do not confuse consumer surplus with income, disposable income, savings, or earnings.
- Understanding this concept is fundamental for analysing market efficiency, the impact of price changes, and the effects of policy interventions like taxes or subsidies.
Common Mistakes
- Confusing consumer surplus with “consumer income” or “disposable income” – these are different concepts.
- Misremembering the definition as “the amount paid for a product” or “the total expenditure”.
- Thinking consumer surplus applies only to luxury goods; it exists for any good where the consumer’s willingness to pay exceeds the market price.
Things to Be Careful About
- The definition explicitly uses “willing to pay”, not “able to pay”. Willingness reflects subjective valuation.
- Consumer surplus is measured in monetary units (e.g., dollars) but is a net benefit, not a stock of money.
- In a diagram, consumer surplus is the area below the demand curve and above the price line; ensure correct labeling of axes and areas.
The diagram shows a market supply curve (S).
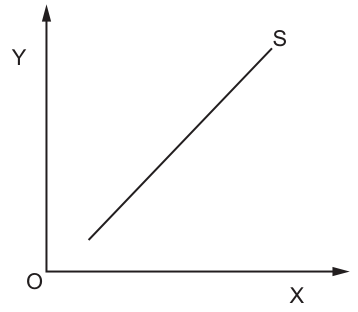
What is measured on the X-axis and the Y-axis?
Options
| X-axis | Y-axis | |
|---|---|---|
| A | quantity | income |
| B | quantity | price |
| C | price | income |
| D | income | quantity |
Reasoning
The diagram displays a curve labelled S, which denotes a supply curve. In economics, the universal convention for drawing demand and supply diagrams is to place price on the vertical axis and quantity on the horizontal axis. Therefore, the X-axis measures quantity and the Y-axis measures price.
Answer
B
B
Background Concept
In economics, supply and demand diagrams are used to illustrate how markets operate. The supply curve (S) shows the positive relationship between the price of a good and the quantity that producers are willing and able to supply. By standard convention, the variable that is determined independently (price) is placed on the vertical axis, while the variable that responds to it (quantity) is placed on the horizontal axis. This convention is used consistently for both demand and supply curves.
Understanding the Question
The question presents a graph with a straight-line curve labelled S, sloping upwards from left to right. The horizontal axis is labelled X and the vertical axis is labelled Y. The task is to identify what economic variable is measured on each axis. The options include quantity, price, and income. Since the curve is specifically labelled S (supply), income is not relevant here; the axes must represent the two variables plotted in a supply diagram: price and quantity.
Approach
To answer this, recall the standard labelling of economic graphs:
- Vertical axis (Y-axis): Price
- Horizontal axis (X-axis): Quantity
This applies to both demand and supply curves. The upward slope of curve S confirms it is a supply curve, not a demand curve (which would slope downward). Match this convention to the options provided.
Step-by-Step Reasoning
- The diagram shows a line labelled S. In economics, S is the standard abbreviation for supply.
- A supply curve illustrates how quantity supplied varies with price. It is upward sloping because higher prices incentivise producers to supply more.
- The universal convention in economics is that the vertical axis (Y-axis) represents price and the horizontal axis (X-axis) represents quantity. This is true for both demand and supply diagrams.
- Applying this convention to the diagram: the X-axis measures quantity and the Y-axis measures price.
- Comparing with the options, this matches option B: X-axis = quantity, Y-axis = price.
- Option A is incorrect because income is not plotted on a basic supply curve diagram. Option C is incorrect because it reverses the axes and includes income. Option D is incorrect because it reverses the axes.
Key Takeaways
- Always remember the standard convention: Price goes on the Y-axis (vertical) and Quantity goes on the X-axis (horizontal) for demand and supply diagrams.
- The label S indicates a supply curve, which slopes upward from left to right.
- Do not confuse this with income, which is not an axis on a simple market supply diagram.
Common Mistakes
- Confusing the axes by placing price on the X-axis and quantity on the Y-axis. This is a common error but contradicts standard economic graphing conventions.
- Selecting options involving income. Income is relevant to demand curves (as a determinant of demand) but is not the variable measured on the axes of a basic supply diagram.
- Confusing supply (S) with demand (D). A demand curve slopes downward; the curve in the diagram slopes upward, confirming it is supply.
Things to Be Careful About
- The diagram uses generic labels X and Y rather than P and Q, but the convention remains unchanged.
- The curve starts from the Y-axis (intercept), which is typical for supply curves where quantity supplied is zero at very low prices.
- Ensure you read the question carefully: it asks what is measured on the axes, not what shifts the curve or what the curve represents in terms of behaviour.
The diagram shows the demand curve for a product.
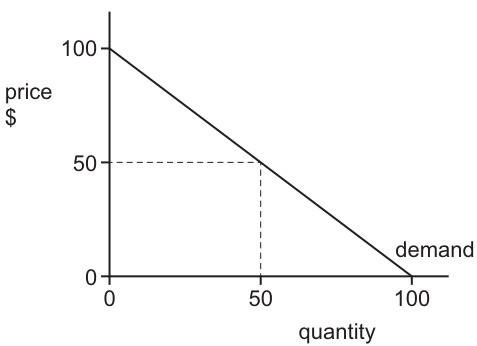
What is the price at which the price elasticity of demand is unit elastic?
Options
A $0
B $50
C $100
D every price along the demand curve
Answer
Price elasticity of demand (PED) is unit elastic (PED = 1) at the midpoint of a straight-line demand curve. The demand curve in Fig. 8.1 is a straight line running from a price of $100 (where quantity is 0) to a price of $0 (where quantity is 100). Its midpoint is at a price of $50 and a quantity of 50. At this point, total revenue is maximised and PED equals 1. Therefore, the price at which PED is unit elastic is $50.
B
B
Background Concept
Price elasticity of demand (PED) measures the responsiveness of quantity demanded to a change in price, calculated as the percentage change in quantity demanded divided by the percentage change in price. When PED equals 1, demand is described as unit elastic, meaning the percentage change in quantity exactly matches the percentage change in price, and total revenue (price x quantity) does not change when price changes.
A fundamental property of a straight-line (linear) demand curve is that PED is not constant along it, even though the slope is constant. Elasticity varies because it depends on the ratio of price to quantity (P/Q) as well as the slope:
- At the price-axis intercept (where Q = 0), PED is perfectly elastic (infinity).
- At the quantity-axis intercept (where P = 0), PED is perfectly inelastic (zero).
- At the exact midpoint of the curve, PED is precisely equal to 1 (unit elastic).
- Above the midpoint (higher prices, lower quantities), demand is elastic (PED > 1).
- Below the midpoint (lower prices, higher quantities), demand is inelastic (PED < 1).
This can also be verified using the total revenue test: total revenue is maximised at the point of unit elasticity. Moving away from the midpoint in either direction causes total revenue to fall.
Understanding the Question
The question presents a linear demand curve (Fig. 8.1) with a vertical intercept at price $100 and a horizontal intercept at quantity 100. It asks for the specific price at which price elasticity of demand is unit elastic. The options are $0, $50, $100, or every price along the curve.
This is a knowledge-and-application question. It tests whether the candidate knows that unit elasticity on a linear demand curve occurs at the midpoint, and can identify that midpoint from the diagram.
Approach
The solution requires applying the midpoint rule for linear demand curves:
- Identify the two intercepts: P = $100 and P = $0.
- Find the midpoint: ($100 + $0) / 2 = $50.
- Confirm that at this midpoint, PED = 1.
The distractor options test common misconceptions: option D confuses constant slope with constant elasticity; option C confuses the price-axis intercept (where PED is infinite) with unit elasticity; option A confuses the quantity-axis intercept (where PED is zero) with unit elasticity.
Step-by-Step Reasoning
-
Identify the curve's endpoints: The diagram shows a straight-line demand curve starting at price $100 on the vertical axis (quantity 0) and ending at quantity 100 on the horizontal axis (price $0).
-
Apply the midpoint rule: For any linear demand curve, unit price elasticity occurs at the midpoint. The midpoint price is halfway between the highest and lowest prices: ($100 + $0) / 2 = $50. The corresponding quantity is 50.
-
Verify with total revenue: At P = $50 and Q = 50, total revenue = $50 x 50 = $2,500. If price increases to $100, quantity falls to 0 and total revenue falls to $0. If price decreases to $0, quantity rises to 100 and total revenue also falls to $0. Since total revenue is maximised at P = $50, this confirms PED = 1 at this point.
-
Select the correct option: The price is $50, which corresponds to option B.
Key Takeaways
- PED varies along a straight-line demand curve; it is not constant.
- Unit elasticity (PED = 1) occurs at the exact midpoint of a linear demand curve.
- The midpoint can be found by halving the price range (or quantity range) of the curve.
- The total revenue test provides a practical check: maximum total revenue coincides with unit elasticity.
Common Mistakes
- Choosing option D: Believing that PED is the same at every point on a straight-line demand curve. This confuses the constant slope of the curve with constant elasticity. Because elasticity is a ratio (P/Q), it changes as you move along the curve even if the slope is unchanged.
- Choosing option C ($100): Confusing the vertical intercept with unit elasticity. At P = $100, quantity demanded is zero, making the P/Q ratio infinite; PED is perfectly elastic, not unit elastic.
- Choosing option A ($0): Confusing the horizontal intercept with unit elasticity. At P = $0, PED is zero (perfectly inelastic) because a price change from zero has no meaning in the elasticity formula.
- Ignoring the diagram's midpoint marking: The diagram explicitly shows dashed lines at P = $50 and Q = 50. Failing to use this visual cue can lead to unnecessary calculation errors.
Things to Be Careful About
- Slope versus elasticity: The slope of a linear demand curve is constant (rise over run), but elasticity is (P/Q) x (1/slope). Since P/Q changes continuously, elasticity must change. Never assume that a straight line means constant elasticity.
- Symmetry: In this question, the price and quantity intercepts are both 100, making the midpoint easy to identify. If the intercepts were different, the midpoint would still have PED = 1, but the coordinates would not be simple halves of the intercepts unless the curve is symmetric about the 45-degree line.
- Total revenue as a check: If you are unsure, calculate total revenue at different prices. The price where total revenue is highest is the point of unit elasticity.
Public transport in an economy has an income elasticity of demand of – 0.36.
What does this mean about public transport?
Options
A It is an inferior good.
B It is a necessity.
C It is a normal good.
D It has close substitutes.
Reasoning
Income elasticity of demand (YED) measures the responsiveness of quantity demanded to a change in income. A negative YED means that as income rises, the quantity demanded falls, and as income falls, the quantity demanded rises. This is the defining characteristic of an inferior good.
Answer
A
A
Background Concept
Income elasticity of demand (YED) is a measure of how the quantity demanded of a good responds to a change in consumers' income. It is calculated as:
YED = % change in quantity demanded / % change in income
The sign of YED indicates the type of good:
- Positive YED: as income rises, demand rises -> normal good.
- Negative YED: as income rises, demand falls -> inferior good.
The magnitude (absolute value) indicates whether the good is a necessity (YED between 0 and 1) or a luxury (YED > 1) for normal goods. For inferior goods, the magnitude is less relevant for classification, though a larger absolute value indicates a stronger negative response.
Understanding the Question
The question states: "Public transport in an economy has an income elasticity of demand of –0.36." The command is "What does this mean about public transport?" The answer choices offer four different interpretations. The key is to correctly interpret the negative sign: a negative YED identifies public transport as an inferior good. The value –0.36 also tells us that it is income inelastic (the absolute value is less than 1), but that is not the primary classification asked for in the options.
Approach
- Recall the definition of YED and the significance of its sign.
- Identify that a negative YED means the good is inferior.
- Check the options: A is "inferior good", B is "necessity" (a necessity would have positive YED < 1), C is "normal good" (positive YED), D is "has close substitutes" (not directly inferred from YED).
- Select A.
Step-by-Step Reasoning
- YED = –0.36. The negative sign is crucial. It indicates that as income increases, the quantity demanded of public transport decreases. This is the opposite of what happens for normal goods.
- Inferior goods are defined as goods for which demand falls when income rises, and rises when income falls. Examples include public transport (as people may switch to private cars as they get richer), own-brand products, etc.
- Option A states "It is an inferior good." This matches the negative YED.
- Option B "It is a necessity." Necessities have positive YED between 0 and 1. A negative YED rules out a necessity.
- Option C "It is a normal good." Normal goods have positive YED. Negative YED contradicts this.
- Option D "It has close substitutes." This is not directly indicated by YED. The presence of close substitutes is more related to price elasticity of demand (PED) or cross elasticity (XED). YED does not tell us about substitutes.
- Therefore, the correct answer is A.
Key Takeaways
- The sign of income elasticity of demand is the primary way to classify goods as normal or inferior.
- A negative YED always indicates an inferior good, regardless of the magnitude.
- The magnitude of YED (for normal goods) indicates whether the good is a necessity (0<YED<1) or a luxury (YED>1).
- Do not confuse YED with other elasticities.
Common Mistakes
- Confusing the sign: students sometimes think a negative elasticity means the good is a necessity (because it is inelastic in absolute value). But the sign is about the direction of response to income, not the magnitude.
- Selecting "necessity" because the absolute value is less than 1: that is only relevant for normal goods. For inferior goods, the negative sign is the key.
- Thinking that YED tells about substitutes: that is a common confusion with cross elasticity of demand (XED).
Things to Be Careful About
- Always read the sign first. A negative YED immediately means inferior good.
- The magnitude of YED for inferior goods can be any negative number; it does not change the classification.
- In multiple-choice questions, the answer is often directly based on the sign, so do not overcomplicate.
- Remember that public transport is a classic example of an inferior good in many contexts (though it can be a normal good in some cases, but the given YED negative indicates inferior in this economy).
Which type of good is most suitable for a successful buffer stock scheme?
Options
| easy to produce | cheap to store | perishable | |
|---|---|---|---|
| A | yes | yes | yes |
| B | yes | no | no |
| C | no | yes | no |
| D | no | no | yes |
Reasoning
A buffer stock scheme aims to stabilise prices by buying when the price is low and selling when it is high. For a scheme to be successful, the good must be non-perishable (so it can be stored without spoiling), cheap to store (so storage costs do not outweigh the price benefit), and not too easy to produce (otherwise the scheme would be flooded with supply, making it impossible to support prices).
Option A: easy to produce, cheap to store, perishable – perishability rules it out.
Option B: easy to produce, not cheap to store, not perishable – easy to produce makes the scheme unsustainable, and high storage costs reduce net benefit.
Option C: not easy to produce, cheap to store, not perishable – all three conditions are met.
Option D: not easy to produce, not cheap to store, perishable – perishable and high storage costs make it unsuitable.
Thus, the correct answer is C.
Answer
C
C
Background Concept
A buffer stock scheme is a government intervention to stabilise the price of a commodity (often agricultural) by setting a target price range. The scheme buys the good when market price is below the floor, adding to stocks, and sells from stocks when market price is above the ceiling. For the scheme to be viable, the good must be durable (non-perishable) so that it can be stored for long periods without spoiling. Storage costs must be low so that the cost of holding the stock does not exceed the benefits of price stabilisation. Additionally, the good should not be too easy to produce; if production can be increased rapidly and cheaply, the scheme would be inundated with supply whenever it tries to support prices, making it financially unsustainable. The scheme typically works best for storable commodities like grains, metals, or coffee.
Understanding the Question
The question presents a table with four options (A, B, C, D) each describing a good in terms of three characteristics: 'easy to produce', 'cheap to store', and 'perishable'. The student must identify which combination of these characteristics describes a good that is most suitable for a successful buffer stock scheme. The task is to match the theoretical requirements of a buffer stock scheme to the given yes/no entries.
Approach
Recall the three criteria for a buffer stock good: non-perishable (so it can be stored), cheap to store (so storage costs are manageable), and not easy to produce (so the scheme is not overwhelmed by supply). Then evaluate each option against these criteria. The correct option will have 'no' for easy to produce, 'yes' for cheap to store, and 'no' for perishable.
Step-by-Step Reasoning
- Option A: yes (easy to produce), yes (cheap to store), yes (perishable). Perishable goods cannot be stored, so the scheme cannot hold stocks. Therefore A is unsuitable.
- Option B: yes (easy to produce), no (not cheap to store), no (not perishable). Easy to produce means the scheme would be flooded with supply when it tries to buy, making it impossible to support prices. Also, high storage costs reduce net benefit. So B is unsuitable.
- Option C: no (not easy to produce), yes (cheap to store), no (not perishable). This matches the ideal: supply is limited so the scheme can buy effectively, storage is cheap, and the good can be stored for long periods. This is the most suitable.
- Option D: no (not easy to produce), no (not cheap to store), yes (perishable). Perishable and high storage costs make it unsuitable, despite not being easy to produce.
Thus, only C meets all three criteria.
Key Takeaways
- Buffer stock schemes require a good that is durable, low-cost to store, and not easily producible.
- The ability to store the good is fundamental; without it, the scheme cannot operate.
- The question tests the application of economic theory to a practical policy problem.
Common Mistakes
- Thinking that 'easy to produce' is desirable because it ensures supply; but easy production undermines the scheme's ability to maintain a floor price.
- Confusing 'perishable' with 'non-perishable' – many students forget that perishability makes storage impossible.
- Misreading the table: the 'yes'/'no' columns refer to the good's characteristics, not the desirability of those characteristics.
Things to Be Careful About
- Read the table carefully: each row is a combination of features for a hypothetical good.
- Remember that buffer stock schemes are typically used for primary commodities, which are often storable and have limited supply in the short run.
- The question asks for 'most suitable' – there may be only one option that fits all requirements.
The demand for electric vehicle batteries is derived from the demand for electric vehicles. To tackle climate change, a government subsidises producers of electric vehicles.
What are the likely effects of this subsidy on the price and sales of electric vehicle batteries?
Options
| price | sales | |
|---|---|---|
| A | decrease | decrease |
| B | decrease | increase |
| C | increase | decrease |
| D | increase | increase |
Reasoning
A subsidy to producers of electric vehicles shifts the supply curve for electric vehicles to the right. This lowers the equilibrium price of electric vehicles and raises the equilibrium quantity sold. Since the demand for electric vehicle batteries is derived from the demand for electric vehicles, the increase in sales of electric vehicles causes the demand for batteries to shift to the right. As a result, the equilibrium price of batteries increases and the equilibrium quantity (sales) of batteries increases.
Answer
D
D
Background Concept
This question tests the concept of derived demand — the demand for a factor of production or intermediate good that arises from the demand for the final good it helps produce. Here, electric vehicle batteries are an input into electric vehicles, so any change in the market for electric vehicles will affect the market for batteries.
It also tests the effect of a subsidy — a payment by the government to producers that reduces their costs. A subsidy shifts the supply curve of the subsidised good to the right (an increase in supply) because producers are willing to supply more at every price. This typically lowers the market price and increases the quantity traded.
Understanding the Question
The government gives a subsidy to producers of electric vehicles. The question asks for the likely effects on the price and sales (quantity) of electric vehicle batteries. Because the battery market is linked to the electric vehicle market through derived demand, we must trace the chain of causation from the subsidy to the EV market, then to the battery market.
Approach
- Identify the initial change: the subsidy reduces the cost of producing electric vehicles. This is a supply-side shock specific to the EV market.
- Determine the effect on the EV market: supply curve shifts right, price falls, quantity rises.
- Determine the effect on the battery market: because batteries are used in EVs, the increased quantity of EVs raises the demand for batteries. This shifts the battery demand curve right, increasing both price and quantity of batteries.
The correct option is the one that shows price increase and sales increase for batteries.
Step-by-Step Reasoning
Step 1: Effect on the electric vehicle market
- A subsidy reduces the cost of producing each EV. The supply curve for EVs shifts to the right (S1 to S2).
- At the original price, there is now excess supply of EVs, so the price falls.
- Consumers respond to the lower price by buying more EVs. The equilibrium quantity of EVs rises.
- So in the EV market: price falls, quantity rises.
Step 2: Effect on the battery market
- The demand for EV batteries is derived from the demand for EVs. More EVs sold means more batteries are needed (as components and for replacement).
- The demand curve for batteries shifts to the right (D1 to D2).
- With the supply of batteries unchanged in the short run, this shift raises the equilibrium price of batteries and increases the equilibrium quantity (sales).
Step 3: Combine
- Price of batteries: increases (from the demand shift).
- Sales (quantity) of batteries: increases.
- This matches option D.
Key Takeaways
- Derived demand links markets for inputs to markets for final goods. Changes in the final good market cause shifts in the input market.
- A subsidy to producers lowers costs, increases supply, lowers price, and raises quantity in the subsidised market. The effects then ripple through to related markets.
- When tracing effects, always start with the direct impact on the market being subsidised/taxed, then move to the derived or related market.
Common Mistakes
- Confusing the direction of change: some students think a subsidy always leads to lower prices in all related markets. But here, while EV prices fall, battery prices rise because of increased demand.
- Forgetting derived demand: focusing only on the subsidy and the EV market without considering the battery market.
- Mixing up supply and demand shifts: the subsidy shifts supply in the EV market, but the effect on batteries is a demand shift, not a supply shift.
- Thinking the subsidy applies directly to batteries: the subsidy is on EVs, not on batteries, so the battery supply curve does not shift.
Things to Be Careful About
- Read the question carefully: it asks about price and sales of batteries, not of EVs.
- Remember that derived demand means the demand for the input moves in the same direction as the demand for the output. Here, increased EV sales lead to increased battery demand.
- In a multiple-choice context, work through the reasoning step by step. Eliminate options that get the direction wrong for either price or sales.
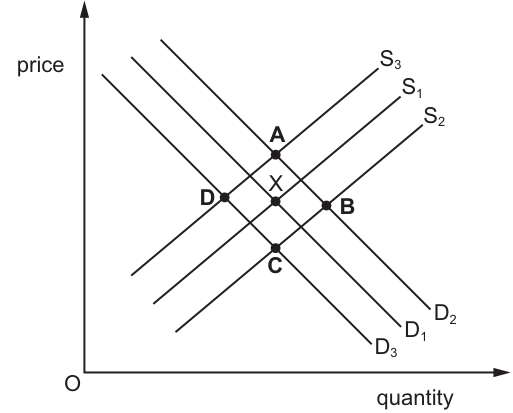
The diagram shows the market for a demerit good. The initial equilibrium is at point X.
What will be the new equilibrium if the government imposes a unit tax on this demerit good and successfully informs consumers of its harmful effects?
Options
A point A on Fig. 12.1
B point B on Fig. 12.1
C point C on Fig. 12.1
D point D on Fig. 12.1
Answer
A unit tax increases the cost of supplying the good, shifting the supply curve vertically upwards (to the left) from S1 to S3. Successfully informing consumers of the harmful effects of a demerit good reduces the quantity demanded at each price, shifting the demand curve to the left from D1 to D3. The new market equilibrium is at the intersection of the new supply curve S3 and the new demand curve D3, which is point D.
Answer
D
D
Background Concept
A demerit good is a good that is over-consumed in a free market because consumers underestimate its true social costs, often due to imperfect information. Examples include cigarettes and alcohol. Because of this over-consumption, the market equilibrium quantity exceeds the socially optimal level. The government may intervene using two main methods: (1) imposing a specific (unit) indirect tax to internalise the external cost and reduce supply, and (2) providing information to correct the information asymmetry and reduce demand. A unit tax shifts the supply curve vertically upwards by the amount of the tax, as producers need a higher price to supply any given quantity. A successful information campaign reduces consumer willingness to buy at each price, shifting the demand curve to the left (downwards).
Understanding the Question
The question presents a market for a demerit good initially in equilibrium at point X (where D1 meets S1). It asks for the new equilibrium after two simultaneous government actions: (i) a unit tax is imposed, and (ii) consumers are successfully informed of the harmful effects. The command word is implicit (identify/select), and the task is to apply knowledge of how taxes and information campaigns affect demand and supply curves for a demerit good, then read the correct intersection from the diagram.
Approach
- Identify the effect of a unit tax on supply: It raises marginal cost, so supply decreases (shifts left/up). From S1, this moves to S3.
- Identify the effect of an information campaign on demand for a demerit good: It makes consumers more aware of harm, so demand decreases (shifts left/down). From D1, this moves to D3.
- Find the intersection of the new supply curve (S3) and the new demand curve (D3). This is point D.
- Verify that no other combination matches both shifts simultaneously.
Step-by-Step Reasoning
- Initial position: The market starts at equilibrium X, where demand curve D1 intersects supply curve S1.
- Effect of the unit tax: A unit tax is a fixed amount per unit sold. This is a cost to the producer. At every level of output, the producer now requires a price that is higher by the amount of the tax to be willing to supply. Consequently, the supply curve shifts vertically upwards (or to the left). In the diagram, S3 lies to the left of S1, representing this decrease in supply. Therefore, the supply curve moves from S1 to S3.
- Effect of the information campaign: The good is a demerit good, meaning consumers typically over-value it relative to its true social cost because they are unaware of the full harm. If the government successfully informs them of these harmful effects, their perception of the good's utility falls. As a result, at any given price, consumers are willing and able to buy less. This is a decrease in demand, represented by a leftward (or downward) shift of the demand curve. In the diagram, D3 lies to the left of D1, representing this decrease in demand. Therefore, the demand curve moves from D1 to D3.
- New equilibrium: The new market equilibrium occurs where the new supply curve meets the new demand curve. The intersection of S3 and D3 is marked as point D on the diagram. At point D, both the quantity traded and the price are lower than at the original equilibrium X.
- Eliminating other options:
- Point A (S3 and D1) would result from the tax alone, with no change in demand.
- Point B (S1 and D2) would result from an increase in demand (e.g., a successful advertising campaign), which is the opposite of what an information campaign about harm would do.
- Point C (S1 and D3) would result from the information campaign alone, with no tax.
- Only point D reflects both the leftward supply shift (tax) and the leftward demand shift (information).
Key Takeaways
- A unit (specific) tax on a good shifts the supply curve vertically upwards (leftward), not the demand curve.
- For a demerit good, an information campaign that reveals harmful effects shifts the demand curve to the left (downward), not the supply curve.
- When both curves shift leftward, the new equilibrium is found at the intersection of the two new curves (S3 and D3), resulting in lower quantity and an ambiguous price change depending on the relative shifts, but in this diagram, the price at D is lower than at X.
- Always check that the chosen point reflects ALL the changes described in the question, not just one.
Common Mistakes
- Confusing the direction of the demand shift: Some students mistakenly believe that informing consumers of harm makes them want the good more (perhaps due to reactance), or they confuse demerit goods with merit goods. For a demerit good, negative information reduces demand.
- Confusing the direction of the supply shift: A tax is a cost of supply, so it reduces supply (shifts left/up). Students sometimes draw it as a shift downwards or to the right.
- Selecting a point that reflects only one change: For example, choosing point A (tax only) or point C (information only) instead of point D (both changes). The question explicitly states both policies are imposed.
- Misreading the diagram: Failing to notice which curve is which (e.g., confusing S2 with S3, or D2 with D3) leads to selecting the wrong intersection.
Things to Be Careful About
- Ensure you know which curve is which: S3 is the leftmost supply curve (highest cost), D3 is the leftmost demand curve (lowest demand).
- A unit tax is a specific tax, not an ad valorem tax, but both shift supply leftward/upward.
- The term "successfully informs" is crucial — it guarantees the demand curve shifts. If the information were ignored, demand would not shift.
- The question asks for the new equilibrium, which is always the intersection of the relevant supply and demand curves after all shifts have occurred.
To improve the health of people, a government puts a tax on the sale of drinks that contain sugar.
What are the likely effects of this tax on both the prices of the drinks that contain sugar and the price of sugar?
Options
| prices of drinks | price of sugar | |
|---|---|---|
| A | decrease | decrease |
| B | decrease | increase |
| C | increase | decrease |
| D | increase | increase |
Reasoning
The tax on sugary drinks increases the cost of production for drink producers, shifting the supply curve for drinks leftwards. This causes the equilibrium price of drinks to rise. The higher price reduces the quantity demanded of drinks, which in turn reduces the demand for sugar (a derived demand). The fall in demand for sugar shifts the demand curve for sugar leftwards, lowering the equilibrium price of sugar. Therefore, the price of drinks increases and the price of sugar decreases. This corresponds to option C.
Answer
C
C
Background Concept
An indirect tax, such as a specific tax on sugary drinks, is a tax levied on goods or services. It increases the cost of production for suppliers, shifting the supply curve leftwards (or upwards). This leads to a higher equilibrium price and a lower equilibrium quantity for the taxed good. The incidence of the tax (who bears the burden) depends on the price elasticities of demand and supply. In this question, the tax is specifically on drinks that contain sugar, not on sugar itself.
Derived demand is the demand for a factor of production or an input that arises from the demand for the final good it produces. Here, sugar is an input into sugary drinks. The demand for sugar is derived from the demand for those drinks. A change in the market for drinks therefore affects the market for sugar.
Understanding the Question
The question asks: what are the likely effects of a tax on sugary drinks on both the prices of those drinks and the price of sugar? It is a multiple-choice question with four combinations. The key is to trace the chain of causation: the tax directly affects the supply of drinks; the change in the drink market then affects the demand for sugar via derived demand. The correct answer must show the price of drinks rising (due to the tax) and the price of sugar falling (due to reduced demand for drinks). Option C gives exactly that.
Approach
Step 1: Analyse the effect of the tax on the drink market. The tax on drinks is a cost increase for producers, so the supply curve for drinks shifts left. This leads to a higher equilibrium price for drinks and a lower equilibrium quantity.
Step 2: Analyse the effect on the sugar market. Sugar is an input in the production of sugary drinks. The decrease in the quantity of drinks demanded (from step 1) reduces the demand for sugar (a derived demand). The demand curve for sugar shifts left, leading to a lower equilibrium price for sugar.
No diagram is necessary for this question, but it can be helpful to sketch two supply-and-demand diagrams: one for the drink market with a leftward supply shift, and one for the sugar market with a leftward demand shift.
Step-by-Step Reasoning
-
Effect on the drinks market: The government imposes a tax on each unit of sugary drink sold. This increases the cost of production for drink firms. At any given price, firms are now willing to supply less because the tax eats into their profit. The supply curve for drinks shifts to the left (from S to S_tax). The new equilibrium occurs at a higher price (P1) and a lower quantity (Q1) compared to the original equilibrium (P0, Q0). So the price of drinks rises.
-
Effect on the sugar market: The higher price of drinks reduces the quantity demanded of drinks (from Q0 to Q1). This means drink producers now need fewer inputs, including sugar. The demand for sugar falls because it is a derived demand: the demand for sugar depends on the demand for the final product (drinks). The demand curve for sugar shifts to the left (from D to D1). The new equilibrium in the sugar market shows a lower price of sugar (P_sugar1) and a lower quantity traded. So the price of sugar falls.
-
Conclusion: The price of drinks increases, and the price of sugar decreases. This matches option C.
Key Takeaways
- An indirect tax on a good raises its price and reduces its quantity.
- Derived demand connects the market for a final good to the market for its inputs.
- A fall in demand for a final good reduces the demand for its inputs, lowering input prices.
- This question tests the ability to trace a chain of cause and effect across two related markets.
Common Mistakes
- Confusing the direction of the tax effect: Some may think a tax on drinks raises the price of sugar because the tax is a cost that gets passed on to sugar producers. But the tax is on the drink, not on sugar. The effect on sugar is indirect through demand.
- Ignoring derived demand: A student might think the tax on drinks only affects the drink market and not the sugar market, leading to an incorrect choice like D (both increase) or A (both decrease).
- Assuming the tax is on sugar: The question says "tax on the sale of drinks that contain sugar," not a tax on sugar itself. Misreading leads to wrong conclusions.
- Failing to consider the reduction in quantity demanded: The tax increases the price of drinks, which reduces the quantity demanded. This reduction in quantity is the key link to the sugar market.
Things to Be Careful About
- Read the question carefully: the tax is on the drinks, not on the input.
- Distinguish between the primary market (drinks) and the secondary market (sugar).
- Remember that a tax on a good shifts the supply curve, not the demand curve.
- In the sugar market, it is the demand curve that shifts, not the supply curve (the tax does not affect sugar production costs directly).
- The chain of reasoning is: tax → supply shift in drinks → price of drinks rises → quantity of drinks falls → derived demand for sugar falls → price of sugar falls. Each link must be clear.
The income Gini coefficient of a country changes from 0.29 to 0.33 over time.
What might explain this change?
Options
A an increase in food and energy subsidies
B an increase in structural unemployment
C an increase in the national minimum wage
D an increase in the top rate of income tax
Answer
The Gini coefficient has risen from 0.29 to 0.33, indicating an increase in income inequality. An increase in structural unemployment means more workers are without jobs, losing their labour income, while those in work continue to earn. This widens the gap between high and low incomes, raising the Gini coefficient. Therefore, option B is correct.
B
Background Concept
The Gini coefficient is a measure of income (or wealth) inequality within a country. It ranges from 0 (perfect equality, where everyone has the same income) to 1 (perfect inequality, where one person has all the income). A higher coefficient means greater inequality. The question presents a change from 0.29 to 0.33, so inequality has increased.
Understanding the Question
The question asks which of four possible changes could explain an observed rise in the Gini coefficient. Each option is a policy or economic event. The task is to identify which one would likely increase income inequality. The Gini coefficient is sensitive to changes in the distribution of incomes, especially at the extremes.
Approach
For each option, think about its effect on the distribution of incomes:
- Does it make the rich richer or the poor poorer?
- Does it reduce the gap between high and low incomes, or widen it?
- Does it affect the incomes of the unemployed differently from those of the employed?
Only one option clearly widens the gap. The others either reduce inequality or have an ambiguous effect.
Step-by-Step Reasoning
Option A: an increase in food and energy subsidies
Subsidies lower the prices of essential goods. This benefits all consumers, but proportionally helps lower-income households more because they spend a larger share of their income on food and energy. This would reduce the real income gap, tending to lower the Gini coefficient, not raise it. So A is incorrect.
Option B: an increase in structural unemployment
Structural unemployment occurs when workers' skills do not match available jobs, often due to technological change or industrial decline. When structural unemployment rises, more people lose their jobs and their labour income falls to zero (or to lower welfare benefits). Meanwhile, those who remain employed continue to earn their wages. This widens the gap between the employed (who may have stable or rising incomes) and the unemployed (who have little or no labour income). The Gini coefficient rises because the bottom of the income distribution falls further behind. This matches the observed change. So B is correct.
Option C: an increase in the national minimum wage
A higher minimum wage raises the earnings of the lowest-paid workers. This directly reduces income inequality by boosting the bottom of the distribution. The Gini coefficient would fall, not rise. So C is incorrect.
Option D: an increase in the top rate of income tax
A higher top tax rate reduces the after-tax income of the highest earners. This reduces the gap between the rich and the rest, lowering the Gini coefficient. So D is incorrect.
Key Takeaways
- The Gini coefficient is a standard measure of inequality; a higher number means more inequality.
- Policies that help the poor (subsidies, minimum wage) or tax the rich (progressive taxes) reduce inequality.
- Events that hurt the poor disproportionately (like unemployment) increase inequality.
- Structural unemployment is particularly damaging because it is long-term and often leaves workers without income for extended periods.
Common Mistakes
- Confusing the direction of the Gini coefficient: thinking 0.33 is more equal than 0.29. Remember: higher = more unequal.
- Assuming that any government spending (like subsidies) always reduces inequality without considering who benefits most. Subsidies on necessities are progressive; subsidies on luxury goods would be regressive.
- Thinking that a minimum wage increase could cause unemployment and therefore increase inequality. While there is a theoretical debate, the direct effect of a higher minimum wage is to raise the incomes of the lowest paid, which reduces measured inequality. The question asks for the most likely explanation, and the direct effect dominates.
Things to Be Careful About
- The Gini coefficient is a summary statistic; it does not tell you why inequality changed, only that it did. You must link the policy to the distributional effect.
- Read the options carefully: "structural unemployment" is distinct from "cyclical unemployment" or "frictional unemployment". Structural unemployment is longer-lasting and more damaging to the incomes of the affected workers.
- The question is about income inequality, not about the overall level of economic welfare. A policy could be good for the economy but still increase inequality (e.g., trade liberalisation that benefits skilled workers but displaces unskilled ones).
What is an example of an injection into the circular flow of income in an open economy?
Options
A consumer spending on goods
B expenditure on a government construction project
C spending by households on holidays abroad
D repayment of loans to commercial banks
Answer
In an open economy, injections are additions to the circular flow of income that do not come from the domestic household sector. The three main injections are investment (I), government spending (G), and exports (X).
- Option A (consumer spending on goods) is consumption (C), which is part of the circular flow and not an injection.
- Option B (expenditure on a government construction project) is government spending (G), which is an injection.
- Option C (spending by households on holidays abroad) is imports (M), which is a leakage.
- Option D (repayment of loans to commercial banks) is a financial transaction that reduces the amount of money in the circular flow, acting as a leakage, not an injection.
Therefore, the correct answer is B.
Answer
B
B
Background Concept
The circular flow of income is a model that shows the flow of money between households and firms in an economy. In a simple closed economy without government, households provide factors of production to firms and receive income; they spend that income on goods and services produced by firms, creating a circular flow. However, this basic model is incomplete because not all income is spent on domestic goods, and there are additional sources of spending.
Injections are additions to the circular flow from outside the basic household-firm loop. They increase the total amount of money circulating. The three main injections are:
- Investment (I): spending by firms on capital goods (e.g., machinery, factories).
- Government spending (G): spending by the government on goods and services (e.g., infrastructure, public services).
- Exports (X): spending by foreigners on domestically produced goods and services.
Leakages (or withdrawals) are reductions from the circular flow – money that is taken out of the spending stream. The three main leakages are:
- Savings (S): income not spent on consumption.
- Taxes (T): income taken by the government.
- Imports (M): spending on goods and services produced abroad.
In equilibrium, injections = leakages: I + G + X = S + T + M.
Understanding the Question
The question asks for an example of an injection into the circular flow of income in an open economy (i.e., an economy that engages in international trade). The options include various transactions. We need to identify which one adds to the circular flow from outside the domestic household sector. The correct answer must be one of the standard injections: investment, government spending, or exports.
Approach
- Recall the definition of injections and the three types.
- Evaluate each option against this definition.
- Eliminate options that are leakages or not part of the circular flow model.
- Select the correct option.
Step-by-Step Reasoning
-
Option A: consumer spending on goods – This is consumption (C). In the circular flow, consumption is the spending by households on goods and services produced by firms. It is the main flow of money from households back to firms. It is not an injection because it originates from within the circular flow (households receive income from firms and then spend it). Consumption is a component of aggregate demand, but in the injection-leakage framework, it is not considered an injection; it is the core of the circular flow. Therefore, A is incorrect.
-
Option B: expenditure on a government construction project – This is government spending (G). Government spending is money that the government injects into the circular flow by purchasing goods and services. It does not come from the household sector's spending; it is financed by taxes or borrowing. Therefore, it is an injection. This is the correct answer.
-
Option C: spending by households on holidays abroad – This is spending on imports (M). When households buy foreign holidays, the money leaves the domestic economy and goes to foreign firms. This is a leakage (withdrawal) from the circular flow, not an injection. Therefore, C is incorrect.
-
Option D: repayment of loans to commercial banks – This is a financial transaction. When households or firms repay loans, they are reducing their debt to banks. The money used for repayment is not spent on goods or services; it is saved (or reduces the money supply in the circular flow). In the circular flow model, loan repayments are typically considered a form of saving or a leakage because they reduce the amount of money available for spending on domestic output. They are not a standard injection. Therefore, D is incorrect.
Thus, the only option that represents an injection is B.
Key Takeaways
- The circular flow of income model helps analyse how money moves through the economy.
- Injections (I, G, X) increase the circular flow and can boost economic activity.
- Leakages (S, T, M) reduce the circular flow and can dampen economic activity.
- It is important to distinguish between transactions that are part of the core consumption flow and those that are additions (injections) or subtractions (leakages).
Common Mistakes
- Confusing consumption (C) with an injection. Consumption is the main spending flow, not an injection.
- Thinking that government spending financed by taxes is not an injection. Even if funded by taxation, government spending is still an injection because it puts money into the circular flow that otherwise would not be spent (taxes are a leakage, but government spending is separate).
- Misidentifying imports as an injection. Imports are a leakage because money leaves the domestic economy.
- Considering loan repayments as an injection. Loan repayments reduce the money in circulation, acting as a leakage.
Things to Be Careful About
- The circular flow model is a simplification; in reality, some transactions may have complex effects (e.g., government spending financed by borrowing can affect the money supply).
- In an open economy, exports are an injection, but they are not listed in the options.
- The question is straightforward, but it tests a key concept that is often confused with leakages. Always refer back to the definitions: injection = spending from outside the household-firm loop; leakage = spending that is not passed on to firms in the domestic economy.
The diagram shows the AD and AS curves for a country. The equilibrium level of national income is Y1 and the general price level is P1.
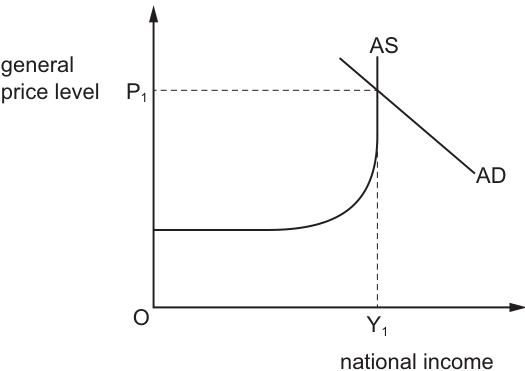
What is the most likely effect on employment and the general price level of a small decrease in government expenditure?
Options
| employment | general price level | |
|---|---|---|
| A | falls | falls |
| B | falls | unchanged |
| C | unchanged | falls |
| D | unchanged | unchanged |
Answer
Government expenditure is a component of aggregate demand (AD = C + I + G + X - M). A decrease in government expenditure reduces AD, shifting the AD curve to the left.
The diagram shows the economy is initially at equilibrium Y1, which lies on the vertical section of the AS curve. This indicates the economy is operating at full capacity (full employment). When AD shifts leftward from this position, the new intersection with the vertical AS curve occurs at the same level of real national income (Y1) but at a lower general price level.
Because real output remains at Y1, the level of employment is unchanged. The only effect is a fall in the general price level.
Answer
C
C
Background Concept
Aggregate Demand (AD) represents the total demand for goods and services in an economy at a given price level. It is composed of consumption (C), investment (I), government expenditure (G), and net exports (X - M). A change in any component shifts the AD curve. Government expenditure is a direct injection into the economy; a decrease in G reduces AD, shifting the AD curve to the left.
The Aggregate Supply (AS) curve is typically drawn with three sections. The horizontal (Keynesian) section represents an economy with substantial unemployed resources where output can increase without raising the price level. The upward-sloping section represents an economy approaching full capacity where increasing output drives up prices. The vertical section (classical or LRAS) represents the economy at full employment (full capacity), where all resources are fully utilised and output cannot increase further regardless of the price level.
Understanding the Question
The question presents an AD/AS diagram where the equilibrium is at point Y1 on the vertical section of the AS curve. This means the economy is already producing at its maximum sustainable output (full employment). The question asks for the most likely effect on employment and the general price level of a small decrease in government expenditure. This is a fiscal contraction. The task is to apply the AD/AS model to this specific scenario and distinguish between the effects on real variables (output/employment) and the nominal variable (price level).
Approach
- Identify the policy change: A decrease in government expenditure.
- Determine the effect on AD: This reduces AD, shifting the AD curve leftward.
- Locate the current equilibrium: It is on the vertical section of the AS curve at Y1 (full capacity).
- Analyse the new equilibrium: A leftward shift in AD along a vertical AS curve lowers the price level but leaves real output unchanged at Y1.
- Link output to employment: Since output is unchanged at the full-employment level, employment is also unchanged.
- Select the option that matches: employment unchanged, price level falls (Option C).
Step-by-Step Reasoning
- Step 1: Effect on Aggregate Demand. Government expenditure (G) is a component of AD. A decrease in G means less total spending in the economy. This causes the AD curve to shift to the left (from AD1 to AD2).
- Step 2: Position of the AS Curve. The diagram clearly shows the equilibrium at Y1 is on the vertical portion of the AS curve. This vertical portion represents the long-run aggregate supply or the full-employment level of output. At this point, the economy is at full capacity; unemployment is at the natural rate and all factories are operating at normal capacity.
- Step 3: New Equilibrium. When the AD curve shifts leftward, it intersects the vertical AS curve at a lower price level (below P1) but at the same level of real national income (Y1). This is because firms cannot reduce output below the full-employment level in the long run (or when at full capacity); instead, they compete for customers by lowering prices.
- Step 4: Effect on Employment. Since real national income (output) remains at Y1, the demand for labour does not change. The economy remains at the full-employment level of employment. Therefore, employment is unchanged.
- Step 5: Effect on Price Level. The leftward shift in AD reduces the price level from P1 to a lower level. The general price level falls.
- Step 6: Conclusion. The correct outcome is that employment is unchanged and the general price level falls. This corresponds to Option C.
Key Takeaways
- When the economy is at full capacity (vertical AS), demand-side policies (fiscal or monetary) only affect the price level, not real output or employment.
- The shape of the AS curve determines the relative effects of AD shifts on prices versus output.
- Government expenditure is a direct component of AD.
Common Mistakes
- Confusing the sections of the AS curve: Students often think a decrease in AD always reduces both output and prices. This is only true on the upward-sloping section. On the vertical section, output is fixed.
- Misreading the diagram: Failing to notice that the equilibrium is specifically on the vertical section leads to the wrong prediction.
- Confusing employment with the price level: Some students might think that because prices fall, employment rises (confusing this with a movement along a demand curve for labour). The relationship here is indirect via the AD/AS model.
- Selecting Option A: This would be correct if the equilibrium were on the upward-sloping section of the AS curve, where both output and price level fall when AD decreases.
Things to Be Careful About
- Always check where the equilibrium is located on the AS curve before predicting the effects of an AD shift.
- The vertical AS curve implies the economy is at full employment; therefore, employment cannot fall further (it is already at the natural rate).
- Ensure the final answer matches the exact wording of the options: "employment unchanged" and "general price level falls".
The diagram shows aggregate demand and aggregate supply curves for an economy.
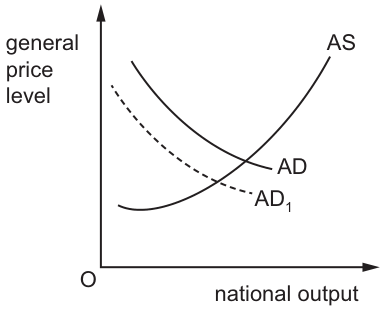
What would cause a change in the aggregate demand from AD to AD1?
Options
A government campaigns to encourage household savings
B consumption of domestic instead of foreign goods
C a decrease in the budget surplus
D investment in knowledge-based enterprises
Working
The diagram shows the AD curve shifting leftward from AD to AD1, indicating a decrease in aggregate demand. Aggregate demand is the total demand for goods and services in an economy and is calculated as AD = C + I + G + (X - M), where C is consumption, I is investment, G is government spending, and (X - M) is net exports.
- Option A: Government campaigns encouraging savings would reduce household consumption (C). A fall in C decreases AD, shifting the curve leftward from AD to AD1.
- Option B: Switching consumption to domestic goods would reduce imports (M), increasing net exports (X - M) and shifting AD rightward.
- Option C: A decrease in the budget surplus means the government is either increasing spending (G) or reducing taxation, both of which increase AD and shift it rightward.
- Option D: Investment in enterprises increases investment (I), shifting AD rightward.
Answer
A
A
Background Concept
Aggregate demand (AD) represents the total demand for an economy's output at different price levels. The AD curve is downward-sloping, showing an inverse relationship between the general price level and national output (real GDP). The position of the AD curve is determined by the level of aggregate demand, which equals Consumption (C) + Investment (I) + Government spending (G) + Net exports (X - M). Any factor that increases total spending on domestic output shifts AD to the right; any factor that reduces total spending shifts AD to the left.
Understanding the Question
The question presents an AD/AS diagram where the AD curve has shifted leftward from AD to AD1. This indicates a decrease in aggregate demand. The task is to identify which of the four options would cause such a leftward shift. This is a 1-mark multiple-choice question testing knowledge of the determinants of aggregate demand.
Approach
To solve this, recall the components of AD and analyse the effect of each option on these components:
- Identify the direction of the shift in the diagram (leftward = decrease in AD).
- Evaluate each option to see whether it increases or decreases C, I, G, or (X-M).
- Select the option that reduces AD.
Step-by-Step Reasoning
The diagram shows AD shifting left to AD1. This means aggregate demand has fallen.
Option A: Government campaigns to encourage household savings
When households save more, they consume less. Since consumption (C) is the largest component of AD, a reduction in C reduces total aggregate demand. This causes the AD curve to shift leftward. This matches the diagram.
Option B: Consumption of domestic instead of foreign goods
If households buy domestic goods instead of imports, imports (M) fall. Since net exports equal exports minus imports (X - M), a fall in M increases net exports. This raises AD, shifting the curve rightward, not leftward. So this is incorrect.
Option C: A decrease in the budget surplus
A budget surplus occurs when government revenue (taxation) exceeds government spending (T > G). A decrease in the surplus means the gap between T and G narrows, which happens if the government increases spending (G rises) or cuts taxes (T falls). Both actions increase aggregate demand, shifting AD rightward. So this is incorrect.
Option D: Investment in knowledge-based enterprises
Investment (I) is a component of AD. Increased investment raises AD, shifting the curve rightward. So this is incorrect.
Therefore, only Option A causes a leftward shift in AD.
Key Takeaways
- Aggregate demand is composed of C + I + G + (X - M).
- A leftward shift in AD is caused by a fall in any of these components.
- A rightward shift is caused by a rise in any component.
- Government campaigns to increase savings reduce consumption and therefore AD.
Common Mistakes
- Confusing shift direction: Students may misread the diagram or confuse the effects of the options.
- Misunderstanding the budget surplus: A decrease in a surplus is fiscal expansion, which increases AD, not decreases it.
- Forgetting net exports: Switching to domestic goods affects net exports; some students might think this reduces AD, but it actually increases net exports and AD.
- Confusing savings with investment: While investment increases AD, saving reduces consumption and therefore AD in the short run.
Things to Be Careful About
- Always check the direction of the shift in the diagram: AD to AD1 is leftward (a decrease).
- Remember that a decrease in the budget surplus is fiscal expansion, not contraction.
- Ensure you link the option to the specific component of AD it affects.
A government reduces the benefits that it pays to unemployed workers to increase the incentive to work.
Which types of macroeconomic policies are being used?
Options
| fiscal policy | monetary policy | supply-side policy | |
|---|---|---|---|
| A | ✓ | ✗ | ✗ |
| B | ✓ | ✓ | ✗ |
| C | ✓ | ✗ | ✓ |
| D | ✗ | ✗ | ✓ |
Answer
Reducing unemployment benefits is a change in government spending on transfer payments, which is a component of fiscal policy. The aim is to increase the incentive to work, which shifts the LRAS curve to the right by increasing the supply of labour. This makes it a supply-side policy as well.
Answer
C
C
Background Concept
Fiscal policy involves the use of government spending and taxation to influence the level of aggregate demand and, in some cases, aggregate supply. Supply-side policy aims to increase the productive capacity of the economy by improving the efficiency and quantity of factors of production. Monetary policy involves the control of the money supply and interest rates by the central bank.
Understanding the Question
The question describes a specific government action: reducing benefits paid to unemployed workers. The stated objective is to increase the incentive to work. The task is to identify which type(s) of macroeconomic policy this action represents. The options present a matrix of three policy types (fiscal, monetary, supply-side) with checkmarks indicating which apply.
Approach
First, determine if the action involves government spending or taxation. If yes, it is fiscal policy. Second, determine if the action aims to increase the economy's productive capacity or improve the functioning of labour markets. If yes, it is supply-side policy. Third, determine if the action involves interest rates or the money supply. If not, it is not monetary policy.
Step-by-Step Reasoning
-
Fiscal Policy: The government is reducing benefits, which are a form of government spending (transfer payments). Any change in government spending or taxation is a fiscal policy measure. Therefore, this action is part of fiscal policy.
-
Supply-Side Policy: The stated aim is to increase the incentive to work. By reducing the attractiveness of not working (unemployment benefits), the policy encourages unemployed workers to seek and accept employment. This increases the quantity and quality of labour, a factor of production. This shifts the Long-Run Aggregate Supply (LRAS) curve to the right, increasing the economy's potential output. Therefore, this action is also a supply-side policy.
-
Monetary Policy: The action does not involve changing interest rates, the money supply, or credit conditions. Therefore, it is not monetary policy.
-
Conclusion: The action is both a fiscal policy and a supply-side policy. This corresponds to option C.
Key Takeaways
- A single government action can belong to more than one policy category. The classification depends on both the instrument used (e.g., spending, tax) and the objective (e.g., managing AD, increasing AS).
- Supply-side policies are not limited to training or infrastructure; any policy that improves the quantity or quality of factors of production is supply-side.
- Transfer payments (like unemployment benefits) are a component of government spending and thus part of fiscal policy.
Common Mistakes
- Assuming fiscal policy only affects AD: While fiscal policy primarily affects AD, changes in government spending or taxation can also have supply-side effects, as in this case.
- Confusing supply-side policy with monetary policy: Supply-side policy focuses on real factors of production, while monetary policy focuses on nominal variables like interest rates and the money supply.
- Thinking only tax cuts are supply-side: While tax cuts are a common supply-side tool, changes in government spending (like reducing benefits) can also be supply-side if they alter incentives to work, save, or invest.
Things to Be Careful About
- Read the objective of the policy carefully. The question explicitly states the aim is to "increase the incentive to work," which is a clear supply-side objective.
- Remember that fiscal policy includes both spending and taxation. A change in benefits is a change in government spending.
- Monetary policy is distinct and involves the central bank, not direct government spending decisions.
A central bank is asked by the government to help achieve price stability.
If inflation rises steeply, which policy will not be directly within the control of the central bank?
Options
A increasing the rate of interest to reduce consumer spending
B managing a reduction of the money supply
C using credit restrictions to regulate lending by commercial banks to households
D restricting wage increases in the private and public sectors
Reasoning
The central bank controls monetary policy tools: interest rates, the money supply, and credit regulations. Options A, B, and C are all monetary policy instruments directly under the central bank's control. Restricting wage increases (Option D) is an incomes policy, which is a form of government intervention in the labour market, not a monetary policy tool. Therefore, D is the policy not directly within the central bank's control.
Answer
D
D
Background Concept
Monetary policy refers to actions by a central bank to manage the money supply and interest rates to achieve macroeconomic objectives such as price stability, low unemployment, and economic growth. The main tools of monetary policy include:
- Interest rates: Changing the policy rate (e.g., the bank rate) influences commercial banks' lending rates, affecting consumer spending and investment.
- Money supply: Open market operations, reserve requirements, and quantitative easing allow the central bank to expand or contract the money supply.
- Credit regulations: The central bank can impose restrictions on lending, such as loan-to-value ratios or limits on credit growth, to influence borrowing and spending.
In contrast, incomes policy involves direct government intervention to control wages and prices, typically through statutory or voluntary guidelines. This is a fiscal or supply-side policy tool, not a monetary one, and lies outside the central bank's remit.
Understanding the Question
The question asks which policy is not directly within the control of the central bank when inflation rises steeply. The central bank is assumed to have operational independence to set monetary policy. The four options list possible anti-inflation measures; three are standard monetary tools, and one is an incomes policy. The task is to identify the odd one out.
Approach
Recall the standard toolkit of a central bank: interest rates, money supply management, and credit controls. Compare each option against this list. The option that does not fit is the one that involves direct wage controls, which is a government (fiscal/incomes) policy.
Step-by-Step Reasoning
-
Option A: Increasing the rate of interest is a classic monetary policy tool. Higher interest rates raise the cost of borrowing, discouraging consumer spending and investment, thereby reducing aggregate demand and inflationary pressure. This is directly controlled by the central bank's monetary policy committee.
-
Option B: Managing a reduction of the money supply is also a core central bank function. Through open market sales of government bonds, raising reserve requirements, or other measures, the central bank can contract the money supply, which reduces spending and inflation. This is directly under its control.
-
Option C: Using credit restrictions to regulate lending by commercial banks is another monetary policy tool. The central bank can impose limits on loan-to-value ratios, set caps on credit growth, or tighten underwriting standards. This directly affects the availability of credit and is within the central bank's authority.
-
Option D: Restricting wage increases in the private and public sectors is an incomes policy. Wages are determined by labour market negotiations and government legislation, not by the central bank. The central bank has no direct power to cap or freeze wages; that would require government action, such as a statutory incomes policy or voluntary agreements with unions and employers. Therefore, this is not a monetary policy tool and is not directly within the central bank's control.
Thus, the correct answer is D.
Key Takeaways
- The central bank's primary tools are interest rates, money supply management, and credit regulations.
- Incomes policies (wage and price controls) are separate from monetary policy and are typically implemented by the government.
- When inflation rises, the central bank can use its monetary tools to cool demand, but wage restraint is not one of them.
Common Mistakes
- Confusing incomes policy with monetary policy: some students may think the central bank can influence wages indirectly through interest rates (e.g., higher rates reduce labour demand), but the question asks for a policy not directly within its control. Direct wage restriction is not a central bank tool.
- Overlooking the word 'directly': the central bank's interest rate decisions can affect wage bargaining indirectly, but the policy of 'restricting wage increases' itself is not a central bank action.
Things to Be Careful About
- Read the question carefully: 'not directly within the control of the central bank'.
- Know the distinction between monetary policy instruments and other government policies (fiscal, supply-side, incomes).
- In multiple-choice questions, eliminate the three that are clearly monetary tools to isolate the outlier.
What is not a likely reason for a government having the objective of economic growth?
Options
A to improve living standards
B to improve business confidence
C to increase inflationary pressures
D to increase consumer choice
Reasoning
Governments pursue economic growth to raise living standards, improve business confidence, and increase consumer choice. Increasing inflationary pressures is a potential cost of growth, not an objective.
Answer
C
C
Background Concept
Governments have a set of core macroeconomic objectives: stable prices (low inflation), low unemployment, economic growth, and a satisfactory balance of payments. These are the goals policy is designed to achieve. Economic growth — an increase in the economy's real output over time — is pursued because it tends to raise average incomes, expand the range of goods and services available, and create a more confident environment for investment. Inflation, by contrast, is something governments try to control, not to create.
Understanding the Question
The question asks which of the four options is not a likely reason for a government to have economic growth as an objective. Three of the options are genuine benefits or motivations for growth; one is a negative consequence that governments would normally want to avoid. The task is to pick the odd one out.
Approach
Read each option against the standard list of government objectives and the known effects of growth. Options A, B, and D are all positive outcomes that growth typically delivers. Option C — increasing inflationary pressures — is a well-known potential cost of rapid growth (especially demand-pull inflation when the economy is near full capacity). Governments do not set growth targets in order to create inflation; they set them despite the risk of inflation, and they use other policies to keep inflation in check.
Step-by-Step Reasoning
- Option A: to improve living standards — Growth raises real GDP per capita, which typically means higher consumption possibilities, better public services, and improved material well-being. This is a primary reason for pursuing growth.
- Option B: to improve business confidence — When the economy is growing, firms expect higher future sales and profits, so they invest more. Higher investment further fuels growth. This is a genuine reason.
- Option C: to increase inflationary pressures — Inflation is generally harmful: it erodes the real value of savings, creates uncertainty, and can damage international competitiveness. Governments aim for price stability, not inflation. While growth can cause demand-pull inflation, that is an unwanted side effect, not an objective. This is the correct answer.
- Option D: to increase consumer choice — A growing economy produces a wider variety of goods and services, giving consumers more options. This is a benefit of growth.
Key Takeaways
- Government macroeconomic objectives are distinct from the side effects of achieving them.
- Economic growth is pursued for its benefits (higher living standards, more choice, better confidence), not for its potential costs (inflation, environmental damage, inequality).
- In multiple-choice questions, watch for the word "not" — it inverts the selection logic.
Common Mistakes
- Choosing A, B, or D because they are all genuine benefits of growth — the question asks for what is not a reason.
- Confusing a possible consequence of growth (inflation) with a reason for wanting growth.
Things to Be Careful About
- Read the question stem carefully: "What is not a likely reason..."
- Distinguish between an objective (what the government wants to achieve) and an outcome it tries to avoid.
What is an example of expansionary monetary policy?
Options
A the central bank increasing the money supply
B the central bank causing an appreciation of the country’s foreign exchange rate
C the central bank increasing controls on credit lending
D the central bank increasing the minimum lending rate of interest
Answer
Expansionary monetary policy aims to increase aggregate demand. The central bank increasing the money supply is a direct expansionary action. Therefore, the correct answer is A.
A
Background Concept
Monetary policy refers to actions by a central bank to control the money supply and interest rates to achieve macroeconomic objectives. Expansionary monetary policy is used to combat recession or slow growth by increasing the money supply, lowering interest rates, and encouraging borrowing and spending. The main tools include open market operations (buying government bonds to inject money), reducing the discount rate, and lowering reserve requirements.
Understanding the Question
This multiple-choice question asks: "What is an example of expansionary monetary policy?" You are given four options, each describing a possible action by the central bank. The correct answer is the one that is consistent with expansionary policy. The key is to remember that expansionary policy increases the money supply or lowers interest rates, while contractionary policy does the opposite.
Approach
First, recall the definition and tools of expansionary monetary policy. Then evaluate each option to see which one matches. Option A: increasing the money supply — directly expansionary. Option B: causing an appreciation of the exchange rate — this is typically a result of higher interest rates (contractionary) or other factors; not an expansionary tool. Option C: increasing controls on credit lending — this restricts credit, which is contractionary. Option D: increasing the minimum lending rate — this raises interest rates, which is contractionary. So only A fits.
Step-by-Step Reasoning
- Option A: The central bank increases the money supply. This is a classic expansionary monetary policy tool. It can be done through open market purchases of government bonds, which inject reserves into the banking system, lowering interest rates and stimulating aggregate demand.
- Option B: Causing an appreciation of the foreign exchange rate. An appreciation makes exports more expensive and imports cheaper, which reduces net exports and aggregate demand. This is not expansionary; it is more likely to be a side effect of contractionary policy (higher interest rates attract foreign capital, causing appreciation). So this is not an example of expansionary policy.
- Option C: Increasing controls on credit lending. This restricts the amount of credit available, which reduces borrowing and spending. This is a contractionary measure.
- Option D: Increasing the minimum lending rate (also known as the bank rate or discount rate). This raises the cost of borrowing for commercial banks, which is passed on to consumers and firms, reducing borrowing and spending. This is contractionary.
Therefore, only option A is an example of expansionary monetary policy.
Key Takeaways
- Expansionary monetary policy involves increasing the money supply or lowering interest rates.
- The central bank's tools include open market operations, discount rate changes, and reserve requirement adjustments.
- Appreciation of the currency and higher interest rates are typically associated with contractionary policy.
- It is important to distinguish between the direction of policy actions: expansionary vs contractionary.
Common Mistakes
- Confusing expansionary and contractionary policy: Some students might think that increasing the minimum lending rate is expansionary because it might seem like the central bank is being "active", but it actually tightens monetary conditions.
- Assuming that appreciation of the exchange rate is always good for the economy: It can be a result of policy, but it is not a tool of expansionary policy.
- Overlooking the direct effect of money supply changes: Increasing the money supply is the most straightforward expansionary action.
Things to Be Careful About
- The question asks for an "example", so you need to identify which action is expansionary, not just any monetary policy action.
- Note that the central bank can use various tools, but the effect on the money supply and interest rates is key.
- In some contexts, appreciation can be caused by expansionary policy if it leads to lower interest rates and capital outflows, but that is not a direct tool. The question is asking for an example of policy, not a consequence.
- Pay attention to the wording: "causing an appreciation" implies the central bank deliberately causes it, which is not typical for expansionary policy.
What is the effect of an increase in the money supply on the interest rate and the aggregate demand (AD) curve?
Options
| interest rate | AD curve | |
|---|---|---|
| A | falls | shifts left |
| B | rises | shifts left |
| C | falls | shifts right |
| D | rises | shifts right |
Reasoning
An increase in the money supply, ceteris paribus, lowers the interest rate because the supply of loanable funds increases. A lower interest rate reduces the cost of borrowing and encourages consumption and investment, which are components of aggregate demand. Therefore, the AD curve shifts to the right. Hence, the correct answer is C.
Answer
C
C
Background Concept
Monetary policy involves the central bank controlling the money supply and interest rates to influence aggregate demand. The liquidity preference theory, developed by Keynes, states that the interest rate is determined by the supply and demand for money. An increase in the money supply, with money demand unchanged, leads to a lower interest rate. This lower interest rate then stimulates borrowing and spending, particularly on consumption and investment, which are components of aggregate demand (AD = C + I + G + (X - M)). Consequently, the AD curve shifts to the right.
Understanding the Question
This multiple-choice question asks for the combined effect of an increase in the money supply on the interest rate and the aggregate demand curve. The options present four combinations of interest rate movement (falls or rises) and AD curve shift (left or right). The correct answer is C: interest rate falls and AD curve shifts right.
Approach
Recall the standard transmission mechanism: money supply increase -> excess supply of money -> interest rate falls -> cheaper credit -> higher consumption and investment -> AD rises -> AD curve shifts right.
Step-by-Step Reasoning
- Money supply increase: The central bank injects more money into the economy, e.g., through open market operations.
- Effect on interest rate: According to the liquidity preference model, the increased money supply shifts the money supply curve to the right. At the initial interest rate, there is now an excess supply of money. To restore equilibrium, the interest rate falls. This is because individuals and institutions will try to convert their excess money holdings into interest-bearing assets, bidding up the price of bonds and thus lowering the yield (interest rate).
- Effect on consumption and investment: Lower interest rates reduce the cost of borrowing for households and firms. This encourages spending on durable goods, housing, and business investment. Also, lower rates may increase asset prices, creating a positive wealth effect, further boosting consumption.
- Effect on aggregate demand: Since consumption and investment are components of AD, total planned spending increases. At each price level, the quantity of real GDP demanded rises. Therefore, the AD curve shifts to the right.
Thus, the correct combination is interest rate falls and AD curve shifts right, which is option C.
Key Takeaways
- Money supply increase -> lower interest rates -> higher AD (rightward shift).
- This is a standard monetary policy transmission mechanism.
- The opposite holds for a decrease in money supply.
Common Mistakes
- Confusing the effect: some may think that more money supply raises interest rates due to inflation expectations, but in the short run, the liquidity effect dominates, lowering rates.
- Mixing up AD curve shift with movement along the curve: the lower interest rate causes a shift of AD, not a movement along it.
- Selecting option D (rises, shifts right) or A (falls, shifts left) due to misunderstanding the direction.
Things to Be Careful About
- Distinguish between short-run and long-run effects. In the long run, increased money supply may lead to inflation, which could raise interest rates via the Fisher effect, but the question asks about the immediate effect, which is the standard textbook answer.
- Ensure you understand that the AD curve shifts right because of the change in a component (C and I) due to the interest rate change, not because of a change in the price level.
A country has a target rate of inflation of 2.5% and has recently experienced the actual rate rising to 6%, with unemployment falling to very low levels.
Which policy option is most likely to be implemented?
Options
A an increase in government expenditure on training
B an increase in indirect taxes on demerit goods
C an increase in import tariffs
D an increase in interest rates
Reasoning
The country has inflation rising above target, with unemployment falling to very low levels. This indicates demand-pull inflation, where aggregate demand is too high. The most direct policy to reduce aggregate demand is contractionary monetary policy. An increase in interest rates raises the cost of borrowing, discourages consumption and investment, and shifts aggregate demand leftwards, reducing inflationary pressure. The other options are less suitable:
- A An increase in government expenditure on training is a supply-side policy that aims to increase potential output in the long run, but does not address immediate inflationary pressure.
- B An increase in indirect taxes on demerit goods is a specific tax that might reduce consumption of those goods, but it is not a general tool for controlling inflation and could even contribute to cost-push inflation.
- C An increase in import tariffs raises the price of imported goods, which could worsen inflation rather than reduce it, and does not address the underlying demand-pull problem.
Therefore, the policy most likely to be implemented is an increase in interest rates.
Answer
D
D
Background Concept
The scenario describes a country with a target inflation rate of 2.5% and actual inflation rising to 6%, alongside very low unemployment. This combination is typical of a demand-pull inflation situation: when aggregate demand (AD) grows faster than the economy's productive capacity, the general price level rises. Low unemployment suggests the economy is operating near full capacity, so any further increase in AD would primarily push up prices rather than output. To control inflation, policymakers can use contractionary monetary policy, which involves increasing interest rates to reduce the growth of AD. The central bank raises the policy rate, making borrowing more expensive for households and firms, which reduces consumption and investment spending. This leads to a leftward shift of the AD curve, lowering both the price level and the rate of inflation. The question tests the ability to select the correct policy instrument for a given macroeconomic situation, distinguishing between demand-side and supply-side policies.
Understanding the Question
The question provides a specific economic context: a country with a target inflation rate of 2.5% has experienced a rise to 6%, and unemployment is very low. The task is to identify which policy option is most likely to be implemented. The correct answer must be the policy that directly addresses the cause of rising inflation—in this case, demand-pull pressure. The options include a supply-side policy (A), a specific tax (B), a protectionist trade policy (C), and a contractionary monetary policy (D). The question requires understanding of the mechanisms of each policy and their appropriateness in this context.
Approach
First, diagnose the type of inflation: rising inflation with low unemployment suggests demand-pull inflation, not cost-push (which would typically be accompanied by rising unemployment). Therefore, the appropriate response is to reduce aggregate demand. Contractionary monetary policy—raising interest rates—is the standard tool. Evaluate each option:
- A: Training expenditure is supply-side, aimed at increasing productive capacity, but it takes time to affect inflation and could even increase AD in the short run.
- B: Indirect taxes on demerit goods are specific and not designed to control general inflation; they might even raise prices directly.
- C: Import tariffs increase the cost of imported goods, which could contribute to cost-push inflation and do not address demand-pull.
- D: Increasing interest rates reduces borrowing and spending, directly lowering AD and inflation.
Thus, D is the most likely.
Step-by-Step Reasoning
- Identify the problem: Inflation is 6% against a 2.5% target, and unemployment is low. This indicates that the economy is overheating due to excessive aggregate demand.
- Determine the objective: The government or central bank needs to reduce inflation to the target. The primary tool for this is contractionary monetary or fiscal policy. Among the options, only D is a contractionary demand-side policy.
- Explain why D works: An increase in interest rates raises the cost of borrowing. Households and firms reduce consumption and investment. This leads to a decrease in aggregate demand. In the AD/AS model, the AD curve shifts left, reducing the price level and output, thereby lowering inflation.
- Explain why A does not work: Increased government expenditure on training is a supply-side policy that can increase the long-run aggregate supply (LRAS) by improving labour productivity. However, it does not directly reduce demand-pull inflation in the short run; in fact, the initial government spending may increase AD.
- Explain why B does not work: Indirect taxes on demerit goods (e.g., alcohol, tobacco) are designed to correct externalities, not to control general inflation. They raise the price of specific goods, which could marginally increase the general price level, but they do not reduce overall demand pressure.
- Explain why C does not work: Import tariffs raise the price of imported goods, which can increase the cost of production and lead to cost-push inflation. They also reduce the volume of imports, which may worsen the trade balance but do not reduce aggregate demand; in fact, they may shift AD as net exports change, but the effect is ambiguous and not a direct anti-inflation tool.
- Conclusion: The most effective and direct policy to combat demand-pull inflation in this scenario is contractionary monetary policy, i.e., an increase in interest rates. Hence, D is the correct answer.
Key Takeaways
- When inflation rises and unemployment is low, the likely cause is demand-pull inflation, requiring a reduction in aggregate demand.
- Contractionary monetary policy (raising interest rates) is the standard tool to reduce demand-pull inflation.
- Supply-side policies (like training) are long-term and do not address immediate inflationary pressure.
- Specific taxes or tariffs are not suitable for general inflation control and may even worsen inflation.
- Understanding the link between the stage of the business cycle and appropriate policy responses is crucial for multiple-choice questions.
Common Mistakes
- Choosing supply-side policy (A): Students may think that training increases productivity and thus reduces inflation, but they overlook the time lag and the fact that it does not address current demand pressure.
- Choosing tariffs (C): Some might think tariffs reduce imports, thus reducing the trade deficit, but tariffs actually raise prices and can contribute to cost-push inflation.
- Confusing inflation types: If the student incorrectly identifies the inflation as cost-push, they might choose a different policy, but the low unemployment strongly suggests demand-pull.
- Overthinking: The question is straightforward; the correct answer is the most direct anti-inflation policy.
Things to Be Careful About
- Read the scenario carefully: the combination of rising inflation and low unemployment is key to diagnosing demand-pull inflation.
- Distinguish between policies that affect aggregate demand (monetary and fiscal policy) and those that affect aggregate supply (supply-side policies).
- Recognise that the central bank's primary objective is often price stability, so when inflation exceeds the target, interest rate increases are the natural response.
- Note that the question asks for the policy "most likely to be implemented", implying a single best answer. Even if other options have some merit, only D directly addresses the immediate problem.
What is the most likely reason for a government to introduce a progressive tax?
Options
A to discourage the consumption of a particular good
B to distribute disposable income more evenly
C to increase the disposable income of households
D to reduce demand for healthcare services
Answer
A progressive tax takes a larger percentage of income from the rich than from the poor. Its primary purpose is to redistribute income from the rich to the poor, thereby reducing inequality. The most likely reason for a government to introduce a progressive tax is to distribute disposable income more evenly.
B
B
Background Concept
A progressive tax is one where the average rate of tax (the percentage of income paid in tax) rises as income increases. For example, a tax system might have a 0% rate on the first $10,000 of income, a 20% rate on income between $10,001 and $50,000, and a 40% rate on income above $50,000. This means that higher-income individuals pay a larger share of their income in tax, and the tax burden is distributed according to ability to pay. The revenue from progressive taxation is often used to fund public services and welfare transfers, which disproportionately benefit lower-income households, thereby reducing inequality in disposable income.
Understanding the Question
The question asks for the most likely reason a government would introduce a progressive tax. The options are:
- A to discourage the consumption of a particular good (this is typically done by an indirect tax like an excise duty on alcohol or tobacco).
- B to distribute disposable income more evenly (this matches the redistributive function of progressive taxation).
- C to increase the disposable income of households (a progressive tax reduces disposable income of those who pay it; it may increase the disposable income of the poorest, but overall it transfers income, not increases aggregate disposable income).
- D to reduce demand for healthcare services (progressive taxes are not specifically used for this; healthcare demand is managed by pricing, regulation, or public provision—not by the structure of income tax).
The correct answer is B, as progressive taxation is a direct tool for redistribution.
Approach
Identify the defining characteristic of a progressive tax: higher tax rate for higher incomes. Connect this to the policy goal of equity and reducing income inequality. Rule out the incorrect options by considering the typical purpose of each.
Step-by-Step Reasoning
- Progressive tax defined: The marginal rate of tax increases with income. This means that those with higher incomes pay a greater proportion of their income in tax.
- Primary purpose: The main objective of progressive taxation is to reduce income and wealth inequality by redistributing resources from the rich to the poor. The revenue collected can be used for transfer payments (e.g., unemployment benefits, pensions) and public services that benefit lower-income groups more.
- Evaluate options:
- Option A: Discouraging consumption of a specific good is the job of an indirect tax (e.g., a high tax on cigarettes). A progressive income tax does not target specific goods.
- Option B: Correct. By taking a larger share from the rich and spending on services/benefits for the poor, disposable income becomes more evenly distributed.
- Option C: A progressive tax itself does not increase aggregate disposable income; it transfers purchasing power, but overall after-tax income is lower than before tax. Some households may have higher disposable income after transfers, but that is a consequence of government spending, not the tax itself.
- Option D: There is no direct link between progressive tax rates and the demand for healthcare. Healthcare demand is influenced by price, income, and health needs, not by how income tax is structured.
- Conclusion: The most likely reason is to distribute disposable income more evenly.
Key Takeaways
- A progressive tax is defined by its rising average rate of tax as income increases.
- Its primary purpose is redistribution to reduce inequality.
- Different taxes have different purposes: indirect taxes discourage consumption of demerit goods; regressive taxes fall disproportionately on the poor.
Common Mistakes
- Confusing progressive tax with an indirect tax used for demerit goods (Option A).
- Thinking that a progressive tax increases disposable income (Option C). It actually reduces the disposable income of those who pay the higher rates, but may increase it for recipients of government transfers.
- Linking progressive tax to healthcare demand management (Option D), which is more about healthcare policy than tax structure.
Things to Be Careful About
- Understand the distinction between marginal tax rate and average tax rate.
- Remember that a progressive tax takes a larger percentage from the rich, not necessarily a larger absolute amount (though that is usually the case as well).
- The question asks for the most likely reason—not every possible reason. Focus on the primary, established purpose of such a tax system.
What is the least likely consequence of rapid economic growth?
Options
A high levels of pollution
B large deficit on the current account of the balance of payments
C large deficit in the government’s budget balance
D more congestion on the roads
Reasoning
Rapid economic growth typically raises government tax revenues more than it increases spending, so the budget deficit tends to shrink. A large deficit is therefore an unlikely outcome. By contrast, pollution, current account deficits, and congestion are common negative consequences of growth.
Answer
C
C
Background Concept
Economic growth refers to an increase in a country's real output of goods and services over time, usually measured by the annual percentage change in real GDP. Rapid growth means a high rate of expansion, often accompanied by rising incomes, employment, and consumption. However, growth can also have negative side effects, such as environmental damage, congestion, and external imbalances. The government's budget balance is influenced by the state of the economy through automatic stabilisers: tax revenues and welfare spending vary with the business cycle.
Understanding the Question
This question asks which of four listed consequences is the least likely to occur when an economy experiences rapid growth. It tests your ability to distinguish between typical outcomes (pollution, current account deficit, congestion) and an outcome that is actually the opposite of what usually happens (a large government budget deficit). The correct answer is the one that conflicts with standard macroeconomic theory about how a boom affects the public finances.
Approach
Consider each option in turn, using economic reasoning:
- Option A (high pollution): Rapid growth means more production and consumption, which often generate more waste and emissions. This is a well-known negative externality of growth.
- Option B (large current account deficit): A growing economy tends to import more (as incomes rise, consumers buy foreign goods) and if exports cannot keep pace, the current account deficit widens. This is a common outcome.
- Option C (large government budget deficit): During a boom, tax revenues (income tax, corporate tax, VAT) increase automatically, while spending on unemployment benefits and other welfare payments falls. The budget deficit typically shrinks or turns into a surplus. A large deficit is therefore very unlikely.
- Option D (more road congestion): Higher incomes allow more people to own cars, and increased economic activity leads to more transport of goods, worsening congestion. This is a typical negative consequence.
Thus, option C is the least likely.
Step-by-Step Reasoning
- Rapid growth → higher aggregate demand and output → more employment and income.
- Automatic stabilisers:
- Tax revenues rise (income tax, corporation tax, VAT) because incomes and spending are higher.
- Government spending on welfare (unemployment benefits, income support) falls because fewer people are claiming.
- Net effect: the government budget balance improves (deficit decreases or surplus increases).
- Therefore, a large budget deficit is inconsistent with rapid growth; it is more likely during a recession.
- For the other options:
- Pollution: Growth often increases industrial output and energy use, leading to more emissions and waste (negative externality).
- Current account deficit: Higher domestic income boosts imports; if exports do not rise as much, the trade balance worsens, causing a current account deficit.
- Congestion: More economic activity means more vehicles on the road, more freight transport, and more commuting, all leading to congestion.
- Conclusion: Options A, B, and D are plausible consequences; option C is not, so it is the least likely.
Key Takeaways
- Economic growth has both positive and negative consequences; understanding these helps evaluate real-world outcomes.
- The government budget is not static; it is strongly influenced by the business cycle through automatic stabilisers.
- Growth usually improves the budget balance, not worsens it.
- Being able to reason through each option and apply economic theory to a multiple-choice question is a key skill for the exam.
Common Mistakes
- Thinking that growth always increases government spending because the government may invest in infrastructure. While discretionary spending can rise, the automatic stabilisers dominate during a boom, and the question asks about a 'large deficit', which is unlikely.
- Confusing the government budget deficit with the current account deficit. They are different concepts, and both can occur, but only the current account deficit is a typical consequence of growth.
- Assuming that all negative consequences are equally likely. The question tests the ability to distinguish between those that are commonly associated and those that are not.
Things to Be Careful About
- The question says 'least likely', not 'impossible'. A budget deficit could still occur if the government is deliberately running a large structural deficit, but the question refers to the typical consequence of rapid growth, not a policy choice.
- Distinguish between cyclical and structural deficits: rapid growth removes the cyclical deficit but may leave a structural deficit if the government is running one. However, the question points to a 'large deficit', which is atypical during a boom.
- Read each option carefully: 'large deficit on the current account' is a common outcome, but 'large deficit in the government’s budget balance' is not. This is a classic trick in economics MCQs.
A country with a floating exchange rate has a large deficit on the current account of the balance of payments.
What is most likely to decrease as a consequence of this deficit?
Options
A competitiveness of the country’s products
B level of employment in the country
C prices of exports from the country
D rate of inflation in the country
Reasoning
A large current account deficit under a floating exchange rate means the country is spending more on imports than it earns from exports. This creates an excess supply of the country's currency on foreign exchange markets, causing the currency to depreciate. A depreciation makes the country's exports cheaper in foreign currency, so the price of exports (in foreign currency) decreases. Therefore, the most likely decrease is the prices of exports.
Answer
C
C
Background Concept
A current account deficit occurs when a country's imports of goods, services, and income transfers exceed its exports. Under a floating exchange rate system, the value of the currency is determined by market forces of demand and supply. A deficit implies that the supply of the domestic currency (to buy foreign currency for imports) exceeds the demand for it (from foreigners buying exports), leading to a depreciation of the currency. Depreciation means the currency becomes cheaper relative to other currencies, making exports cheaper for foreign buyers and imports more expensive for domestic consumers.
Understanding the Question
The question asks: given a large current account deficit under a floating exchange rate, which of the four options is most likely to decrease as a direct consequence? The key is to trace the chain of causation: deficit -> excess supply of currency -> depreciation -> export prices (in foreign currency) fall. The other options either increase or are less directly affected.
Approach
First, identify the immediate effect of the deficit on the exchange rate. Then, consider how the depreciation affects each option. Eliminate options that are likely to increase or remain unchanged. The correct answer is the one that clearly decreases.
Step-by-Step Reasoning
- Current account deficit: The country is buying more from abroad than it sells. This means there is a net outflow of currency to pay for imports, increasing the supply of the domestic currency on forex markets.
- Floating exchange rate: The exchange rate adjusts freely. The excess supply causes the currency to depreciate (its value falls).
- Effect on export prices: Depreciation makes exports cheaper in foreign currency terms. For example, if the exchange rate changes from $1 = 0.8 euros to $1 = 0.7 euros, a good priced at $100 now costs 70 euros instead of 80 euros. Thus, the price of exports (in foreign currency) decreases.
- Option A (competitiveness): Competitiveness improves because exports become cheaper, so it increases, not decreases.
- Option B (employment): The deficit reduces aggregate demand (since net exports are negative), which could lower output and employment. However, the depreciation may boost exports over time, partially offsetting this. The question asks for the most likely decrease; export prices are a more direct and immediate consequence.
- Option C (prices of exports): As explained, these decrease in foreign currency terms. This is the correct answer.
- Option D (inflation): Depreciation makes imports more expensive, which can cause cost-push inflation, so inflation is likely to increase, not decrease.
Thus, the most likely decrease is the prices of exports.
Key Takeaways
- A current account deficit under a floating exchange rate leads to depreciation.
- Depreciation directly reduces the foreign currency price of exports.
- Understanding the direction of change for each variable is crucial in multiple-choice questions.
Common Mistakes
- Confusing the effect on domestic currency price vs. foreign currency price of exports. The question likely refers to the price in foreign currency.
- Thinking that employment is the main effect; while employment may fall, the question asks for the most likely decrease, and export prices are more directly affected.
- Assuming that a deficit always leads to inflation; it can, but the immediate effect on export prices is clearer.
Things to Be Careful About
- Read the question carefully: "prices of exports from the country" – in the context of depreciation, it is the foreign currency price that falls.
- Remember that under floating exchange rates, the currency adjusts to correct imbalances, so the deficit itself triggers the depreciation.
- In multiple-choice questions, eliminate options that are clearly incorrect based on economic reasoning.
What will definitely lead to an improvement in the terms of trade?
Options
A Export prices fall whilst import prices rise.
B Export prices rise by the same amount as import prices.
C Export prices rise slower than import prices.
D Export prices rise whilst import prices stay the same.
Answer
The terms of trade are measured as (Index of export prices / Index of import prices) x 100. An improvement means this ratio rises.
- A: Export prices fall and import prices rise -> numerator falls, denominator rises -> ratio falls -> terms of trade worsen.
- B: Both rise by the same amount -> ratio stays the same -> no change.
- C: Export prices rise slower than import prices -> numerator rises by less than denominator -> ratio falls -> terms of trade worsen.
- D: Export prices rise while import prices stay the same -> numerator rises, denominator unchanged -> ratio rises -> terms of trade improve.
Therefore, only option D definitely leads to an improvement.
Answer
D
D
Background Concept
The terms of trade (TOT) measure the relative price of a country's exports compared to its imports. It is calculated as:
TOT = (Index of export prices / Index of import prices) x 100
An improvement in the terms of trade means that export prices have risen relative to import prices. This allows a country to buy more imports for the same quantity of exports. A deterioration means export prices have fallen relative to import prices, so the country must export more to buy the same amount of imports.
Understanding the Question
The question asks which of four scenarios will definitely lead to an improvement in the terms of trade. The key word is "definitely" — we need a scenario where the TOT ratio unambiguously rises, regardless of the specific numbers involved. Each option describes a change in export prices and import prices.
Approach
Apply the TOT formula to each option. For each, determine whether the ratio (export price index / import price index) increases, decreases, or stays the same. Only one option guarantees an increase.
Step-by-Step Reasoning
Let's evaluate each option:
Option A: Export prices fall, import prices rise.
- Numerator (export prices) decreases.
- Denominator (import prices) increases.
- A smaller number divided by a larger number gives a smaller result. The ratio falls. This is a deterioration in the terms of trade.
Option B: Export prices rise by the same amount as import prices.
- Suppose both rise by 10%. The new ratio is (110 / 110) x 100 = 100, the same as before. The ratio is unchanged. This is no change in the terms of trade.
Option C: Export prices rise slower than import prices.
- Suppose export prices rise by 5% and import prices by 10%. The new ratio is (105 / 110) x 100 ≈ 95.5, which is lower than 100. The ratio falls. This is a deterioration.
Option D: Export prices rise while import prices stay the same.
- Suppose export prices rise by 10% and import prices stay at 100. The new ratio is (110 / 100) x 100 = 110, which is higher than 100. The ratio rises. This is an improvement.
Only option D guarantees an improvement because the numerator increases while the denominator remains constant, so the ratio must rise.
Key Takeaways
- The terms of trade formula is the ratio of export prices to import prices.
- An improvement occurs when the ratio rises: export prices rise relative to import prices.
- A deterioration occurs when the ratio falls: export prices fall relative to import prices.
- To determine the effect, compare the direction and magnitude of changes in both prices.
Common Mistakes
- Confusing an improvement with a deterioration. An improvement means you can buy more imports per export, which happens when export prices rise relative to import prices.
- Thinking that any rise in export prices improves the TOT. If import prices rise by more, the TOT can still worsen (as in option C).
- Forgetting that the TOT is a ratio, not an absolute difference. Both prices must be considered together.
Things to Be Careful About
- The word "definitely" means the outcome must be certain, not just possible. Options A, B, and C can produce different outcomes depending on the exact numbers, but option D always produces an improvement.
- The terms of trade index is usually set at 100 in a base year. Changes are measured relative to this base.
- An improvement in the terms of trade is not necessarily good for the economy — it can reduce export competitiveness if export prices rise too much.
Between June and the end of July 2016, the UK pound sterling depreciated by 11% against a basket of currencies of the UK’s major trading partners.
The diagram shows the original aggregate demand curve AD1 and the original aggregate supply curve AS1 for the UK economy before June 2016. The equilibrium is at X.
What would have been the new equilibrium for the UK economy as a result of the depreciation of the pound sterling?
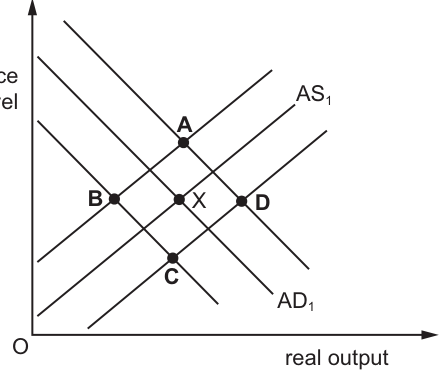
Options
A point A on Fig. 28.1
B point B on Fig. 28.1
C point C on Fig. 28.1
D point D on Fig. 28.1
Working
A depreciation of the pound sterling makes UK exports cheaper for foreign buyers and imports more expensive for UK buyers. This increases the volume of exports and reduces the volume of imports, so net exports (X - M) rise. Because net exports are a component of aggregate demand (AD = C + I + G + (X - M)), AD increases and shifts to the right.
If the economy is already operating at full employment, the aggregate supply curve is vertical (perfectly price-inelastic). In this situation, firms cannot increase real output further because all resources are fully utilised. The increase in AD therefore leads only to a higher price level, with real output remaining unchanged at the full employment level.
Point A shows a higher price level and the same real output as the original equilibrium X. This matches the outcome of an AD increase when the economy is at full capacity.
Answer
A
A
Background Concept
An exchange rate is the price of one currency expressed in terms of another. Depreciation means the domestic currency has fallen in value relative to foreign currencies. This alters the relative prices of exports and imports: UK goods become cheaper for foreigners (boosting export demand), while foreign goods become more expensive for UK residents (reducing import demand). The net effect is an increase in net exports (X - M).
Aggregate demand (AD) represents the total demand for an economy's output at different price levels. It is composed of consumption (C), investment (I), government spending (G), and net exports (X - M). A change in any component shifts the AD curve. An increase in net exports shifts AD to the right.
The aggregate supply (AS) curve shows the quantity of output firms are willing to supply at different price levels. Its shape determines the effect of an AD shift on real output and the price level. If the economy is below full employment, AS is upward sloping, and an AD increase raises both output and prices. If the economy is at full employment (the vertical long-run aggregate supply curve), AS is perfectly price-inelastic: output cannot increase, so an AD increase raises only the price level.
Understanding the Question
The question presents a specific event: an 11% depreciation of the UK pound sterling between June and July 2016 (following the Brexit referendum). It asks what the new macroeconomic equilibrium would be, given the original equilibrium at point X where AD1 intersects AS1.
The candidate must:
- Determine the direction of the AD shift caused by depreciation.
- Use the AD/AS diagram to identify which labeled point (A, B, C, or D) corresponds to the new equilibrium.
The diagram descriptions indicate that point A represents a higher price level with unchanged real output. This is the critical clue.
Approach
- Step 1: Apply the exchange rate effect. Depreciation -> exports cheaper, imports dearer -> net exports rise -> AD shifts right.
- Step 2: Consider the AS condition. The answer choices imply different AS slopes or positions. Point A (higher price, same output) is the unique outcome when AS is vertical (full employment). Points B, C, and D imply other scenarios (leftward AD shift, rightward AS shift, or horizontal AS) that do not match a depreciation.
- Step 3: Select point A as the only consistent outcome if the economy is at full capacity.
Step-by-Step Reasoning
Effect on Aggregate Demand:
When the pound depreciates by 11%, the price of UK goods in foreign currencies falls, making them more competitive. Foreign demand for UK exports increases. Simultaneously, the price of imported goods in pounds rises, reducing domestic demand for imports. Because net exports (exports minus imports) increase, and net exports are a component of AD, the AD curve shifts to the right (increases).
Determining the New Equilibrium:
The original equilibrium is at X. An increase in AD would normally move the equilibrium up and to the right along an upward-sloping AS curve, raising both the price level and real output. However, the answer choices do not include a point with both higher price and higher output. Instead, point A shows a higher price level with the same real output.
This outcome is only possible if the aggregate supply curve is perfectly price-inelastic (vertical) at the current level of output. A vertical AS curve represents an economy already operating at its full employment level of output (potential GDP), where all resources—labour, capital, and land—are fully utilised. In this situation, firms cannot expand output further in response to higher demand. Instead, the increased demand bids up the price level, causing inflation, while real output remains unchanged.
Evaluating the Options:
- Point A (higher price, same output): Consistent with a rightward AD shift when AS is vertical (full employment). This matches the effect of depreciation under full capacity.
- Point B (lower output, same price): Would result from a leftward shift in AD (e.g., an appreciation) or a leftward shift in AS (e.g., an increase in import costs due to depreciation). Depreciation does not reduce AD or shift AS left in the standard analysis for this question.
- Point C (lower price, same output): Would result from a rightward shift in AS (e.g., a fall in production costs) or a leftward shift in AD.
- Point D (higher output, same price): Would require a horizontal AS curve (perfectly elastic), which is not the standard assumption and does not reflect the inflationary impact of higher demand.
Therefore, the correct answer is A.
Key Takeaways
- Currency depreciation increases net exports and shifts AD to the right.
- The effect on real output depends on the economy's position relative to full employment.
- At full employment (vertical AS), an AD increase causes only inflation (higher price level), with no change in real output.
- Always consider the slope of the AS curve when predicting the effects of demand-side changes.
Common Mistakes
- Reversing the effect: Thinking depreciation decreases AD. It is appreciation that decreases AD.
- Ignoring the full employment assumption: Assuming AD shifts always increase both output and prices. This is only true when there is spare capacity.
- Misreading the diagram: Failing to notice that point A represents a vertical movement (same output, higher price), which is the signature of a vertical AS curve.
- Choosing point D: Selecting D because it shows higher output, but ignoring that D implies no price increase, which contradicts the inflationary effect of higher AD.
Things to Be Careful About
- The date (2016) is the Brexit referendum, which caused a sharp depreciation. This real-world context confirms the direction of change but the economic mechanism is general.
- In multiple-choice questions, if the diagram shows points that imply a vertical AS (like A being directly above X), this signals that the full employment assumption is intended.
- Ensure you distinguish between a shift in AD (caused by exchange rate changes) and a movement along the AD curve (caused by price level changes).
What is the effect of a cut in a country‘s income tax rates on its exports and imports?
Options
| exports | imports | |
|---|---|---|
| A | fall | fall |
| B | fall | unchanged |
| C | unchanged | fall |
| D | unchanged | rise |
Answer
A cut in income tax rates increases households' disposable income. This raises consumption expenditure, which is a component of Aggregate Demand (AD). The rise in AD increases national income (real GDP). As national income rises, the demand for imports rises because imports are a positive function of income. Exports, however, are determined by foreign income and the exchange rate, not by domestic income, so they remain unchanged.
Therefore, exports are unchanged and imports rise.
Answer
D
D
Background Concept
This question tests the link between fiscal policy, aggregate demand, national income, and the components of the balance of payments. A cut in income tax is an expansionary fiscal policy measure. It increases households' disposable income (income after tax), which typically leads to higher consumption spending. Consumption (C) is the largest component of Aggregate Demand (AD = C + I + G + X - M). An increase in AD shifts the AD curve to the right, leading to a higher equilibrium level of real national output (Y) and, depending on the shape of the Aggregate Supply curve, a higher price level.
Crucially, imports (M) are a function of domestic national income: as Y rises, the demand for imported goods and services also rises. This is because some of the additional spending by households falls on foreign-produced goods. Exports (X), on the other hand, are determined by foreign income, foreign tastes, and the exchange rate. A change in domestic income does not directly affect the quantity of exports demanded by foreigners.
Understanding the Question
The question asks for the effect of a cut in a country's income tax rates on its exports and imports. It presents four options combining possible changes (fall, unchanged, rise) for each variable. The key is to trace the causal chain correctly: tax cut -> disposable income -> consumption -> AD -> national income -> imports. Exports are not part of this domestic chain. The question is testing whether the student understands that imports are an endogenous variable (determined within the model by domestic income) while exports are exogenous (determined by external factors).
Approach
- Identify the initial impact: a cut in income tax increases disposable income.
- Trace the effect on consumption and AD: higher disposable income leads to higher consumption, shifting AD right.
- Determine the effect on national income: the rightward shift of AD increases equilibrium real GDP (assuming the economy is not at full capacity).
- Link national income to imports: imports are a positive function of income, so they rise.
- Consider exports: exports depend on foreign income and the exchange rate, which are unchanged by this domestic policy. Therefore, exports are unchanged.
- Match the result (exports unchanged, imports rise) to the correct option.
Step-by-Step Reasoning
- The initial policy change: The government cuts income tax rates. This is an expansionary fiscal policy.
- Effect on households: Households now keep a larger proportion of their income. Their disposable (post-tax) income increases.
- Effect on consumption: With higher disposable income, households are likely to increase their consumption spending (C). The marginal propensity to consume (MPC) determines how much of the extra income is spent. This is a direct increase in a component of AD.
- Effect on Aggregate Demand: The increase in C causes the AD curve to shift to the right. The size of the shift is amplified by the multiplier effect, but for this question, the direction is sufficient.
- Effect on National Income (Real GDP): In the AD/AS model, a rightward shift of AD, assuming the economy is operating below full capacity (on the upward-sloping or Keynesian range of the AS curve), leads to an increase in the equilibrium level of real national output (Y).
- Effect on Imports (M): Imports are a function of national income (M = mY, where m is the marginal propensity to import). As Y rises, the demand for imports rises. This is because some of the increased spending by households and firms is on goods and services produced abroad. Therefore, imports rise.
- Effect on Exports (X): Exports are determined by factors outside the domestic economy, primarily the level of income in trading partner countries and the exchange rate. The domestic tax cut does not directly change foreign income or the exchange rate. Therefore, exports remain unchanged.
- Conclusion: The effect is that exports are unchanged and imports rise. This corresponds to option D.
Key Takeaways
- Imports are a function of domestic income: A key relationship in macroeconomics is that a country's demand for imports rises as its national income rises.
- Exports are a function of foreign income: A country's exports are determined by the economic conditions of its trading partners, not its own domestic income.
- Tracing the chain of causation: This question demonstrates the importance of following a logical chain from a policy change through to its ultimate effects on different variables.
- Components of AD: Understanding the components of AD (C + I + G + X - M) is crucial for analysing the impact of any policy.
Common Mistakes
- Assuming exports also rise: A common error is to think that a booming domestic economy will somehow boost exports. This is incorrect because exports are sold to foreigners, and their demand is not directly affected by domestic income.
- Confusing imports with exports: Students might mix up the direction of the effect, thinking that a tax cut makes domestic goods more competitive (it doesn't, directly) and thus boosts exports.
- Ignoring the income effect on imports: Some students might focus only on the tax cut's effect on the supply side (e.g., increased incentive to work) and miss the immediate demand-side effect on imports.
- Thinking imports fall: A student might incorrectly reason that a tax cut reduces the cost of domestic production, making imports less attractive. While supply-side effects can occur in the long run, the immediate and primary effect is the demand-side increase in imports.
Things to Be Careful About
- Distinguish between short-run and long-run effects: The question asks for the effect, which in this context implies the immediate, short-run demand-side effect. Long-run supply-side effects (e.g., increased labour supply and productivity) could potentially increase exports, but this is not the standard or primary effect being tested.
- Keep the causal chain clear: Do not jump to conclusions. Work step-by-step: tax cut -> disposable income -> consumption -> AD -> national income -> imports.
- Remember the definition of imports and exports: Imports are goods and services bought from abroad; exports are goods and services sold abroad. Their determinants are different.
The diagram shows the effect of a government removing the tariff on imports of rice into its country.
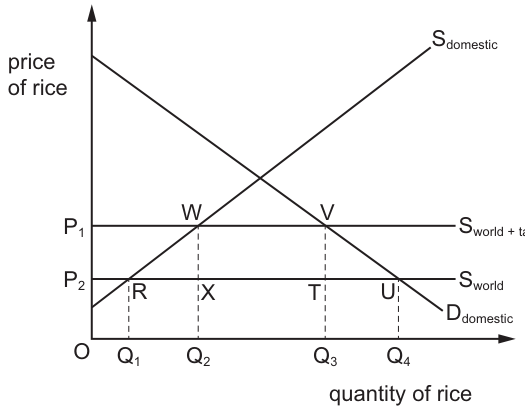
How would the removal of this tariff affect the consumer surplus and the government's revenue?
Options
| consumer surplus | government revenue | |
|---|---|---|
| A | increases by VUT | decreases by WVTX |
| B | increases by VUT | decreases by WVQ3Q2 |
| C | increases by P1VUP2 | decreases by WVTX |
| D | increases by P1VUP2 | decreases by WVQ3Q2 |
Reasoning
Removing the tariff lowers the domestic price of rice from P1 (world price plus tariff) to P2 (world price without tariff).
Consumer surplus is the area below the demand curve and above the price paid. The fall in price increases consumer surplus by the area between P1 and P2, bounded by the demand curve, which is the quadrilateral P1VUP2.
Government tariff revenue equals the tariff per unit (P1 - P2) multiplied by the volume of imports with the tariff (Q3 - Q2), represented by the rectangle WVTX. Removing the tariff eliminates this revenue, so government revenue decreases by WVTX.
Answer
C
C
Background Concept
A tariff is a tax imposed on imported goods, which raises the domestic price of the imported good above the world price. Consumer surplus is the difference between the price consumers are willing to pay for a good (shown by the demand curve) and the price they actually pay; it represents the net benefit consumers receive from purchasing the good. Government revenue from a tariff is calculated as the tariff per unit (the difference between the domestic price with the tariff and the world price) multiplied by the quantity of imports (the difference between domestic quantity demanded and domestic quantity supplied at the tariff-inclusive price). When a tariff is removed, the domestic price falls to the world price, which increases consumer surplus (as consumers pay less and can buy more) and eliminates government tariff revenue.
Understanding the Question
This multiple-choice question asks you to identify how removing a tariff on rice imports affects two variables: consumer surplus and government revenue. The diagram provided shows the domestic rice market, with the domestic demand curve (Ddomestic), domestic supply curve (Sdomestic), world supply curve without tariff (Sworld at price P2) and world supply curve with the tariff (Sworld + tariff at price P1). Key points marked are: W (domestic supply at P1, Q2), V (domestic demand at P1, Q3), R (domestic supply at P2, Q1), X (domestic supply at P2, Q2), T (domestic demand at P2, Q3), U (domestic demand at P2, Q4). The question requires you to match the change in consumer surplus and government revenue to the correct areas on the diagram.
Approach
To answer this question:
- First, identify the original equilibrium with the tariff: domestic price is P1, domestic supply is Q2, domestic demand is Q3, so imports are Q3 - Q2.
- Identify the new equilibrium without the tariff: domestic price falls to P2, domestic supply is Q1, domestic demand is Q4, so imports are Q4 - Q1.
- Calculate the change in consumer surplus: this is the area between the original price (P1) and new price (P2), bounded by the demand curve and the vertical axis, which is the quadrilateral P1VUP2.
- Calculate the original government tariff revenue: this is the rectangle with height equal to the tariff per unit (P1 - P2) and width equal to the original import volume (Q3 - Q2), which is the rectangle WVTX. Removing the tariff reduces government revenue by this entire amount, as no tariff is collected anymore.
- Match these areas to the options provided to select the correct answer.
Step-by-Step Reasoning
- Effect of tariff removal on price: A tariff is a tax on imports, so the world supply curve with the tariff is shifted up by the amount of the tariff, to P1. Removing the tariff shifts the world supply curve back down to P2, so the domestic price of rice falls from P1 to P2.
- Change in consumer surplus: Consumer surplus is the area below the demand curve and above the price consumers pay. Before the tariff is removed, consumers pay P1 and consume up to Q3, so their surplus is the area above P1, below Ddomestic, up to Q3. After removal, they pay P2 and consume up to Q4, so surplus is the area above P2, below Ddomestic, up to Q4. The difference between these two areas is the gain in consumer surplus: this is the four-sided area bounded by P1 (on the vertical axis), point V (Q3, P1), point U (Q4, P2), and P2 (on the vertical axis) — the quadrilateral P1VUP2. This area includes both the extra surplus consumers get on the units they already bought (Q1 to Q3, where they now pay P2 instead of P1) and the surplus from the additional units they buy (Q3 to Q4) at the lower price.
- Change in government revenue: Government tariff revenue is the amount the government collects from the tariff, equal to the tariff per unit multiplied by the number of units imported. The tariff per unit is P1 - P2. With the tariff in place, imports are Q3 - Q2 (domestic demand Q3 minus domestic supply Q2 at P1), so total revenue is (P1 - P2) * (Q3 - Q2). On the diagram, this is the rectangle with corners at W (Q2, P1), V (Q3, P1), T (Q3, P2), and X (Q2, P2) — the area WVTX. When the tariff is removed, no tariff is collected on imports, so government revenue from this tariff falls to zero, meaning it decreases by the full amount of WVTX.
- Matching to options: The only option that states consumer surplus increases by P1VUP2 and government revenue decreases by WVTX is option C.
Key Takeaways
- A tariff raises the domestic price of an imported good above the world price, reducing consumer surplus and generating government revenue.
- Removing a tariff lowers the domestic price to the world price, increasing consumer surplus by the area between the two prices bounded by the demand curve, and eliminating government tariff revenue equal to the original tariff rectangle.
- When calculating changes in surplus or revenue from a price change, always identify the original and new equilibrium prices and quantities first, then match the relevant area on the diagram to the concept.
Common Mistakes
- Confusing the area of consumer surplus gain: some students incorrectly identify the gain as the triangle VUT, which is only part of the gain (the part from additional consumption), forgetting the rectangle representing the gain on existing consumption.
- Misidentifying the government revenue area: some students incorrectly use the area WVQ3Q2, which is not a rectangle aligned with the price difference, or forget that government revenue is the tariff per unit times import volume, not total import value.
- Mixing up the direction of change: government revenue always falls to zero when a tariff is removed, so it must decrease by the full original tariff revenue, not a partial amount.
- Forgetting that consumer surplus includes both the gain on units already purchased and the gain from new units consumed at the lower price.
Things to Be Careful About
- Always label the axes and curves correctly when interpreting trade diagrams: the vertical axis is price, horizontal is quantity, downward-sloping is demand, upward-sloping is domestic supply, horizontal lines are world supply with and without tariff.
- When identifying areas for surplus or revenue, ensure the area is bounded by the correct curves and price lines: consumer surplus is always below the demand curve and above the price paid; tariff revenue is always the rectangle between the two price lines, bounded by domestic supply and demand at the tariff price.
- Check that the area for consumer surplus gain extends to the new quantity demanded (Q4) after the price fall, not just the original quantity (Q3).
- Confirm that the government revenue area uses the import quantity with the tariff (Q3 - Q2), not the import quantity without the tariff.
Your score so far
Answer a question to start scoring
Your marks add up here as you work through the paper.