Economics 9708/11 — October/November 2025
Cambridge AS Level · AS Level Multiple Choice · answer key with instant marking and worked solutions
Topics Fiscal Policy · Reasons for Government Intervention in Markets · Market Equilibrium and the Price Mechanism · Monetary Policy · Income and Wealth Inequality · Production Possibility Curves · +13 more
Tap an option under each question to check it — your score builds as you go.
What is an example of a normative statement?
Options
A Indirect taxes are cheap to collect.
B Indirect taxes are taxes on income.
C Indirect taxes are unfair.
D Indirect taxes increase inequality.
Answer
A normative statement is based on a value judgement and cannot be tested. Option C, 'Indirect taxes are unfair', expresses an opinion, making it normative. The other options are positive statements that can be tested.
C
Background Concept
Economics is a social science that seeks to explain behaviour and resource allocation. A key distinction is between positive and normative statements. Positive statements are objective and can be tested against factual evidence. Normative statements are subjective and based on value judgements; they cannot be proven true or false.
Understanding the Question
The question asks for an example of a normative statement. We need to identify which of the four options contains a value judgement rather than a testable fact.
Approach
Recall the definition: normative statements often contain words like 'should', 'ought', 'fair', 'unfair', 'good', 'bad'. Positive statements can be verified by examining data. Examine each option for the presence of such value-laden language.
Step-by-Step Reasoning
- Option A: 'Indirect taxes are cheap to collect.' This is a factual claim about the cost of administration. It can be tested by looking at actual collection costs, so it is positive.
- Option B: 'Indirect taxes are taxes on income.' This is a factual statement about the nature of indirect taxes. Even though it is incorrect (indirect taxes are on expenditure, not income), it is still a positive statement because it can be tested and shown to be false.
- Option C: 'Indirect taxes are unfair.' The word 'unfair' expresses a value judgement. It is a matter of opinion; there is no objective test to determine whether a tax is fair or unfair. This is a normative statement.
- Option D: 'Indirect taxes increase inequality.' This is a claim about the effect of indirect taxes on income distribution. It can be tested by measuring inequality before and after the imposition of such taxes, so it is positive.
Therefore, the correct answer is C.
Key Takeaways
- Normative statements involve value judgements and cannot be tested.
- Positive statements are factual and can be verified or falsified.
- Look for opinion words such as 'fair', 'unfair', 'should', 'ought', 'better', 'worse' to identify normative statements.
Common Mistakes
- Mistaking a false positive statement for a normative statement. A statement can be false but still be positive if it is testable.
- Thinking that any statement about a contested issue is normative. Even controversial claims can be positive if they are testable.
Things to Be Careful About
- Pay attention to the exact wording. A statement that appears factual may contain a hidden value judgement. For example, 'Indirect taxes are too high' is normative because 'too high' is a judgement.
- In exam questions, the presence of words like 'should', 'must', 'unfair', 'unjust' almost always indicates a normative statement.
A country with a market economy changes to a mixed economy.
When is this change likely to achieve the largest improvement in resource allocation?
Options
| number of demerit goods in the country | Gini coefficient value for the country | |
|---|---|---|
| A | many | 0.4 |
| B | many | 0.7 |
| C | few | 0.4 |
| D | few | 0.7 |
Reasoning
A mixed economy introduces government intervention to correct market failures. The largest improvement in resource allocation occurs where market failures are most severe.
- Many demerit goods indicate significant over-consumption due to imperfect information, a clear market failure that government can address (e.g., through taxation or regulation).
- A higher Gini coefficient (0.7) indicates greater income inequality, which can lead to inefficient resource allocation and social costs; government redistribution can improve equity and potentially efficiency.
Option B combines both severe failures: many demerit goods and a Gini coefficient of 0.7. This scenario offers the greatest scope for improvement through government intervention.
Answer
B
B
Background Concept
In a pure market economy, resources are allocated by the price mechanism. However, markets can fail to achieve an efficient or equitable outcome. Two common market failures are:
- Demerit goods: goods that are over-consumed because consumers underestimate the private costs (e.g., cigarettes, alcohol). Government intervention (taxes, bans, information campaigns) can reduce consumption and improve welfare.
- Income inequality: measured by the Gini coefficient (0 = perfect equality, 1 = perfect inequality). High inequality can lead to under-consumption by the poor, social unrest, and inefficient allocation of resources. Government redistribution (progressive taxes, transfers) can improve equity and potentially economic efficiency.
A mixed economy combines market forces with government intervention to correct such failures. The potential improvement in resource allocation from moving to a mixed economy depends on the severity of existing market failures.
Understanding the Question
The question asks: when is the change from a market economy to a mixed economy likely to achieve the largest improvement in resource allocation? It provides two binary conditions: the number of demerit goods (many or few) and the Gini coefficient (0.4 or 0.7). We must select the combination that implies the most severe market failures, because that is where government intervention can have the greatest positive impact.
Approach
- Identify which condition indicates a more severe market failure for each variable.
- For demerit goods: many demerit goods means a larger problem of over-consumption, so greater need for intervention.
- For inequality: a higher Gini coefficient (0.7) indicates greater inequality, so more scope for improvement through redistribution.
- The combination with both severe failures (many demerit goods and high Gini) will yield the largest improvement.
Step-by-Step Reasoning
- Option A: many demerit goods (severe failure) but Gini 0.4 (moderate inequality). Improvement from addressing demerit goods, but less from inequality.
- Option B: many demerit goods (severe) and Gini 0.7 (severe inequality). Both failures are severe, so government intervention can address both, leading to the largest overall improvement.
- Option C: few demerit goods (mild failure) and Gini 0.4 (moderate inequality). Limited scope for improvement.
- Option D: few demerit goods (mild) and Gini 0.7 (severe inequality). Improvement mainly from inequality, but less from demerit goods.
Thus, Option B offers the greatest combined potential for improvement.
Key Takeaways
- The effectiveness of government intervention in a mixed economy depends on the severity of market failures.
- Demerit goods and income inequality are two distinct market failures that can be addressed by government policy.
- The Gini coefficient is a measure of inequality; higher values indicate greater inequality.
- When evaluating policy changes, consider the magnitude of the problem being addressed.
Common Mistakes
- Thinking that a lower Gini coefficient (more equality) is always better; but the question asks for the largest improvement, which requires the largest initial problem.
- Ignoring one of the two conditions and choosing based on only one factor.
- Confusing the Gini coefficient direction: 0.7 is more unequal than 0.4.
Things to Be Careful About
- Read the table carefully: the columns are number of demerit goods and Gini coefficient.
- Remember that a higher Gini coefficient means greater inequality, which is a more severe market failure in terms of equity and potential efficiency losses.
- The question asks for the largest improvement, not the best outcome after intervention; it is about the potential gain from moving to a mixed economy.
The diagram shows a production possibility curve for an economy that produces capital goods and consumer goods.
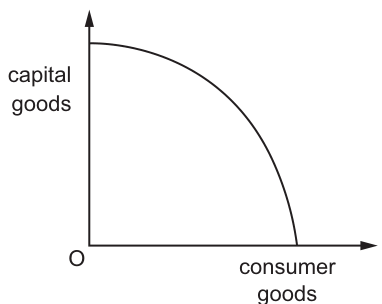
Why is the production possibility curve drawn concave to the origin?
Options
A Capital goods are a more labour-intensive output than consumer goods.
B Consumers always seek to maximise their satisfaction from consumption.
C Profit maximisation for firms always ensures efficiency in production.
D Some resources are more efficient in production of some goods than others.
Reasoning
A concave production possibility curve (PPC) reflects increasing opportunity cost, which arises because resources are not equally efficient in producing all goods. As an economy shifts resources to produce more of one good, it must use resources that are increasingly less suited to that production, raising the opportunity cost of each additional unit and creating the concave shape.
- Option A is incorrect: labour intensity of production does not determine the shape of the PPC.
- Option B is incorrect: consumer satisfaction maximisation is a consumer theory concept unrelated to the PPC's form.
- Option C is incorrect: profit maximisation is a firm objective and does not explain the PPC's curvature.
- Option D is correct: it accurately identifies that resources have varying efficiencies across different types of production, which is the cause of increasing opportunity cost and the concave PPC.
Answer
D
D
Background Concept
A production possibility curve (PPC) is a fundamental economic model that illustrates the maximum possible output combinations of two goods an economy can produce with its existing resources and technology, assuming all resources are fully and efficiently employed, and there is no economic growth.
The shape of the PPC reveals the nature of opportunity cost: the value of the next best alternative forgone when a choice is made. A concave (bowed-out from the origin) PPC represents increasing opportunity cost. This means that as an economy produces more of one good, the opportunity cost of each additional unit of that good rises.
This increasing opportunity cost stems from the heterogeneity of resources: resources are not equally productive in all uses. For example, some land is ideally suited to growing crops (a consumer good), while other land is better used for building factories (a capital good). Some workers have manufacturing skills suited to producing capital goods, while others have skills better matched to producing consumer goods. When an economy first shifts resources from capital goods to consumer goods, it moves resources that are relatively efficient at producing consumer goods, so the opportunity cost (in terms of lost capital goods output) is low. But as it produces more and more consumer goods, it must start using resources that are better suited to making capital goods, which are far less efficient at producing consumer goods. Each extra unit of consumer goods therefore requires giving up more and more capital goods, making the PPC curve steeper as it moves along the horizontal axis, hence its concave shape. A straight-line PPC would only occur if all resources were perfectly adaptable to producing both goods, which is not realistic in any actual economy.
Understanding the Question
The question presents a standard PPC with capital goods on the vertical axis and consumer goods on the horizontal axis, and asks why the curve is drawn concave to the origin. This is a 1-mark multiple-choice question that tests core recall of PPC theory. The task is to identify the single correct economic reason for the concave shape, and reject the three irrelevant distractor options. The question does not require calculation or extended analysis, only accurate application of the concept of increasing opportunity cost to the PPC model.
Approach
The correct approach is to first link the concave PPC shape to its underlying cause: increasing opportunity cost from resource heterogeneity. Then evaluate each option against this core principle:
- Eliminate any options that reference unrelated economic concepts (consumer behaviour, firm objectives, factor intensity) as these cannot explain the PPC's shape.
- Select the option that directly describes the reason for increasing opportunity cost.
Step-by-Step Reasoning
- First, confirm the core link: the concave shape of the PPC is a direct visual representation of increasing opportunity cost, which only arises when resources are not equally efficient at producing all goods.
- Evaluate Option A: "Capital goods are a more labour-intensive output than consumer goods." Labour intensity refers to the share of labour in total production costs, but this has no connection to the shape of the PPC. The PPC's curvature depends on how easily resources can be reallocated between the two goods, not the factor mix of each good. This option is irrelevant.
- Evaluate Option B: "Consumers always seek to maximise their satisfaction from consumption." This is the utility maximisation assumption from consumer theory, which explains how individual consumers make choices between goods, not the shape of an economy's production possibility curve. The PPC is a model of production capacity, not consumer preferences, so this option is unrelated.
- Evaluate Option C: "Profit maximisation for firms always ensures efficiency in production." Profit maximisation is a key objective of private firms, and while it may lead to productive efficiency in individual markets, it does not explain why the PPC is concave. The shape of the PPC is determined by the inherent properties of the economy's resources, not the behaviour of individual firms, so this option is incorrect.
- Evaluate Option D: "Some resources are more efficient in production of some goods than others." This statement directly describes the heterogeneity of resources that causes increasing opportunity cost. When resources are shifted from capital goods to consumer goods, the least efficient resources for consumer goods production are the last to be reallocated, so the opportunity cost of each additional unit of consumer goods rises, creating the concave curve. This is the correct explanation.
Key Takeaways
- The concave shape of a PPC is always a sign of increasing opportunity cost, which is caused by resources being better suited to some types of production than others.
- When answering questions about PPC shape, always link the shape to resource efficiency and opportunity cost; options referencing consumer behaviour, firm objectives, or factor intensity are almost always distractors.
- The PPC is a model of production possibilities, so only factors related to the economy's resources and technology can explain its shape.
Common Mistakes
- Selecting options that reference unrelated concepts: students often pick options related to consumer utility or firm profit maximisation, which are not relevant to the PPC's construction.
- Confusing the PPC with consumer choice models: the PPC is about what an economy can produce, not what consumers want to buy, so options about consumer preferences are incorrect.
- Forgetting that the concave shape is the standard realistic case: a straight-line PPC is only a theoretical simplification for when resources are perfectly adaptable, which is not the case in real economies.
Things to Be Careful About
- The PPC assumes all resources are fully and efficiently employed, so the shape is purely determined by the trade-off between the two goods given resource heterogeneity.
- For 1-mark MCQs, you only need to identify the correct option, but understanding the underlying theory helps you eliminate wrong options quickly.
- Always check that the option you select directly addresses the cause of the PPC's shape, not a related but separate economic concept.
What is an example of a public good?
Options
A A ferry that takes members of the public across a river.
B A fish farm that is owned by the government.
C A fishing boat that is owned by all members of a village.
D A lighthouse that warns boats of dangerous rocks.
Reasoning
A public good is defined by two characteristics: non-rivalry (one person's consumption does not reduce the amount available for others) and non-excludability (no one can be effectively excluded from using it). Option D (a lighthouse) is non-rival because one ship using the light does not diminish its availability to other ships, and non-excludable because it is impossible to prevent passing ships from seeing the light. Options A (a ferry), B (a fish farm owned by the government), and C (a fishing boat owned by the village) are all rival (consumption by one reduces availability for others) and excludable (access can be restricted by charging a fare, owning the farm, or controlling the boat). Therefore, only the lighthouse is a public good.
Answer
D
D
Background Concept
A public good has two key characteristics: non-rivalry and non-excludability. Non-rivalry means that one person's consumption of the good does not reduce the quantity available for others. Non-excludability means that it is impossible (or extremely costly) to prevent anyone from consuming the good, even if they have not paid. These characteristics lead to the free-rider problem: individuals can benefit from the good without paying, so private markets will underprovide public goods. This is why governments often provide them directly (e.g., national defence, street lighting, lighthouses).
In contrast, a private good (or economic good) is both rival and excludable. A common resource (or common pool resource) is rival but non-excludable (e.g., fish in the ocean). A club good (or artificially scarce good) is non-rival but excludable (e.g., satellite TV, toll roads).
Understanding the Question
The question asks for an example of a public good from four options. It tests whether you can apply the theoretical definition to real-world scenarios and distinguish public goods from other types of goods that might be provided by the public sector or collectively owned.
Approach
- Recall the two defining characteristics of a public good.
- Evaluate each option against both criteria.
- Select the option that satisfies both non-rivalry and non-excludability.
Step-by-Step Reasoning
- Option A: A ferry. A ferry carries passengers across a river. If the ferry is full, an additional passenger cannot board (rival). The operator can charge a fare and exclude those who do not pay (excludable). Therefore, it is a private good, not a public good.
- Option B: A fish farm owned by the government. Even though the government owns it, the fish are cultivated and harvested. One fish consumed by a person reduces the stock available for others (rival). The government can restrict access to those who pay or have a license (excludable). This is a private good provided by the public sector, not a public good.
- Option C: A fishing boat owned by all members of a village. The village collectively owns the boat, but the fish caught are still rival (one fish taken reduces the catch for others) and the boat can be controlled (excludable – the village can decide who uses it). This is a common resource (if the fish are non-excludable but rival) or a club good (if the boat use is excludable). It does not meet the non-excludability criterion because access to the boat can be limited.
- Option D: A lighthouse. A lighthouse warns boats of dangerous rocks. Once built, the light is available to all passing ships; one ship's use does not reduce the light for others (non-rival). It is impossible to prevent any ship from seeing the light without very costly technology (non-excludable). Therefore, a lighthouse is a classic textbook example of a public good.
Key Takeaways
- Public goods are defined by non-rivalry and non-excludability, not by who owns or provides them.
- Government provision does not make a good a public good; many government-provided goods are private goods (e.g., public transport, state-owned farms).
- Common resources (e.g., fish in the sea) are rival but non-excludable; they are not pure public goods because they are rival.
- Be careful not to confuse “public” in the sense of “open to all” with the economic definition of a public good.
Common Mistakes
- Choosing an option because it is owned or provided by the government (e.g., a fish farm). This confuses the provider with the nature of the good.
- Choosing a common resource (e.g., a fishing boat used by all villagers) because it is non-excludable; but it is actually rival, so it fails the non-rivalry test.
- Thinking that a good can be a public good if it is free to use (e.g., a ferry with no fare) but ignoring that it is still rival when congested.
Things to Be Careful About
- Always apply both criteria explicitly in your reasoning.
- Remember that a good can be non-rival but excludable (club good) – that is not a public good because of excludability.
- A good can be non-excludable but rival (common resource) – also not a public good.
- The classic examples from textbooks (lighthouses, national defence, street lighting) are reliable, but newer examples like digital goods may also work if they meet both criteria. In this question, the lighthouse is the safest answer.
Which merit good is likely to be under-consumed the most?
Options
| level of imperfect information among consumers | subsidy received by producers | |
|---|---|---|
| A | high | yes |
| B | high | no |
| C | low | yes |
| D | low | no |
Working
Merit goods are under-consumed because consumers have imperfect information about their benefits. The greater the level of imperfect information, the more the good is under-consumed. A subsidy reduces the price and encourages consumption, thereby reducing under-consumption.
Therefore, the combination that leads to the most under-consumption is high imperfect information and no subsidy.
Answer
B
B
Background Concept
Merit goods are goods that are under-consumed in a free market because consumers do not fully appreciate the long-term benefits of consuming them. This arises from imperfect information – consumers may not realise the positive externalities or personal benefits (e.g., education, healthcare, vaccinations). As a result, the market equilibrium quantity is less than the socially optimal quantity. Government intervention, such as subsidies, can help correct this by lowering the price and increasing consumption.
Understanding the Question
The question presents a table with two factors: the level of imperfect information among consumers (high or low) and whether the producers receive a subsidy (yes or no). You are asked to identify which combination of these factors leads to a merit good being under-consumed the most. The answer requires comparing the effect of each factor on the degree of under-consumption.
Approach
First, recognise that a higher level of imperfect information causes greater under-consumption. Second, a subsidy reduces under-consumption because it lowers the price and encourages more consumption. Therefore, the worst-case scenario (most under-consumption) is when imperfect information is high and there is no subsidy. Option B matches this combination.
Step-by-Step Reasoning
- For a merit good, under-consumption occurs because consumers underestimate the benefits (imperfect information). The higher the imperfect information, the larger the gap between market consumption and optimal consumption.
- A subsidy to producers reduces the price faced by consumers, shifting the supply curve rightwards, increasing quantity demanded, and thus reducing under-consumption.
- Consider each option:
- Option A: high imperfect information (worse) but with a subsidy (better). The subsidy partially offsets the under-consumption, so it is not the worst.
- Option B: high imperfect information (worse) and no subsidy (no correction). This is the worst case.
- Option C: low imperfect information (less severe) and a subsidy (further correction). This is the best case.
- Option D: low imperfect information (less severe) and no subsidy (some under-consumption but not as much as high imperfect information).
- Therefore, B is the correct answer.
Key Takeaways
- Merit goods are under-consumed due to imperfect information.
- Subsidies can correct under-consumption by reducing price.
- The extent of under-consumption depends on both the severity of the information problem and the presence of corrective policies.
Common Mistakes
- Confusing merit goods with public goods: merit goods are rival and excludable but under-consumed; public goods are non-rival and non-excludable and not provided by the market.
- Thinking that a subsidy always increases under-consumption: it actually reduces it by lowering price.
- Misreading the table: note that 'yes' for subsidy means the subsidy is in place, reducing under-consumption.
Things to Be Careful About
- Read the table carefully: the 'subsidy received by producers' column indicates whether the subsidy exists. A 'yes' means the government is subsidising, which reduces under-consumption.
- Remember that higher imperfect information leads to more under-consumption, not less.
- The question asks for 'likely to be under-consumed the most', so choose the combination that maximises under-consumption.
Which statement defines market equilibrium?
Options
A when ceteris paribus no longer applies
B when quantity demanded equals quantity supplied
C when quantity demanded is equal to price
D when supply can no longer expand
Answer
Market equilibrium occurs when the quantity demanded equals the quantity supplied at a given price. This is the standard economic definition, making option B correct.
B
Background Concept
In a competitive market, the equilibrium price and quantity are determined by the intersection of the demand and supply curves. At this point, the quantity that consumers are willing and able to buy (quantity demanded) exactly matches the quantity that producers are willing and able to sell (quantity supplied). This is known as market equilibrium. The condition is often expressed as Qd = Qs.
Understanding the Question
The question asks for the correct definition of market equilibrium from four given statements. This tests basic understanding of the core concept in demand and supply analysis. The answer must be the one that accurately captures the condition for equilibrium.
Approach
Recall the exact definition of market equilibrium: the state where the plans of buyers and sellers are consistent, i.e., quantity demanded equals quantity supplied. Then evaluate each option against this definition.
Step-by-Step Reasoning
- Option B states "when quantity demanded equals quantity supplied". This is the precise definition. At equilibrium, there is no tendency for change unless external factors shift demand or supply. Hence B is correct.
- Option A says "when ceteris paribus no longer applies". Ceteris paribus is an assumption used in economic analysis, not a definition of equilibrium. It is unrelated.
- Option C says "when quantity demanded is equal to price". This confuses quantity with price. Quantity is measured in units, price in monetary units; they are not directly comparable. Moreover, equilibrium is about equality of quantities, not quantity and price.
- Option D says "when supply can no longer expand". This is not a definition; supply can expand under certain conditions regardless of equilibrium. Equilibrium does not imply supply is fixed.
Thus, only B correctly defines market equilibrium.
Key Takeaways
- Market equilibrium is a fundamental concept: it is the condition where quantity demanded equals quantity supplied.
- Understanding this definition is essential for analysing how prices adjust to balance markets.
- Be able to distinguish equilibrium from other related terms like disequilibrium, surplus, or shortage.
Common Mistakes
- Confusing equilibrium with "market clearing" (though it is the same, the question expects the specific equality).
- Selecting option C by reading too quickly and thinking "equals" but mismatching variables.
- Thinking equilibrium requires ceteris paribus to hold, but ceteris paribus is an assumption for analysis, not part of the definition.
Things to Be Careful About
- In multiple-choice questions, read each option carefully; do not jump to the first that sounds familiar.
- Remember that equilibrium refers to equality of quantities demanded and supplied, not equality with price or any other variable.
- The term "equilibrium" in economics always implies a balance of opposing forces; here, buyers' and sellers' intentions.
The curve in the diagram shows a relationship between the price and the quantity of a product. It has not been given a label.
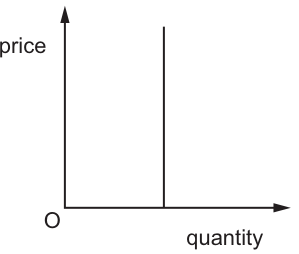
What is an accurate description of the curve?
Options
A a perfectly elastic demand curve
B a perfectly inelastic supply curve
C a relatively elastic supply curve
D a unitary elastic demand curve
Reasoning
The diagram shows a vertical curve at a fixed quantity, meaning the quantity supplied does not change regardless of the price level. This is the defining feature of a perfectly inelastic supply curve, where price elasticity of supply (PES) equals 0.
- Option A (perfectly elastic demand) is a horizontal curve, as quantity demanded changes infinitely with any price change, so it does not match the vertical line.
- Option C (relatively elastic supply) is a relatively flat upward-sloping curve, where quantity supplied changes proportionally more than price, so it does not match the vertical line.
- Option D (unitary elastic demand) is a curved downward-sloping line where the percentage change in quantity demanded equals the percentage change in price, not a vertical straight line, so it is incorrect.
Answer
B
B
Background Concept
Price elasticity of supply (PES) measures the responsiveness of the quantity supplied of a good to a change in its price, calculated as the percentage change in quantity supplied divided by the percentage change in price. The value of PES determines the shape of the supply curve on a price-quantity diagram:
- Perfectly inelastic supply (PES = 0): Quantity supplied is fixed at all price levels, so the supply curve is a vertical straight line. This occurs when a good cannot be increased in quantity in the relevant time period, for example, a fixed number of original artworks by a deceased artist, or seats in a stadium for a one-off event.
- Perfectly elastic supply (PES = infinity): Any price change leads to an infinite change in quantity supplied, so the supply curve is a horizontal straight line. This occurs when firms can supply any quantity at a specific price, but none at a lower price.
- Relatively elastic supply (PES > 1): Quantity supplied changes proportionally more than price, so the curve is relatively flat and upward-sloping.
- Relatively inelastic supply (PES < 1): Quantity supplied changes proportionally less than price, so the curve is relatively steep and upward-sloping.
- Unitary elastic supply (PES = 1): The percentage change in quantity supplied equals the percentage change in price.
Demand curves follow different rules: standard demand curves are downward-sloping (higher price leads to lower quantity demanded). A perfectly elastic demand curve is horizontal, while a unitary elastic demand curve is a curved hyperbolic line, not a straight vertical line.
Understanding the Question
The question provides a price-quantity diagram (Fig. 7.1) with a vertical unlabelled straight line, and asks you to select the correct description of this curve from four options. This is a 1-mark multiple-choice question testing your ability to link the shape of a curve to its elasticity type, and to distinguish between demand and supply curve characteristics. The key given information is the vertical shape of the curve, and the labelled axes (price on the vertical axis, quantity on the horizontal axis).
Approach
First, observe the core feature of the curve: it is vertical, meaning quantity is fixed no matter what the price is. Next, recall the definition of PES and the shape of supply curves for different PES values, as well as the shapes of the demand curves listed in the options. Eliminate any options that do not match the vertical shape, then select the remaining correct option.
Step-by-Step Reasoning
- Analyse the curve's shape: The vertical line intersects the horizontal (quantity) axis at a single fixed value. This means that even if the price rises or falls, the quantity of the product remains unchanged. This is a supply curve, as it shows the quantity that producers are willing to sell at different prices, and the fixed quantity implies producers cannot increase output in response to higher prices.
- Match to PES definitions: A supply curve with zero responsiveness of quantity to price has a PES of 0, which is defined as perfectly inelastic supply. This matches the vertical curve in the diagram.
- Eliminate incorrect options:
- Option A describes a perfectly elastic demand curve, which is horizontal (not vertical), so it is incorrect.
- Option C describes a relatively elastic supply curve, which is a flat upward-sloping line (not vertical), so it is incorrect.
- Option D describes a unitary elastic demand curve, which is a curved downward-sloping line (not a straight vertical line), so it is incorrect.
- Confirm the correct option: Only Option B matches the vertical curve in the diagram, as it describes a perfectly inelastic supply curve.
Key Takeaways
- The shape of a supply curve directly corresponds to its PES value: vertical = perfectly inelastic (PES=0), horizontal = perfectly elastic (PES=∞), flat upward-sloping = relatively elastic (PES>1), steep upward-sloping = relatively inelastic (PES<1).
- Always distinguish between demand and supply curves when identifying elasticity from a diagram: standard demand curves slope downward, while standard supply curves slope upward, with only two exceptions (perfectly elastic and perfectly inelastic supply).
- Perfectly inelastic supply is a realistic scenario in the short run for goods with fixed supply, such as agricultural products immediately after harvest, or tickets for a specific sporting event.
Common Mistakes
- Confusing perfectly inelastic supply with perfectly inelastic demand: while both are vertical curves, the options only include a perfectly inelastic supply option, and the other demand-related options do not match the vertical shape, so this confusion would lead to an incorrect answer here.
- Mixing up perfectly inelastic (vertical) and perfectly elastic (horizontal) supply: these are opposite extremes of elasticity, so mixing up their shapes is a frequent error that would lead to selecting Option A or C incorrectly.
- Assuming a straight line is unitary elastic: unitary elastic demand or supply curves are curved, not straight, so a vertical straight line cannot be a unitary elastic curve.
Things to Be Careful About
- Always check the axis labels first: the diagram has price on the vertical axis and quantity on the horizontal axis, which confirms the curve is a standard price-quantity relationship, so elasticity definitions apply directly.
- For 1-mark multiple-choice questions, you do not need to write detailed reasoning, but it is useful to quickly eliminate wrong options by matching the curve shape to the correct elasticity definition to avoid careless errors.
Which statement is true if the income elasticity of demand for a good has a value of -0.2?
Options
A When income rises less of the good is bought.
B When income rises more of the good is bought.
C When price falls more of the good is bought.
D When price rises less of the good is bought.
Reasoning
Income elasticity of demand (YED) measures the responsiveness of quantity demanded to a change in income. A negative YED (-0.2) indicates that the good is an inferior good: as income rises, demand falls, and as income falls, demand rises. The value -0.2 means that a 1% increase in income leads to a 0.2% decrease in quantity demanded. Option A correctly states that when income rises, less of the good is bought. Options C and D refer to price changes, which are measured by price elasticity, not income elasticity. Option B would be true for a positive YED (normal good).
Answer
A
A
Background Concept
Income elasticity of demand (YED) is defined as the percentage change in quantity demanded divided by the percentage change in income. It measures how sensitive consumer demand is to changes in income. The sign of YED indicates the type of good: a positive YED (YED > 0) indicates a normal good – demand rises when income rises. A negative YED (YED < 0) indicates an inferior good – demand falls when income rises. The magnitude of YED indicates the degree of responsiveness: if YED > 1, the good is a luxury (income elastic); if 0 < YED < 1, it is a necessity (income inelastic). Inferior goods always have negative YED, but they are often necessities that consumers switch away from as they become able to afford better alternatives.
Understanding the Question
The question gives a specific YED value of -0.2 and asks which statement is true. The student must recognise that YED refers to income changes, not price changes. The options include two statements about income changes (A and B) and two about price changes (C and D). Only the income statements are relevant to YED. Among the income statements, a negative YED means that an increase in income reduces demand, so A is correct and B is incorrect. The price statements are irrelevant because they refer to price elasticity of demand (PED), not YED.
Approach
The simplest approach is to recall the definition of YED and the meaning of a negative sign. Then evaluate each option: check if the option describes an income change, and if so, whether the direction of change in quantity demanded matches the sign of YED. Options that describe price changes are automatically false in the context of YED.
Step-by-Step Reasoning
- Recall YED = (% change in quantity demanded) / (% change in income). A value of -0.2 means that if income increases by 1%, quantity demanded decreases by 0.2%.
- The good is inferior because the sign is negative.
- Option A: "When income rises less of the good is bought." This matches the negative YED: income rise -> demand falls -> less bought. So A is true.
- Option B: "When income rises more of the good is bought." This would require a positive YED. Therefore B is false.
- Option C: "When price falls more of the good is bought." This describes a relationship between price and quantity, which is the domain of price elasticity of demand (PED). YED does not measure price sensitivity, so it is not relevant. Even if one considered the price change, the statement could be true for a normal good, but it is not a statement about YED. So C is false.
- Option D: "When price rises less of the good is bought." Again, this is about price, not income. For a normal good, a price rise generally reduces demand, but again not a YED statement. So D is false.
- Therefore only A is correct.
Key Takeaways
- Income elasticity of demand is specifically about the response of demand to income changes, not price changes.
- The sign of YED tells whether the good is normal (positive) or inferior (negative).
- The magnitude of YED tells the degree of responsiveness.
- In multiple-choice questions, read carefully: the variable being changed (income or price) is determined by the elasticity concept being tested.
Common Mistakes
- Confusing YED with PED: students may think a negative YED means demand falls when price rises, but that is PED (which is usually negative). Here the negative sign refers to income, not price.
- Assuming all goods with negative YED are of low quality, but an inferior good is simply one for which demand falls as income rises; it is a relative concept.
- Overlooking that the question asks for the statement that is true given the YED value, not general knowledge about the good.
Things to Be Careful About
- Pay attention to the variable being changed: income vs price.
- Remember that YED can be negative, positive, or zero.
- The value -0.2 is small, so the good is income inelastic, but that is not needed to answer the question; the sign alone determines the direction.
The table shows the price of a good and total expenditure on the good during specific periods when the market is in equilibrium.
| period | price ($) | total expenditure ($) |
|---|---|---|
| 1 | 12 | 96 000 |
| 2 | 5 | 40 000 |
| 3 | 8 | 64 000 |
| 4 | 10 | 80 000 |
| 5 | 4 | 32 000 |
What can be deduced from this data?
Options
A The good has constant opportunity cost.
B The good is an inferior good.
C The price elasticity of demand is equal to one.
D The price elasticity of supply is equal to zero.
Reasoning
For each period, quantity = total expenditure / price:
- Period 1: 96,000 / 12 = 8,000
- Period 2: 40,000 / 5 = 8,000
- Period 3: 64,000 / 8 = 8,000
- Period 4: 80,000 / 10 = 8,000
- Period 5: 32,000 / 4 = 8,000
The equilibrium quantity is the same (8,000 units) at every price. This can occur only if the supply curve is perfectly inelastic (vertical), so that demand shifts change only the price, not the quantity. Hence, price elasticity of supply is zero. Options A and B are irrelevant to the data. Option C (PED = 1) would require total expenditure to be constant when price changes, which is not the case. Therefore, D is correct.
Answer
D
D
Background Concept
Price elasticity of supply (PES) measures the responsiveness of quantity supplied to a change in price: PES = (% change in quantity supplied) / (% change in price). When PES = 0, supply is perfectly inelastic; the supply curve is vertical, meaning quantity supplied does not change at all when price changes. In a market equilibrium, the observed combination of price and quantity is where demand and supply intersect. If one of the curves is perfectly inelastic, that determines the nature of changes.
Understanding the Question
The table gives equilibrium price and total expenditure (price x quantity) for five different periods. From this, we can compute quantity demanded/supplied (they are equal in equilibrium) for each period. The question asks what can be deduced from the data. The options refer to opportunity cost, inferior good, price elasticity of demand = 1, and price elasticity of supply = 0.
Approach
- Calculate quantity for each period: Q = total expenditure / price.
- Observe that quantity is identical (8,000) in all periods, despite different prices.
- Realise that this pattern occurs when one of the curves is perfectly inelastic. If supply is perfectly inelastic, any change in demand will change price but not quantity. If demand is perfectly inelastic, any change in supply will also leave quantity unchanged. Both are possible, but the only option about inelasticity given is PES = 0 (D). Evaluate each option and conclude D is correct.
Step-by-Step Reasoning
- Calculation: For Period 1: $12 price, $96,000 total expenditure -> Q = 96,000 / 12 = 8,000. Repeat for all periods, all yield 8,000.
- The constancy of Q implies that the equilibrium quantity is unresponsive to price changes. This points to a perfectly inelastic relationship.
- If supply were perfectly elastic (horizontal), then changes in demand would change quantity but not price. The data show price changing, not quantity, so that is not the case.
- If supply were perfectly inelastic (vertical), shifts in demand (due to changes in tastes, income, etc.) would move along the vertical supply curve, changing the equilibrium price but leaving quantity unchanged. This matches the data.
- Option C: "price elasticity of demand is equal to one". If PED = 1, total expenditure would be constant when price changes. Here, total expenditure changes (96,000 vs 40,000), so PED != 1. Also, PED = 1 does not directly explain constant quantity at different prices unless supply shifts in a specific way.
- Option A: "constant opportunity cost" is about production possibility curves, not directly relevant.
- Option B: "inferior good" relates to income changes, not shown in data.
- Therefore, only option D is a valid deduction: the price elasticity of supply is zero (perfectly inelastic supply).
Key Takeaways
- Total expenditure = price x quantity. From this, quantity can be derived.
- A constant equilibrium quantity with varying price implies that one side of the market is perfectly inelastic. Which side depends on which curve is shifting.
- Perfectly inelastic supply means PES = 0; the supply curve is vertical.
- To answer such questions, compute the quantities and look for patterns.
Common Mistakes
- Mistakenly thinking that constant total expenditure implies anything. Here total expenditure varies.
- Confusing perfectly inelastic demand with perfectly inelastic supply. Both yield constant quantity if the other curve shifts, but the question tests which option is given.
- Not performing the calculation and jumping to conclusions.
- Thinking that PED = 1 explains constant quantity; but PED = 1 leads to constant total expenditure, not constant quantity.
Things to Be Careful About
- Always compute the actual quantities from the data provided.
- Understand that equilibrium data does not tell us which curve shifted; but we can deduce which curve is inelastic if other curve shifts.
- In multiple-choice, match the deduced property with the options given.
- PES = 0 means supply does not respond to price; PED = 0 means demand does not respond. Both are possible but only one option matches.
- Ensure the reasoning is based on the data, not on external assumptions.
What is an example of direct provision by a government?
Options
A The government introduces a subsidy on renewable fuels to help the environment.
B The government introduces a unit tax on cigarettes to discourage consumption.
C The government sets a maximum rent on housing to protect tenants.
D The government takes over a private library to improve local services.
Reasoning
Direct provision occurs when the government itself supplies a good or service, rather than using taxes, subsidies, or regulations to influence private provision. Option D describes the government taking over a private library to improve local services, which is an example of the government directly providing a service.
Answer
D
D
Background Concept
Governments intervene in markets for various reasons, such as correcting market failures, redistributing income, or providing public goods. One method of intervention is direct provision, where the government itself supplies a good or service, often free at the point of use or at a subsidised price. This is common for public goods (like national defence) and merit goods (like education and healthcare), where the private market would under-provide them.
Other methods of intervention include:
- Taxes and subsidies: Changing prices to influence behaviour.
- Regulation: Setting rules, such as maximum or minimum prices.
- Provision of information: Educating consumers to change their choices.
Understanding the Question
The question asks for an example of "direct provision" by a government. You need to identify which of the four options describes the government itself producing or supplying a good or service, rather than using another tool like a tax, subsidy, or price control.
Approach
- Recall the definition of direct provision: the government directly supplies a good or service.
- Evaluate each option against this definition.
- Eliminate options that describe other forms of intervention (subsidies, taxes, price controls).
- Select the option that matches direct provision.
Step-by-Step Reasoning
- Option A: "The government introduces a subsidy on renewable fuels to help the environment." A subsidy is a payment to producers or consumers to lower the price and encourage consumption. The government is not directly providing the fuel; it is using a financial incentive. This is not direct provision.
- Option B: "The government introduces a unit tax on cigarettes to discourage consumption." A tax is a levy on a good to raise its price and reduce demand. The government is not providing cigarettes; it is taxing them. This is not direct provision.
- Option C: "The government sets a maximum rent on housing to protect tenants." A maximum price (price ceiling) is a form of regulation. The government is not providing housing; it is controlling the price that private landlords can charge. This is not direct provision.
- Option D: "The government takes over a private library to improve local services." Here, the government is assuming ownership and operation of the library. It will now directly supply the library service to the public. This matches the definition of direct provision.
Therefore, the correct answer is D.
Key Takeaways
- Direct provision means the government itself produces or supplies a good or service.
- It is distinct from using taxes, subsidies, price controls, or information campaigns to influence private behaviour.
- Common examples include state-run schools, hospitals, public libraries, and national defence.
Common Mistakes
- Confusing a subsidy with direct provision. A subsidy is a financial incentive, not the government supplying the good itself.
- Thinking that any government action in a market is "direct provision." Regulation and taxation are different methods.
Things to Be Careful About
- Read the exact wording of each option. "Introduces a subsidy" is not the same as "provides the good."
- Remember that direct provision involves the government taking on the role of producer or supplier, not just influencing the market.
The graph shows the total economic welfare derived by citizens from a government’s expenditure on health and education services.
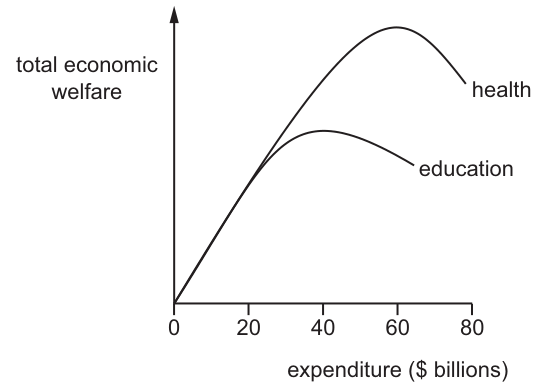
If the government has $60 billion of its budget to allocate between health and education services, which allocation will give its citizens the highest level of welfare?
Options
| health spending ($ billions) | education spending ($ billions) | |
|---|---|---|
| A | 0 | 60 |
| B | 20 | 40 |
| C | 40 | 20 |
| D | 60 | 0 |
Answer
The graph shows total economic welfare on the vertical axis and expenditure on the horizontal axis. To maximize total welfare, the government must choose the allocation where the combined welfare from health and education is highest.
- Option A (0, 60): Health welfare is zero; education welfare is low because $60 billion exceeds education's peak at $40–50 billion and welfare is falling.
- Option B (20, 40): Health welfare is moderate; education welfare is near its peak. However, because the health curve is steeper, the loss in health welfare from $40 billion to $20 billion is larger than the gain in education welfare from $20 billion to $40 billion, making the total lower than option C.
- Option C (40, 20): Health welfare is high (approaching its peak at $60–70 billion), and education welfare is still substantial and rising towards its peak. The sum of these two welfare values is greater than in the other options because the gain in education welfare from $0 to $20 billion exceeds the small loss in health welfare from $60 billion to $40 billion.
- Option D (60, 0): Health welfare is near its maximum, but education welfare is zero. The loss in education welfare outweighs the marginal gain in health welfare from increasing spending from $40 billion to $60 billion.
Therefore, the allocation that gives the highest total welfare is 40 billion on health and 20 billion on education.
C
C
Background Concept
This question tests the fundamental economic problem of scarcity and choice. Governments, like individuals and firms, face limited budgets (scarcity) and must decide how to allocate resources between competing uses—in this case, health and education. The graph is a welfare possibility curve (analogous to a Production Possibility Curve, PPC), showing the trade-off between total economic welfare derived from spending on the two services. Every point on the curve represents a different allocation of the fixed $60 billion budget, and the goal is to reach the point that maximizes total welfare. The concept of opportunity cost is central: spending an additional dollar on health means forgoing the welfare that dollar would have generated in education, and vice versa.
Understanding the Question
The question provides a graph with total economic welfare on the vertical axis and expenditure ($ billions) on the horizontal axis, ranging from 0 to 80. Two curves are shown: 'health' (steeper, peaking at 60–70 billion) and 'education' (flatter, peaking at 40–50 billion at a lower welfare level). The government has exactly $60 billion to allocate. The task is to identify which of the four given splits (A: 0/60, B: 20/40, C: 40/20, D: 60/0) yields the highest total welfare.
This is a one-mark multiple-choice item. The reasoning must identify that total welfare is the sum of welfare from both services, and that the optimal allocation is not necessarily at an extreme.
Approach
To solve this, estimate the total welfare for each option by reading the corresponding points on the two curves and summing them. The optimal allocation is the one where the sum of health welfare and education welfare is highest. Key observations from the graph:
- The health curve peaks around $60–70 billion, so welfare from health is high across the range 40–60.
- The education curve peaks around $40–50 billion, so welfare from education falls after $40–50 and is lower at $60 than at $40.
- At $20 billion, both curves are still rising, but health is already well above education.
Compare the options by considering marginal changes:
- Option D (60, 0) gives maximum health welfare but zero education welfare.
- Option C (40, 20) gives slightly less health welfare than D (since health is still rising toward its peak), but adds significant education welfare.
- The gain in education welfare from 0 to 20 likely exceeds the small loss in health welfare from 60 to 40, making C superior to D.
- Option B (20, 40) gives less health welfare than C and only slightly more education welfare (since education peaks at 40–50, the gain from 20 to 40 is smaller than the gain from 0 to 20 on health).
- Option A (0, 60) gives zero health welfare and low education welfare (past its peak).
Step-by-Step Reasoning
-
Read the axes and curves: Vertical axis = total economic welfare; horizontal axis = expenditure in $ billions. The health curve is above the education curve for most of the range and peaks later and higher.
-
Evaluate Option D (60, 0): Health spending of $60 billion places health welfare near its maximum (the peak is around 60–70). Education spending is $0, so education welfare is 0. Total welfare = high health welfare + 0.
-
Evaluate Option C (40, 20): Health spending of $40 billion yields welfare slightly below the peak (since the peak is at 60–70), but still very high. Education spending of $20 billion yields welfare that is positive and on the rising portion of the education curve (peak is at 40–50). The sum of these two values exceeds the sum for Option D because the marginal gain in education welfare from 0 to 20 is greater than the marginal loss in health welfare from 60 to 40.
-
Evaluate Option B (20, 40): Health welfare at $20 billion is lower than at $40 billion. Education welfare at $40 billion is near its peak. However, because the health curve is steeper, the loss in health welfare from moving from 40 to 20 is larger than the gain in education welfare from moving from 20 to 40. Thus, total welfare is lower than in Option C.
-
Evaluate Option A (0, 60): Health welfare is 0. Education welfare at $60 billion is below its peak (which occurs at 40–50) and falling. Total welfare is the lowest of all options.
-
Conclusion: Option C (40, 20) maximizes the sum of health and education welfare.
Key Takeaways
- A government budget constraint creates a trade-off between expenditure categories; the optimal allocation is not necessarily at an extreme (all on one service) unless one service strictly dominates the other at every margin.
- When total welfare curves are plotted, the optimal budget split is where the combined welfare is highest, which often occurs when spending is balanced enough to capture high welfare from both services before diminishing returns set in too severely.
- The equi-marginal principle (allocating until marginal welfare per dollar is equal) guides the optimal choice, though on a total welfare graph this is reflected by comparing the slopes of the two curves.
Common Mistakes
- Choosing D (60, 0): Students may see that the health curve is always above the education curve and incorrectly conclude that all spending should go to health. This ignores that total welfare is the sum of both; even a lower-valued second service adds to total welfare if the first service's marginal return has begun to diminish.
- Choosing B (20, 40): Students may assume that because education peaks at 40–50, $40 billion is optimal for education, failing to account for the higher marginal welfare of health spending at lower levels.
- Confusing total and marginal welfare: The graph shows total welfare. The optimal point is not where one curve is highest, but where the sum is highest.
- Reading the peak incorrectly: Misidentifying the peak expenditure for either service leads to wrong estimates of welfare at the given points.
Things to Be Careful About
- Always check the scale and peak locations on the graph carefully. The health curve peaks later (60–70) and higher than education (40–50).
- Remember that total welfare is additive: Welfare_total = Welfare_health + Welfare_education.
- When comparing options, consider the marginal change: does shifting $20 billion from health to education increase or decrease total welfare? From D to C, health welfare falls slightly but education welfare rises from 0 to a substantial positive value, so total rises.
- Ensure the final answer matches the option letter exactly.
A government gives a subsidy to a producer of a product.
What will be the likely effect of this?
Options
A a shift to the left in the demand curve and a rise in equilibrium quantity
B a shift to the left in the supply curve and a rise in equilibrium quantity
C a shift to the right in the demand curve and a fall in equilibrium price
D a shift to the right in the supply curve and a fall in equilibrium price
Reasoning
A subsidy is a payment by the government to producers, which reduces their costs of production. This shifts the supply curve to the right (an increase in supply). At the original equilibrium price, there is now a surplus, putting downward pressure on price until a new equilibrium is reached at a lower price and a higher quantity.
Answer
D
D
Background Concept
A subsidy is a form of government intervention in markets, where the government makes a payment to producers (or sometimes consumers) to encourage the production or consumption of a good or service. When a subsidy is given to a producer, it effectively reduces their marginal cost of production. For any given price, the producer is now willing to supply a greater quantity than before because their costs are lower. This is represented by a rightward shift of the supply curve.
Understanding the Question
The question asks for the likely effect of a government subsidy given to a producer of a product. The multiple-choice options present different combinations of shifts in demand or supply curves and subsequent changes in equilibrium price and quantity. The correct reasoning must identify which curve is directly affected by a subsidy to a producer: supply, not demand.
Approach
First, identify which curve is affected by the policy. The subsidy is given to the producer, so it directly affects supply. Then, determine the direction of the shift: a subsidy reduces the cost of producing each unit, incentivising greater production at every price, so supply increases (shifts right). Finally, use basic supply and demand analysis to predict the new equilibrium: a rightward shift of supply, with unchanged demand, leads to a lower equilibrium price and a higher equilibrium quantity.
Step-by-Step Reasoning
- Identify the affected curve: The subsidy is paid to the producer. This reduces the producer's costs, which is a determinant of supply, not demand. Therefore, the supply curve shifts.
- Determine the direction of the shift: Lower costs mean that at each price, producers are willing to supply more. This is a rightward shift of the supply curve (increase in supply).
- Analyse the new equilibrium: Draw a standard demand and supply diagram. The demand curve remains unchanged because the subsidy does not directly affect consumer preferences or income. The rightward supply shift creates a surplus at the original price. To eliminate the surplus, price falls. At the lower price, quantity demanded rises (movement along the demand curve), and quantity supplied at the new lower price is still higher than the original equilibrium quantity.
- Match to the options:
- Option A incorrectly describes a leftward shift in demand.
- Option B incorrectly describes a leftward shift in supply (a reduction in supply).
- Option C incorrectly describes a rightward shift in demand.
- Option D correctly describes a rightward shift in the supply curve and a fall in equilibrium price. Note that it also implies a rise in equilibrium quantity (since price falls and quantity rises), but the option explicitly states only a fall in equilibrium price.
Key Takeaways
- A subsidy to producers shifts the supply curve right.
- The resulting equilibrium has a lower price and a higher quantity.
- A policy's effect depends on which side of the market it targets (producer vs. consumer).
Common Mistakes
- Confusing a subsidy to producers with a subsidy to consumers (which would shift demand right).
- Thinking a subsidy reduces supply (it increases supply because it lowers costs).
- Selecting an option that describes a shift in the correct curve but the wrong direction (e.g., left instead of right).
Things to Be Careful About
- Always identify the direct recipient of the subsidy. A producer subsidy shifts supply; a consumer subsidy shifts demand.
- Remember that a subsidy reduces costs, so supply increases (right shift), not decreases.
- On a multiple-choice question, read every word of each option carefully, noting the curve, the direction, and the predicted change in equilibrium price/quantity.
What would be included in a measure of wealth?
Options
A annual income
B benefits and pensions
C interest earned on savings
D savings held in bank accounts
Working
Wealth is a stock of assets held at a point in time. Income is a flow of earnings over a period. Annual income, benefits/pensions, and interest earned on savings are all flows. Savings held in bank accounts are a stock of financial assets, so they are included in a measure of wealth.
Answer
D
D
Background Concept
In economics, wealth is a stock concept — it represents the value of assets (financial and physical) owned by an individual, firm, or nation at a specific point in time. Income is a flow concept — it measures the amount of money or earnings received over a period (e.g., weekly, monthly, yearly). The fundamental distinction is that a stock is measured at a moment, whereas a flow is measured per unit of time.
Common components of wealth include cash, bank deposits, property, shares, bonds, and other assets. Income includes wages, salaries, rents, interest, dividends, and transfer payments (like benefits and pensions).
Understanding the Question
The question asks which single item among the four options would be counted as part of a measure of wealth. It tests your ability to apply the stock-versus-flow distinction. All three incorrect options are flows of income, while the correct option is a stock of assets.
Approach
- Recall the definition of wealth as a stock of assets.
- Examine each option and determine whether it is a stock or a flow:
- A. Annual income → flow (earned over a year).
- B. Benefits and pensions → flow (regular transfer payments).
- C. Interest earned on savings → flow (income received from savings).
- D. Savings held in bank accounts → stock (the balance at a point in time).
- Identify the only stock item: D.
Step-by-Step Reasoning
- Option A: Annual income – This is the total earnings (wages, profits, etc.) received over one year. Because it is a flow, it is part of income, not wealth. Even if the income is saved, the income itself is a flow; only the accumulated balance after saving becomes wealth.
- Option B: Benefits and pensions – These are regular payments from the government or a pension fund. They are transfer incomes, i.e., flows. They are not a stock of assets.
- Option C: Interest earned on savings – This is the return on saving; it is a flow of factor income (reward for lending capital). Again, a flow, not a stock.
- Option D: Savings held in bank accounts – This is the accumulated balance of deposits in a bank account. It is a stock of financial assets measured at a given date. Therefore, it is included in a measure of wealth.
Thus, the correct answer is D.
Key Takeaways
- Wealth = stock of assets at a point in time.
- Income = flow of earnings over a period.
- To identify what counts as wealth, look for assets (cash, property, shares, savings balances). Income streams (including interest earned) are not wealth themselves, though they can add to wealth if saved.
Common Mistakes
- Choosing C (interest earned) because it relates to savings. Interest is a return on capital and is counted as income, not as a stock of wealth. The interest received is a flow; the balance of savings is the wealth.
- Confusing annual income with the accumulation of income over many years – the question asks for what is included in a measure of wealth at a point in time, not what contributes to it.
- Thinking that benefits and pensions are a form of wealth because they provide ongoing payments – they are transfer payments (flows), and the right to future payments may have a capital value, but the question lists the payment itself, which is a flow.
Things to Be Careful About
- Always distinguish between the asset itself (e.g., a house, a bank balance) and the income it generates (e.g., rent, interest). The asset is part of wealth; the income is part of national income.
- In multiple-choice questions on wealth vs income, the trap options usually involve flows that sound wealth-related. Apply the stock/flow rule systematically.
- Do not overthink: the savings balance is a clear stock.
Why might a government introduce a minimum price for a product?
Options
A to benefit poorer consumers
B to encourage consumption of a merit good
C to encourage production of a public good
D to support the incomes of producers
Working
A minimum price (price floor) sets a legal lower limit on the price of a product. The government typically introduces this to support the incomes of producers, for example in agriculture where market prices may fall below viable levels. This benefits producers by guaranteeing a minimum revenue.
Option A is incorrect because a minimum price raises the price, harming poorer consumers who must pay more. Option B is incorrect because raising the price reduces consumption, which would discourage rather than encourage consumption of a merit good. Option C is incorrect because a public good is non-excludable and non-rival; a minimum price does not solve the free-rider problem that prevents private provision. Only option D correctly identifies the reason: to support producer incomes.
Answer
D
D
Background Concept
A minimum price (also called a price floor) is a government-imposed lower limit on the price of a good or service. It is set above the free-market equilibrium price. The consequence is a surplus (excess supply) because the higher price reduces quantity demanded while encouraging more quantity supplied. The government may need to buy the surplus or restrict supply to maintain the floor. Common examples include agricultural price supports (e.g., EU Common Agricultural Policy) and minimum wages (a minimum price for labour). The key rationale is to guarantee producers a certain income level when market prices are too low to sustain them.
Understanding the Question
This multiple-choice question asks for the most likely reason a government would introduce a minimum price for a product. The options present four possible rationales. The correct answer is the one that aligns with standard economic theory and real-world policy. It requires knowledge of the intended effect of a price floor and the ability to distinguish it from other policy tools.
Approach
Evaluate each option against the known effects and typical objectives of a minimum price. Option D is the textbook reason: to support producer incomes, especially in agriculture. Options A, B, and C are inconsistent with how a minimum price operates.
Step-by-Step Reasoning
- Option A: "to benefit poorer consumers." A minimum price raises the market price above equilibrium. Poorer consumers face higher prices and reduced consumption. This harms them, not benefits. So A is incorrect.
- Option B: "to encourage consumption of a merit good." Merit goods are under-consumed due to imperfect information. A minimum price would make them more expensive, further reducing consumption. The government would instead use subsidies, information campaigns, or direct provision to encourage consumption. So B is incorrect.
- Option C: "to encourage production of a public good." Public goods are non-excludable and non-rival; private firms cannot profitably supply them because free-riders consume without paying. A minimum price does not solve the free-rider problem. The government typically provides public goods directly. So C is incorrect.
- Option D: "to support the incomes of producers." This is the classic reason. For example, farmers face volatile prices due to weather and market conditions. A minimum price ensures they receive a price above cost, stabilizing their income. The government may need to buy surplus output or restrict imports to maintain the floor. This is the correct answer.
Key Takeaways
- A minimum price (price floor) is used to protect producers from low prices.
- It typically leads to a surplus if set above equilibrium.
- Price controls have distinct purposes: maximum prices protect consumers; minimum prices protect producers.
- Knowing the effects of each policy tool is essential for identifying appropriate reasons for intervention.
Common Mistakes
- Confusing minimum price with maximum price: a maximum price benefits consumers by capping price, while a minimum price does the opposite.
- Assuming government intervention always helps consumers; in this case, the minimum price hurts consumers.
- Failing to distinguish between policy objectives: each option reflects a different goal, and only one matches the tool.
Things to Be Careful About
- Read the question carefully: it asks "why might a government INTRODUCE", not what the effect is. The effect might be to support producer incomes, which is the reason.
- Avoid generalizing: not all price controls are for the same purpose. Consider the specific instrument.
- In multiple-choice, eliminate obviously wrong answers by thinking about the economic mechanisms each implies.
An indirect tax is imposed on a product.
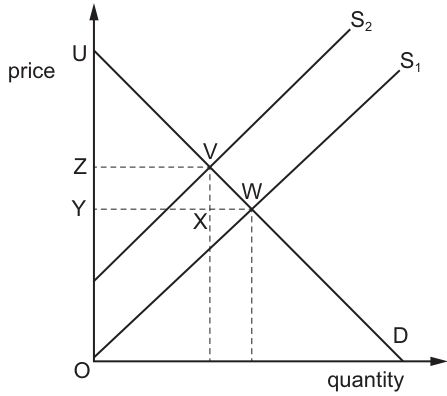
What is the change in consumer surplus?
Options
A UWY
B UVZ
C ZVWY
D ZVXY
Answer
Consumer surplus is the area below the demand curve and above the price paid by consumers.
Before the tax, the equilibrium price is Y and consumer surplus is the triangle UWY. After the indirect tax shifts supply from S1 to S2, the price rises to Z and the equilibrium moves to V. Consumer surplus is now the smaller triangle UVZ.
The change in consumer surplus is the loss of the area between these two triangles: the quadrilateral ZVWY. This area represents both the higher price paid on the units still purchased (the rectangle ZVXY) and the surplus lost on the units no longer purchased (the triangle VXW).
Answer
C
C
Background Concept
Consumer surplus is a measure of consumer welfare. It is defined as the difference between the price consumers are willing to pay for a good—as shown by the demand curve—and the price they actually pay. On a demand and supply diagram, it is represented by the area below the demand curve and above the market price, from quantity zero to the quantity traded.
An indirect tax is a tax levied on the production or sale of a good. Because it increases firms' costs, it shifts the supply curve vertically upwards by the amount of the tax (from S1 to S2). This raises the price consumers pay and reduces the equilibrium quantity.
Understanding the Question
The question provides a diagram showing the market for a product before and after an indirect tax is imposed. The initial equilibrium is at point W, where demand (D) meets the original supply (S1), at price Y. After the tax, supply shifts to S2, and the new equilibrium is at point V, where D meets S2, at price Z. Point U is the intercept of the demand curve on the price axis. Point X lies on the original supply curve S1 directly below V.
The task is to identify which labelled area represents the change in consumer surplus. Because the tax raises the price and reduces output, consumer surplus will fall. The question asks for the change, which is the loss in consumer surplus.
Approach
To find the change in consumer surplus, we compare the consumer surplus before and after the tax:
- Identify the initial consumer surplus area.
- Identify the new consumer surplus area after the tax.
- The change is the difference between these two areas (the loss).
We can also identify the loss directly as the area between the old and new prices, bounded by the demand curve and the vertical line at the new quantity, extended to the price axis.
Step-by-Step Reasoning
Initial consumer surplus: Before the tax, the market price is Y. Consumer surplus is the area below the demand curve and above the price line Y. This is the triangle with vertices at U (the price intercept), the point on the price axis at level Y, and point W (the initial equilibrium). In the notation of the options, this is area UWY.
New consumer surplus: After the tax, the price consumers pay rises to Z. Consumer surplus is now the area below the demand curve and above the price line Z. This is the smaller triangle with vertices at U, the point on the price axis at level Z, and point V (the new equilibrium). In the notation of the options, this is area UVZ.
The change (loss) in consumer surplus: The loss is the initial area minus the new area. Geometrically, this is the area bounded by:
- The price axis between Y and Z (the vertical segment).
- The horizontal line from Z to V (the new price line).
- The demand curve from V down to W (the segment of the demand curve between the new and old quantities).
- The horizontal line from W back to the price axis at Y (the old price line).
This forms the quadrilateral ZVWY.
We can verify this by splitting the area:
- The rectangle ZVXY (where X is the point on S1 directly below V) represents the additional amount paid by consumers on the units they continue to purchase (Qv units at an extra Z - Y per unit).
- The triangle with vertices V, X and W represents the consumer surplus that is lost on the units that are no longer purchased due to the tax (the units between Qv and Qw).
Together, these two shapes make up the total loss in consumer surplus, ZVWY.
Why the other options are incorrect:
- UWY is the original consumer surplus, not the change.
- UVZ is the new (smaller) consumer surplus, not the change.
- ZVXY is only the rectangular part of the loss (the extra expenditure on remaining units). It misses the triangular area representing the surplus lost on the reduction in output.
Key Takeaways
- Consumer surplus is the area under the demand curve above the market price.
- An indirect tax reduces consumer surplus by raising the price and reducing the quantity traded.
- The total loss in consumer surplus is the area between the old and new prices, bounded by the demand curve and the vertical line at the new quantity, out to the price axis. It includes both the extra payment on units still bought and the lost surplus on units no longer bought.
- When identifying areas on diagrams, ensure you include all relevant segments (e.g., the demand curve between the two equilibria, not just the supply curve).
Common Mistakes
- Confusing the level with the change: Selecting UWY (the original surplus) or UVZ (the new surplus) instead of the area representing the difference between them.
- Incomplete area: Selecting ZVXY, which captures only the rectangle (the higher price on remaining units) but forgets the triangle representing the surplus lost on the units no longer purchased.
- Using the supply curve: Accidentally using the supply curve to bound the consumer surplus area instead of the demand curve. Consumer surplus is always measured from the demand curve.
- Misidentifying points: Confusing which price level (Y or Z) corresponds to which equilibrium (W or V). Remember that the tax shifts supply left/up, so the new price Z is higher than Y, and the new quantity at V is lower than at W.
Things to Be Careful About
- Ensure you read the diagram carefully: S2 is to the left of S1, indicating the tax has shifted supply upwards/leftwards.
- The change in consumer surplus is a loss, so it is the area between the two price levels under the demand curve.
- The area ZVWY is a quadrilateral; it can be decomposed into a rectangle and a triangle, both of which must be included to get the full change.
- In multiple-choice questions, check that the area you select is bounded by the correct curves (demand curve for consumer surplus) and the correct points (the two equilibrium points on the demand curve).
The table shows selected statistics for a country.
| $bn | |
|---|---|
| gross domestic product at market prices | 600 |
| indirect taxes | 100 |
| subsidies | 50 |
What is the value of gross domestic product at basic prices?
Options
A $500bn
B $550bn
C $650bn
D $700bn
Working
GDP at basic prices = GDP at market prices – indirect taxes + subsidies
= $600bn – $100bn + $50bn
= $550bn
Answer
B
B
Background Concept
National income can be measured at different price bases. Market prices are the prices consumers actually pay, which include indirect taxes (e.g., VAT) and exclude subsidies. Basic prices exclude indirect taxes and include subsidies, representing the amount producers actually receive. To convert GDP at market prices to GDP at basic prices, we subtract indirect taxes and add subsidies.
Understanding the Question
The table provides GDP at market prices ($600bn), indirect taxes ($100bn), and subsidies ($50bn). The question asks for GDP at basic prices. This is a direct application of the conversion formula.
Approach
Use the formula: GDP at basic prices = GDP at market prices – indirect taxes + subsidies. Substitute the given numbers.
Step-by-Step Reasoning
- Start with GDP at market prices: $600bn.
- Subtract indirect taxes: $600bn – $100bn = $500bn. This removes the effect of indirect taxes because they inflate market prices above basic prices.
- Add subsidies: $500bn + $50bn = $550bn. Subsidies lower market prices below basic prices, so we add them back to get the basic price valuation.
- The result is $550bn, which corresponds to option B.
Key Takeaways
- The relationship between market prices and basic prices is: GDP at basic prices = GDP at market prices – indirect taxes + subsidies.
- This adjustment is a standard part of national income accounting to obtain a measure of output at producer prices.
Common Mistakes
- Adding indirect taxes instead of subtracting them. This would give $700bn (option D).
- Subtracting subsidies instead of adding them. This would give $450bn (not an option).
- Forgetting to apply the adjustment at all, leading to $600bn (not an option).
Things to Be Careful About
- Ensure the signs are correct: indirect taxes reduce market prices to basic prices, so subtract; subsidies increase market prices to basic prices, so add.
- The formula is symmetric: GDP at market prices = GDP at basic prices + indirect taxes – subsidies.
- All figures are in $bn, so the answer is in $bn.
GDP of a country measured at current market prices was $1000bn in year 1. This had risen to $1100bn in year 2.
Over the same period the general price level had risen by 5%.
What has happened to real GDP?
Options
A Real GDP fell by approximately 5%.
B Real GDP fell by approximately 10%.
C Real GDP rose by approximately 5%.
D Real GDP rose by approximately 10%.
Working
Real GDP is nominal GDP adjusted for changes in the price level.
Year 1 nominal GDP = $1000bn
Year 2 nominal GDP = $1100bn
Price level increase = 5%, so the price index in year 2 is 1.05 times the year 1 level.
Real GDP in year 2 = nominal GDP in year 2 / price index = $1100bn / 1.05 = $1047.6bn (approx)
Percentage change in real GDP = (($1047.6bn - $1000bn) / $1000bn) x 100 = 4.76%, approximately 5%.
Thus real GDP rose by approximately 5%.
Answer
C
C
Background Concept
This question tests the distinction between nominal GDP and real GDP. Nominal GDP is the value of output measured at current market prices, so it can change because of changes in either the quantity of goods and services produced or the average price level. Real GDP strips out the effect of price changes by valuing output at constant prices, thereby measuring only the change in the physical volume of production. The adjustment uses a price index: if the price level rises by 5%, the price index in the later year is 1.05 times the base year. To convert nominal GDP to real GDP, divide nominal GDP by the price index (expressed as a decimal factor).
Understanding the Question
The question provides nominal GDP in two consecutive years and the percentage increase in the general price level over the same period. It asks what has happened to real GDP — specifically, the percentage change. The options are approximate changes of +5%, +10%, -5%, or -10%. The candidate must recognise that nominal GDP rose by 10% (from $1000bn to $1100bn) and the price level rose by 5%, so the real increase is roughly 5% (since 10% – 5% = 5% as a first approximation, but the exact calculation confirms this).
Approach
First, calculate the percentage increase in nominal GDP. Then, use the price level increase to deflate the nominal GDP figure to obtain real GDP for year 2. Finally, compute the percentage change in real GDP. A quick approximation: nominal GDP growth minus inflation gives approximate real GDP growth, but the exact method is to divide by the price index.
Step-by-Step Reasoning
- Nominal GDP in year 1 = $1000bn; nominal GDP in year 2 = $1100bn.
- The increase in nominal GDP = $100bn, which is a 10% increase (100/1000 x 100 = 10%).
- The price level rose by 5%, so the price index in year 2 = 1 + 0.05 = 1.05 (if year 1 = 1.00).
- Real GDP in year 2 = nominal GDP in year 2 / price index = $1100bn / 1.05 = $1047.62bn (approx).
- Real GDP in year 1 (base year) = nominal GDP in year 1 = $1000bn (since price index = 1.00).
- Change in real GDP = $1047.62bn – $1000bn = $47.62bn.
- Percentage change in real GDP = (47.62 / 1000) x 100 = 4.76%, which is approximately 5%.
Thus real GDP rose by approximately 5%, which matches option C.
Key Takeaways
- Real GDP is a measure of the volume of production, adjusted for inflation.
- To convert nominal to real, divide by the price index (1 + percentage change in price level).
- The approximate rule (nominal growth – inflation) is a quick check but the exact calculation is needed for precision.
- In multiple-choice questions, always work through the steps; do not rely on intuition alone.
Common Mistakes
- Confusing nominal and real: thinking that a 10% increase in nominal GDP means real GDP also rose by 10% (that would ignore inflation).
- Subtracting incorrectly: if the price level rises by 5%, one might incorrectly subtract 5% from 10% to get 5% without adjusting the base, which actually gives the correct approximate answer, but the exact method ensures accuracy.
- Using the wrong divisor: dividing nominal GDP by the percentage change rather than the price index factor.
- Forgetting to express the price index as a factor (1.05) rather than as a percentage (5%).
Things to Be Careful About
- Always distinguish between the change in the price level (e.g., 5%) and the price index (1.05).
- When the price level rises, real GDP is less than nominal GDP; when it falls, real GDP is greater.
- In percentage change calculations, be consistent with the base year. Here the base year is year 1, so the price index for year 1 is 1.00.
- The question asks for an approximate change, so the exact calculation (4.76%) rounds to 5%.
A government spends money to provide an education for students.
Which type of spending is capital expenditure?
Options
A computers for classrooms
B grants for university students
C rent for school buildings
D wages for teachers
Answer
Capital expenditure is spending on assets that provide benefits over a period of more than one year. Computers for classrooms are a physical asset with a useful life beyond a single year, so they are capital expenditure.
Answer
A
A
Background Concept
Government spending is classified into two main types: current expenditure and capital expenditure. Current expenditure covers day-to-day running costs that are consumed within the financial year — wages, rent, and grants are typical examples. Capital expenditure, by contrast, is spending on fixed assets that yield benefits over several years: buildings, infrastructure, machinery, and equipment. The key distinction is the useful life of the item purchased.
Understanding the Question
The question asks which of four items of government education spending is capital expenditure. The student must recall the definition of capital spending and then apply it to each option. The options are:
- A: computers for classrooms
- B: grants for university students
- C: rent for school buildings
- D: wages for teachers
Approach
Identify the option that involves purchasing a long-lived physical asset. Computers are tangible assets with a useful life of several years, making them capital spending. The other three options are all consumed within the year and are therefore current spending.
Step-by-Step Reasoning
-
Option A — computers for classrooms: Computers are physical assets that will be used for several years. They are not consumed in a single year. This matches the definition of capital expenditure.
-
Option B — grants for university students: Grants are transfer payments — money given to students to support their living costs or tuition. They are consumed immediately and provide no long-lived asset to the government. This is current expenditure.
-
Option C — rent for school buildings: Rent is a payment for the use of a building over a short period (typically a year or less). It is a running cost, not the purchase of an asset. This is current expenditure.
-
Option D — wages for teachers: Wages are payments for labour services that are consumed in the period they are provided. They are a recurring operational cost. This is current expenditure.
Only option A involves the acquisition of a durable asset, so it is the correct answer.
Key Takeaways
- Capital expenditure = spending on assets that last more than one year (e.g., buildings, machinery, computers).
- Current expenditure = spending on goods and services consumed within the year (e.g., wages, rent, grants).
- The distinction is based on the useful life of the item, not its monetary value.
Common Mistakes
- Confusing grants (current) with capital spending because they are large sums. The key is whether the spending creates a long-lived asset — grants do not.
- Thinking that rent is capital because it relates to buildings. Rent is a payment for use, not ownership, so it is current.
- Assuming that wages could be capital if the teachers are training students for future benefit. Labour is always current spending because the service is consumed in the period.
Things to Be Careful About
- In some contexts, spending on maintenance of capital assets (e.g., repairing a computer) is current, not capital, because it does not create a new asset.
- The question is about government spending classification, not business accounting, but the principle is the same.
What is an example of fiscal policy aimed at increasing aggregate demand in an economy?
Options
A increasing expenditure by firms on skills training programmes for unskilled workers
B increasing the commercial banks’ lending ability
C reducing the rate of income tax for all income earners
D reducing the rate of interest on loans to manufacturing companies
Working
Fiscal policy involves changes in government spending and taxation to influence aggregate demand. An expansionary fiscal policy aims to increase aggregate demand. Option C, reducing the rate of income tax for all income earners, increases households' disposable income, leading to higher consumption and thus a rise in aggregate demand. Options A, B, and D are not fiscal policy: A is a supply-side measure, B is a monetary policy tool, and D is a monetary policy action (interest rate reduction).
Answer
C
C
Background Concept
Fiscal policy refers to the use of government spending and taxation to influence the economy. It is one of the three main macroeconomic policy tools alongside monetary policy (controlled by the central bank) and supply-side policy (aimed at increasing productive capacity). Expansionary fiscal policy is designed to boost aggregate demand (AD), which is the total spending in an economy at a given price level. AD = C + I + G + (X - M). The two main instruments are:
- Tax cuts: reducing income tax or corporation tax increases disposable income and consumption (C) or investment (I).
- Increased government spending: higher G directly adds to AD.
Monetary policy involves adjusting interest rates, money supply, and credit conditions. Supply-side policy focuses on improving productivity and LRAS, e.g., through training, deregulation, or infrastructure.
Understanding the Question
The question asks: "What is an example of fiscal policy aimed at increasing aggregate demand in an economy?" We must choose one of four options. The correct answer must be a tool that (a) falls under fiscal policy (i.e., government spending or taxation), and (b) is intended to raise aggregate demand (i.e., expansionary).
Approach
- Recall the definition of fiscal policy.
- Determine which option is a fiscal measure: only tax changes and government spending qualify.
- Check if the measure would increase AD: a tax cut raises disposable income, so consumption rises.
- Rule out other options: A is spending by firms (not government), B is about banks' lending (monetary), D is an interest rate reduction (monetary).
Step-by-Step Reasoning
Option A: "Increasing expenditure by firms on skills training programmes for unskilled workers." This is expenditure by firms, not by the government. It is a private sector initiative; the government may encourage it, but the action itself is not a fiscal policy. It is more likely a supply-side policy aimed at improving labour productivity, which could increase LRAS but not necessarily AD directly. So A is incorrect.
Option B: "Increasing the commercial banks’ lending ability." This involves changes in bank reserves, reserve requirements, or monetary base – actions typically taken by a central bank (monetary policy). It increases the money supply and can lower interest rates, boosting investment and consumption through monetary transmission, but it is not fiscal policy. So B is incorrect.
Option C: "Reducing the rate of income tax for all income earners." This is a direct tax cut, a classic fiscal policy tool. A reduction in income tax increases households' disposable income. A rise in disposable income leads to higher consumption spending (C), which is a component of AD. The multiplier effect further amplifies the initial increase. This is an expansionary fiscal policy. So C is correct.
Option D: "Reducing the rate of interest on loans to manufacturing companies." Lowering interest rates is a monetary policy action, usually carried out by the central bank. Even if the government were to subsidize loans, it would not be a standard fiscal policy; it could be considered an industrial policy or a supply-side measure, but not the primary example of fiscal policy. Moreover, it targets only manufacturing companies, not the whole economy, and it works through the cost of borrowing, not through taxes or government spending. So D is incorrect.
Thus, only option C correctly satisfies the conditions.
Key Takeaways
- Fiscal policy is about government spending and taxation; monetary policy is about money and credit conditions; supply-side policy focuses on productivity and LRAS.
- Expansionary fiscal policy increases AD through tax cuts or higher government spending.
- When answering multiple-choice questions on policy classification, always check whether the instrument is under the direct control of the government (for fiscal) or the central bank (for monetary).
Common Mistakes
- Confusing a government targeted loan scheme (which might be a spending programme) with monetary policy. In this question, reducing interest rates is a monetary action even if aimed at a specific sector.
- Thinking that any government action (like spending on training) is fiscal policy – but if it is undertaken by firms rather than the government, it is not.
- Forgetting the condition "aimed at increasing aggregate demand"; some options, while fiscal, might be contractionary (not relevant here, but good to consider).
Things to Be Careful About
- Read the phrasing carefully: "increasing expenditure by firms" vs "government expenditure". Fiscal policy always involves the government's budget.
- "Reducing the rate of interest" is a classic monetary tool, even if the question does not mention a central bank. In standard economics, interest rate changes are monetary policy.
- The question asks for an example; there may be other correct examples not listed, but we must select the one that fits both criteria.
- Note that the answer is C; ensure you understand why the other options are wrong to avoid confusion in similar questions.
The aggregate demand (AD) curve in an economy shifts to the left.
What is most likely to cause this shift?
Options
A a decrease in the exchange rate
B a decrease in the interest rate
C an increase in the budget deficit
D an increase in the current account deficit
Reasoning
A leftward shift in the aggregate demand (AD) curve means a decrease in total spending in the economy at every price level. AD = C + I + G + (X – M). A current account deficit means that imports (M) exceed exports (X), so net exports (X – M) are negative. An increase in the current account deficit (i.e., net exports become more negative) reduces (X – M), thus reducing AD. This causes the AD curve to shift left.
- Option A: A decrease in the exchange rate (depreciation) makes exports cheaper and imports dearer, so net exports increase, raising AD – a rightward shift.
- Option B: A decrease in the interest rate stimulates investment and consumption, raising AD – a rightward shift.
- Option C: An increase in the budget deficit (more government spending or lower taxes) increases G or C, raising AD – a rightward shift.
Therefore, an increase in the current account deficit is the most likely cause of a leftward shift.
Answer
D
D
Background Concept
Aggregate demand (AD) is the total planned spending on goods and services produced within an economy over a period of time. It is given by AD = C + I + G + (X – M). A shift in the AD curve occurs when any of these components changes for reasons other than a change in the price level. A leftward shift indicates a decrease in AD at each price level.
Understanding the Question
The question asks which of the four options is most likely to cause a leftward shift of the AD curve. Each option describes a change in an economic variable. We need to determine the effect of each change on aggregate demand and identify the one that reduces AD.
Approach
We will evaluate each option in turn, using the AD equation. For each, we consider the direct effect on the components: consumption (C), investment (I), government spending (G), and net exports (X – M). The correct answer is the one that leads to a decrease in one or more components, causing AD to fall.
Step-by-Step Reasoning
-
Option A: Decrease in the exchange rate. A lower exchange rate means the domestic currency is cheaper relative to foreign currencies. This makes exports cheaper for foreigners, so export demand rises. Imports become more expensive, so domestic consumers switch to domestic goods, reducing import spending. Net exports (X – M) increase. Since net exports are a component of AD, an increase in net exports pushes AD to the right. So this would cause a rightward shift, not leftward.
-
Option B: Decrease in the interest rate. Lower interest rates reduce the cost of borrowing, encouraging consumption spending on durable goods and investment spending by firms. Both C and I increase. This raises AD, shifting the AD curve to the right. So not leftward.
-
Option C: Increase in the budget deficit. The budget deficit is the difference between government spending and tax revenue. An increase in the deficit could be due to higher government spending (G) or lower taxes (which increase disposable income and thus consumption C). Both increase AD. So this would shift AD to the right.
-
Option D: Increase in the current account deficit. The current account deficit occurs when imports (M) exceed exports (X). An increase in the deficit means that net exports (X – M) become more negative. This reduces the (X – M) component of AD, lowering total AD. Therefore, the AD curve shifts to the left. This is the only option that decreases AD.
Thus, the most likely cause of a leftward shift in AD is an increase in the current account deficit.
Key Takeaways
- The AD curve shifts when any of its components change autonomously (not due to a change in the price level).
- A current account deficit reduces net exports and thus reduces AD.
- Depreciation, lower interest rates, and expansionary fiscal policy all increase AD, shifting the curve right.
- Understanding the direction of effect of these variables is crucial for macroeconomic analysis.
Common Mistakes
- Confusing the effect of a depreciation: some students think a lower exchange rate reduces AD because it makes imports more expensive, but the net effect is usually an increase in net exports (if Marshall-Lerner condition holds, but at this level we assume that). The question tests the basic understanding that a depreciation boosts net exports.
- Thinking that a budget deficit always reduces AD because it implies future taxes, but at the point of the deficit, it increases spending.
- Not considering that the current account deficit directly reduces AD via net exports.
Things to Be Careful About
- The question asks for 'most likely to cause this shift' – other options might also affect AD in the long run, but here we consider the immediate direct effect.
- Distinguish between the current account deficit and the budget deficit: the current account is part of the external sector, the budget is part of fiscal policy.
- Remember that AD = C + I + G + (X-M) is a simple identity; changes in any of these components shift the AD curve.
The diagram shows the AD and AS curves for a low income country. Oil and gas make up 90% of its exports. The initial equilibrium level of national income is Y1.
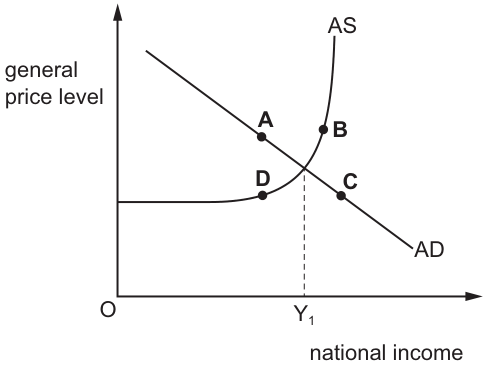
What is the most likely new equilibrium point if the worldwide prices of oil and gas rise dramatically?
Options
A point A on Fig. 21.1
B point B on Fig. 21.1
C point C on Fig. 21.1
D point D on Fig. 21.1
Reasoning
The country exports 90% of its output as oil and gas, so a rise in world oil and gas prices increases its export earnings. This raises net exports (X - M), a component of aggregate demand (AD = C + I + G + (X - M)), shifting the AD curve to the right. Higher world energy prices also raise domestic production costs for firms that use oil and gas as inputs, shifting the short-run aggregate supply (AS) curve left (upwards).
Macroeconomic equilibrium occurs where AD and AS intersect. Point A is the intersection of the original AD curve and the left-shifted AS curve, which would only be correct if AD did not shift. Point C lies on the original AD curve but not on the AS curve, so it is not an equilibrium. Point D lies on the original AS curve but not on the AD curve, so it is also not an equilibrium. Point B is the intersection of the right-shifted AD curve and the left-shifted AS curve, making it the new equilibrium.
Answer
B
B
Background Concept
Aggregate demand (AD) represents the total demand for all final goods and services produced in an economy at a given general price level, calculated as AD = C + I + G + (X - M), where C is consumer spending, I is investment, G is government spending, and (X - M) is net exports (exports minus imports). The AD curve is downward-sloping because a higher price level reduces the real value of household wealth, raises interest rates (reducing investment and consumer spending), and makes domestic goods less competitive internationally (reducing exports and increasing imports), all of which lower total demand.
Aggregate supply (AS) represents the total output of goods and services that firms are willing to produce at a given price level. The short-run AS (SRAS) curve is upward-sloping because higher output prices make production more profitable, so firms increase output as the price level rises. Macroeconomic equilibrium occurs where the AD and AS curves intersect, determining the equilibrium general price level and equilibrium national income (real output). Shifts in either curve lead to a new equilibrium: a rightward shift in AD raises both the price level and output in the short run, while a leftward shift in AS raises the price level and reduces output.
Understanding the Question
This question describes a low-income country that specialises in oil and gas production, with these fuels making up 90% of its total exports. The initial macroeconomic equilibrium is at national income Y1, as shown in Fig. 21.1. A dramatic rise in worldwide oil and gas prices occurs, and the question asks for the most likely new equilibrium point. This is a 1-mark multiple-choice question that tests the ability to apply AD/AS analysis to a real-world scenario, identify the correct shifts in the AD and AS curves, and recognise which point on the diagram represents a valid macroeconomic equilibrium (i.e., a point that lies on both the AD and AS curves).
Approach
To solve this problem, we first identify the two separate effects of higher world oil and gas prices on this economy:
- The demand-side effect: as a major oil and gas exporter, higher world prices increase the value of the country's export earnings, raising net exports and thus aggregate demand.
- The supply-side effect: higher world energy prices raise domestic production costs for firms that use oil and gas as inputs (e.g., for transport, heating, or manufacturing), reducing short-run aggregate supply.
Once we have identified the direction of both shifts, we can eliminate incorrect points: points that are not on both the AD and AS curves cannot be equilibria, and points that only reflect one shift (not both) are also incorrect. The correct point will be the intersection of the right-shifted AD curve and the left-shifted AS curve.
Step-by-Step Reasoning
-
Effect on Aggregate Demand: Aggregate demand includes net exports (X - M) as a key component. Since oil and gas make up 90% of this country's exports, a rise in world oil and gas prices directly increases the revenue the country earns from its exports (X rises), ceteris paribus. This increases net exports, so the AD curve shifts to the right. At every price level, total demand for the country's output is now higher than before the price rise.
-
Effect on Aggregate Supply: Even though the country exports most of its oil and gas, domestic firms still use these fuels as inputs for production (e.g., for running vehicles, generating electricity, or manufacturing goods). Higher world prices mean domestic oil and gas producers can earn higher profits by selling their output on international markets rather than domestically, so they divert supply away from the domestic market. This raises domestic energy prices, increasing the cost of production for most domestic firms. As a result, at every price level, firms are willing to supply less output than before, so the short-run AS curve shifts left (upwards).
-
Evaluating the equilibrium points: The original equilibrium is the intersection of the initial AD and AS curves at Y1. We now assess each candidate point:
- Point A is the intersection of the original AD curve and the left-shifted AS curve. This would be the new equilibrium if only AS shifted left, but we also have AD shifting right, so A is incorrect.
- Point C lies on the original AD curve to the right of Y1, but it is not on the AS curve, so it cannot be an equilibrium. Equilibrium requires total demand to equal total supply, which only happens where the two curves intersect. Point C represents a level of demand that is not matched by supply at that price level.
- Point D lies on the original AS curve to the left of Y1, but it is not on the AD curve, so it is also not an equilibrium. It represents a level of supply that is not matched by demand at that price level.
- Point B is the intersection of the right-shifted AD curve and the left-shifted AS curve. This is the only point that reflects both the demand-side and supply-side effects of the higher oil and gas prices, and lies on both curves, so it is the new equilibrium. The general price level is higher than the original equilibrium, and national income is higher than it would be if only AS shifted left (point A), as the rightward AD shift offsets some of the output loss from the AS shift.
-
Conclusion: The correct answer is point B.
Key Takeaways
- For an export-oriented economy, a rise in world prices of its main exports increases aggregate demand via higher net export earnings.
- If the exported good is also a key domestic input, higher world prices raise domestic production costs, shifting short-run AS left.
- Macroeconomic equilibrium is always the intersection of the AD and AS curves, so only points lying on both curves are valid equilibria.
- When analysing the impact of external price changes, always consider both demand and supply side effects where relevant, rather than assuming only one curve shifts.
Common Mistakes
- Only considering the demand-side effect: Some candidates note that higher export prices increase AD, but forget the supply-side cost effect, and incorrectly select point C. However, point C is not on the AS curve, so it cannot represent an equilibrium where AD = AS.
- Only considering the supply-side effect: Other candidates focus on higher production costs shifting AS left, and select point A. But this ignores the positive demand shock from higher export earnings, so A is incorrect.
- Confusing movements along curves with shifts: Point C is a movement along the original AD curve, which would only occur if the price level changed due to a shift in AS, but even then, the equilibrium would lie on the AS curve, which C does not.
- Forgetting the equilibrium condition: Points C and D are only on one curve each, so they cannot represent equilibrium, where total demand equals total supply.
Things to Be Careful About
- Always verify that a candidate equilibrium point lies on both the AD and AS curves; points on only one curve are not valid equilibria and can be eliminated immediately.
- When a country both exports and domestically consumes a good (like oil), a change in its world price has both demand and supply side effects, so both AD and AS may shift. Do not assume only one curve shifts unless the question explicitly states the good is only an export or only an input.
- For 1-mark multiple-choice questions, you do not need to write an extended explanation, but you must correctly identify the shifts and the equilibrium point to earn the mark. Eliminating incorrect options by checking if they are equilibria and if they reflect all relevant shifts is an efficient way to reach the correct answer.
What is not a government macroeconomic policy objective?
Options
A economic growth
B income equality
C low unemployment
D price stability
Answer
The standard government macroeconomic policy objectives are:
- economic growth
- low unemployment
- price stability
Income equality is a distributional objective, not a macroeconomic objective. It is not part of the core set of government macroeconomic policy objectives. Therefore, the correct answer is B.
B
Background Concept
Government macroeconomic policy objectives are the broad goals that the government aims to achieve using fiscal, monetary, and supply-side policies. The standard set of objectives includes:
- Price stability (low and stable inflation)
- Low unemployment (high employment)
- Economic growth (sustained increase in real output)
- Sometimes also balance of payments equilibrium (avoiding large deficits or surpluses).
These objectives are central to macroeconomics because they relate to the overall performance of the economy. Income equality is a separate objective, often pursued through redistribution policies, but it is not classified as a macroeconomic objective. It is more concerned with the distribution of income, which falls under microeconomics or social policy.
Understanding the Question
The question asks which of the listed options is not a government macroeconomic policy objective. The four options are: economic growth, income equality, low unemployment, and price stability. You need to recall the standard list of macroeconomic objectives and identify the odd one out.
Approach
The approach is straightforward: compare each option against the standard list. Three of them are clearly on that list; one is not. No calculation or diagram is needed.
Step-by-Step Reasoning
- Option A – Economic growth: This is a core objective. Governments aim to raise the productive capacity of the economy over time.
- Option B – Income equality: This is about the distribution of income. While governments often have policies to reduce inequality, it is not a macroeconomic objective. Macroeconomic objectives relate to aggregate outcomes, not distribution.
- Option C – Low unemployment: This is a core objective. Governments try to minimise involuntary unemployment.
- Option D – Price stability: This is a core objective. Governments aim for low and stable inflation.
Therefore, only option B does not belong to the set of macroeconomic policy objectives.
Key Takeaways
- The standard government macroeconomic policy objectives are price stability, low unemployment, economic growth, and (often) a healthy balance of payments.
- Income equality is a distributional objective, not a macroeconomic one.
- Questions like this test basic knowledge of what macroeconomics is about.
Common Mistakes
- Mistaking income equality as a macroeconomic objective because it is a common government aim. However, it is not part of the macro objectives list; it is a micro/distributional objective.
- Confusing macroeconomic objectives with microeconomic goals like equity, efficiency, or market regulation.
Things to Be Careful About
- The question uses the phrase "not a government macroeconomic policy objective". Ensure you read carefully: it asks for the one that is NOT included.
- In some broader definitions, governments may have several objectives, but the standard macro list is well established in the syllabus.
- Remember that the question is specific to macroeconomics; other government objectives exist but are not classified as macroeconomic.
A central bank increases interest rates to reduce inflation.
When will this policy be most likely to succeed?
Options
A When household spending is inelastic in response to interest rate changes.
B When the country has a floating exchange rate that appreciates.
C When the government has an increasing budget deficit.
D When trade unions demand higher wages to protect the living standards of their members.
Reasoning
When a central bank raises interest rates, it is implementing contractionary monetary policy. Higher interest rates reduce borrowing and spending, decreasing aggregate demand (AD). This helps reduce demand-pull inflation.
If the country has a floating exchange rate, the higher interest rate attracts capital inflows from foreign investors seeking higher returns. This increases demand for the domestic currency, causing it to appreciate. Appreciation has two anti-inflationary effects: (1) it reduces the price of imported goods and raw materials, directly lowering inflation; (2) it makes exports more expensive and imports cheaper, reducing net exports and further decreasing AD. Thus, the appreciation reinforces the contractionary effect of the interest rate rise, making the policy more likely to succeed.
Answer
B
B
Background Concept
Monetary policy involves central bank actions to influence the money supply and interest rates to achieve macroeconomic objectives. The main transmission mechanisms include:
- Interest rate channel: Higher interest rates increase the cost of borrowing, reducing consumption and investment, thereby decreasing aggregate demand (AD).
- Exchange rate channel: In a floating exchange rate system, higher domestic interest rates attract foreign capital, increasing demand for the domestic currency and causing appreciation. Appreciation reduces import prices (directly lowering inflation) and reduces net exports (further reducing AD).
- Credit channel: Higher rates reduce bank lending and the availability of credit.
The effectiveness of monetary policy depends on the strength of these channels and the presence of other policies or shocks that may offset or reinforce them.
Understanding the Question
The question asks: "When will this policy be most likely to succeed?" The policy is a central bank increasing interest rates to reduce inflation. The candidate must identify which of the four conditions (A, B, C, D) makes the policy more effective. The key is to recognise that success depends on whether the condition amplifies the contractionary effect or works against it. Option B provides an additional reinforcing channel through exchange rate appreciation. Options A, C, and D either weaken the policy or introduce offsetting forces.
Approach
Evaluate each option in terms of its impact on the transmission of the interest rate rise to aggregate demand and inflation:
- A: Inelastic household spending means the interest rate rise has little effect on consumption, so the policy is less effective.
- B: A floating exchange rate that appreciates adds a second channel (exchange rate) that reduces inflation directly and through net exports, reinforcing the policy.
- C: An increasing budget deficit is expansionary fiscal policy, which increases AD and offsets the contractionary monetary policy.
- D: Trade unions demanding higher wages can cause cost-push inflation, which is not directly addressed by demand-side policy; the interest rate rise may even worsen unemployment without reducing cost-push inflation.
Thus, B is the only condition that strengthens the policy.
Step-by-Step Reasoning
-
Option A: If household spending is inelastic to interest rate changes, then the rise in interest rates will have little impact on consumption. Since consumption is a major component of AD, the contractionary effect is weak. The policy is less likely to succeed because the main channel is blunted.
-
Option B: With a floating exchange rate, higher interest rates attract capital inflows (foreign investors seeking higher returns). This increases demand for the domestic currency, causing it to appreciate. Appreciation has two effects:
- Direct effect on inflation: Imported goods become cheaper, reducing the cost of raw materials and finished goods, which directly lowers the price level.
- Effect on net exports: Exports become more expensive for foreign buyers, and imports become cheaper for domestic consumers, so net exports fall. This reduces AD, reinforcing the contractionary effect.
Both effects help reduce inflation, making the policy more likely to succeed. This is the exchange rate channel of monetary policy.
-
Option C: An increasing budget deficit means the government is spending more than it collects in taxes, which is expansionary fiscal policy. This increases AD (through higher government spending or lower taxes), counteracting the contractionary monetary policy. The net effect on AD is ambiguous, and inflation may not fall as much. Thus, the policy is less likely to succeed.
-
Option D: Trade unions demanding higher wages can lead to cost-push inflation (wage-price spiral). Higher wages increase firms' costs, which are passed on as higher prices. This type of inflation is not caused by excess demand, so contractionary monetary policy (which reduces demand) may not be effective. In fact, higher interest rates could increase unemployment without reducing cost-push inflation. Therefore, the policy is less likely to succeed.
Since only option B provides a mechanism that reinforces the anti-inflationary effect, it is the correct answer.
Key Takeaways
- The exchange rate channel is an important transmission mechanism of monetary policy, especially in open economies with floating exchange rates.
- The effectiveness of monetary policy depends on the responsiveness of spending, the exchange rate regime, and the presence of other policies or shocks.
- Contractionary monetary policy can be reinforced by exchange rate appreciation, which directly lowers import prices and reduces net exports.
- Expansionary fiscal policy (increasing budget deficit) offsets contractionary monetary policy.
- Cost-push inflation is not easily addressed by demand-side policies; supply-side policies or wage restraint may be needed.
Common Mistakes
- Confusing appreciation with depreciation: Higher interest rates cause appreciation, not depreciation.
- Thinking that higher interest rates always reduce inflation regardless of other conditions: The policy can be offset by expansionary fiscal policy or cost-push shocks.
- Ignoring the exchange rate channel: Many students focus only on the interest rate channel and overlook the reinforcing effect of appreciation.
- Assuming that inelastic household spending makes the policy more effective: Inelastic spending means the policy has little effect, so it is less effective.
- Not considering that trade union wage demands can cause cost-push inflation, which is not reduced by demand-side policy.
Things to Be Careful About
- The question asks for "most likely to succeed" – it is a comparative judgement. All options are conditions that could affect the outcome; we must identify which one strengthens the policy.
- The exchange rate channel works only under a floating exchange rate. Under a fixed rate, the central bank would have to intervene to maintain the peg, potentially offsetting the effect.
- The term "appreciates" is key: the currency becomes stronger, which reduces import prices and net exports.
- Option C: "increasing budget deficit" means the deficit is growing, which is expansionary. A constant deficit would be neutral, but an increasing deficit adds to AD.
- Option D: Trade unions demanding higher wages is a supply-side shock; it does not directly affect the demand-side transmission of monetary policy, but it creates cost-push inflation that the policy cannot easily address.
A government reduces its expenditure on workplace training, increases the level of indirect taxes and reduces the rate of interest it pays on government debt.
How would these government macroeconomic policies be categorised?
Options
| supply-side | fiscal | monetary | |
|---|---|---|---|
| A | con | con | exp |
| B | exp | con | con |
| C | con | exp | exp |
| D | exp | exp | con |
key
con = contractionary
exp = expansionary
Reasoning
- Reducing expenditure on workplace training is a contractionary supply-side policy (it reduces the economy's productive capacity).
- Increasing indirect taxes is a contractionary fiscal policy (it reduces aggregate demand).
- Reducing the rate of interest paid on government debt is an expansionary monetary policy (it lowers the cost of borrowing, stimulating aggregate demand).
Answer
A
A
Background Concept
This question tests the ability to classify government macroeconomic policies into three categories: supply-side, fiscal, and monetary. It also requires understanding whether each policy action is expansionary or contractionary.
- Supply-side policy aims to increase the productive capacity of the economy by shifting the LRAS curve to the right. Tools include training, infrastructure, and technological improvement. A contractionary supply-side policy would reduce productive capacity.
- Fiscal policy involves changes in government spending and taxation to influence aggregate demand. Expansionary fiscal policy (increasing spending or cutting taxes) boosts AD; contractionary fiscal policy (cutting spending or raising taxes) reduces AD.
- Monetary policy involves changes in interest rates, money supply, or credit conditions to influence AD. Expansionary monetary policy (lowering interest rates or increasing money supply) stimulates AD; contractionary monetary policy does the opposite.
Understanding the Question
The question presents three government actions and asks how they should be categorised in terms of policy type and direction. The options are a table with rows A–D, each giving a combination of contractionary (con) or expansionary (exp) for supply-side, fiscal, and monetary policies respectively. The task is to select the correct row.
Approach
Classify each action one by one:
- "Reduces its expenditure on workplace training" – this is a cut in spending on a supply-side tool (training). It is a contractionary supply-side policy.
- "Increases the level of indirect taxes" – this is a fiscal policy (tax change). Raising taxes reduces disposable income and AD, so it is contractionary fiscal policy.
- "Reduces the rate of interest it pays on government debt" – this is a monetary policy action (lowering interest rates). Lower rates encourage borrowing and spending, so it is expansionary monetary policy.
Then match these three classifications to the table.
Step-by-Step Reasoning
- Action 1: Reduce expenditure on workplace training. Workplace training is a classic supply-side policy tool because it improves human capital and increases the economy's productive capacity (shifts LRAS right). Cutting this spending reduces that capacity, making it a contractionary supply-side policy.
- Action 2: Increase indirect taxes. Indirect taxes (e.g., VAT, sales tax) are a fiscal policy instrument. Raising them reduces consumers' real disposable income and firms' profits, lowering consumption and investment. This reduces aggregate demand, so it is contractionary fiscal policy.
- Action 3: Reduce the rate of interest paid on government debt. This is a monetary policy action: the government (or central bank) lowers the interest rate. Lower interest rates reduce the cost of borrowing for households and firms, encouraging consumption and investment, which increases aggregate demand. This is expansionary monetary policy.
Now check the table:
- Row A: supply-side = con, fiscal = con, monetary = exp. This matches our classification.
- Row B: supply-side = exp, fiscal = con, monetary = con. Incorrect (supply-side should be con, monetary should be exp).
- Row C: supply-side = con, fiscal = exp, monetary = exp. Incorrect (fiscal should be con).
- Row D: supply-side = exp, fiscal = exp, monetary = con. Incorrect (supply-side should be con, fiscal should be con, monetary should be exp).
Therefore, the correct answer is A.
Key Takeaways
- Be able to distinguish between supply-side, fiscal, and monetary policies by their tools and objectives.
- Understand that expansionary policies increase AD or LRAS, while contractionary policies reduce them.
- Practice classifying individual policy actions into these categories and directions.
Common Mistakes
- Confusing fiscal and monetary policy: fiscal involves government spending and taxation; monetary involves interest rates and money supply.
- Misclassifying a cut in training expenditure as expansionary because it reduces government spending (which is contractionary for AD) – but here it is a supply-side policy, not fiscal. The cut reduces productive capacity, so it is contractionary for supply-side.
- Thinking that reducing interest on government debt is a fiscal policy (it is a monetary policy action).
Things to Be Careful About
- Read the table carefully: the columns are supply-side, fiscal, monetary in that order. The rows give con/exp for each.
- Note that "reducing the rate of interest it pays on government debt" is effectively lowering the interest rate, which is expansionary monetary policy. Do not confuse this with a fiscal policy change.
- Remember that supply-side policies affect the LRAS, not AD directly (though they may have indirect effects).
The government of a country reduces its budget deficit by cutting government spending. At the same time, the central bank raises the interest rates.
When might this combination of policies be used?
Options
| inflation rate | unemployment rate | |
|---|---|---|
| A | high | high |
| B | high | low |
| C | low | high |
| D | low | low |
Reasoning
Contractionary fiscal policy (cutting government spending) and contractionary monetary policy (raising interest rates) both reduce aggregate demand. This combination is used to reduce demand-pull inflation when the economy is overheating, i.e., when inflation is high and unemployment is low (below the natural rate). Option B matches this condition.
Answer
B
B
Background Concept
This question tests the concept of macroeconomic policy mix—the simultaneous use of fiscal and monetary policy to achieve economic objectives. Contractionary fiscal policy (reducing government spending or increasing taxes) and contractionary monetary policy (raising interest rates or reducing money supply) both decrease aggregate demand (AD). They are typically used to cool down an overheating economy where demand-pull inflation is high and unemployment is low (below the natural rate). The short-run Phillips curve illustrates a trade-off between inflation and unemployment: when AD is very high, inflation rises and unemployment falls. Policymakers then apply contractionary policies to reduce inflation, even though it may temporarily increase unemployment.
Understanding the Question
The question asks: when might a government cut its budget deficit by reducing spending (contractionary fiscal policy) while the central bank raises interest rates (contractionary monetary policy)? The options give combinations of high/low inflation and high/low unemployment. The correct answer is when inflation is high and unemployment is low (option B). This is the classic scenario of an overheating economy where demand is exceeding potential output, causing upward pressure on prices and a very low unemployment rate. The policy mix aims to reduce AD to bring inflation down, accepting a possible rise in unemployment towards the natural rate.
Approach
- Identify the effect of each policy: both are contractionary, so they reduce AD. 2. Determine the macroeconomic conditions that would justify such a contractionary stance: high inflation (demand-pull) and low unemployment (sign of excess demand). 3. Match this to the options. Option A (high inflation, high unemployment) is stagflation, which would not be treated by contractionary policies (they would worsen unemployment). Option C (low inflation, high unemployment) calls for expansionary policies. Option D (low inflation, low unemployment) is a desirable situation, so no need for contractionary policy.
Step-by-Step Reasoning
- Cutting government spending (G) reduces a component of AD (C+I+G+X-M). This directly lowers AD. The budget deficit is reduced, which is a contractionary fiscal stance.
- Raising interest rates makes borrowing more expensive for consumers and firms, reducing consumption and investment. This also reduces AD. It is a contractionary monetary policy.
- Both policies shift the AD curve leftwards, reducing the price level (or inflation) and real output (and thus increasing unemployment in the short run).
- Such a policy mix is appropriate when the economy is experiencing demand-pull inflation (high inflation) and is operating above potential output, leading to very low unemployment (below the natural rate). The goal is to reduce inflationary pressure, even if it means a temporary rise in unemployment.
- Option B (high inflation, low unemployment) is exactly this situation.
- Option A (high inflation, high unemployment) is stagflation, which is caused by supply shocks, not excess demand. Contractionary policies would worsen unemployment, so they are not used.
- Option C (low inflation, high unemployment) indicates a recessionary gap; expansionary policies are needed, not contractionary.
- Option D (low inflation, low unemployment) is a desirable equilibrium; no policy intervention is required.
Key Takeaways
- Contractionary fiscal and monetary policies are used to combat demand-pull inflation when the economy is overheating (low unemployment).
- The short-run Phillips curve shows a trade-off: reducing inflation with contractionary policies may increase unemployment in the short run.
- Policymakers consider the macroeconomic context (inflation and unemployment levels) to choose the appropriate policy mix.
Common Mistakes
- Confusing the policy mix: some students might think contractionary policies are used to reduce unemployment (they actually increase it in the short run).
- Misunderstanding stagflation (high inflation + high unemployment) and thinking contractionary policies are appropriate for it—they are not; supply-side policies are needed.
- Overlooking that the question asks for the condition under which this combination is used, not the effect of the combination.
- Not recognising that low unemployment is a sign of overheating (above full employment) when combined with high inflation.
Things to Be Careful About
- Remember that the short-run Phillips curve trade-off implies that reducing inflation via contractionary policies will increase unemployment temporarily.
- Distinguish between demand-pull and cost-push inflation: contractionary policies only work on demand-pull.
- The question is a multiple-choice, so the reasoning is concise; the key is to match the condition to the policy.
- Note that the phrase "reduces its budget deficit by cutting government spending" indicates contractionary fiscal policy, not expansionary.
A country’s currency depreciates in terms of other currencies.
What would be a consequence of this depreciation?
Options
A There would be a decrease in structural unemployment.
B There would be a decrease in the volume of exports.
C There would be an increase in cost-push inflationary pressure.
D There would be an increase in the budget deficit.
Reasoning
A currency depreciation makes imports more expensive in domestic currency. This increases the cost of imported raw materials and components, raising firms' production costs. These higher costs are passed on to consumers in the form of higher prices, resulting in cost-push inflation. Therefore, one consequence is an increase in cost-push inflationary pressure.
Answer
C
C
Background Concept
A currency depreciation occurs when the value of a country's currency falls relative to other currencies under a floating exchange rate system. This affects the economy through two main channels: the price of imports and the price of exports. Depreciation makes imports more expensive in domestic currency because more domestic currency is needed to buy the same amount of foreign goods. This directly raises the cost of imported raw materials, components, and finished goods. For firms that rely on imported inputs, production costs increase. These higher costs can be passed on to consumers, leading to a rise in the general price level—cost-push inflation. On the other hand, depreciation makes exports cheaper for foreign buyers, increasing export competitiveness and potentially boosting aggregate demand (AD). However, the immediate and certain effect on inflation is through the cost side, shifting the short-run aggregate supply (SRAS) curve leftwards.
Understanding the Question
The question asks: "A country’s currency depreciates in terms of other currencies. What would be a consequence of this depreciation?" The command word "consequence" implies a direct and likely economic outcome of the depreciation itself. We are given four options, only one of which is a valid consequence. The correct answer must be grounded in the theory of exchange rate changes. The options touch on unemployment, exports, inflation, and fiscal policy. The challenge is to recognize which one follows logically from the mechanism of depreciation.
Approach
To solve this multiple-choice question, we apply the chain of reasoning for a currency depreciation:
- Depreciation increases the cost of imports.
- Higher import costs feed into firms' production costs.
- Higher production costs reduce SRAS (or increase costs for existing firms), leading to a higher price level—cost-push inflation.
- Evaluate each option against this chain:
- Option A (decrease in structural unemployment): Structural unemployment is long-term and caused by mismatches in skills or location; depreciation does not directly address this.
- Option B (decrease in volume of exports): Depreciation makes exports cheaper, so volume should increase, not decrease.
- Option C (increase in cost-push inflationary pressure): Matches the chain above.
- Option D (increase in the budget deficit): Budget deficit depends on fiscal policy choices; depreciation has no direct automatic effect on government budget balance.
By applying economic theory and eliminating the incorrect options, we arrive at C.
Step-by-Step Reasoning
- Definition of depreciation: A fall in the value of a currency relative to other currencies. This means that to buy the same amount of foreign goods, more domestic currency is required.
- Effect on import prices: Imported goods become more expensive in domestic currency. For example, if a country imports oil and machinery, the cost of these imports rises.
- Impact on firms' production costs: Many firms use imported raw materials, components, or energy. The increase in import prices directly raises their costs of production. Even firms that do not import directly may face higher costs if their domestic suppliers use imported inputs.
- Transmission to prices: Facing higher costs, firms will raise their selling prices to maintain profit margins or at least cover costs. This leads to a general increase in the price level—inflation.
- Type of inflation: This is cost-push inflation because it originates from an increase in production costs (the supply side), not from an increase in aggregate demand (demand-pull).
- Verification with AD/AS diagram: In an AD/AS framework, a depreciation that raises import costs shifts the SRAS curve leftwards (or upward), resulting in a higher price level and lower real output. This is consistent with cost-push inflation.
- Evaluation of other options:
- Option A: Depreciation might reduce cyclical unemployment if it boosts net exports and AD, but structural unemployment is not affected by short-run demand changes. Also, the question asks for a consequence, and the most direct is inflation, not employment changes.
- Option B: Depreciation makes exports cheaper, so the volume of exports is likely to rise, not fall. This option is the opposite of the truth.
- Option D: The budget deficit is a fiscal measure (government spending minus tax revenue). Depreciation can indirectly affect fiscal variables (e.g., through changes in tax revenues or spending on imported goods), but there is no automatic, direct consequence. It is not a standard immediate effect.
Therefore, only option C correctly identifies a direct consequence.
Key Takeaways
- Currency depreciation has immediate effects on import prices and thus on inflation through cost-push mechanisms.
- Depreciation can also boost exports and aggregate demand, but the inflationary effect via higher import costs is a direct and certain consequence.
- In multiple-choice questions, the most direct and theoretically sound consequence should be selected; indirect or vague links are less likely to be correct.
- Understanding the distinction between cost-push and demand-pull inflation is crucial.
Common Mistakes
- Mistaking depreciation for appreciation: Some students might think depreciation reduces export competitiveness (the opposite).
- Confusing structural unemployment with other types: Depreciation may affect cyclical unemployment via AD, but not structural.
- Thinking depreciation always leads to a budget deficit: The budget deficit is a fiscal policy issue; depreciation does not directly cause it.
- Ignoring the cost-push channel: Some students might focus only on AD effects (e.g., net exports increase) and forget that higher import costs also increase the price level.
Things to Be Careful About
- The exact definition of depreciation: a fall in the currency's value, making imports dearer and exports cheaper.
- The specific type of inflation: cost-push, not demand-pull, even though depreciation can also stimulate AD.
- Not all consequences are immediate or guaranteed; the question asks for a consequence, and cost-push inflation is the most robustly linked.
- In an AS-level context, the direct effect on inflation through import costs is a core point.
The terms of trade of a developing country fell from 90 in 2010 to 80 in 2015.
Assuming the index of its import prices remained constant at 110 between these two years, what happened to its index of export prices?
Options
A fell by 10
B fell by 11
C increased by 10
D increased by 30
Working
Terms of trade = (export price index / import price index) × 100.
For 2010: 90 = (EPI_2010 / 110) × 100 => EPI_2010 = (90 × 110) / 100 = 99.
For 2015: 80 = (EPI_2015 / 110) × 100 => EPI_2015 = (80 × 110) / 100 = 88.
Change in export price index: 88 - 99 = -11 (fell by 11).
Answer
B
B
Background Concept
The terms of trade measure the relative price of a country's exports compared to its imports. It is calculated as:
(Terms of trade index) = (Export price index / Import price index) × 100
This index shows how many units of imports can be purchased per unit of exports. A rise in the index indicates an improvement in the terms of trade (exports become relatively more valuable), while a fall indicates a deterioration (exports become relatively cheaper compared to imports).
Understanding the Question
The question states that the terms of trade index fell from 90 in 2010 to 80 in 2015. The import price index remained constant at 110 over the period. We are asked to find what happened to the export price index: did it rise or fall, and by how much? The options are changes in the export price index (not the percentage change, but the absolute change in the index value).
Approach
We need to work backwards from the terms of trade formula. For each year, the terms of trade index is given, and the import price index is known. Rearranging the formula allows us to solve for the export price index for each year. Then we compare the two values to find the change.
Step-by-Step Reasoning
-
Write the formula: Terms of trade (TOT) = (Export Price Index / Import Price Index) × 100.
-
For 2010: TOT = 90, Import Price Index = 110.
Substitute: 90 = (EPI_2010 / 110) × 100
Divide both sides by 100: 0.9 = EPI_2010 / 110
Multiply both sides by 110: EPI_2010 = 0.9 × 110 = 99. -
For 2015: TOT = 80, Import Price Index = 110.
Substitute: 80 = (EPI_2015 / 110) × 100
Divide by 100: 0.8 = EPI_2015 / 110
Multiply by 110: EPI_2015 = 0.8 × 110 = 88. -
Compare the export price indices: 2010 value is 99, 2015 value is 88. The change is 88 - 99 = -11, meaning the export price index fell by 11.
-
Therefore, the correct answer is option B: fell by 11.
Key Takeaways
- The terms of trade index is a ratio of export prices to import prices, multiplied by 100.
- When import prices are constant, a deterioration in the terms of trade (a fall in the index) must be caused by a fall in export prices.
- To find the absolute change in an index, calculate the values for each period and subtract.
Common Mistakes
- Confusing the terms of trade index with the export price index: the terms of trade is not the export price index itself, but a ratio. Some students might mistakenly think the export price index fell by 10 (the same as the change in the terms of trade), but that is incorrect because the terms of trade is scaled by the import price index.
- Forgetting to multiply by 100: the formula includes the ×100, so when rearranging, students must divide by 100 correctly.
- Arithmetic errors: misplacing decimal points when dividing or multiplying.
Things to Be Careful About
- Always check whether the answer is a fall or a rise. The terms of trade fell from 90 to 80, so the export price index must have fallen (since import prices were constant). Options C and D suggest an increase, which would be inconsistent with a falling terms of trade.
- Ensure you are working with the index values, not percentages. The change is in the index level, not the percentage change. The index fell by 11 points, not by 11%.
- Double-check the algebra: 90/100 = 0.9, then 0.9 × 110 = 99. Similarly, 80/100 = 0.8, 0.8 × 110 = 88. The difference is 11, not 10.
What is not a limitation of the theory of comparative advantage?
Options
A the movement of factors of production between countries
B governments’ imposition of trade restrictions
C one country being more efficient in the production of all goods
D transport costs outweighing any comparative advantage
Reasoning
The theory of comparative advantage assumes that factors of production are immobile between countries. Option A (movement of factors between countries) is therefore not a limitation — it is an assumption the theory makes, not a flaw that undermines it. Options B, C, and D are all recognised limitations: trade restrictions prevent specialisation from being realised; if one country has an absolute advantage in all goods, comparative advantage still exists but the theory's predictions may be less intuitive; and transport costs can erode or eliminate the gains from trade. Hence the correct answer is C.
Answer
C
C
Background Concept
The theory of comparative advantage, developed by David Ricardo, states that countries should specialise in producing goods where they have the lowest opportunity cost, and then trade. Even if one country is less efficient in producing everything (absolute disadvantage), mutually beneficial trade is still possible as long as opportunity costs differ. The theory relies on several simplifying assumptions: perfect factor mobility within a country, no transport costs, no trade barriers, constant returns to scale, and that factors are immobile between countries.
Understanding the Question
This is a multiple-choice question asking which of the four options is not a limitation of the theory of comparative advantage. The question tests whether you can distinguish between an assumption of the model (which is not a limitation) and genuine weaknesses that reduce the theory's real-world applicability. The correct answer is the one that is either an assumption the theory already makes, or is not actually a problem for the theory.
Approach
Read each option carefully and ask: "Does this undermine the practical usefulness of comparative advantage?" If yes, it is a limitation. If the theory already assumes this condition (or the condition does not contradict the theory), then it is not a limitation.
Step-by-Step Reasoning
-
Option A: The movement of factors of production between countries. The theory assumes factors of production (labour, capital) are immobile between countries — they can move freely within a country but not across borders. This is a core assumption, not a limitation. The fact that factors sometimes do move (e.g., labour migration, foreign direct investment) does not invalidate the theory; it simply means the real world is more complex. So this is not a limitation.
-
Option B: Governments’ imposition of trade restrictions. Tariffs, quotas, and other barriers prevent the free trade that comparative advantage requires. This is a major limitation because even if specialisation would be beneficial, protectionist policies stop it from happening. This is a limitation.
-
Option C: One country being more efficient in the production of all goods. This describes absolute advantage, not comparative advantage. Even if Country A is better at making everything, Country B still has a comparative advantage in the good where its disadvantage is smallest. The theory works perfectly well in this case — it does not require any country to have an absolute disadvantage. Therefore this is not a limitation. (It is a common misconception that comparative advantage fails when one country has absolute advantage in everything; it does not.)
-
Option D: Transport costs outweighing any comparative advantage. If the cost of shipping goods exceeds the gains from specialisation, trade may not occur. This is a real-world limitation because the theory assumes zero transport costs. This is a limitation.
Thus the only option that is not a limitation is C.
Key Takeaways
- The theory of comparative advantage works even when one country has an absolute advantage in all goods — it is the relative opportunity cost that matters.
- Limitations of the theory include: trade barriers, transport costs, factor immobility (within countries), constant returns to scale, and the assumption of perfect competition.
- Be careful not to confuse an assumption of the model with a limitation. Assumptions simplify reality; limitations are ways in which those simplifications cause the model to mispredict real outcomes.
Common Mistakes
- Choosing A because students think factor mobility is a limitation. In fact, the theory assumes factors are immobile between countries, so the possibility of movement is not a flaw — it is a departure from the assumption.
- Choosing C because students think absolute advantage in all goods makes comparative advantage irrelevant. This is incorrect: comparative advantage still exists and trade is still beneficial.
- Confusing the terms "limitation" and "assumption".
Things to Be Careful About
- Read the question carefully: "What is not a limitation?" — the negative wording can cause you to pick the wrong option if you are not paying attention.
- Remember that comparative advantage is about opportunity cost, not absolute efficiency. A country can be worse at everything and still gain from trade.
What would not be included in the current account of the balance of payments?
Options
A income earned outside the country that is transferred into the country
B value of food and raw materials produced and consumed within the country
C value of food and raw materials that are exported
D value of telecommunications services that are imported
Reasoning
The current account of the balance of payments records transactions between residents of one country and the rest of the world. It includes:
- Trade in goods (exports and imports of physical products)
- Trade in services (e.g. telecommunications, tourism)
- Primary income (e.g. investment income, compensation of employees)
- Secondary income (e.g. transfers of money)
Option B describes the value of food and raw materials produced and consumed within the country. This is a domestic transaction, not an international one, so it is not recorded in the current account.
Answer
B
B
Background Concept
The balance of payments is a record of all economic transactions between residents of one country and the rest of the world over a period of time. It is divided into two main accounts: the current account and the capital and financial account. The current account specifically records flows of goods, services, income, and current transfers. Only transactions that cross international borders are included.
Understanding the Question
The question asks which of the four options would NOT be included in the current account. This tests knowledge of what the current account actually records. The key is to recognise that the current account only captures international transactions — those between a country and the rest of the world. Domestic production and consumption, even if it involves food and raw materials, is not an international flow and therefore does not appear in the current account.
Approach
- Recall the four components of the current account: trade in goods, trade in services, primary income, secondary income.
- For each option, determine whether it represents an international transaction that fits one of these components.
- Identify the option that describes a purely domestic transaction.
Step-by-Step Reasoning
- Option A: Income earned outside the country that is transferred into the country. This is a secondary income transfer (or could be primary income if it is investment income). It is an international flow and is included in the current account.
- Option B: Value of food and raw materials produced and consumed within the country. This is entirely domestic — no cross-border transaction occurs. It is not recorded in the balance of payments at all.
- Option C: Value of food and raw materials that are exported. This is trade in goods (exports) and is a key component of the current account.
- Option D: Value of telecommunications services that are imported. This is trade in services (imports) and is included in the current account.
Therefore, only option B is not included.
Key Takeaways
- The current account records only international transactions.
- Domestic production and consumption, no matter how large, does not appear in the balance of payments.
- The four components are goods, services, primary income, and secondary income.
Common Mistakes
- Confusing the current account with the whole balance of payments or with national income accounts (GDP includes domestic production).
- Thinking that all trade in goods and services is automatically in the current account — it is, but only when it crosses borders.
- Misidentifying income transfers as not being part of the current account (they are, under secondary income).
Things to Be Careful About
- Read each option carefully: the phrase "produced and consumed within the country" is the key clue that it is domestic.
- Remember that exports and imports of both goods and services are always in the current account.
- Transfers of money across borders (like remittances) are included as secondary income.
A country has a current account deficit on its balance of payments. The government also has a budget deficit.
Which measure to reduce the current account deficit will increase the budget deficit?
Options
A depreciating the exchange rate
B introducing quotas on imports
C raising tariffs on imports
D subsidising exports
Reasoning
A current account deficit can be reduced by policies that increase exports or reduce imports. An export subsidy makes exports cheaper, boosting export revenue and reducing the deficit. However, the subsidy is a government expenditure, which increases the budget deficit (or reduces a surplus). The other options do not directly increase government spending: depreciating the exchange rate has no direct fiscal effect; quotas and tariffs do not involve government spending (tariffs raise revenue, reducing the budget deficit).
Answer
D
D
Background Concept
The balance of payments current account records trade in goods, services, primary income, and secondary income. A deficit means the country is spending more on foreign transactions than it earns. The government budget deficit occurs when government spending exceeds tax revenue. Policies to reduce a current account deficit can affect the budget deficit differently.
Understanding the Question
The question asks which policy to reduce the current account deficit will also increase the budget deficit. It requires evaluating each option's impact on both the current account and the government's fiscal position. The key is to identify which policy involves direct government spending that worsens the budget deficit.
Approach
Consider each option:
- Depreciating the exchange rate: makes exports cheaper and imports dearer, improving the current account. No direct effect on government spending or revenue, so budget deficit unchanged.
- Import quotas: restrict quantity of imports, improving current account. No direct fiscal effect (unless quotas are auctioned, but typically not). Budget deficit unchanged.
- Tariffs: tax on imports, reduces imports and raises government revenue, thus reduces budget deficit (or increases surplus).
- Export subsidies: government pays exporters, making exports cheaper, improving current account. But this is government spending, so increases budget deficit.
Only export subsidies increase the budget deficit while reducing the current account deficit.
Step-by-Step Reasoning
- Current account deficit: need to increase net exports (X-M).
- Export subsidy: government gives money to exporters, lowering their costs, allowing them to reduce export prices. This increases quantity of exports demanded, improving current account.
- The subsidy is a government expenditure, so it increases government spending (G) without a corresponding increase in tax revenue (unless taxes are raised elsewhere, but not stated). Thus budget deficit increases.
- Depreciation: no direct fiscal effect; it works through market forces.
- Quotas: restrict imports, but no government spending; may even reduce government revenue if tariffs are lost.
- Tariffs: generate revenue for government, reducing budget deficit.
Therefore, only D fits the condition.
Key Takeaways
- Export subsidies are a form of government spending that can improve the current account but worsen the budget deficit.
- Tariffs improve the current account and also raise revenue, improving the budget deficit.
- Exchange rate depreciation and quotas do not directly affect the budget deficit.
Common Mistakes
- Thinking tariffs increase the budget deficit (they actually raise revenue).
- Assuming all protectionist policies have the same fiscal effect.
- Overlooking that subsidies are government spending.
Things to Be Careful About
- Distinguish between policies that affect government spending vs. revenue.
- Remember that the budget deficit is G - T; any increase in G or decrease in T worsens it.
- In this question, only export subsidies increase G.
Your score so far
Answer a question to start scoring
Your marks add up here as you work through the paper.