Economics 9708/24 — May/June 2025
Cambridge AS Level · AS Level Data Response and Essays · worked solutions for every part, with the mark scheme
Topics Methods of Government Intervention in Markets · Economic Growth · National Income Statistics · Unemployment · Elasticities of Demand · Classification of Goods and Services · +9 more
Economic challenges in Malaysia
Annual growth in real GDP in Malaysia averaged 5.2% during the past ten years. There was a great deal of instability in GDP between July 2020 and July 2021, largely due to the COVID-19 pandemic. Economic growth was projected to grow by between 5.5% and 6.5% in 2022. The percentage change in real GDP per annum in Malaysia between January 2019 and January 2022 is shown in Fig. 1.1.

Content removed due to copyright restrictions.
Source: Adapted from Press Release from the Malaysia Ministry of Finance, 11 February 2022
Using the data in Fig. 1.1, describe the trend shown in the annual rate of economic growth in Malaysia over the period January 2019 to January 2022.
Answer
Overall, the annual rate of economic growth in Malaysia between January 2019 and January 2022 was fluctuating, with an initial decline into negative growth followed by a recovery. Up to January 2021, the growth rate fell and turned negative, largely due to the COVID-19 pandemic. From July 2021 to January 2022, the growth rate returned to positive territory as the economy recovered.
Fluctuating trend: growth rate fell to negative levels by January 2021, then recovered to positive growth from July 2021 to January 2022.
Background Concept
Economic growth is a core macroeconomic objective, measured most commonly by the annual percentage change in real GDP. Real GDP adjusts nominal GDP (the value of output at current prices) for inflation, so it reflects the actual volume of goods and services produced in an economy, rather than the effect of rising prices. Trends in real GDP growth show whether an economy is expanding, contracting or experiencing volatility over time.
Understanding the Question
This 2-mark question asks you to describe the trend in Malaysia's annual real GDP growth rate between January 2019 and January 2022, using the data in Fig 1.1. The graph (described in the question) shows fluctuations in the growth rate, including a sharp fall into negative territory during 2020 (the COVID-19 pandemic) and a recovery to positive growth from mid-2021. You are not required to explain why the trend occurs, only to describe what the trend shows. The mark scheme rewards two key elements: an overall description of the trend, and identification of the key phase changes over the period.
Approach
Start by stating the overall trend first (e.g. fluctuating, with an initial decline and later recovery), then support this with the key phases: the fall into negative growth up to early 2021, and the return to positive growth from mid-2021 to January 2022. Do not list every small fluctuation, as the mark scheme guidance says the overall trend is what is rewarded, not every individual change. Keep the answer concise, as it is only worth 2 marks.
Step-by-Step Reasoning
- First, identify the overall pattern: the growth rate does not move in a straight line, so the overall trend is fluctuating. It also shows a clear decline from the start of the period to early 2021, followed by a recovery, so you can also describe it as a falling trend followed by a rise.
- Next, identify the first key phase: from January 2019 to January 2021, the growth rate fell steadily, turning negative (below 0%) during 2020, which aligns with the COVID-19 pandemic described in the question stem.
- Then identify the second key phase: from July 2021 to January 2022, the growth rate rose and returned to positive values, showing the economy was recovering from the pandemic downturn.
- Combine these points into a concise description, linking the phases to the context of the pandemic where relevant, as this is provided in the question stem.
Key Takeaways
- When describing a trend from a graph, always state the overall trend first, then support it with key data points or phase changes.
- For 2-mark description questions, two clear, relevant points are sufficient for full marks.
- Do not explain the causes of the trend unless the question explicitly asks for it, as this wastes time and does not earn marks.
Common Mistakes
- Listing every small up-and-down movement in the graph: the mark scheme explicitly says the overall trend is what is marked, not every change.
- Stating a trend with no reference to the time period or phases: you must link the trend to the specific period given (Jan 2019 to Jan 2022).
- Adding unasked-for analysis of why the trend occurred: this is a description question, so analysis of causes is not required and does not earn marks.
Things to Be Careful About
- Make sure your description covers the full time period given, not just the pandemic period.
- Use the context provided in the question stem (the COVID-19 pandemic) to frame the trend, as this is relevant to the data shown.
Answer
Real GDP is the total monetary value of all final goods and services produced within an economy in a given time period, adjusted for changes in the price level (inflation). It is calculated by taking nominal GDP and removing the effect of price rises, or by valuing output at the prices of a base year. This adjustment means real GDP reflects the actual volume of output produced, rather than the effect of rising prices.
The total value of goods and services produced in an economy, adjusted for inflation/price changes.
Background Concept
National income measures the total value of economic activity in an economy over a given time period, usually a year. The most common measure is Gross Domestic Product (GDP), which counts the value of all final goods and services produced within a country's borders. However, GDP can be measured in two ways: nominal GDP, which uses current prices in the year of measurement, and real GDP, which adjusts for changes in the overall price level (inflation) to reflect the actual volume of output produced.
Understanding the Question
This 2-mark question asks you to explain the meaning of the term 'real GDP'. It is a straightforward definition question, with no requirement to apply the term to the Malaysian context or to analyse its uses. The mark scheme awards one mark for the basic definition of GDP (total value of goods and services produced) and one mark for the key distinction that real GDP is adjusted for inflation/price changes.
Approach
Start by defining GDP as the total value of final goods and services produced in an economy, then explain that real GDP adjusts this figure for changes in the price level, so it measures the actual volume of output rather than the effect of rising prices. You can also mention the formula (real GDP = nominal GDP - effect of inflation) if you wish, as this is credited in the mark scheme.
Step-by-Step Reasoning
- First, state the core definition of GDP: it is the total monetary value of all final goods and services produced within an economy in a given time period (usually a year). This earns the first mark.
- Next, explain the key adjustment that makes GDP 'real': nominal GDP is calculated using the prices of the year in which output is produced, so if prices rise (inflation), nominal GDP will increase even if the actual volume of output stays the same. Real GDP removes the effect of inflation, either by using the prices of a base year or by subtracting the impact of inflation from nominal GDP, to show the actual quantity of goods and services produced. This earns the second mark.
- You can optionally add that real GDP is the standard measure used to compare economic growth over time, as it removes the distortion of price changes.
Key Takeaways
- Definition questions require precise, textbook-style definitions of the term, with all key elements included.
- For 2-mark definition questions, two distinct, correct points are sufficient for full marks.
- Always distinguish real values from nominal values when defining terms like real GDP, as this is the core feature that makes the measure useful.
Common Mistakes
- Defining real GDP as GDP adjusted for population growth: this is incorrect, as population-adjusted GDP is GDP per capita, not real GDP.
- Forgetting to mention the inflation adjustment: the key feature of real GDP is that it removes the effect of price changes, so this must be included to earn the second mark.
- Confusing real GDP with other national income measures like GNI or NNI: this question only asks for real GDP, so do not include unrelated measures.
Things to Be Careful About
- Make sure your definition is precise: real GDP measures output produced within the economy's borders (like GDP), not output produced by the country's citizens (which would be GNI).
- If you use the formula, make sure you explain what it means, rather than just writing the equation without context.
Consider the extent to which the potential advantages of subsidies given to firms by the Malaysian government outweigh their potential disadvantages.
Answer
Subsidies to firms can offer several advantages. First, they reduce firms' costs of production, which can lower prices for consumers, increase consumer surplus and raise living standards. Second, lower costs can improve firms' international competitiveness, boosting export sales, increasing aggregate demand and reducing unemployment as firms expand output.
However, subsidies also have significant disadvantages. Government spending on subsidies is costly and may contribute to a budget deficit or require higher taxes elsewhere. Subsidies may also reduce firms' incentives to improve efficiency, as they become reliant on government support, and could provoke retaliatory trade measures from other countries if they are seen as unfair trade advantages.
Overall, the potential advantages of subsidies do not necessarily outweigh their disadvantages. While they can support specific industries and protect jobs in the short run, the long-run costs of reduced efficiency, fiscal burden and trade retaliation are likely to be greater, particularly if subsidies are not targeted at sectors with clear social or economic benefits.
The potential disadvantages of subsidies generally outweigh their advantages, due to the fiscal cost to the government, risk of reduced firm efficiency and potential trade retaliation, unless subsidies are carefully targeted at sectors with clear long-run social benefits.
Background Concept
Government subsidies are payments made by the government to firms to reduce their costs of production, with the aim of encouraging production of goods and services that are deemed socially beneficial, or to support industries that are struggling. Subsidies shift the supply curve to the right, lowering market prices and increasing output. However, they come with both potential benefits and drawbacks for different stakeholders, including consumers, firms, the government and the wider economy.
Understanding the Question
This 4-mark point-based evaluative question asks you to "consider the extent to which" the potential advantages of subsidies outweigh their potential disadvantages, in the context of Malaysia. The command word "consider" requires you to present both sides of the argument and reach a short judgement on which side is stronger. The mark scheme awards up to 2 marks for advantages, up to 2 marks for disadvantages, and 1 mark for a valid evaluation/judgement (with a cap of 3 marks for analysis if points are not developed). You do not need to apply the analysis specifically to Malaysia unless you wish to, but context-specific points will strengthen your evaluation.
Approach
First, list two clear advantages of subsidies, explaining each briefly (e.g. lower costs for firms, lower prices for consumers, higher exports, higher employment). Then list two clear disadvantages (e.g. fiscal cost to the government, risk of firm inefficiency, trade retaliation). Finally, weigh the two sides against each other and reach a clear judgement on whether advantages outweigh disadvantages, justifying your view with a short reason.
Step-by-Step Reasoning
- Advantage 1: Subsidies reduce firms' costs of production, which can lower the prices of goods and services for consumers. Lower prices increase consumer surplus (the difference between what consumers are willing to pay and what they actually pay), raising living standards for households.
- Advantage 2: Lower production costs can improve the international competitiveness of domestic firms, as they can sell their goods at lower prices on global markets. This boosts export sales, increasing aggregate demand, raising firm revenue and encouraging firms to hire more workers, reducing unemployment.
- Disadvantage 1: Subsidies are costly for the government to fund, requiring either higher taxes, increased public borrowing or reduced spending on other public services. This can lead to a larger budget deficit and higher national debt, creating long-run fiscal pressures.
- Disadvantage 2: Subsidies can reduce firms' incentives to improve efficiency and innovate, as they become reliant on government support rather than competing in the market. This can lead to long-run productive inefficiency, and may also provoke retaliatory tariffs or trade disputes from other countries if subsidies are seen as giving domestic firms an unfair advantage.
- Evaluation/Judgement: Weigh the two sides: while subsidies can provide short-run support for consumers and strategic industries, the long-run costs of fiscal burden, inefficiency and trade conflict are likely to outweigh the advantages unless subsidies are carefully targeted at sectors with clear social benefits (e.g. renewable energy) or are temporary. For Malaysia, which has a significant fiscal deficit, the cost of widespread subsidies is likely to be a greater drawback than the benefits.
Key Takeaways
- Evaluative questions with the command word "consider" require you to present both sides of the argument and reach a clear judgement, not just list points.
- For 4-mark evaluative parts, two developed points per side plus a short judgement is sufficient for full marks.
- Always link advantages and disadvantages to their impact on relevant stakeholders (consumers, firms, government, economy) to develop your points fully.
Common Mistakes
- Listing only advantages or only disadvantages: this is a one-sided answer, which will score zero for the evaluation mark and cap the overall mark.
- Making unsubstantiated assertions: e.g. saying "subsidies are bad" without explaining why, or listing points without linking them to their effects.
- Forgetting to include a judgement: the "consider the extent" clause requires you to state which side is stronger, so a conclusion is required to earn the final mark.
Things to Be Careful About
- Make sure your advantages and disadvantages are distinct: do not list the same point twice (e.g. lower prices for consumers is an advantage, not a disadvantage).
- Keep your judgement concise: it only needs 1-2 sentences, as it is only worth 1 mark, but it must be clear and justified.
- If you use context from the Malaysian economy (e.g. Malaysia's reliance on commodity exports, its fiscal position), this will strengthen your evaluation, but generic points are also acceptable.
Assess how far external factors were responsible for economic growth in Malaysia over the period January 2019 to January 2022.
Answer
External factors played a significant role in Malaysia's economic growth over the period. First, Malaysia is a major exporter of oil and gas, so rising global commodity prices during the period increased export revenues and contributed to GDP growth. Second, growth in demand from Malaysia's major trading partners, particularly as the global economy recovered from the COVID-19 pandemic, boosted export sales, which reached record highs in late 2021. Third, a weaker Malaysian ringgit during the recovery phase made exports cheaper for foreign buyers, further increasing external demand for Malaysian goods and services.
Internal factors were also important drivers of growth. First, the Malaysian government introduced domestic subsidies for firms to support production and employment during the pandemic recovery, which helped to sustain domestic output and aggregate demand. Second, government policies to increase labour and product market flexibility allowed firms to adjust more quickly to changing conditions, supporting higher output and employment. Third, high levels of foreign direct investment and domestic investment, encouraged by government incentives, increased the economy's productive capacity and contributed to growth.
Overall, external factors were more responsible for Malaysia's economic growth over the period than internal factors. While government domestic policies provided important short-run support during the pandemic recovery, the surge in export demand driven by global commodity prices and post-pandemic global growth was the primary driver of the strong growth recorded in 2021 and early 2022. Without this external demand, domestic policy support would have had a much smaller impact on overall GDP growth.
External factors, particularly strong global demand for Malaysian exports and high commodity prices, were more responsible for Malaysia's economic growth over the period than internal government policies, as external demand provided the primary driver of the post-2020 recovery.
Background Concept
Economic growth is the sustained increase in the real volume of goods and services produced in an economy over time, measured by the annual percentage change in real GDP. Growth can be driven by two broad categories of factors: external factors, which originate outside the domestic economy (e.g. global demand, commodity prices, exchange rates), and internal factors, which originate within the domestic economy (e.g. government policy, domestic investment, productivity improvements). Assessing the relative importance of these factors requires comparing their contribution to changes in aggregate demand and aggregate supply, the two drivers of economic output.
Understanding the Question
This 6-mark point-based evaluative question asks you to assess how far external factors were responsible for Malaysia's economic growth between January 2019 and January 2022. The command word "assess" requires you to present analysis of both external and internal factors, compare their relative importance, and reach a justified conclusion. The mark scheme awards up to 3 marks for analysis of external factors, up to 3 marks for analysis of internal factors, up to 2 marks for evaluation comparing the two, and 1 mark for a justified conclusion. You may use context from the Malaysian economy provided in the question stem (e.g. the COVID-19 pandemic, Malaysia's status as a commodity exporter) to strengthen your answer.
Approach
First, identify and explain three external factors that could have driven growth in Malaysia over the period, linking each to the mechanism by which it increases real GDP (e.g. higher exports increase aggregate demand, raising output). Then identify and explain three internal factors, linking each to the growth mechanism. Next, weigh the relative importance of external vs internal factors, using context from the period (e.g. the global post-pandemic recovery, Malaysia's domestic policy responses) to support your view. Finally, reach a clear, justified conclusion on how far external factors were responsible for growth.
Step-by-Step Reasoning
- External Factor 1: Global demand for exports: Malaysia is a major exporter of manufactured goods, commodities (oil, gas, palm oil) and services. The global economic recovery after the COVID-19 pandemic led to a surge in demand from Malaysia's major trading partners (e.g. China, the US, the EU), boosting export sales. Exports are a component of aggregate demand (AD = C + I + G + (X-M)), so higher exports increase AD, leading to higher real output and economic growth. The question stem notes that exports reached an all-time high in late 2021, which aligns with this factor.
- External Factor 2: High global commodity prices: Malaysia is a net exporter of oil and gas. During 2021, global energy prices rose sharply as demand recovered from the pandemic, increasing Malaysia's export revenues and contributing directly to higher GDP. This is an external factor as it is driven by global market conditions, not domestic policy.
- External Factor 3: Exchange rate movements: A depreciation of the Malaysian ringgit against other major currencies during the recovery phase made Malaysian exports cheaper for foreign buyers and imports more expensive for domestic consumers, further boosting export demand and reducing import demand, increasing net exports and AD.
- Internal Factor 1: Domestic government subsidies: The Malaysian government introduced subsidies for firms during the pandemic to support production and employment, reducing firms' costs and allowing them to maintain output and hire workers during the downturn. These subsidies supported domestic aggregate demand and productive capacity, contributing to the post-2020 recovery.
- Internal Factor 2: Market flexibility policies: Government policies to increase labour and product market flexibility (e.g. reducing red tape, reforming labour laws) allowed firms to adjust more quickly to changing market conditions during the pandemic and recovery, supporting higher output and employment than would otherwise have been possible.
- Internal Factor 3: Investment incentives: Government incentives for foreign direct investment (FDI) and domestic investment increased the stock of capital in the economy, raising productive capacity and supporting long-run economic growth. High levels of investment also contributed to short-run AD, boosting output during the recovery.
- Evaluation and Conclusion: Weigh the two sets of factors: while domestic policies provided important short-run support during the pandemic, the surge in external demand for exports and high commodity prices were the primary drivers of the strong growth recorded in 2021 and early 2022. External factors were more responsible for growth over the period, as the global post-pandemic recovery created a favourable external environment that amplified the impact of domestic policies. Without this external demand, domestic policy support would have had a much smaller impact on overall GDP growth.
Key Takeaways
- When assessing the causes of economic growth, always distinguish between external (global) and internal (domestic) factors, as this is the core of the question.
- Link each factor to the AD/AS model: factors that increase AD (e.g. higher exports, higher investment) or shift LRAS to the right (e.g. higher productivity, more capital) drive economic growth.
- Use context from the question stem (e.g. the pandemic, Malaysia's export structure) to make your analysis specific and relevant.
Common Mistakes
- Failing to differentiate between external and internal factors: the mark scheme caps analysis at 4 marks if factors are not clearly split between the two categories, so you must explicitly label each factor as external or internal.
- Listing factors without explaining how they drive growth: you must link each factor to its effect on AD, AS or output to earn analysis marks.
- Writing a one-sided answer focusing only on external or only internal factors: this will forfeit all evaluation marks, as "assess" requires you to consider both sides.
- Ending with a summary instead of a justified conclusion: you must state clearly how far external factors were responsible, not just restate the two sets of factors.
Things to Be Careful About
- Use the data and context provided in the question stem: the mention of record export growth in 2021 and Malaysia's reliance on commodities are key context points that strengthen your analysis of external factors.
- Make sure your evaluation explicitly compares the two sets of factors: do not just list them, but state which is more important and why.
- Keep your conclusion focused on the exact question asked: it must answer "how far" external factors were responsible, not just say "both factors mattered".
Answer
A falling rate of unemployment has several positive consequences for Malaysia. First, higher employment increases total household income, raising average living standards and reducing poverty. Second, higher employment increases consumer spending, boosting aggregate demand and encouraging firms to invest in additional capacity to meet rising demand. Third, a larger employed population increases government tax revenues from income and consumption taxes, while reducing spending on unemployment welfare benefits, freeing up public funds for investment in infrastructure, education and healthcare.
However, falling unemployment also carries negative consequences. First, as the economy approaches full employment, labour and other resources become scarce, putting upward pressure on wages and production costs, which can lead to cost-push inflation. Second, rising household incomes increase demand for imported goods and services, which can worsen the current account balance and lead to a depreciation of the Malaysian ringgit. Third, firms may be forced to hire less productive workers as the pool of unemployed labour shrinks, leading to a decline in average labour productivity over time.
Overall, the positive consequences of falling unemployment for Malaysia outweigh the negative consequences in the short to medium run, provided the economy has sufficient spare capacity to absorb additional demand without triggering high inflation. In the long run, the negative effects of skill shortages and inflation can be mitigated by investment in training and supply-side policies to increase productive capacity.
The positive consequences of falling unemployment for Malaysia generally outweigh the negative consequences in the short to medium term, though long-run risks of inflation and skill shortages require accompanying supply-side policies to manage.
Background Concept
Unemployment is the state of being without a job while actively seeking work. The unemployment rate is the percentage of the labour force that is unemployed. A falling unemployment rate means that a larger share of the labour force is employed, which has a range of consequences for the economy, households, firms and the government. These consequences can be positive (e.g. higher incomes, higher output) or negative (e.g. inflation, current account deficits), depending on the state of the economy and the pace of the fall in unemployment.
Understanding the Question
This 6-mark point-based evaluative question asks you to assess the possible consequences of a falling rate of unemployment for Malaysia. The command word "assess" requires you to present both positive and negative consequences, weigh their relative importance, and reach a justified conclusion. The mark scheme awards up to 3 marks for positive consequences, up to 3 marks for negative consequences, up to 2 marks for evaluation, and 1 mark for a justified conclusion. You do not need detailed knowledge of the Malaysian economy, as generic consequences are acceptable, but context-specific points will strengthen your answer.
Approach
First, list three positive consequences of falling unemployment, explaining the chain of reasoning for each (e.g. higher employment -> higher income -> higher living standards). Then list three negative consequences, again explaining the causal chain for each. Next, weigh the positive and negative effects, considering factors such as the state of the economy (e.g. how much spare capacity exists) and the pace of the fall in unemployment. Finally, reach a clear, justified conclusion on the overall impact of falling unemployment for Malaysia.
Step-by-Step Reasoning
- Positive Consequence 1: Higher household incomes and living standards: Falling unemployment means more people are earning wages, increasing total household income in the economy. Higher incomes allow households to spend more on goods and services, raising average living standards and reducing poverty and income inequality.
- Positive Consequence 2: Higher aggregate demand and firm investment: Higher employment increases consumer spending, which is the largest component of aggregate demand (AD). Rising AD encourages firms to invest in new machinery, equipment and premises to meet higher demand, increasing the economy's productive capacity and supporting further long-run growth.
- Positive Consequence 3: Improved public finances: A larger employed population increases government tax revenues from income tax, value added tax (VAT) and other consumption taxes, while reducing spending on unemployment benefits and other welfare support for jobless households. This improves the government's budget position, freeing up funds for public investment in infrastructure, education and healthcare.
- Negative Consequence 1: Demand-pull inflation: As unemployment falls and the economy approaches full employment, aggregate demand may outstrip the economy's spare productive capacity. This puts upward pressure on prices, leading to demand-pull inflation, which erodes the real value of household incomes and reduces international competitiveness if inflation is higher than in trading partner countries.
- Negative Consequence 2: Cost-push inflation and skill shortages: As the pool of unemployed workers shrinks, firms may have to offer higher wages to attract and retain staff, increasing production costs. These higher costs are passed on to consumers in the form of higher prices, leading to cost-push inflation. Skill shortages may also emerge if the unemployed workforce does not have the skills needed for available jobs, reducing labour productivity.
- Negative Consequence 3: Worsening current account balance: Higher household incomes increase demand for imported goods and services, as consumers buy more foreign products. If exports do not rise at the same rate, the increase in imports will widen the current account deficit, leading to a depreciation of the domestic currency and potential external economic instability.
- Evaluation and Conclusion: Weigh the positive and negative effects: the positive consequences of falling unemployment (higher incomes, higher output, improved public finances) generally outweigh the negative consequences in the short to medium run, provided the economy has sufficient spare capacity to avoid high inflation. In the long run, the negative effects of inflation and skill shortages can be mitigated by supply-side policies (e.g. training programmes, investment in infrastructure) to increase productive capacity. For Malaysia, which has a relatively young and growing labour force, the benefits of falling unemployment are likely to exceed the costs in the medium term if accompanied by appropriate training and investment policies.
Key Takeaways
- When assessing the consequences of a macroeconomic change, always consider both positive and negative effects for different stakeholders (households, firms, government, external economy).
- Link each consequence to a clear causal chain: e.g. falling unemployment -> higher employment -> higher income -> higher living standards. Do not just list effects without explaining how they occur.
- Evaluation requires you to weigh the relative importance of the positive and negative effects, and to state under what conditions one set of effects will dominate the other.
Common Mistakes
- Writing a one-sided answer focusing only on positive or only negative consequences: this will forfeit all evaluation marks, as "assess" requires consideration of both sides.
- Listing consequences without explaining the causal link: e.g. saying "falling unemployment causes inflation" without explaining why (higher wages, scarce resources) will not earn full analysis marks.
- Ending with a summary instead of a justified conclusion: you must state clearly whether the overall impact of falling unemployment is positive or negative, and under what conditions, not just restate the positive and negative points.
- Forgetting to consider the context of the Malaysian economy: while generic points are acceptable, linking consequences to Malaysia's structure (e.g. its reliance on exports, its fiscal position) will strengthen your answer.
Things to Be Careful About
- Distinguish between different types of inflation: demand-pull inflation (from excess demand) and cost-push inflation (from higher wages and production costs) are separate consequences, so explain both clearly.
- Make sure your evaluation is comparative: do not just list positive and negative points, but state which set of effects is more significant and why.
- Keep your conclusion focused on the exact question asked: it must assess the consequences for Malaysia, not just make generic statements about unemployment.
With the help of a formula, explain the meaning of price elasticity of demand and consider the significance to a firm of having price elastic or price inelastic demand for its product.
Answer
Price elasticity of demand (PED) measures the responsiveness of quantity demanded to a change in price. The formula is:
PED = % change in quantity demanded / % change in price
If PED > 1, demand is price elastic: quantity demanded changes proportionately more than price. If PED < 1, demand is price inelastic: quantity demanded changes proportionately less than price.
For a firm, the significance of PED lies in its effect on total revenue. When demand is price elastic, a fall in price leads to a more than proportionate increase in quantity demanded, so total revenue rises. Conversely, a rise in price leads to a more than proportionate fall in quantity demanded, so total revenue falls. When demand is price inelastic, a fall in price leads to a less than proportionate increase in quantity demanded, so total revenue falls. A rise in price leads to a less than proportionate fall in quantity demanded, so total revenue rises.
Therefore, a firm should lower its price if demand is elastic to increase revenue, and raise its price if demand is inelastic to increase revenue. This knowledge is crucial for profit-maximising pricing decisions.
The price elasticity of demand is significant for a firm because it determines the effect of price changes on total revenue, guiding optimal pricing strategy: lower prices if elastic, raise prices if inelastic.
Background Concept
Price elasticity of demand (PED) is a measure of how much the quantity demanded of a good responds to a change in its price. It is calculated as the percentage change in quantity demanded divided by the percentage change in price. The value is usually negative because price and quantity demanded move in opposite directions, but economists often refer to the absolute value. If the absolute value is greater than 1, demand is elastic; if less than 1, demand is inelastic; if equal to 1, unit elastic. The concept is crucial for firms because it determines how a change in price affects total revenue (price × quantity).
Understanding the Question
The question asks you to "explain the meaning of price elasticity of demand" and "consider the significance to a firm of having price elastic or price inelastic demand for its product." The command word "explain" requires you to define PED and give the formula, and also to clarify what elastic and inelastic mean. The word "consider" indicates that you need to evaluate the importance for a firm, which involves analysing the impact on total revenue and making a judgement about pricing strategy. This is a point-based question with marks allocated to AO1 (knowledge), AO2 (analysis), and AO3 (evaluation).
Approach
Start by defining PED and providing the formula. Then explain the meaning of elastic and inelastic in terms of the proportionate response. Next, analyse the effect of a price change on total revenue for both elastic and inelastic demand, covering both a price rise and a price fall. Finally, evaluate the significance by stating what a firm should do in each case to maximise revenue. Keep the answer concise but ensure each point is clearly made.
Step-by-Step Reasoning
- Definition and formula: PED = %ΔQd / %ΔP. This shows the responsiveness. For example, if price rises by 10% and quantity demanded falls by 20%, PED = -2 (elastic).
- Elastic vs inelastic: Elastic (PED > 1) means quantity changes proportionately more than price; inelastic (PED < 1) means quantity changes proportionately less.
- Impact on total revenue: Total revenue = price × quantity. If demand is elastic, a price cut leads to a large increase in quantity, so total revenue rises. A price rise leads to a large fall in quantity, so total revenue falls. If demand is inelastic, a price cut leads to a small increase in quantity, so total revenue falls. A price rise leads to a small fall in quantity, so total revenue rises.
- Evaluation for the firm: The firm can use this knowledge to set prices. If demand is elastic, lower prices to increase revenue; if inelastic, raise prices to increase revenue. This is significant because it directly affects profitability.
Key Takeaways
- PED measures responsiveness of quantity demanded to price changes.
- Elastic demand: price cut raises total revenue; price rise lowers total revenue.
- Inelastic demand: price cut lowers total revenue; price rise raises total revenue.
- Firms should adjust pricing strategy based on PED to maximise revenue.
Common Mistakes
- Confusing elastic and inelastic: remember elastic means responsive, inelastic means unresponsive.
- Forgetting to consider both price increase and decrease: the analysis must cover both directions.
- Not linking to total revenue: the significance is about revenue, not just quantity.
- Omitting the formula: the question explicitly asks for it.
Things to Be Careful About
- Use the correct formula and show it clearly.
- Remember that PED is usually negative, but we often use the absolute value for interpretation.
- Distinguish between a movement along the demand curve (price change) and a shift (other factors).
- In the evaluation, be specific about what the firm should do, not just describe the effect.
Assess whether governments should always support the provision of merit goods in markets such as those for education or health care.
Introduction
Merit goods are goods that are under-consumed in a free market because individuals underestimate their private benefits, leading to a market failure. Education and healthcare are classic examples. This essay assesses whether governments should always support their provision.
Arguments for government support
The main reason for government intervention is the information failure that leads to underconsumption. Consumers may not fully appreciate the long-term benefits of education or healthcare, so they consume less than the socially optimal level. Government support can take the form of direct provision (e.g., state schools, public hospitals), subsidies (e.g., reduced fees), or provision of information (e.g., public health campaigns). These measures increase consumption towards the socially optimal level, improving social welfare. Additionally, education and healthcare have positive externalities: a healthier, more educated workforce raises productivity and economic growth, benefiting society as a whole. Without government support, these benefits would be underprovided.
Arguments against always supporting provision
However, government intervention is not always justified. Government failure can occur: state provision may be inefficient due to lack of competition, leading to higher costs and lower quality. There is also an opportunity cost: spending on education and healthcare means less spending on other priorities such as infrastructure or defence. Furthermore, private provision may be more efficient and responsive to consumer preferences. For example, private schools and hospitals can offer choice and innovation. Additionally, information failure may still exist even with government provision; consumers may not use services effectively. Finally, government support may lead to budget deficits if not financed sustainably.
Evaluation
The case for government support is strong where market failure is significant and private provision would lead to severe underconsumption. However, the extent of government support should depend on the specific market. For essential services like primary education and basic healthcare, direct provision may be necessary to ensure universal access. For higher education or non-essential healthcare, subsidies or information campaigns may be sufficient. The key is to balance the benefits of intervention against the costs of government failure. A mixed approach, combining state provision with regulated private provision, often works best.
Conclusion
Governments should not always support the provision of merit goods. While intervention is justified to correct market failure, it is not always the most efficient or effective solution. The decision should be based on the specific characteristics of the good, the extent of market failure, and the capacity of the government to deliver efficiently. A nuanced, case-by-case approach is preferable to a blanket policy of always supporting provision.
Governments should not always support the provision of merit goods; while market failure due to information failure justifies intervention, government failure, opportunity cost, and the potential for private provision mean that support should be assessed on a case-by-case basis, with a combination of direct provision, subsidies, and information campaigns being most effective.
Background Concept
Merit goods are goods that are considered to be beneficial for society but are under-consumed in a free market because individuals have imperfect information about their long-term benefits. Examples include education and healthcare. The market failure arises because consumers may not fully appreciate the private benefits, leading to a level of consumption below the socially optimal level. Additionally, merit goods often generate positive externalities (benefits to third parties), such as a more productive workforce from education or reduced disease spread from healthcare. Governments can intervene to correct this underconsumption through direct provision (e.g., state schools), subsidies (e.g., reduced tuition fees), or information campaigns (e.g., promoting vaccination). However, government intervention is not without drawbacks: government failure can occur due to inefficiency, lack of competition, and bureaucratic costs. There is also an opportunity cost of public spending, and private provision may sometimes be more efficient.
Understanding the Question
The question asks: "Assess whether governments should always support the provision of merit goods in markets such as those for education or health care." The command word "assess" requires you to evaluate the arguments for and against and reach a justified conclusion. The word "always" is key: it implies that you should consider whether there are circumstances where government support is not appropriate. You need to discuss both sides and then give a balanced judgement. This is a levels-marked question with AO1+AO2 out of 8 and AO3 out of 4. The top band for AO1/AO2 requires detailed knowledge, developed analysis, and a well-organised response. The top band for AO3 requires a justified conclusion with developed evaluative comments.
Approach
Structure your essay as follows:
- Introduction: Define merit goods and state the issue.
- Arguments for government support: Explain information failure, underconsumption, positive externalities, and methods of intervention.
- Arguments against always supporting: Discuss government failure, opportunity cost, private provision, and potential budget deficits.
- Evaluation: Weigh the arguments, considering the type of merit good and context. Conclude that support is not always justified; it depends on the specific good and the effectiveness of government.
- Conclusion: Summarise the judgement.
Use examples from education and healthcare throughout.
Step-by-Step Reasoning
- Define merit goods: Goods that are under-consumed due to information failure; they have positive externalities.
- Explain the market failure: Consumers may not know the full benefits (e.g., long-term health benefits of exercise), so they consume too little. This leads to a welfare loss.
- Arguments for government support:
- Direct provision ensures universal access (e.g., state schools).
- Subsidies lower the price, encouraging consumption (e.g., subsidised university tuition).
- Information campaigns correct the information failure (e.g., anti-smoking campaigns for demerit goods, but for merit goods, promoting benefits).
- Positive externalities: education increases human capital, healthcare reduces disease burden, benefiting society.
- Arguments against always supporting:
- Government failure: public provision may be inefficient, with high costs and low quality due to lack of competition.
- Opportunity cost: money spent on education/healthcare could be used for other public goods like defence or infrastructure.
- Private provision may be more efficient and innovative (e.g., private schools often have better results).
- Information failure may persist even with government provision; consumers may still not use services optimally.
- Budget deficits: if government spends without raising taxes, it may lead to unsustainable debt.
- Evaluation:
- The strength of the case depends on the specific good. For essential services (primary education, basic healthcare), market failure is severe and private provision may exclude the poor, so government support is strongly justified.
- For non-essential services (higher education, cosmetic surgery), private provision may work well with some regulation.
- Government failure can be mitigated by introducing competition (e.g., voucher systems) or by using subsidies rather than direct provision.
- The conclusion: government support is not always the best option; a mixed approach is often optimal.
Key Takeaways
- Merit goods are under-consumed due to information failure and have positive externalities.
- Government intervention can correct this but is not always efficient.
- The decision to support should consider the type of good, the extent of market failure, and the risk of government failure.
- A balanced, case-by-case approach is more effective than a blanket policy.
Common Mistakes
- Writing a one-sided answer: this loses all evaluation marks. You must discuss both pros and cons.
- Not reaching a conclusion: the top band requires a justified conclusion. A summary without judgement is insufficient.
- Being too vague: use specific examples from education and healthcare.
- Ignoring the word "always": you need to address whether it is always justified, not just discuss general pros and cons.
- Confusing merit goods with public goods: merit goods are rival and excludable but under-consumed; public goods are non-rival and non-excludable.
Things to Be Careful About
- Clearly define merit goods at the start.
- Use economic terminology: information failure, positive externalities, social optimum, government failure, opportunity cost.
- Ensure the essay is well-organised with clear paragraphs.
- In the evaluation, make a clear judgement: "not always" is a valid position, but you must explain why.
- Avoid making unsupported claims; back up arguments with reasoning and examples.
With the help of a diagram, explain the impact of introducing an effective minimum price for a product and consider the effect on the consumer surplus for that product.
Answer
AO1: Diagram and knowledge
A minimum price is a legally imposed price floor set above the free-market equilibrium. The diagram below shows a market for a product.
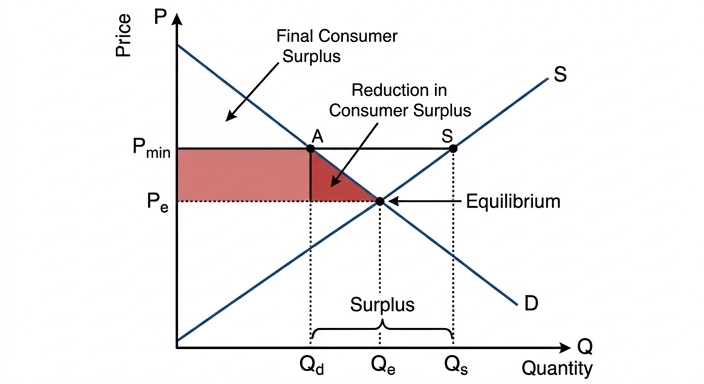
The diagram shows the demand curve (D) and supply curve (S) intersecting at equilibrium price Pe and quantity Qe. The government sets a minimum price Pmin above Pe. At Pmin, quantity demanded falls to Qd and quantity supplied rises to Qs, creating a surplus of Qs - Qd.
AO2: Analysis of consumer surplus
Consumer surplus is the difference between the maximum price consumers are willing to pay and the actual price they pay, measured as the area below the demand curve and above the price. Initially, consumer surplus is the triangle above Pe and below D up to Qe. After the minimum price, consumer surplus is the smaller triangle above Pmin and below D up to Qd. Consumer surplus falls because consumers pay a higher price and also consume fewer units. The loss in consumer surplus is the area between Pe and Pmin for the Qd units still bought, plus the area above Pe for the Qe - Qd units no longer purchased.
AO3: Evaluation
Overall, consumer surplus falls. However, the extent of the fall depends on the price elasticity of demand (PED). If demand is inelastic, the fall in quantity demanded is small, so the loss is mainly from the higher price on the units still bought. If demand is elastic, the quantity fall is larger, increasing the loss from lost consumption. Therefore, while consumer surplus definitely falls, the magnitude varies with PED.
Conclusion: The introduction of an effective minimum price reduces consumer surplus, but the size of the reduction is influenced by the price elasticity of demand.
Consumer surplus falls, but the extent depends on the price elasticity of demand.
Background Concept
A minimum price (price floor) is a government-imposed lower limit on the price of a good or service. To be effective, it must be set above the free-market equilibrium price. This creates a surplus because quantity supplied exceeds quantity demanded. Consumer surplus is the net benefit consumers receive from purchasing a good, measured as the area between the demand curve and the market price. When the price rises due to a minimum price, consumer surplus falls because consumers pay more and buy less.
Understanding the Question
The question asks you to explain the impact of an effective minimum price on consumer surplus, using a diagram, and to consider the extent of the effect. It is point-based, with marks allocated for knowledge (diagram), analysis (explaining the change in consumer surplus), and evaluation (considering factors that affect the size of the change). The command word "explain" requires a clear chain of reasoning, and "consider" requires a short evaluative comment.
Approach
First, draw a standard demand and supply diagram with the minimum price above equilibrium. Label all axes, curves, and key points. Then define consumer surplus and show the initial and new areas on the diagram. Explain why consumer surplus falls: higher price and lower quantity. Finally, evaluate the extent of the fall by discussing the role of price elasticity of demand (PED). Conclude with a justified statement.
Step-by-Step Reasoning
-
Draw the diagram: Draw a downward-sloping demand curve (D) and an upward-sloping supply curve (S). Mark the equilibrium price (Pe) and quantity (Qe). Draw a horizontal line at the minimum price (Pmin) above Pe. At Pmin, the quantity demanded is Qd (where Pmin meets D) and quantity supplied is Qs (where Pmin meets S). The surplus is Qs - Qd.
-
Define consumer surplus: Consumer surplus is the area below the demand curve and above the price paid. Initially, it is the triangle with vertices at the price intercept of D, Pe, and Qe.
-
Show the change: After the minimum price, consumer surplus is the triangle above Pmin and below D up to Qd. The loss consists of two parts: a rectangle (the extra payment on the Qd units still bought) and a triangle (the surplus lost on the Qe - Qd units no longer bought).
-
Explain why it falls: Consumers pay a higher price for each unit they still buy, and they buy fewer units overall. Both effects reduce consumer surplus.
-
Evaluate the extent: The size of the fall depends on PED. If demand is inelastic (PED < 1), the quantity fall is small, so the loss is mainly from the higher price on the units still bought. If demand is elastic (PED > 1), the quantity fall is larger, so the loss from lost consumption is more significant. Thus, the reduction in consumer surplus is greater when demand is elastic.
-
Conclusion: Consumer surplus definitely falls, but the magnitude varies with PED.
Key Takeaways
- An effective minimum price creates a surplus and reduces consumer surplus.
- Consumer surplus falls due to higher price and lower quantity.
- The extent of the fall depends on the price elasticity of demand.
- Always label diagrams fully and explain the changes clearly.
Common Mistakes
- Drawing the minimum price below equilibrium (ineffective).
- Not labelling axes, curves, or equilibrium points.
- Confusing consumer surplus with producer surplus.
- Failing to show the change in consumer surplus on the diagram.
- Not evaluating the extent of the fall (e.g., ignoring PED).
- Providing a one-sided answer without a conclusion.
Things to Be Careful About
- Ensure the minimum price is clearly above equilibrium.
- Label the demand and supply curves, axes (price and quantity), and all relevant points (Pe, Qe, Pmin, Qd, Qs).
- Clearly indicate the initial and new consumer surplus areas.
- Use the term "price elasticity of demand" correctly.
- Reserve one mark for a justified conclusion, so include a short concluding sentence.
Assess whether a minimum wage policy is the best way to redistribute income in an economy.
Introduction
A minimum wage is a legally imposed floor on the wage rate, set above the market-clearing wage. Redistributing income aims to reduce inequality by increasing the incomes of the lowest-paid. This essay assesses whether a minimum wage is the best policy for this purpose, comparing it with alternatives such as transfer payments and progressive taxation.
Benefits of a minimum wage for redistribution
A minimum wage directly raises the earnings of low-paid workers, potentially lifting them out of poverty. It can also incentivise labour market participation, as work becomes more attractive relative to benefits. By transferring income from employers (who may have to accept lower profits) to workers, it can reduce income inequality without requiring government expenditure. For example, in the UK, the National Minimum Wage has been credited with reducing wage inequality at the bottom.
Drawbacks of a minimum wage
However, a minimum wage may cause unemployment if the labour market is competitive: employers hire fewer workers at the higher wage, so some low-skilled workers lose their jobs and income. It can also fuel cost-push inflation if firms pass on higher labour costs, eroding the real value of the wage increase. Moreover, higher-paid workers may maintain wage differentials, so overall inequality may not fall. Enforcement can be difficult, especially in informal sectors. Thus, the net redistributive effect is uncertain.
Comparison with alternative policies
Transfer payments, such as means-tested benefits or universal basic income, directly target the poorest without distorting labour markets. They are more precisely targeted and avoid unemployment effects. However, they require government funding (from taxation) and may create disincentives to work if benefits are withdrawn too quickly. Progressive income taxation can fund redistribution by taxing the rich more, but it may discourage work and investment, and tax evasion can limit its effectiveness. State provision of essential services (health, education) also redistributes in kind but does not directly increase cash incomes.
Evaluation
The minimum wage has the advantage of being self-financing (paid by employers) and directly boosting wages, but its effectiveness is limited by potential job losses and inflation. Transfer payments are more targeted and avoid labour market distortions, but they are costly and may reduce work incentives. Progressive taxation can fund redistribution but may harm economic efficiency. The best policy depends on the specific context: in a labour market with low unemployment and strong enforcement, a minimum wage can be effective; where unemployment is high, transfer payments may be preferable. No single policy is universally best; a combination is often most effective.
Conclusion
A minimum wage policy can contribute to income redistribution, but it is not necessarily the best way. Transfer payments are more targeted and avoid unemployment risks, while progressive taxation can fund redistribution. The optimal approach depends on the economy's circumstances, and a mix of policies is likely to be most effective.
A minimum wage policy can help redistribute income but is not necessarily the best; transfer payments are more targeted and may be more effective, though they also have drawbacks.
Background Concept
A minimum wage is a price floor in the labour market, set above the equilibrium wage. It aims to ensure workers receive a 'living wage'. Income redistribution refers to policies that reduce inequality by transferring income from higher-income groups to lower-income groups. Common policies include minimum wage laws, transfer payments (e.g., welfare benefits), progressive taxation (higher tax rates on higher incomes), and state provision of essential goods and services (e.g., free healthcare).
Understanding the Question
The question asks you to assess whether a minimum wage policy is the best way to redistribute income. This is a levels-marked essay (12 marks) requiring analysis of both advantages and disadvantages of the minimum wage, comparison with at least one alternative policy, and a justified conclusion. The command word 'assess' demands evaluation. A one-sided response will score zero for evaluation. The top band requires detailed knowledge, developed analysis, and a well-supported conclusion.
Approach
First, define the minimum wage and the goal of redistribution. Then present the case for the minimum wage: it raises low wages, incentivises work, and is self-financing. Then present the case against: it may cause unemployment, inflation, and may not reduce inequality if differentials are maintained. Next, compare with at least one alternative, such as transfer payments (targeted but costly) or progressive taxation (funds redistribution but may distort incentives). Finally, evaluate the relative merits and reach a justified conclusion, considering context (e.g., labour market conditions).
Step-by-Step Reasoning
-
Define key terms: Minimum wage is a legal minimum hourly pay. Redistribution aims to reduce income inequality.
-
Benefits of minimum wage:
- Raises incomes of low-paid workers directly.
- Encourages labour market participation (makes work pay).
- Shifts income from employers to workers without direct government cost.
- Example: UK National Minimum Wage reduced wage inequality at the bottom.
-
Drawbacks of minimum wage:
- May cause unemployment if labour demand is elastic (employers hire fewer workers).
- Can lead to cost-push inflation, eroding real wage gains.
- Higher-paid workers may demand higher wages to maintain differentials, so overall inequality may not fall.
- Difficult to enforce in informal sectors.
-
Comparison with alternatives:
- Transfer payments: Means-tested benefits directly target the poor, avoid labour market distortions, but require tax funding and may create work disincentives (poverty trap).
- Progressive taxation: Taxes higher incomes more, funds redistribution, but may discourage work and investment, and tax evasion can limit effectiveness.
- State provision: Provides essential services (health, education) in kind, reduces inequality of access, but does not directly increase cash incomes.
-
Evaluation:
- Minimum wage is self-financing but has unintended consequences (unemployment, inflation).
- Transfer payments are more targeted but costly and may reduce work incentives.
- Progressive taxation can fund redistribution but may harm economic efficiency.
- The best policy depends on context: in a strong labour market with low unemployment, minimum wage may work well; in a weak labour market, transfer payments may be better. A combination of policies is often most effective.
-
Conclusion: Minimum wage is not necessarily the best; transfer payments are more targeted, but each policy has trade-offs. The optimal approach depends on the economy's specific circumstances.
Key Takeaways
- A minimum wage has both benefits and drawbacks for income redistribution.
- It must be compared with at least one alternative policy.
- Evaluation requires a balanced discussion and a justified conclusion.
- Context matters: no single policy is universally best.
Common Mistakes
- Writing a one-sided answer (only benefits or only drawbacks) – loses all evaluation marks.
- Failing to compare with another policy – the mark scheme explicitly requires this.
- Providing a vague conclusion (e.g., 'it depends') without stating what it depends on or which policy is better under which conditions.
- Not defining key terms or using economic terminology.
- Listing points without developing explanations (e.g., 'minimum wage causes unemployment' without explaining why).
- Ignoring the specific question about redistribution (e.g., discussing general effects of minimum wage without linking to inequality).
Things to Be Careful About
- Ensure the essay is balanced: give equal weight to advantages and disadvantages.
- Explicitly compare the minimum wage with at least one alternative policy.
- Reach a clear, justified conclusion that answers the question (is it the best? why or why not?).
- Use economic concepts such as labour demand elasticity, cost-push inflation, and the poverty trap.
- Organise the essay logically: introduction, benefits, drawbacks, comparison, evaluation, conclusion.
Explain why expenditure on education and training is a supply-side policy and consider why its impact on the general price level may differ between the short run and the long run.
Answer
Supply-side policy aims to increase the economy's productive capacity by shifting the LRAS curve to the right. Expenditure on education and training is a supply-side policy because it improves the quality of labour, raising productivity and increasing the economy's potential output, which shifts the LRAS curve rightwards.
In the short run, the government spending itself is a component of AD (G). Increased expenditure on education and training directly raises aggregate demand. If the economy is near full capacity, this increase in AD will cause the price level to rise (demand-pull inflation).
In the long run, the improved productivity and increased productive capacity shift the LRAS curve to the right. For any given level of AD, this increase in AS puts downward pressure on the general price level, potentially reducing it.
Evaluation: Whether the impact on the price level differs depends on the effectiveness of the spending. If the training is ineffective and does not raise productivity, the LRAS will not shift rightwards. In this case, the only effect is the short-run increase in AD, which will simply raise the price level. Furthermore, time lags mean the long-run supply-side benefits take years to materialise, so the short-run inflationary pressure may dominate for a considerable period. Therefore, the impact on the price level is likely to differ between the short run and the long run, but this depends on the policy's success in raising productivity.
Expenditure on education and training is a supply-side policy because it aims to increase LRAS. Its impact on the price level differs between the short run (inflationary via AD) and the long run (disinflationary via AS), but this depends on the policy's effectiveness and time lags.
Background Concept
Supply-side policy refers to government measures designed to increase the productive capacity of the economy, shifting the Long-Run Aggregate Supply (LRAS) curve to the right. This is distinct from demand-side policies (fiscal and monetary) which target Aggregate Demand (AD). The key mechanism is that by improving the quantity or quality of factors of production (land, labour, capital, enterprise), the economy can produce more real output at any given price level.
Education and training are classic supply-side tools because they enhance human capital. A more skilled, productive workforce can produce more output per worker, increasing the economy's potential output. This is represented by a rightward shift of the LRAS curve.
However, government spending on education and training is also a component of Aggregate Demand (G in AD = C + I + G + (X-M)). Therefore, in the short run, this spending directly increases AD. The overall impact on the price level depends on the relative strength and timing of these two effects.
Understanding the Question
This question has two distinct parts linked by the word "and consider". The first part asks you to "explain why" expenditure on education and training is a supply-side policy. This requires defining supply-side policy and linking the specific expenditure to its intended effect on LRAS. The second part asks you to "consider why its impact on the general price level may differ between the short run and the long run". This requires you to analyse the dual effect of the policy: a short-run demand-side effect and a long-run supply-side effect. The command word "consider" signals that a short evaluative judgement is required (AO3), worth up to 2 marks. The question is point-based, so you need to deliver discrete, creditable points for each assessment objective.
Approach
- AO1 (Knowledge): Define supply-side policy and state its goal of shifting LRAS. Explain how education and training increase productivity and productive capacity.
- AO2 (Analysis): Build two separate chains of reasoning.
- Short run: Government spending increases AD -> if the economy is at or near full capacity, this causes demand-pull inflation -> price level rises.
- Long run: Improved productivity shifts LRAS right -> for any given AD, this creates a surplus of goods -> downward pressure on the price level -> price level falls or rises less.
- AO3 (Evaluation): Provide a short, justified judgement. The mark scheme reserves 1 mark for a justified conclusion. Discuss conditions under which the long-run effect might not materialise (ineffective spending, time lags). Conclude that the impact is likely to differ, but this is conditional.
Step-by-Step Reasoning
Step 1: Why is it a supply-side policy? (AO1)
- Start with the definition: Supply-side policies are government measures designed to increase the productive capacity of the economy, shifting the LRAS curve to the right.
- Link to the specific policy: Expenditure on education and training improves the quality of labour (human capital). More skilled workers are more productive, meaning they can produce more output per hour. This increases the economy's potential output, which is represented by a rightward shift of the LRAS curve. Therefore, it is a supply-side policy.
Step 2: Short-run impact on the price level (AO2)
- The government spending itself is an injection into the circular flow of income. It directly increases the G component of Aggregate Demand (AD = C + I + G + (X-M)).
- This causes the AD curve to shift to the right.
- If the economy is operating near its full capacity (on or close to the LRAS), this increase in AD will lead to a higher price level as firms bid up prices for scarce resources. This is demand-pull inflation.
- Therefore, in the short run, the policy is likely to be inflationary, raising the general price level.
Step 3: Long-run impact on the price level (AO2)
- Over time, the improved skills and productivity from the education and training take effect.
- The economy's productive capacity increases. This is shown by a rightward shift of the LRAS curve.
- For any given level of Aggregate Demand, an increase in Aggregate Supply means the economy can produce more real output at a lower average price level.
- This creates a surplus of goods and services, putting downward pressure on the general price level. The price level may fall (deflation) or, more realistically, the rate of inflation may decrease (disinflation).
- Therefore, in the long run, the policy is disinflationary or deflationary, lowering the general price level.
Step 4: Evaluation and Conclusion (AO3)
- The question asks you to "consider why" the impact may differ. The core reason is the time lag between the demand-side and supply-side effects.
- Condition 1: Effectiveness. The long-run supply-side effect is contingent on the spending being effective. If the education and training programmes are poorly designed, do not match the skills needed by the economy, or are not taken up by workers, productivity may not increase. In this case, the LRAS does not shift, and the only effect is the short-run inflationary pressure from increased AD. The impact would not differ; it would simply be inflationary.
- Condition 2: Time Lags. Supply-side policies take a long time to have an effect. It takes years for a student to complete their education and enter the workforce. During this time, the short-run AD effect dominates, and the economy may experience inflation. The long-run benefits are delayed.
- Conclusion: The impact on the price level is likely to differ between the short run and the long run because the short-run effect is on AD (inflationary) and the long-run effect is on AS (disinflationary). However, this difference depends critically on the effectiveness of the policy and the length of the time lags involved. If the policy fails to raise productivity, the long-run disinflationary effect will not occur.
Key Takeaways
- Supply-side policy is defined by its effect on LRAS, not by the specific tool used.
- Government spending always has a dual effect: it is both a component of AD and can be a tool to increase AS.
- The time period is crucial in macroeconomics. The same policy can have opposite effects in the short run and the long run.
- Evaluation in economics often involves identifying the conditions under which a theoretical outcome will or will not occur (e.g., effectiveness, time lags).
Common Mistakes
- Failing to define supply-side policy: Simply stating that education is a supply-side policy without explaining why (its effect on LRAS) loses AO1 marks.
- Ignoring the short-run AD effect: Many students jump straight to the long-run AS effect and forget that the spending itself is an injection into AD. This loses AO2 marks.
- One-sided evaluation: The question asks you to "consider why" the impact may differ. A simple statement that "it lowers prices in the long run" is not evaluation. You must discuss the conditions (effectiveness, time lags) that could make the impact the same or different.
- No conclusion: The mark scheme explicitly reserves 1 mark for a justified conclusion. Failing to provide one caps the AO3 mark at 1.
Things to Be Careful About
- Distinguish between SRAS and LRAS: The short-run effect is on AD, which interacts with SRAS. The long-run effect is on LRAS. Be precise in your language.
- Use the correct diagram language: While a diagram is not explicitly required here, you should be able to describe the AD/AS shifts clearly in words. If you were to draw one, you would show AD shifting right (short run) and LRAS shifting right (long run).
- The word "consider": This is a command word that requires a short judgement. It is not a full "discuss" or "assess", but it is more than just "explain". You must weigh the two effects and reach a conclusion.
Introduction
Inflation is a sustained increase in the general price level. The question asks whether its consequences are always negative. While inflation is widely feared, a balanced analysis reveals both significant costs and potential benefits, meaning the net effect depends on its rate, predictability, and the state of the economy.
Negative Consequences of Inflation
High or unpredictable inflation imposes several costs. First, it reduces the real value of money, harming those on fixed incomes, such as pensioners, and redistributing income from savers to borrowers. Second, it creates uncertainty for firms, making long-term investment planning difficult and potentially reducing capital formation and economic growth. Third, it leads to 'menu costs' (the cost of changing prices) and 'shoe-leather costs' (the cost of holding less cash to avoid the inflation tax). Fourth, if domestic inflation is higher than abroad, exports become less competitive, worsening the current account of the balance of payments. These costs are particularly severe when inflation is high and unanticipated.
Positive Consequences of Inflation
However, moderate and anticipated inflation can have positive effects. It can reduce the real burden of debt, benefiting borrowers, including firms and homeowners with mortgages. This can stimulate consumption and investment. Furthermore, in a recession with sticky wages, a little inflation can help to reduce real wages, allowing firms to hire more workers without cutting nominal pay, thus reducing unemployment. Finally, a low, steady rate of inflation is often seen as a sign of a healthy, growing economy, as it is associated with strong demand.
Evaluation
The statement that consequences are 'always negative' is an absolute and therefore difficult to defend. The net impact depends critically on the rate and predictability of inflation. Very high, hyperinflation is almost universally destructive. However, low, stable, and anticipated inflation (e.g., 2%) is widely considered by central banks to be a desirable target, as its costs are minimal and it may help to 'grease the wheels' of the labour market. The key distinction is between anticipated and unanticipated inflation. Anticipated inflation allows agents to adjust their behaviour (e.g., index-linked contracts), minimising the redistributive costs. Unanticipated inflation is far more damaging.
Conclusion
The consequences of inflation are not always negative. While high and unpredictable inflation imposes significant economic and social costs, low, stable, and anticipated inflation can have some benefits and is a common policy target. Therefore, the statement is false; the consequences depend on the nature of the inflation itself.
The consequences of inflation are not always negative. While high and unanticipated inflation has severe costs, low, stable, and anticipated inflation can have some benefits and is a common policy target. The net effect depends on the rate, predictability, and state of the economy.
Background Concept
Inflation is defined as a sustained increase in the general price level of goods and services in an economy over a period of time. When the price level rises, each unit of currency buys fewer goods and services; consequently, inflation reflects a reduction in the purchasing power per unit of money. It is important to distinguish between different types of inflation: demand-pull (caused by excess AD), cost-push (caused by rising costs of production), and the distinction between anticipated and unanticipated inflation. The consequences of inflation are not uniform; they vary dramatically based on the rate (creeping, walking, galloping, hyperinflation), its predictability, and the institutional framework (e.g., whether wages and contracts are indexed).
Understanding the Question
This is a 12-mark, levels-marked essay part (AO1/AO2 out of 8, AO3 out of 4). The command word is "Assess whether", which requires a two-sided analysis and a justified conclusion. The question contains an absolute claim: "always negative". The core of a strong answer is to challenge this absolute by showing that the consequences depend on the type and context of inflation. The top band (Level 3 for AO1/AO2 and Level 2 for AO3) requires a detailed, developed, and balanced analysis with a justified conclusion. A one-sided response (only listing negatives) cannot score any marks for evaluation (AO3).
Approach
- Introduction: Define inflation and state the essay's purpose: to challenge the absolute claim by examining both negative and positive consequences.
- First Side (Negatives): Develop a chain of reasoning for the main costs: redistribution of income/wealth, uncertainty and reduced investment, menu/shoe-leather costs, and loss of international competitiveness. Use specific examples (e.g., pensioners, firms).
- Second Side (Positives): Develop a chain of reasoning for the potential benefits: reduction of real debt burden, 'greasing the wheels' of the labour market (reducing real wages without nominal cuts), and the signal of a healthy economy.
- Evaluation: This is the most important section. Weigh the two sides against each other. The key evaluative criterion is the rate and predictability of inflation. Distinguish between anticipated and unanticipated inflation. Argue that low, stable, anticipated inflation (e.g., 2% target) has minimal costs and some benefits, while high, volatile, unanticipated inflation is destructive. This directly addresses the "always" in the question.
- Conclusion: Provide a clear, justified judgement that answers the question directly. Conclude that the consequences are not always negative.
Step-by-Step Reasoning
Step 1: Introduction
- Define inflation: a sustained increase in the general price level.
- State the essay's thesis: The claim that consequences are "always negative" is an oversimplification. The net impact depends on the rate, predictability, and economic context.
Step 2: The Case for Negative Consequences (AO2)
- Redistribution of Income and Wealth: Inflation acts as a regressive tax. Those on fixed incomes (pensioners) and savers see the real value of their income and savings eroded. Borrowers benefit as the real value of their debt falls. This arbitrary redistribution is often seen as unfair and can increase inequality.
- Uncertainty and Reduced Investment: High and unpredictable inflation creates uncertainty about future costs and revenues. Firms find it difficult to make long-term investment plans, leading to lower capital formation and slower economic growth.
- Menu Costs and Shoe-Leather Costs: Firms incur 'menu costs' from the physical act of changing prices (printing new menus, updating software). Individuals incur 'shoe-leather costs' by reducing their cash holdings to avoid the inflation tax, requiring more frequent trips to the bank.
- Loss of International Competitiveness: If a country's inflation rate is higher than its trading partners', its exports become relatively more expensive and imports become cheaper. This worsens the current account of the balance of payments.
Step 3: The Case for Positive Consequences (AO2)
- Reduction of Real Debt Burden: Inflation reduces the real value of debt. This can be beneficial for borrowers, including the government (reducing the real value of the national debt), firms (encouraging investment), and homeowners (making mortgages more manageable). This can stimulate aggregate demand.
- 'Greasing the Wheels' of the Labour Market: In a recession, nominal wages are often 'sticky downwards' (workers resist nominal pay cuts). A little inflation allows firms to reduce real wages without cutting nominal pay, making it cheaper to hire workers and reducing unemployment. This is a key argument for a positive inflation target.
- Signal of a Healthy Economy: Very low inflation or deflation is often associated with weak demand and recession. A moderate, positive rate of inflation is often seen as a sign of a growing economy with strong consumer demand.
Step 4: Evaluation (AO3)
- The Key Criterion: Rate and Predictability. The most important distinction is between anticipated and unanticipated inflation. If inflation is low and stable (e.g., 2%), it can be anticipated. Contracts can be indexed, and nominal interest rates can be set to include an inflation premium. In this case, the costs (menu, shoe-leather) are minimal, and the benefits (reducing real debt, greasing the labour market) can be realised. This is why many central banks target a low, positive rate of inflation.
- The Counter-Argument: High and volatile inflation (e.g., 10%+) is almost always negative. It is difficult to anticipate, leading to massive redistribution, severe uncertainty, and the breakdown of the price mechanism. Hyperinflation is catastrophic.
- Stakeholder Analysis: The consequences also depend on who you are. Borrowers benefit, savers lose. Workers with strong unions may be able to protect their real wages, while those without are harmed. Exporters are harmed by high domestic inflation.
- Weighing the Arguments: The statement says "always negative". This is an absolute. The existence of a scenario where inflation has net benefits (low, stable, anticipated) is sufficient to disprove the absolute claim. The costs of high, unanticipated inflation are severe, but they are not the only type of inflation.
Step 5: Conclusion
- Provide a clear, justified judgement. State that the consequences of inflation are not always negative. The net effect depends on the rate, predictability, and economic context. Low, stable, anticipated inflation can have net benefits, while high, unanticipated inflation is overwhelmingly negative. Therefore, the statement is false.
Key Takeaways
- Challenge Absolutes: When a question uses words like "always", "never", or "only", the core of your answer should be to challenge that absolute by identifying exceptions and conditions.
- Two-Sided Analysis is Mandatory: For any "assess", "discuss", or "evaluate" question, you must develop both sides of the argument. A one-sided answer cannot score top marks.
- The Conclusion Must be Justified: A conclusion is not a summary. It is a judgement that answers the specific question and is supported by the analysis and evaluation that precedes it.
- Distinguish Anticipated vs. Unanticipated: This is a crucial evaluative tool for any question on the consequences of inflation.
Common Mistakes
- One-Sided Answer: Only listing the negative consequences of inflation. This forfeits all AO3 marks and caps the AO1/AO2 mark at Level 2.
- No Conclusion or a Vague Conclusion: Ending with "It depends" without saying what it depends on and what the final judgement is. This loses the top AO3 band.
- Descriptive Rather than Analytical: Simply listing consequences (e.g., "inflation causes menu costs") without explaining the chain of reasoning (e.g., "menu costs are the costs to firms of changing prices, which diverts resources away from productive activities, reducing efficiency and profits").
- Ignoring the Absolute: Failing to address the word "always" in the question. The essay must explicitly argue that the consequences are not always negative.
Things to Be Careful About
- Structure: Use clear paragraphs or sub-headings to organise your essay. A well-structured response is a requirement for the top band.
- Depth over Breadth: It is better to develop 2-3 consequences on each side in detail than to list 5-6 consequences superficially.
- Economic Terminology: Use precise terms like "real wages", "purchasing power", "current account", "menu costs", "shoe-leather costs", "anticipated inflation".
- Real-World Examples: While not always required, a brief example (e.g., Zimbabwe's hyperinflation, the UK's 2% inflation target) can strengthen your explanation and show application.
With the help of a formula, explain the causes of an improvement in the terms of trade in an economy and consider whether such an improvement can ever be harmful to an economy.
Answer
AO1 Knowledge and understanding
The terms of trade (ToT) are measured by the ratio:
ToT = (Index of export prices / Index of import prices) x 100
An improvement in the terms of trade occurs when this ratio increases. This happens when export prices rise relative to import prices, or when import prices fall relative to export prices.
AO2 Analysis
An improvement in the terms of trade is generally seen as beneficial because a given volume of exports can now purchase a larger volume of imports. This raises the real income of the economy, as consumers and firms can buy more foreign goods and capital equipment for the same export effort. This can increase living standards and boost productive capacity.
However, an improvement caused by a rise in export prices may reduce the international competitiveness of the country's exports. If demand for exports is price elastic, the quantity of exports demanded may fall significantly, leading to a reduction in export revenue. This could worsen the current account of the balance of payments, which would be harmful.
AO3 Evaluation
Whether an improvement is harmful depends on its cause. If it results from a fall in import prices (e.g. due to a fall in world commodity prices), it is almost certainly beneficial. If it results from a rise in export prices driven by strong global demand for the country's unique products (e.g. a resource with inelastic demand), it is also likely beneficial. However, if it results from domestic cost-push inflation making exports more expensive, the loss of competitiveness and potential current account deficit can be harmful. Therefore, an improvement can be harmful, but only under specific conditions.
Conclusion: An improvement in the terms of trade is not always beneficial; it can be harmful when it is caused by a loss of export competitiveness that leads to a fall in export volumes and a deterioration in the current account.
An improvement in the terms of trade can be harmful when it is caused by a rise in export prices due to domestic cost-push inflation, which reduces export competitiveness and can lead to a current account deficit.
Background Concept
The terms of trade (ToT) measure the relative price of a country's exports compared to its imports. It is calculated as:
ToT = (Index of export prices / Index of import prices) x 100
An improvement in the ToT means the ratio has increased. This can happen in two main ways:
- Export prices rise (while import prices stay the same or rise less).
- Import prices fall (while export prices stay the same or fall less).
A higher ToT is often seen as favourable because the country can buy more imports for the same quantity of exports. However, the economic impact depends on why the ToT changed and how the country's export and import markets respond.
Understanding the Question
This is an 8-mark point-based question split across three assessment objectives: AO1 (Knowledge, 3 marks), AO2 (Analysis, 3 marks), and AO3 (Evaluation, 2 marks). The command word is "explain" for the first part and "consider whether" for the second, which introduces the evaluation requirement.
The question asks you to:
- State the formula for the terms of trade and explain what causes an improvement.
- Analyse the economic consequences of such an improvement.
- Evaluate whether an improvement can ever be harmful, reaching a justified conclusion.
The mark scheme explicitly reserves 1 mark for a justified conclusion, so you must end with a clear judgement.
Approach
- AO1: Start by giving the correct formula and defining an improvement. This is straightforward knowledge.
- AO2: Build a chain of reasoning. First, explain the obvious benefit (more imports for same exports). Then, introduce the counter-argument: a rise in export prices can reduce competitiveness and export volumes, potentially harming the current account. Use the concept of price elasticity of demand to strengthen the analysis.
- AO3: Evaluate by distinguishing between different causes of the improvement. A fall in import prices is almost always good. A rise in export prices can be good or bad depending on demand elasticity and the reason for the price rise. Conclude with a clear, justified statement.
Step-by-Step Reasoning
Step 1: The Formula (AO1)
The terms of trade formula is:
ToT = (Index of export prices / Index of import prices) x 100
An improvement means this ratio increases. This occurs when:
- Export prices rise (numerator increases)
- Import prices fall (denominator decreases)
- Or a combination of both.
Step 2: The Beneficial Effect (AO2)
If a country's ToT improves, it can buy more imports with the same volume of exports. For example, if export prices rise by 10% and import prices stay the same, the country can now buy 10% more imports for the same export quantity. This increases the real income of the economy, allowing higher consumption of foreign goods, cheaper capital equipment for firms, and potentially higher living standards.
Step 3: The Potentially Harmful Effect (AO2)
However, if the improvement is caused by a rise in export prices, the country's exports become more expensive for foreign buyers. If the price elasticity of demand (PED) for exports is elastic (greater than 1), the quantity demanded will fall by a larger percentage than the price rise, leading to a fall in total export revenue. This could worsen the current account of the balance of payments, which is harmful. Additionally, if the price rise is due to domestic inflation, it may signal underlying economic problems.
Step 4: Evaluation (AO3)
The key is to distinguish between the cause of the improvement:
- Improvement due to falling import prices: This is almost always beneficial. It reduces the cost of imported raw materials and finished goods, lowering production costs and increasing consumer purchasing power. There is no downside to this.
- Improvement due to rising export prices: This can be beneficial if demand is price inelastic (e.g., a unique resource like oil or a luxury brand with strong brand loyalty). In this case, export revenue rises. However, it can be harmful if demand is elastic, leading to lost sales and a current account deficit. It can also be harmful if the price rise is caused by domestic cost-push inflation, which erodes competitiveness over time.
Step 5: Conclusion
The conclusion must be justified. The best answer is that an improvement can be harmful, but only under specific conditions (when caused by a loss of competitiveness in elastic export markets). It is not always harmful.
Key Takeaways
- The terms of trade formula is essential knowledge.
- An improvement is not automatically good; its impact depends on the cause and the price elasticity of demand for exports.
- Always distinguish between a change in export prices and a change in import prices when evaluating the impact.
- For point-based questions, structure your answer to clearly hit each AO: knowledge, analysis, and evaluation.
Common Mistakes
- Giving the formula incorrectly: The formula is export prices divided by import prices, not the other way around.
- Confusing an improvement with a deterioration: An improvement is a higher ratio, meaning exports are more valuable relative to imports.
- One-sided analysis: The question explicitly asks you to "consider whether" it can be harmful, so you must discuss both sides. A purely positive answer would lose the evaluation marks.
- No conclusion: The mark scheme reserves 1 mark for a justified conclusion. Omitting it costs a mark.
- Assertion without explanation: Simply stating "it can be harmful" without explaining why (e.g., loss of competitiveness, current account deficit) is not enough for analysis marks.
Things to Be Careful About
- Use the correct formula and define an improvement clearly.
- Build a clear chain of reasoning: cause (change in prices) -> effect on ToT -> effect on export/import volumes -> effect on revenue and current account.
- For the evaluation, explicitly state the condition under which the improvement is harmful (e.g., "when demand for exports is price elastic").
- End with a clear, justified conclusion that directly answers the question.
Assess whether the depreciation of an exchange rate is always beneficial to an economy.
Introduction
A depreciation of the exchange rate occurs when, under a floating exchange rate system, the value of a currency falls relative to other currencies. This makes a country's exports cheaper in foreign currency and imports more expensive in domestic currency. The question asks whether this is always beneficial to an economy. This essay will assess both the potential advantages and disadvantages of a depreciation, and conclude that it is not always beneficial.
The Case for Depreciation Being Beneficial
A depreciation can be beneficial through its impact on the current account and aggregate demand (AD).
When a currency depreciates, exports become cheaper for foreign buyers. Assuming demand for exports is price elastic, the quantity of exports demanded will rise. Simultaneously, imports become more expensive for domestic consumers, leading to a fall in the quantity of imports demanded. This improvement in net exports (X - M) directly increases AD. The increase in AD can boost real GDP, reduce cyclical unemployment, and help close a deflationary gap.
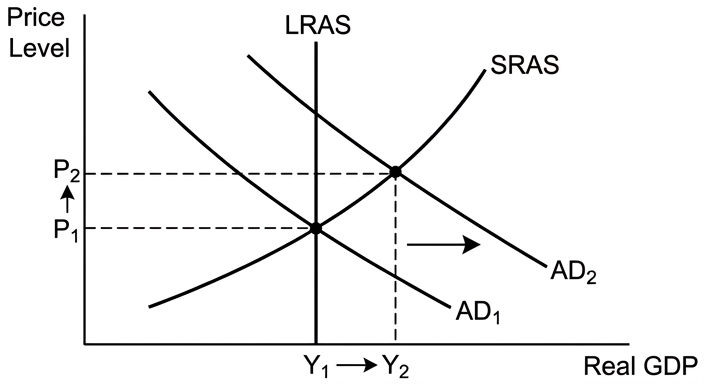
As shown in the AD/AS diagram, a rightward shift of AD from AD1 to AD2 increases the price level from P1 to P2 and real GDP from Y1 to Y2. This is particularly beneficial if the economy is operating below full employment, as it can stimulate growth without causing significant demand-pull inflation.
Furthermore, a depreciation can help correct a current account deficit. By making exports cheaper and imports dearer, the trade balance should improve, reducing the deficit. This can improve the country's international financial position and reduce its reliance on foreign borrowing.
The Case Against Depreciation Being Always Beneficial
A depreciation also carries significant disadvantages.
Firstly, it causes import prices to rise. This directly increases the cost of living for consumers, as imported goods and services become more expensive. More importantly, it raises the cost of imported raw materials, components, and capital goods for domestic firms. This increase in production costs shifts the short-run aggregate supply (SRAS) curve to the left, causing cost-push inflation. This can lead to stagflation — a combination of higher prices and lower output.
Secondly, the improvement in the current account is not guaranteed. It depends on the price elasticity of demand for exports and imports. The Marshall-Lerner condition states that a depreciation will improve the current account only if the sum of the absolute values of PED for exports and imports is greater than 1. If demand is inelastic, the quantity changes will be small, and the higher import prices may actually worsen the current account in the short run (the J-curve effect).
Thirdly, a depreciation can reduce the real income of the economy. If the country relies heavily on imported food and energy, the higher cost of these essentials reduces consumers' real purchasing power, potentially lowering living standards.
Evaluation
The net benefit of a depreciation depends on several factors:
- The state of the economy: If the economy is in a recession with high unemployment, the boost to AD from net exports is likely to be beneficial, and the cost-push inflation may be muted. If the economy is already at full capacity, the depreciation will mainly cause inflation without increasing output.
- The price elasticity of demand: The Marshall-Lerner condition is critical. If PED is high, the current account will improve. If it is low, the depreciation may be harmful.
- The degree of import dependence: An economy heavily dependent on imported raw materials will suffer more from cost-push inflation.
- The time horizon: In the short run, the J-curve effect may cause a deterioration before any improvement occurs.
Conclusion
A depreciation of the exchange rate is not always beneficial to an economy. While it can boost AD and improve the current account under favourable conditions (elastic demand, spare capacity), it can also cause cost-push inflation, reduce real incomes, and fail to improve the trade balance if the Marshall-Lerner condition is not met. The net effect depends on the specific economic circumstances of the country. Therefore, the statement that a depreciation is 'always beneficial' is incorrect.
A depreciation of the exchange rate is not always beneficial. Its net effect depends on factors such as the state of the economy (spare capacity vs. full employment), the price elasticity of demand for exports and imports (the Marshall-Lerner condition), and the degree of import dependence. While it can boost aggregate demand and improve the current account under favourable conditions, it can also cause cost-push inflation and reduce real incomes, making it harmful in other circumstances.
Background Concept
An exchange rate is the price of one currency in terms of another. Under a floating exchange rate system, the rate is determined by the forces of demand and supply for the currency. A depreciation occurs when the currency falls in value, meaning it buys less of a foreign currency.
This has two immediate price effects:
- Exports become cheaper for foreign buyers (because they need less of their own currency to buy the same amount of the depreciated currency).
- Imports become more expensive for domestic buyers (because they need more of the depreciated currency to buy the same amount of foreign currency).
These price changes affect the balance of trade and aggregate demand, but also have supply-side effects through the cost of imported inputs.
Understanding the Question
This is a 12-mark levels-marked essay (AO1+AO2 out of 8, AO3 out of 4). The command word is "Assess whether", which requires a two-sided analysis and a justified conclusion. The question contains the absolute word "always", which is a clear signal that the counter-case is the heart of the essay. A one-sided response cannot gain any marks for evaluation.
The top band for AO1/AO2 requires detailed knowledge, fully developed explanations, and accurate use of analytical tools (here, the AD/AS diagram and the Marshall-Lerner condition). The top band for AO3 requires a justified conclusion with developed, reasoned evaluative comments.
Approach
- Introduction: Define depreciation and state the essay's purpose — to challenge the absolute claim.
- First side (benefits): Develop the chain of reasoning from depreciation -> cheaper exports -> higher export volumes -> higher net exports -> higher AD -> higher GDP and employment. Use an AD/AS diagram to illustrate this.
- Second side (drawbacks): Develop the counter-argument: depreciation -> more expensive imports -> higher production costs -> leftward SRAS shift -> cost-push inflation and lower output. Also discuss the Marshall-Lerner condition and the J-curve effect.
- Evaluation: Weigh the two sides against each other using explicit criteria: state of the economy, PED values, import dependence, and time horizon.
- Conclusion: Deliver a clear, justified judgement that directly answers the question (it is not always beneficial).
Step-by-Step Reasoning
Step 1: Define and Explain the Mechanism
A depreciation means the currency is worth less. For example, if the exchange rate moves from $1 = £0.80 to $1 = £0.70, the pound has depreciated. A UK export that costs £100 now costs $142.86 instead of $125.00 — it is cheaper for US buyers. Conversely, a US import that costs $100 now costs £142.86 instead of £125.00 — it is more expensive for UK buyers.
Step 2: The Beneficial Chain (AO2)
- Cheaper exports -> increase in quantity demanded of exports (assuming elastic demand) -> higher export revenue.
- More expensive imports -> decrease in quantity demanded of imports -> lower import expenditure.
- Net exports (X - M) rise -> AD = C + I + G + (X - M) increases -> AD curve shifts right.
- In an economy with spare capacity, this increases real GDP and reduces unemployment.
- This is shown in the AD/AS diagram: AD shifts right, price level rises slightly, real GDP rises significantly.
Step 3: The Harmful Chain (AO2)
- More expensive imports -> higher cost of imported raw materials, components, and capital goods -> firms' costs of production rise.
- Higher costs -> SRAS curve shifts left (or the SRAS curve becomes steeper).
- This causes cost-push inflation: the price level rises, and real GDP may fall (stagflation).
- Additionally, the higher cost of imported consumer goods directly reduces consumers' real purchasing power, lowering living standards.
- The current account may not improve if demand is inelastic. The Marshall-Lerner condition states that for a depreciation to improve the current account, the sum of the absolute values of PED for exports and imports must be greater than 1. If it is less than 1, the current account worsens.
- In the short run, the J-curve effect may cause the current account to worsen initially before improving, as contracts are fixed and quantities take time to adjust.
Step 4: Evaluation (AO3)
The key is to weigh these competing effects. The evaluation should be structured around criteria:
- State of the economy: If the economy is in a recession with high unemployment and spare capacity, the boost to AD is welcome, and the cost-push inflation may be small. If the economy is at full employment, the depreciation will mainly cause inflation.
- PED values: If exports and imports have elastic demand, the current account will improve. If they are inelastic (e.g., essential food, energy, or unique luxury goods), the depreciation may worsen the trade balance.
- Import dependence: An economy that imports most of its raw materials and food will suffer more from cost-push inflation and reduced real incomes.
- Time horizon: In the short run, the J-curve effect may cause harm. In the long run, if the depreciation leads to improved competitiveness and structural change, it may be beneficial.
Step 5: Conclusion
The conclusion must be justified and directly address the question. The absolute claim "always beneficial" is false. The net effect is conditional on the specific circumstances. A strong conclusion will state this clearly and explain why.
Key Takeaways
- An absolute claim ("always", "never") in an economics question is almost always wrong and requires a two-sided evaluation.
- A depreciation has both demand-side (AD) and supply-side (SRAS) effects. Both must be considered.
- The Marshall-Lerner condition and the J-curve effect are essential analytical tools for evaluating the impact on the current account.
- The AD/AS diagram is a powerful tool for illustrating the macroeconomic effects of a depreciation.
- A justified conclusion must state a clear judgement and the reasons for it.
Common Mistakes
- One-sided answer: Only discussing the benefits (cheaper exports, higher AD) and ignoring the costs (cost-push inflation, higher import prices). This loses all evaluation marks.
- No diagram: The top band requires accurate use of analytical tools. An AD/AS diagram is expected and should be fully explained.
- Ignoring the Marshall-Lerner condition: This is a key analytical concept for evaluating the impact on the current account.
- Vague conclusion: A conclusion that just says "it depends" without explaining what it depends on and why is not a justified conclusion.
- Descriptive rather than analytical: Simply describing what a depreciation is, without building a chain of reasoning to its effects, is a Level 1 response.
- Confusing depreciation with devaluation: Depreciation applies to floating exchange rates; devaluation applies to fixed exchange rates. Use the correct term.
Things to Be Careful About
- Use the correct terminology: "depreciation" for floating rates, not "devaluation".
- Label the AD/AS diagram fully: axes (Price Level and Real GDP), curves (AD1, AD2, SRAS, LRAS), and equilibrium points (P1, Y1, P2, Y2).
- Explain the diagram in the text: state which curve shifts, in which direction, and why.
- When discussing the Marshall-Lerner condition, state the condition clearly: |PEDx| + |PEDm| > 1.
- Ensure the conclusion is a judgement, not a summary. It should state whether the depreciation is beneficial or not, and under what conditions.