Economics 9708/22 — May/June 2025
Cambridge AS Level · AS Level Data Response and Essays · worked solutions for every part, with the mark scheme
Topics Exchange Rates · Balance of Payments · International Trade and Comparative Advantage · Supply-Side Policy · Methods of Government Intervention in Markets · Unemployment · +10 more
Can South Africa escape from its economic difficulties?
South Africa has serious economic difficulties. Despite its vast natural resources, the main economic indicators show a country in trouble. As Fig. 1.1 shows, despite a fall over the last year, unemployment remains very high. It is amongst the highest in the world, particularly for young people, and this has led to one of the highest and most persistent levels of income inequality in the world, with a Gini coefficient of 0.67.
Economic growth is amongst the worst in Africa and this, together with high government expenditure, means that the country has had a fiscal deficit of more than 4% of GDP in recent years. Despite falls in the value of South Africa’s currency (rand), the current account of the balance of payments is projected to move to a significant deficit of 2.3% of GDP in 2023 and to deteriorate further to about 2.5% of GDP in 2024. South Africa is also suffering extended power cuts of up to 10 hours per day due to the collapse of the state electricity provider. What can be done?
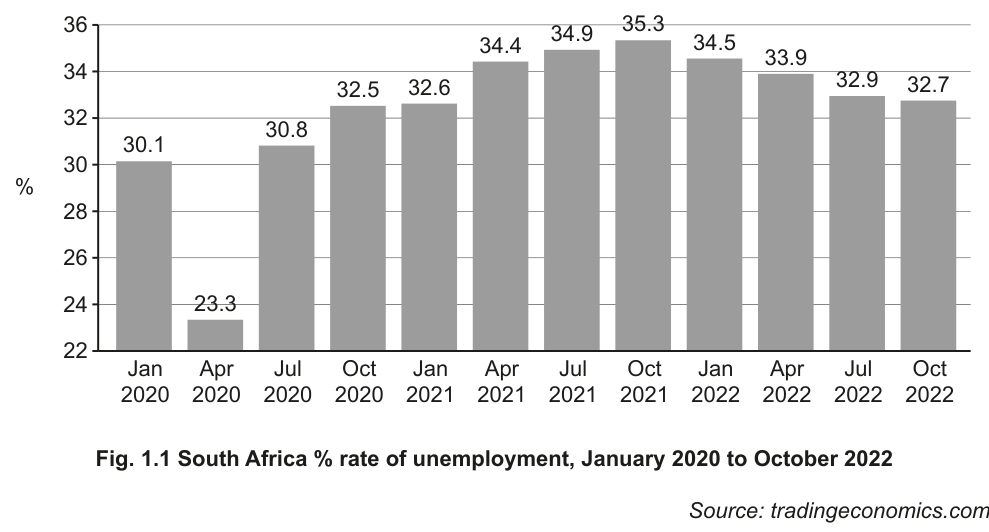
Fig. 1.1 South Africa % rate of unemployment, January 2020 to October 2022
Source: tradingeconomics.com
In a March 2023 statement, the International Monetary Fund (IMF) recommended that the South African government should adopt the following policies:
- Improvements in infrastructure, particularly electricity supplies and transport links. This should be achieved by promoting more private sector investment.
- Encourage more competition within South Africa and free trade with neighbouring countries by reducing protection. Closer links with the African Continental Free Trade Area (AfCFTA) should be established.
- To tackle the very high rates of unemployment and income inequality, a range of policies has been suggested. These include setting the minimum national wage at an appropriate rate to encourage more people back into the workforce. This should be done alongside policies to strengthen employment protection. In addition, other policies include improving levels of education and training and better support for the transition from school to work. Finally, policies to promote entrepreneurship need to be introduced.
However, will these policies help South Africa escape from its economic difficulties?
Sources: adapted from: FocusEconomics article, ‘Will South Africa find a way out of its economic rut?’ and IMF concluding statement concerning South Africa, 22 March 2023
Identify the overall change in the unemployment rate in South Africa between January 2020 and October 2022.
Answer
The overall unemployment rate in South Africa increased between January 2020 and October 2022.
The overall unemployment rate in South Africa increased between January 2020 and October 2022.
Background Concept
Unemployment is a key macroeconomic indicator measuring the percentage of the labour force actively seeking work but unable to find it. Time series data, such as the bar chart in Fig. 1.1, tracks changes in the unemployment rate over time, allowing analysis of overall trends, peaks and troughs in labour market performance.
Understanding the Question
This question asks you to identify the overall change in South Africa's unemployment rate between the first data point (January 2020) and final data point (October 2022) in the provided chart. You do not need to calculate values or describe intermediate fluctuations, only the net change across the entire specified period.
Approach
Compare the value of the first bar (January 2020) and the last bar (October 2022) to determine the overall direction of change, ignoring temporary dips and rises in between.
Step-by-Step Reasoning
The unemployment rate in January 2020 was 30.1%. By October 2022, it had risen to 32.7%. Even with a temporary dip to 23.3% in April 2020 (likely due to COVID-19 lockdowns) and a gradual decline from the October 2021 peak of 35.3%, the net change across the full period is an increase of 2.6 percentage points. The question only asks for the overall change, so the correct response is that the unemployment rate increased overall.
Key Takeaways
When identifying overall trends in time series data, focus only on the start and end points of the specified period, and ignore intermediate fluctuations unless explicitly asked for.
Common Mistakes
A common mistake is describing intermediate fluctuations (e.g. the April 2020 dip or 2021 peak) instead of the overall change across the full period, which will not earn the mark. Another mistake is calculating the exact percentage change, which is not required and will not be credited.
Things to Be Careful About
Always check the exact dates specified: the period is January 2020 to October 2022, so only the first and last data points are relevant for the overall change.
Compare the trend in the unemployment rate in South Africa between January 2020 and January 2022 with that between January 2022 and October 2022.
Answer
Between January 2020 and January 2022, the South African unemployment rate trended upwards, while between January 2022 and October 2022, it trended downwards.
Between January 2020 and January 2022, the unemployment rate trended upwards, while between January 2022 and October 2022, it trended downwards.
Background Concept
Comparing trends across different time periods is a core data analysis skill, allowing economists to identify changes in the direction of a variable over time, rather than just its overall level.
Understanding the Question
This question asks you to compare the trend in South Africa's unemployment rate across two separate periods: January 2020 to January 2022, and January 2022 to October 2022. You must describe the direction of the trend in each period, not just quote individual figures.
Approach
First identify the start and end points of the first period to determine its trend, then do the same for the second period, before comparing the two directions.
Step-by-Step Reasoning
In the first period (Jan 2020 to Jan 2022), the unemployment rate rose from 30.1% to 34.5%, with a peak of 35.3% in October 2021, so the overall trend is upwards. In the second period (Jan 2022 to Oct 2022), the rate fell from 34.5% to 32.7%, so the overall trend is downwards. The only valid comparison is between these two overall trends; referencing intermediate dates or individual months is irrelevant and will not be credited.
Key Takeaways
When comparing trends across periods, define the start and end of each period first, state the direction of change for each, then make the comparison.
Common Mistakes
A common mistake is quoting individual monthly figures without linking them to the overall trend of the period, or comparing the wrong time periods. Another mistake is only describing one period's trend, which will not earn the mark as a comparison is required.
Things to Be Careful About
Ensure you only refer to the two periods specified in the question: January 2020 to January 2022, and January 2022 to October 2022. Do not include intermediate months in your comparison.
Identify one possible impact on firms in South Africa and one possible impact on the government of South Africa of such a high rate of unemployment.
Answer
Impact on firms: High unemployment gives firms a larger pool of available labour, making it easier and cheaper to recruit workers, and may allow them to pay lower wages.
Impact on government: High unemployment reduces income tax revenue and increases spending on welfare benefits, putting pressure on the government budget and worsening the fiscal deficit.
Firms face easier/cheaper recruitment and lower wage costs; the government faces lower tax revenue and higher welfare spending.
Background Concept
High unemployment has widespread consequences for an economy, affecting households, firms and the government. For firms, it changes labour market conditions; for the government, it affects both revenue and expenditure, with knock-on effects for the fiscal budget.
Understanding the Question
This question asks for one impact of high unemployment on firms and one impact on the South African government. You do not need to explain the impacts in detail, just state them clearly.
Approach
Think about how a large pool of unemployed workers affects firms' ability to hire and pay staff, and how reduced employment affects the government's tax income and welfare spending.
Step-by-Step Reasoning
For firms: With high unemployment, there are more job seekers than available vacancies. This gives firms a larger pool of candidates to choose from, reducing the need to offer high wages to attract staff. Alternatively, high unemployment reduces the disposable income of households, leading to weaker demand for firms' products, which reduces sales and profits.
For the government: Unemployed households do not pay income tax, and may pay less indirect tax if they reduce consumption. At the same time, the government has to spend more on welfare benefits (such as unemployment grants) to support households with no earned income. This combination of lower revenue and higher spending reduces the government's tax income, increases the fiscal deficit, and may force the government to borrow more, increasing the national debt.
Key Takeaways
High unemployment creates a dual fiscal pressure on the government: lower revenue from income tax and higher spending on welfare. For firms, it loosens the labour market, reducing recruitment and wage costs, but also reduces consumer demand for their products.
Common Mistakes
A common mistake is giving more than one impact for either firms or the government. The question asks for one impact on each, so extra points will not be credited. Another mistake is giving impacts on households instead of the two specified stakeholders.
Things to Be Careful About
Ensure you clearly link each impact to the correct stakeholder: one point for firms, one for the government. Do not mix up the two, as each is worth a separate mark.
Consider whether continued falls in the value of the South African rand may lead to a reduction in the current account deficit of the balance of payments.
Answer
A fall in the value of the rand makes South African exports relatively cheaper for foreign buyers and imports relatively more expensive for South African residents. This should increase the quantity of exports demanded and reduce the quantity of imports demanded, raising the value of net exports (X-M) and reducing the current account deficit.
However, the size of this effect depends on the price elasticity of demand for exports and imports. If the sum of the absolute value of the price elasticity of demand for exports and imports is less than 1 (the Marshall-Lerner condition is not satisfied), the value of exports will fall and the value of imports will rise, worsening the current account deficit in the short run. Additionally, in the very short run, the J-curve effect means the deficit may initially worsen, as trade volumes take time to adjust to the new prices. Overall, continued rand depreciation will only reduce the current account deficit if the Marshall-Lerner condition is met and sufficient time passes for trade volumes to adjust to the price change.
Continued falls in the rand may reduce the current account deficit only if the Marshall-Lerner condition is satisfied and trade volumes have time to adjust; otherwise the deficit may initially worsen.
Background Concept
The exchange rate is the price of one currency in terms of another. A depreciation of a currency (a fall in its value) affects the relative prices of a country's exports and imports: exports become cheaper for foreign buyers, and imports become more expensive for domestic buyers. The current account of the balance of payments records the value of a country's trade in goods and services, plus net income and transfers, so changes in export and import values directly affect the current account balance. The size of the change in trade volumes following a price change depends on the price elasticity of demand (PED) for exports and imports, and the time period allowed for adjustment.
Understanding the Question
This question asks you to assess whether continued falls in the value of the South African rand (a depreciation) will lead to a reduction in the country's current account deficit. You need to explain the theoretical link between exchange rate depreciation and the current account, then evaluate the conditions under which this link holds, to reach a justified conclusion.
Approach
First, explain the direct effect of a weaker rand on the relative prices of exports and imports. Then, explain how these price changes affect export and import demand, and thus the current account balance. Finally, evaluate the limitations of this relationship, using concepts such as the Marshall-Lerner condition and the J-curve effect, to reach a conclusion on whether the depreciation will actually reduce the deficit.
Step-by-Step Reasoning
Step 1: Effect of rand depreciation on prices
When the rand falls in value against other currencies, South African goods and services become cheaper for foreign buyers, as they need to spend less of their own currency to buy the same South African product. At the same time, foreign goods and services become more expensive for South African buyers, as they need to spend more rands to buy the same foreign product.
Step 2: Effect on trade volumes and the current account
Cheaper exports should increase the quantity of exports demanded by foreign buyers, while more expensive imports should reduce the quantity of imports demanded by South African buyers. If the value of exports rises and the value of imports falls, net exports (X-M) will increase, reducing the current account deficit (or increasing a surplus).
Step 3: Evaluation of the relationship
The size of the change in export and import values depends on the price elasticity of demand for each. The Marshall-Lerner condition states that a depreciation will improve the current account only if the sum of the absolute value of the PED for exports and the PED for imports is greater than 1. If this sum is less than 1, the percentage change in the quantity of exports and imports demanded is smaller than the percentage change in their prices, so the value of exports falls and the value of imports rises, worsening the current account deficit.
Additionally, in the very short run (the first few months after depreciation), trade volumes are slow to adjust, as existing import and export contracts are fulfilled and consumers and firms take time to change their purchasing habits. This leads to the J-curve effect: the current account initially worsens before improving, as the value of imports rises immediately due to higher prices, while export volumes have not yet increased.
For South Africa specifically, if its main exports are primary commodities (such as minerals and agricultural products) with price inelastic demand, the Marshall-Lerner condition may not be met, limiting the improvement in the current account from rand depreciation.
Step 4: Conclusion
Continued falls in the rand will only reduce the current account deficit if the Marshall-Lerner condition is satisfied and enough time passes for trade volumes to adjust to the new prices. If either of these conditions is not met, the deficit may initially worsen, or fail to improve at all.
Key Takeaways
Exchange rate depreciation does not automatically improve the current account balance. Its impact depends on the price elasticity of demand for trade and the time period allowed for adjustment. The Marshall-Lerner condition and J-curve effect are key concepts for evaluating this relationship.
Common Mistakes
A common mistake is assuming that a weaker currency will always improve the current account, without considering the Marshall-Lerner condition or time lags, which loses the evaluation mark. Another mistake is confusing depreciation (a market-led fall in a floating exchange rate) with devaluation (a deliberate reduction in a fixed exchange rate's value). A third mistake is claiming a weaker rand will always reduce import demand, without noting that the value of imports may rise if demand is price inelastic, even if the quantity imported falls.
Things to Be Careful About
Always distinguish between a change in the quantity of trade and a change in the value of trade: a fall in the quantity of imports does not necessarily mean the value of imports falls, if the price increase outweighs the quantity decrease. Also, link the effect of rand depreciation directly to the current account deficit, not just to export or import volumes.
Assess the extent to which closer membership of the AfCFTA may help South Africa to achieve the growth needed to ‘escape from its economic difficulties’.
Answer
Closer membership of the AfCFTA is likely to help South Africa achieve the growth needed to escape its economic difficulties, but its success depends on the country's ability to improve domestic competitiveness.
On the one hand, AfCFTA membership will open up access to a larger regional market of over 1.4 billion consumers, allowing South African firms to increase exports and achieve export-led growth. Increased competition from other African producers will also encourage domestic firms to become more efficient, invest in innovation and lower their costs, which will improve their competitiveness both at home and abroad. This efficiency gain will lead to lower prices and higher-quality products for South African consumers, increasing domestic consumption, while also making South African exports more attractive in global markets. Additionally, closer trade links with the region are likely to attract more foreign direct investment (FDI), bringing in capital, technology and management skills that increase South Africa's productive capacity and long-run growth.
On the other hand, increased trade openness will expose South African domestic firms to greater competition from lower-cost producers in other African countries. Less competitive domestic firms may lose market share, leading to lower output, job losses and even business closures, which could reduce economic growth in the short run. Sectors that were previously protected from foreign competition, such as manufacturing and agriculture, may contract sharply, leading to higher structural unemployment and lower aggregate demand. Additionally, increased imports from other AfCFTA members could widen the current account deficit, putting downward pressure on the rand and increasing the cost of imported inputs for firms, which could reduce their profitability and investment, further slowing growth.
Overall, the benefits of AfCFTA membership for growth are likely to outweigh the costs only if South Africa implements accompanying supply-side policies to improve infrastructure, reduce bureaucracy and raise firm productivity. If domestic firms are able to compete effectively in the larger regional market, the export and FDI gains will drive higher growth, but if competitiveness does not improve, the short-run costs of job losses and a wider current account deficit may offset these gains. Closer AfCFTA membership can help South Africa escape its economic difficulties, but only as part of a broader package of supply-side reforms.
Closer AfCFTA membership can help South Africa achieve growth if accompanied by supply-side policies to improve firm competitiveness, but its net benefit depends on the ability of domestic industries to compete with other African producers.
Background Concept
The African Continental Free Trade Area (AfCFTA) is a regional free trade agreement that aims to reduce tariffs and non-tariff barriers to trade between African countries, creating a single continental market. The theory of comparative advantage suggests that countries can increase their economic welfare and growth by specialising in the production of goods and services in which they have a lower opportunity cost, and trading with other countries for goods in which they have a higher opportunity cost. Free trade allows countries to access larger markets, achieve economies of scale, and benefit from competition that drives efficiency and innovation, all of which can contribute to higher economic growth.
Understanding the Question
This question asks you to assess how much closer membership of the AfCFTA will help South Africa achieve the economic growth needed to escape its existing economic difficulties (high unemployment, inequality, fiscal and current account deficits). You need to evaluate both the potential benefits of AfCFTA membership for growth and the potential drawbacks, then reach a justified conclusion on the extent to which it will help.
Approach
First, outline the theoretical benefits of free trade and regional integration for economic growth, linking these specifically to the AfCFTA and South Africa's context. Then, outline the potential costs and drawbacks of increased trade openness for South Africa's domestic economy and growth. Finally, weigh these two sides against each other, identifying the conditions under which the benefits will outweigh the costs, and reach a justified conclusion.
Step-by-Step Reasoning
Side 1: Benefits of AfCFTA membership for growth
- Access to larger export markets: The AfCFTA creates a market of over 1.4 billion people with a combined GDP of over $3 trillion. South African firms, which already have relatively advanced productive capacity compared to many other African countries, can increase their exports of manufactured goods, services and value-added primary products to this market, driving export-led growth. Higher exports will increase aggregate demand, leading to higher real output and employment, helping to reduce South Africa's high unemployment rate.
- Efficiency gains from competition: Increased competition from firms in other AfCFTA member states will force South African domestic firms to become more efficient to survive. They will invest in cost-reducing technology, improve product quality and reduce waste, leading to lower average costs. These efficiency gains will lower prices for South African consumers, increasing domestic consumption, and make South African exports more competitive in global markets, further boosting export growth.
- Increased foreign direct investment (FDI): Closer regional integration makes South Africa a more attractive location for FDI, as multinational enterprises can use South Africa as a hub to access the entire AfCFTA market. FDI brings in capital, technology and management skills that increase South Africa's productive capacity, shifting the long-run aggregate supply (LRAS) curve to the right and increasing potential output, leading to higher long-run economic growth.
Side 2: Drawbacks of AfCFTA membership for growth - Increased competition for domestic firms: Many South African domestic firms, particularly in the manufacturing and agricultural sectors, are currently protected by tariffs and non-tariff barriers. Removing these barriers will expose them to competition from lower-cost producers in other African countries with lower labour costs and less stringent regulation. Less competitive firms will lose market share, leading to lower output, job losses and business closures, which will reduce aggregate demand and economic growth in the short run.
- Higher structural unemployment: Firms that are forced to close or downsize due to import competition will lay off workers, particularly low-skilled workers who are already disproportionately affected by South Africa's high unemployment rate. This structural unemployment will reduce household incomes and consumer spending, further reducing aggregate demand and growth. It may also lead to higher inequality if job losses are concentrated in low-income regions.
- Worsening current account deficit: Increased imports from other AfCFTA members could widen South Africa's current account deficit, as the value of imports rises faster than the value of exports in the short run. A wider deficit will put downward pressure on the rand, increasing the cost of imported inputs (such as oil and machinery) for South African firms, reducing their profitability and investment, which will slow long-run growth.
Evaluation and Conclusion:
The net impact of AfCFTA membership on South African growth depends on two key factors: the ability of South African firms to compete in the regional market, and the presence of accompanying supply-side policies to support competitiveness. If South Africa implements policies to improve infrastructure (such as the electricity and transport networks mentioned in the IMF statement), reduce red tape and improve education and training, firms will be able to compete effectively, and the benefits of larger export markets, efficiency gains and FDI will outweigh the short-run costs of adjustment. However, if these supporting policies are not implemented, the short-run costs of job losses, higher unemployment and a wider current account deficit may offset the long-run growth gains. Therefore, closer AfCFTA membership can help South Africa escape its economic difficulties, but only as part of a broader package of supply-side reforms.
Key Takeaways
Regional free trade agreements like the AfCFTA can drive economic growth through export-led growth, efficiency gains and FDI, but their benefits depend on the domestic economy's ability to compete. Trade openness creates both winners and losers, and the net impact on growth depends on the presence of policies to support adjustment for negatively affected sectors and workers.
Common Mistakes
A common mistake is writing a one-sided answer that only discusses the benefits or only the drawbacks of AfCFTA membership, which will not earn full marks for evaluation as the question explicitly asks to assess the extent. Another mistake is making generic points about free trade without linking them specifically to South Africa's context (e.g. its high unemployment, existing infrastructure challenges). A third mistake is ending with a summary of both sides instead of a justified conclusion that answers the specific question of how much AfCFTA will help South Africa escape its economic difficulties.
Things to Be Careful About
Ensure your conclusion is justified and specific: do not simply say "it depends", but explain what it depends on (e.g. the presence of supply-side policies) and state which outcome is more likely under different conditions. Also, link all points back to the question's focus on economic growth and escaping economic difficulties, rather than discussing general trade policy.
Assess the extent to which the policies suggested to improve infrastructure and to reduce the high rates of unemployment in South Africa are likely to reduce income inequality.
Answer
The policies suggested to improve infrastructure and reduce high unemployment are likely to reduce income inequality in the long run, but their short-run impact is limited by implementation challenges and the risk of unequal benefit distribution.
On the one hand, these policies can reduce inequality in several ways. Improved transport and electricity infrastructure increases workers' mobility, allowing low-income households in rural or underserved areas to access job opportunities in urban centres, raising their earnings. An appropriately set national minimum wage directly increases the income of low-skilled workers, who are disproportionately likely to be in low-income households, reducing the gap between low and high earners. Strengthened employment protection reduces the risk of job loss for low-income workers, providing them with more stable incomes. Improved education, training and school-to-work support makes low-income households more employable, allowing them to move into higher-paying, more skilled jobs, increasing their lifetime earnings. Finally, policies to promote entrepreneurship allow low-income individuals to start their own businesses, creating additional income streams and reducing reliance on low-wage employment.
On the other hand, these policies have significant limitations in reducing inequality. First, supply-side policies take a long time to implement and have an effect: building new infrastructure, reforming education systems and rolling out training programmes can take years or even decades, so they will not reduce the current high levels of inequality in the short run. Second, the policies are costly to implement, and if the South African government faces budget constraints (as indicated by its existing fiscal deficit), they may be underfunded or withdrawn before they have a meaningful impact. Third, the benefits of these policies may not be distributed equally: for example, a national minimum wage may lead to job losses for the lowest-skilled workers if firms cannot afford to pay the higher wage, worsening inequality for those who are most vulnerable. Improved education and training may benefit those who already have the foundational skills to participate, leaving the most disadvantaged groups behind. If the policies mainly benefit those who are already in work or have higher skills, income inequality may not fall, and could even rise if the costs of the policies (such as higher business costs from the minimum wage) are passed on to low-income consumers through higher prices.
Overall, the suggested policies are likely to reduce income inequality in the long run by increasing employment and raising the earnings of low-income households, but their short-run impact is limited. Their effectiveness also depends on the policies being well-targeted at the most disadvantaged groups, rather than benefiting higher-income households disproportionately. To reduce inequality in the short run, these supply-side policies need to be accompanied by targeted redistributive measures such as welfare transfers and free provision of essential services for low-income households.
The suggested policies are likely to reduce income inequality in the long run by raising employment and low-income earnings, but their short-run impact is limited by implementation lags and unequal benefit distribution, so they need to be accompanied by short-run redistributive measures to be effective.
Background Concept
Income inequality refers to the unequal distribution of income across households in an economy. The Gini coefficient, mentioned in the extract, is a measure of inequality, with 0 representing perfect equality and 1 representing perfect inequality; South Africa's Gini coefficient of 0.67 indicates very high inequality. Supply-side policies are government policies aimed at increasing the productive capacity of the economy, improving the efficiency of markets and increasing the flexibility of labour and product markets. While supply-side policies are often associated with long-run economic growth, they can also affect income inequality by changing employment levels, wage rates and access to opportunities for low-income households.
Understanding the Question
This question asks you to assess how much the policies suggested by the IMF (infrastructure improvements, minimum wage, employment protection, education and training, entrepreneurship support) will reduce South Africa's very high income inequality. You need to evaluate both the potential of these policies to reduce inequality and their limitations, then reach a justified conclusion.
Approach
First, explain how each of the suggested policies can reduce income inequality, linking them to specific mechanisms that raise low-income households' earnings or improve their access to jobs. Then, explain the limitations of these policies in reducing inequality, including time lags, cost constraints and the risk of unequal benefit distribution. Finally, weigh these two sides against each other and reach a conclusion on the extent to which the policies will reduce inequality.
Step-by-Step Reasoning
Side 1: How the policies can reduce income inequality
- Infrastructure improvements (electricity and transport): Better electricity supply reduces business costs and increases productivity, leading to more job creation, particularly in labour-intensive sectors. Improved transport links increase workers' mobility, allowing low-income households in rural or informal settlements to access job opportunities in urban areas where wages are higher. This reduces geographical inequality and raises incomes for the poorest households.
- National minimum wage: Setting an appropriate minimum wage directly raises the earnings of low-skilled workers, who are most likely to be in low-income households. This reduces the gap between the lowest and highest earners, directly reducing income inequality, as long as the minimum wage is set at a level that does not lead to significant job losses.
- Employment protection: Strengthening employment protection reduces the risk of arbitrary dismissal for low-income workers, giving them more job security and stable incomes. This reduces the volatility of low-income households' earnings, reducing inequality and poverty.
- Education, training and school-to-work support: Improving the quality of education and providing training for low-skilled workers makes them more employable, allowing them to access higher-paying skilled jobs. Better support for the transition from school to work reduces youth unemployment, which is particularly high in South Africa, raising the lifetime earnings of young people from low-income backgrounds and reducing intergenerational inequality.
- Entrepreneurship support: Policies to promote entrepreneurship (such as access to finance, business training and reduced red tape) allow low-income individuals to start their own businesses, creating additional income streams and reducing reliance on low-wage formal employment. This can reduce inequality by allowing people to move up the income distribution.
Side 2: Limitations of the policies in reducing inequality - Long implementation time lags: Supply-side policies take a long time to design, implement and have an effect. Building new power stations and transport networks can take 5-10 years or more, while reforming education systems and rolling out national training programmes can take even longer. This means the policies will not reduce South Africa's current high levels of inequality in the short run, when the problem is most urgent.
- Cost constraints: The South African government already has a fiscal deficit of more than 4% of GDP, as noted in the extract. Implementing these policies will require significant public spending, which may be difficult to fund without increasing the deficit further or raising taxes. If the policies are underfunded, they will have little or no impact on inequality.
- Unequal benefit distribution: The benefits of these policies may not reach the most disadvantaged groups. For example, the national minimum wage may lead to job losses for the lowest-skilled workers if firms cannot afford to pay the higher wage, worsening inequality for those who are most vulnerable. Education and training programmes may benefit those who already have the foundational literacy and numeracy skills to participate, leaving the most marginalised groups (such as those in rural areas or with disabilities) behind. If the policies mainly benefit those who are already in work or have higher skills, income inequality may not fall, and could even rise if the costs of the policies (such as higher business costs from the minimum wage) are passed on to low-income consumers through higher prices.
Evaluation and Conclusion:
The suggested supply-side policies have strong potential to reduce income inequality in the long run by increasing employment, raising low-income workers' earnings and improving access to opportunities for disadvantaged groups. However, their short-run impact is limited by long implementation lags and the risk that benefits will not be distributed equally. Their effectiveness also depends on the policies being well-targeted at the most disadvantaged groups, and on the government having sufficient fiscal space to fund them properly. To reduce inequality in the short run, these policies need to be accompanied by targeted redistributive measures such as welfare transfers, free healthcare and free education for low-income households, which can provide immediate support while the supply-side policies take effect. Overall, the policies are likely to reduce income inequality in the long run, but will have limited short-run impact without complementary redistributive measures.
Key Takeaways
Supply-side policies can reduce income inequality by improving employment and wage outcomes for low-income households, but their impact is often slow and uneven. Evaluating their effectiveness requires considering both their potential benefits and their practical limitations, including time lags, cost constraints and distributional effects.
Common Mistakes
A common mistake is assuming that supply-side policies will automatically reduce inequality, without considering their limitations. Another mistake is writing a one-sided answer that only discusses the benefits or only the drawbacks of the policies, which will lose all evaluation marks. A third mistake is making generic points about supply-side policies without linking them specifically to income inequality (e.g. discussing how infrastructure improves growth without linking it to low-income households' access to jobs). A fourth mistake is ending with a summary of both sides instead of a justified conclusion that answers the specific question of how much the policies will reduce inequality.
Things to Be Careful About
Ensure you link every point back to income inequality, not just to economic growth or employment in general. For example, when discussing job creation from infrastructure, explain that this raises incomes for low-income households, reducing inequality. Also, ensure your conclusion is justified: do not simply say "it depends", but explain what it depends on (e.g. targeting of policies, presence of short-run redistributive measures) and state the likely outcome under different conditions.
With the help of examples, explain the difference between public goods and free goods and consider whether a market economy can ever produce public goods.
Answer
Free goods are goods that are not scarce; they have zero opportunity cost because no factors of production are used to produce them. Examples include fresh air and sunlight. Public goods are goods that are both non-excludable (it is impossible or very costly to prevent anyone from consuming them) and non-rival (one person's consumption does not reduce the amount available for others). Examples include national defence and street lighting.
Because public goods are non-excludable, consumers can enjoy the benefits without paying – the free-rider problem. This makes it impossible for private firms to charge a price and earn a profit, so a market economy will generally not supply public goods. However, it is possible for a market economy to produce public goods if they can be made excludable through technology (e.g., subscription-based satellite TV) or if the government provides a subsidy to cover costs. In rare cases, firms may produce them for philanthropic reasons. Overall, while it is unlikely, it is not impossible.
A market economy is unlikely to produce public goods due to the free-rider problem, but it is possible if excludability is achieved or subsidies are provided.
Background Concept
In economics, goods are classified based on scarcity and rivalry. Free goods are abundant and have zero opportunity cost – they are not produced using scarce resources. Public goods are a type of economic good with two key characteristics: non-excludability (no one can be prevented from consuming) and non-rivalry (consumption by one does not reduce availability for others). These characteristics lead to the free-rider problem, where individuals have an incentive to consume without paying, making it unprofitable for private firms to supply them.
Understanding the Question
The question has two parts: first, explain the difference between public goods and free goods using examples; second, consider whether a market economy can ever produce public goods. The command word "explain" requires clear definitions and examples (AO1). "Consider" introduces evaluation (AO3) – you must weigh arguments for and against the possibility. The marking scheme awards up to 3 marks for AO1, 3 for AO2 (analysis of why market fails), and 2 for AO3 (evaluation).
Approach
Start by defining free goods and public goods separately, giving correct examples (avoid common mistakes like roads or education). Then explain the free-rider problem and why markets fail to provide public goods (AO2). Finally, evaluate whether a market economy could ever produce them – consider cases where excludability is possible (e.g., technology), government subsidies, or altruistic firms. Conclude with a balanced judgement.
Step-by-Step Reasoning
- Define free goods: Goods with zero opportunity cost, not scarce, no production needed. Example: fresh air.
- Define public goods: Non-excludable and non-rival. Example: national defence.
- Explain the free-rider problem: Because non-excludable, people can consume without paying. Firms cannot charge a price, so no profit incentive to produce.
- Analyse market failure: Without profit, private firms will not supply public goods. This is why governments often provide them.
- Evaluate possibility:
- For: If technology makes the good excludable (e.g., satellite TV), a market can provide it. Also, government subsidies can make production profitable. Some firms may produce for public relations.
- Against: Most pure public goods remain non-excludable, and subsidies require government intervention, so not purely market provision.
- Conclusion: It is very unlikely but not impossible under specific conditions.
Key Takeaways
- Free goods are not scarce; public goods are scarce but have special characteristics.
- The free-rider problem is the core reason markets fail to provide public goods.
- Evaluation requires considering exceptions, not just stating the general rule.
Common Mistakes
- Using examples like roads, education, or healthcare – these are not pure public goods (they can be excludable and rival).
- Confusing public goods with goods provided by the government (government provision is a response, not a definition).
- Giving a one-sided answer (e.g., only saying markets cannot produce them without considering exceptions).
- Failing to explain the free-rider problem clearly.
Things to Be Careful About
- Ensure examples are correct: fresh air (free good), national defence (public good).
- Explain non-excludability and non-rivalry separately.
- For evaluation, mention both sides and reach a clear conclusion.
- Do not use diagrams – not required here.
Assess the extent to which a government can ensure that both merit and demerit goods are produced in desirable quantities.
Introduction
Merit goods are goods that are under-consumed because consumers underestimate their private benefits (e.g., education, healthcare). Demerit goods are over-consumed because consumers underestimate their private costs (e.g., tobacco, alcohol). The government aims to correct these market failures to achieve desirable quantities.
Policies for Merit Goods
To increase consumption of merit goods, the government can use subsidies to lower the price, direct provision (e.g., state schools), and information campaigns to highlight benefits. Subsidies shift the supply curve right, reducing price and increasing quantity. Direct provision ensures universal access. Information aims to shift demand right.
Policies for Demerit Goods
To reduce consumption of demerit goods, the government can impose indirect taxes (e.g., excise duty on cigarettes) to raise price and reduce quantity demanded. Minimum prices (e.g., alcohol minimum unit pricing) can also raise price. Bans and regulations (e.g., smoking bans) directly limit consumption. Information campaigns highlight harms to shift demand left.
Evaluation
The effectiveness of these policies depends on several factors. For merit goods, subsidies may be costly and may not reach the target if supply is inelastic. Direct provision requires significant government expenditure and may crowd out private provision. Information campaigns may have limited impact if consumers are not receptive. For demerit goods, the effectiveness of taxes depends on PED: if demand is inelastic, tax may raise revenue but not reduce consumption much. Minimum prices can be effective but may lead to black markets. Bans are difficult to enforce. Moreover, government failure (e.g., regulatory capture, unintended consequences) can limit success.
Conclusion
The government can influence the quantities of merit and demerit goods, but it cannot fully ensure desirable quantities due to limitations such as consumer behaviour, elasticity, costs, and enforcement difficulties. The extent of success varies by good and policy. Overall, while government intervention can move quantities closer to the social optimum, perfect achievement is unlikely.
The government can significantly influence the production and consumption of merit and demerit goods through various policies, but it cannot fully ensure desirable quantities due to limitations such as price elasticity of demand, consumer receptiveness, costs, and enforcement challenges. The extent of success varies, and perfect achievement is unlikely.
Background Concept
Merit goods are goods that are under-consumed in a free market because consumers have imperfect information about their long-term benefits (e.g., education, vaccinations). Demerit goods are over-consumed because consumers underestimate the private costs (e.g., smoking, gambling). This leads to market failure – the market produces too little of merit goods and too much of demerit goods relative to the social optimum. Government intervention aims to correct this.
Understanding the Question
The question asks you to "assess the extent to which a government can ensure that both merit and demerit goods are produced in desirable quantities." This is an evaluative command – you must discuss both the potential for government to achieve this and the limitations. The marking scheme uses levels: top band requires detailed knowledge, developed analysis, and a justified conclusion. AO1/AO2 out of 8, AO3 out of 4. A one-sided response cannot gain evaluation marks.
Approach
Start by defining merit and demerit goods and explaining the market failure. Then analyse policies for each type: for merit goods – subsidies, direct provision, information; for demerit goods – taxes, minimum prices, bans, information. For each policy, explain how it works and its potential effectiveness. Then evaluate the limitations: PED, costs, consumer behaviour, enforcement, government failure. Finally, reach a justified conclusion on the extent to which government can ensure desirable quantities.
Step-by-Step Reasoning
- Define merit goods: Goods with positive externalities or under-appreciated private benefits, leading to under-consumption. Example: education.
- Define demerit goods: Goods with negative externalities or over-appreciated private benefits, leading to over-consumption. Example: cigarettes.
- Explain market failure: Imperfect information causes consumers to misjudge benefits/costs, so market outcomes are inefficient.
- Policies for merit goods:
- Subsidies: reduce price, increase quantity demanded. Effective if demand is elastic. Costly to government.
- Direct provision: government provides the good (e.g., state schools). Ensures access but uses tax revenue.
- Information: aims to shift demand right. Effectiveness depends on consumer trust and awareness.
- Policies for demerit goods:
- Indirect taxes: raise price, reduce quantity. Effective if demand is elastic. If inelastic, tax raises revenue but little reduction.
- Minimum prices: set a floor above equilibrium, reducing quantity. Can be effective but may create black markets.
- Bans: prohibit consumption. Difficult to enforce and may lead to illegal markets.
- Information: aims to shift demand left. Limited if consumers are addicted or ignore warnings.
- Evaluation:
- Consider PED: for demerit goods like cigarettes, demand is often inelastic in short run, so taxes have limited effect on quantity.
- Costs: subsidies and direct provision require government spending, which has opportunity cost.
- Consumer behaviour: information campaigns may not change behaviour if consumers are irrational or addicted.
- Enforcement: bans and minimum prices require monitoring and can be evaded.
- Government failure: policies may be influenced by lobbying, lead to unintended consequences.
- Conclusion: Government can move quantities towards desirable levels but cannot perfectly ensure them. The extent depends on the specific good, policy design, and market conditions.
Key Takeaways
- Merit and demerit goods involve market failure due to imperfect information.
- Government has a range of policy tools, each with strengths and weaknesses.
- Evaluation must consider elasticity, costs, consumer behaviour, and enforcement.
- A justified conclusion should acknowledge both potential and limitations.
Common Mistakes
- Writing a one-sided answer (only discussing policies without limitations, or only criticising without acknowledging successes).
- Failing to provide a conclusion or providing a vague one.
- Ignoring the role of PED in determining policy effectiveness.
- Confusing merit goods with public goods (they are different).
- Not using examples to support analysis.
Things to Be Careful About
- Clearly distinguish between merit and demerit goods.
- For each policy, explain the mechanism (e.g., tax shifts supply left, raising price).
- Use economic terminology: PED, opportunity cost, government failure.
- Ensure the conclusion directly answers the question about "extent to which a government can ensure."
- No diagram is required, but if you use one (e.g., tax diagram), ensure it is fully explained.
Explain three reasons, associated with costs of production, why the supply curve for a particular market may shift to the right and consider the extent to which government microeconomic policy may also shift the supply curve for a particular market to the right.
Answer
Three reasons associated with costs of production that shift the supply curve to the right:
- A fall in wage rates reduces labour costs, lowering marginal cost. Firms are willing to supply more at each price, shifting the supply curve to the right.
- Improvements in technology increase productivity, reducing average cost per unit. This also shifts the supply curve to the right.
- A fall in raw material prices reduces input costs, again lowering production costs and increasing supply at each price.
Government microeconomic policy to shift supply right:
The government can provide a subsidy to producers in a particular market. A subsidy reduces the cost of production, effectively lowering the price producers need to receive to supply a given quantity. This shifts the supply curve to the right. The extent of the shift depends on the size of the subsidy: a larger subsidy causes a greater rightward shift. However, the effectiveness also depends on the price elasticity of demand (PED) for the product. If demand is inelastic, the subsidy may lead to a larger fall in price and a smaller increase in quantity, limiting the supply response. Additionally, if the government imposes regulations that restrict production (e.g., quality standards), the supply shift may be offset. Therefore, the extent to which government policy shifts supply right is not guaranteed and depends on market conditions and complementary policies.
Evaluation and conclusion:
The extent to which government microeconomic policy shifts the supply curve right is limited by factors such as the size of the subsidy, the responsiveness of producers, and potential offsetting regulations. While subsidies can effectively increase supply, their impact is conditional. In conclusion, government policy can shift supply right, but the magnitude is uncertain and depends on specific market characteristics.
Government microeconomic policy such as subsidies can shift the supply curve to the right, but the extent is limited by the size of the subsidy, the PED of the product, and possible regulatory constraints; therefore, while it is a useful tool, its effectiveness varies.
Background Concept
The supply curve shows the relationship between the price of a good and the quantity supplied. A shift to the right means that at every price, a larger quantity is supplied. This can occur due to factors that reduce the costs of production, such as lower input prices, improved technology, or higher productivity. Government microeconomic policies, such as subsidies, can also reduce production costs and shift supply right. However, the extent of the shift depends on various factors, including the size of the subsidy, the price elasticity of demand, and other government regulations.
Understanding the Question
The question has two parts: first, explain three reasons related to costs of production that shift the supply curve right; second, consider the extent to which government microeconomic policy can also shift the supply curve right. The command word "explain" requires a clear causal chain for each reason. The phrase "consider the extent to which" introduces evaluation: you must discuss not just that the policy can shift supply, but how much it can do so and what limits its effectiveness. The mark scheme allocates up to 3 marks for knowledge (three reasons), up to 3 marks for analysis (explaining the policy and its effect), and up to 2 marks for evaluation (including a justified conclusion).
Approach
Start by listing three distinct cost-related reasons for a rightward supply shift. For each, state the cause (e.g., fall in wage rates) and explain the mechanism (lower costs -> higher quantity supplied at each price). Then, choose one government microeconomic policy—subsidies are the clearest example—and explain how it shifts supply right. Finally, evaluate the extent of the shift by considering factors that limit or enhance the effect, and end with a justified conclusion that directly answers the "extent" part.
Step-by-Step Reasoning
-
Three cost-related reasons:
- Fall in wage rates: Labour is a variable cost. A decrease in wages reduces marginal cost, so firms can profitably supply more at each price. The supply curve shifts right.
- Improvements in technology: New technology increases output per unit of input, lowering average cost. This encourages firms to supply more at each price, shifting supply right.
- Fall in raw material prices: Raw materials are a direct input. A drop in their price reduces production costs, again shifting supply right.
-
Government microeconomic policy:
- Subsidies: A subsidy is a payment from the government to producers, effectively reducing their costs. For example, a subsidy to farmers reduces the cost of producing crops. This shifts the supply curve right. The size of the shift depends on the subsidy per unit: a larger subsidy reduces costs more, shifting supply further right.
-
Evaluation of extent:
- Size of subsidy: A larger subsidy has a greater effect, but there may be budget constraints.
- Price elasticity of demand (PED): If demand is inelastic, the subsidy leads to a larger price fall and a smaller quantity increase, so the supply shift may not translate into a large increase in output.
- Regulations: If the government also imposes regulations (e.g., quality standards, production limits), these may offset the supply-increasing effect of the subsidy.
- Producer responsiveness: Some producers may not use the subsidy to expand output; they might take it as extra profit.
-
Conclusion: The extent to which government policy shifts supply right is conditional. It can be effective, but the actual impact varies. Therefore, a justified conclusion acknowledges that while subsidies can shift supply right, the magnitude is uncertain and depends on market-specific factors.
Key Takeaways
- Supply shifts right when production costs fall.
- Three common cost-related reasons: lower wages, better technology, cheaper raw materials.
- Government subsidies can also shift supply right by reducing costs.
- The extent of the shift depends on the size of the subsidy, PED, and other policies.
- A justified conclusion is essential for evaluation marks.
Common Mistakes
- Listing only two reasons instead of three.
- Confusing a movement along the supply curve with a shift (e.g., saying a price change shifts supply).
- Describing the policy without explaining how it shifts supply (e.g., just saying "subsidies increase supply" without the mechanism).
- Failing to evaluate the extent—just stating that the policy shifts supply without discussing limitations.
- Omitting a conclusion or giving a vague one.
Things to Be Careful About
- Ensure each reason is clearly linked to costs of production.
- Use correct terminology: "shift to the right" not "increase in supply" (though both are acceptable, but shift is precise).
- For the evaluation, explicitly mention factors that limit the extent.
- The conclusion must be justified, not just a summary.
- Keep the answer focused on a particular market, as specified in the question.
Assess the extent to which knowledge of a product’s price elasticity of supply is the most useful measure of elasticity to a firm needing to react quickly to changes in its market.
Introduction
Price elasticity of supply (PES) measures the responsiveness of quantity supplied to a change in price. For a firm needing to react quickly to changes in its market, knowledge of PES can indicate how easily output can be adjusted. However, other elasticities—PED, YED, and XED—may also be crucial depending on the nature of the market change. This essay assesses the extent to which PES is the most useful measure.
The case for PES being most useful
When a firm faces a change in the market price of its product, PES directly tells it how much it can increase or decrease output in response. For example, if the price rises and PES is elastic (greater than 1), the firm can quickly expand production to capture higher revenue. Factors affecting PES—such as the availability of spare capacity, the ability to hold stocks, the length of the production period, and the ease of factor substitution—determine the speed of reaction. A firm with elastic PES can react rapidly, making PES highly relevant for quick adjustments. Thus, for price changes, PES is arguably the most useful elasticity.
The case against PES being most useful
Market changes are not limited to price changes. A firm may need to react to changes in consumer income, competitor prices, or the prices of related goods. In such cases, other elasticities are more informative:
- Price elasticity of demand (PED): If the firm is considering a price change, PED tells it how total revenue will be affected. Even if supply is elastic, a price cut may not increase revenue if demand is inelastic. So PED is essential for pricing strategy.
- Income elasticity of demand (YED): During a recession, incomes fall. Knowledge of YED helps the firm anticipate whether demand for its product will fall (normal good) or rise (inferior good). This allows it to adjust production plans accordingly, which PES alone cannot provide.
- Cross elasticity of demand (XED): If a competitor changes its price, XED indicates how the firm's own demand will be affected. A high positive XED means the products are substitutes, so the firm must react to maintain market share. Again, PES does not capture this.
Therefore, for non-price changes, PES is of limited use, and other elasticities are more valuable.
Evaluation
The usefulness of PES depends on the type of market change. For a change in the product's own price, PES is directly relevant and often the most useful. However, for changes in income, competitor prices, or other determinants, other elasticities are more important. Additionally, the time horizon matters: in the short run, PES may be inelastic due to fixed factors, so even for price changes, the firm may not be able to react quickly. In the long run, PES becomes more elastic, but other elasticities also become more relevant as market conditions evolve. A firm needs a combination of elasticity measures to make informed decisions. No single elasticity is universally most useful.
Conclusion
To a limited extent, PES is the most useful measure of elasticity for a firm needing to react quickly to changes in its market. It is most useful when the change is a price change, as it directly indicates the firm's ability to adjust output. However, for other types of market changes—such as shifts in income or competitor prices—other elasticities (YED, XED, PED) are more relevant. Therefore, the extent to which PES is the most useful is limited; firms must consider the specific context and use a range of elasticity measures.
PES is the most useful measure only when the market change is a price change; for other changes, other elasticities are more relevant, so the extent to which PES is the most useful is limited.
Background Concept
Price elasticity of supply (PES) is defined as the percentage change in quantity supplied divided by the percentage change in price. It measures how responsive producers are to price changes. Factors affecting PES include the time period (short run vs. long run), availability of stocks, spare capacity, and the ease of switching factors of production. Other elasticities—PED, YED, XED—measure responsiveness of demand to price, income, and cross-price changes, respectively. For a firm, understanding these elasticities helps in making production, pricing, and marketing decisions.
Understanding the Question
The question asks: "Assess the extent to which knowledge of a product’s price elasticity of supply is the most useful measure of elasticity to a firm needing to react quickly to changes in its market." The command word "assess" requires a balanced analysis and a justified conclusion. The phrase "most useful" implies a comparison with other elasticity measures. The context is a firm needing to react quickly to market changes—so the focus is on speed of adjustment. The mark scheme indicates that responses should consider at least one other elasticity and evaluate the relative usefulness. The top band requires detailed knowledge, developed analysis, and a justified conclusion.
Approach
Start by defining PES and explaining its relevance to quick reactions. Then present the argument for PES being most useful, focusing on price changes. Then present the counter-argument by discussing other elasticities (PED, YED, XED) and their relevance to different types of market changes. Evaluate by weighing the conditions under which each is most useful, considering time horizons and the nature of the change. Conclude with a justified judgement on the extent to which PES is most useful.
Step-by-Step Reasoning
-
Define PES and its relevance: PES = %ΔQs / %ΔP. A high PES means supply can adjust quickly to price changes. For a firm, this is crucial if it wants to exploit a price rise by increasing output or avoid losses from a price fall by reducing output. Factors like spare capacity and stock availability determine PES.
-
Argument for PES being most useful:
- If the market change is a price change (e.g., due to a demand shift), PES directly tells the firm how much output can change. For example, if PES is 2, a 10% price rise leads to a 20% increase in quantity supplied. This allows the firm to plan production quickly.
- Other elasticities do not directly measure supply responsiveness. So for price changes, PES is the most relevant.
-
Argument against PES being most useful:
- PED: If the firm is considering a price change itself, PED tells it how revenue will change. Even if supply is elastic, a price cut may not be profitable if demand is inelastic. So PED is essential for pricing decisions.
- YED: Changes in income affect demand. For example, during a recession, incomes fall. If the firm's product has a high positive YED, demand will fall significantly. The firm needs to cut production, but PES does not help predict this; YED does.
- XED: If a competitor lowers its price, XED tells the firm how its own demand will be affected. A high positive XED means the products are close substitutes, so the firm must react (e.g., lower its own price or improve quality). PES is irrelevant here.
- Therefore, for non-price changes, other elasticities are more useful.
-
Evaluation:
- The type of market change determines which elasticity is most useful. For price changes, PES is key; for income changes, YED; for competitor price changes, XED; for own pricing decisions, PED.
- Time horizon: In the short run, PES is often inelastic due to fixed factors, so even for price changes, the firm may not be able to react quickly. In the long run, PES becomes more elastic, but other elasticities also become more relevant as market conditions evolve.
- A firm needs a combination of elasticities to make informed decisions. No single elasticity is universally most useful.
-
Conclusion: The extent to which PES is the most useful is limited. It is most useful for price changes, but for other changes, other elasticities are more important. Therefore, the firm should consider the specific context and use a range of elasticity measures.
Key Takeaways
- PES measures supply responsiveness to price changes and is directly relevant for reacting to price changes.
- Other elasticities (PED, YED, XED) are more useful for other types of market changes.
- The most useful elasticity depends on the nature of the market change.
- A justified conclusion must address the specific question and weigh the evidence.
Common Mistakes
- Writing a one-sided answer that only argues for PES without considering other elasticities (this loses all evaluation marks).
- Failing to define PES or other elasticities clearly.
- Not linking the analysis to the firm's need to react quickly.
- Providing a vague conclusion that does not state the extent (e.g., "it depends" without further justification).
- Confusing PES with PED or using incorrect formulas.
Things to Be Careful About
- Ensure the answer is balanced: present both sides with equal depth.
- Use specific examples to illustrate points (e.g., a farmer with perishable goods has inelastic PES in the short run).
- The conclusion must be justified, not just a summary. State the extent clearly.
- Keep the focus on the firm's need to react quickly; do not drift into general discussions of elasticity.
- Use correct economic terminology and avoid vague statements.
With the help of an AD/AS diagram(s), explain one demand-side and one supply-side cause of deflation and consider which is likely to be more damaging to an economy.
Answer
Deflation is a sustained fall in the general price level. It can be caused by a fall in aggregate demand (demand-side) or an increase in aggregate supply (supply-side).
Demand-side deflation
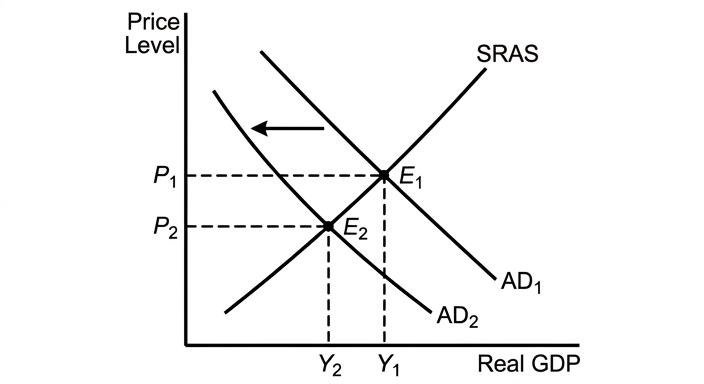
The diagram shows a leftward shift of the AD curve from AD1 to AD2. The price level falls from P1 to P2 and real output falls from Y1 to Y2. This is associated with a recession: falling output leads to rising unemployment as firms reduce production. Demand-side deflation is therefore damaging because it reduces economic growth and increases unemployment.
Supply-side deflation
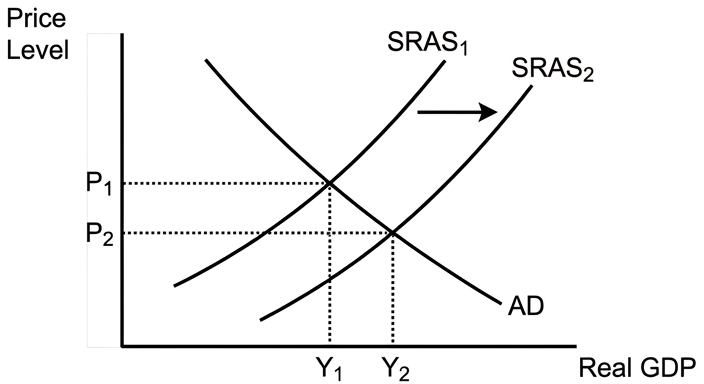
The diagram shows a rightward shift of the SRAS curve from SRAS1 to SRAS2. The price level falls from P1 to P2 but real output rises from Y1 to Y2. This is associated with increased output and employment, and lower prices benefit consumers. Supply-side deflation is therefore benign or beneficial.
Evaluation
Demand-side deflation is more damaging because it is accompanied by recession and unemployment, whereas supply-side deflation brings higher output and lower prices. A justified conclusion is that demand-side deflation is more harmful to an economy.
Demand-side deflation is more damaging because it is associated with recession and unemployment, while supply-side deflation is benign or beneficial.
Background Concept
Deflation is a sustained decrease in the general price level. It is the opposite of inflation. The AD/AS model is used to analyse changes in the price level and real output. A fall in aggregate demand (AD) shifts the AD curve left, reducing both the price level and real output. A rise in aggregate supply (AS) shifts the AS curve right, reducing the price level but increasing real output. The two causes have opposite effects on output and employment.
Understanding the Question
The question asks to explain one demand-side and one supply-side cause of deflation using AD/AS diagrams, and then consider which is likely to be more damaging. The command word 'explain' requires a clear chain of reasoning, and 'consider' requires a short evaluation. The mark scheme allocates 3 marks for knowledge (definition and two accurate diagrams), 3 marks for analysis (explaining the effects on output and employment), and 2 marks for evaluation (comparing the two and reaching a conclusion).
Approach
First, define deflation. Then present the demand-side cause: a fall in AD (e.g., due to a decrease in consumer confidence, investment, or government spending). Draw the AD/AS diagram showing AD shifting left, leading to lower price level and lower output. Explain that this causes recession and unemployment. Then present the supply-side cause: an increase in AS (e.g., due to technological progress, lower input prices, or improved productivity). Draw the AD/AS diagram showing SRAS shifting right, leading to lower price level and higher output. Explain that this is beneficial. Finally, evaluate which is more damaging: demand-side deflation is clearly more harmful because it reduces output and employment, while supply-side deflation is benign.
Step-by-Step Reasoning
- Define deflation: a sustained fall in the general price level.
- Demand-side deflation:
- Cause: a decrease in any component of AD (C, I, G, X-M). For example, a fall in consumer confidence reduces consumption.
- Diagram: AD curve shifts left from AD1 to AD2. The new equilibrium is at a lower price level P2 and lower real output Y2.
- Analysis: Lower output means firms produce less, so they lay off workers, increasing unemployment. Economic growth falls or becomes negative (recession). This is damaging.
- Supply-side deflation:
- Cause: an increase in SRAS due to, e.g., lower oil prices, technological improvements, or increased productivity.
- Diagram: SRAS curve shifts right from SRAS1 to SRAS2. The new equilibrium is at a lower price level P2 and higher real output Y2.
- Analysis: Higher output means firms produce more, so they hire more workers, reducing unemployment. Economic growth increases. Lower prices benefit consumers. This is beneficial.
- Evaluation: Compare the two. Demand-side deflation is associated with recession and unemployment, which are harmful. Supply-side deflation is associated with growth and lower prices, which are beneficial. Therefore, demand-side deflation is more damaging. A conclusion should state this clearly.
Key Takeaways
- Deflation can have different causes with different consequences.
- AD/AS diagrams are essential for illustrating the effects.
- Demand-side deflation is contractionary and harmful; supply-side deflation is expansionary and beneficial.
- Evaluation requires comparing the two and reaching a justified conclusion.
Common Mistakes
- Confusing deflation with disinflation (a fall in the rate of inflation).
- Drawing only one diagram when two are required.
- Not labelling axes and curves properly.
- Failing to explain the effects on output and employment.
- Giving a one-sided evaluation without a conclusion.
Things to Be Careful About
- Ensure both diagrams are clearly labelled with price level and real GDP axes, and all curves and equilibrium points.
- Explain the chain of reasoning: shift -> new equilibrium -> effects on output and employment.
- In the evaluation, explicitly state which is more damaging and why.
- Reserve one mark for a valid conclusion as per the mark scheme.
Assess the extent to which using fiscal policy would be the best way to reduce a high rate of inflation.
Introduction
Inflation is a sustained rise in the general price level. A high rate of inflation can be damaging to an economy, eroding purchasing power and creating uncertainty. Fiscal policy involves changes in government spending and taxation to influence aggregate demand. This essay assesses the extent to which fiscal policy is the best way to reduce a high rate of inflation, comparing it with monetary and supply-side policies.
Analysis of Fiscal Policy
Contractionary fiscal policy involves reducing government spending and/or increasing taxes. This reduces aggregate demand (AD), shifting the AD curve leftwards. In the AD/AS model, this lowers the price level and reduces real output. If inflation is demand-pull (caused by excess AD), fiscal policy can be effective. However, it also reduces output and may increase unemployment. Moreover, if inflation is cost-push (caused by rising costs), fiscal policy is less effective because it does not address the supply-side causes and may worsen the recession.
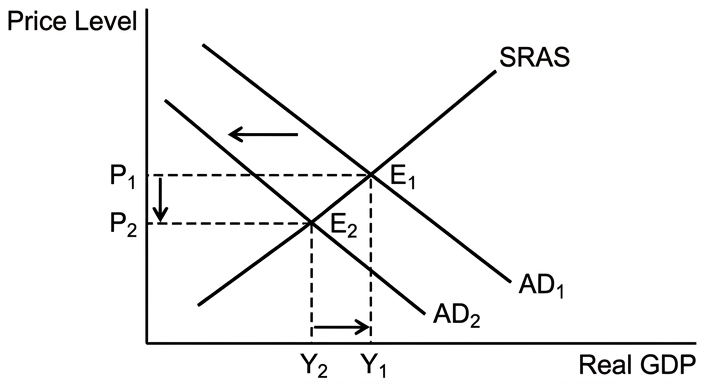
The diagram shows a leftward shift of AD from AD1 to AD2, reducing the price level from P1 to P2 and output from Y1 to Y2. This illustrates the trade-off: lower inflation but lower output.
Comparison with Monetary Policy
Monetary policy, particularly raising interest rates, also reduces AD by discouraging borrowing and spending. It can be implemented quickly by the central bank and is often the primary tool for inflation control. However, it may have time lags and can be less effective if investment is interest-inelastic. Monetary policy also reduces output and may cause unemployment. Compared to fiscal policy, monetary policy is more flexible and less subject to political delays, but fiscal policy can be targeted more directly (e.g., cutting specific spending).
Comparison with Supply-Side Policy
Supply-side policies aim to increase aggregate supply by improving productivity, reducing costs, and increasing competition. They address cost-push inflation directly by lowering production costs. They also increase output and employment, avoiding the recessionary effects of demand-side policies. However, supply-side policies take time to implement and have delayed effects. They are not suitable for quickly reducing a high rate of inflation, especially if it is demand-pull.
Evaluation
The best policy depends on the cause of inflation. For demand-pull inflation, fiscal policy can be effective but at the cost of lower output. Monetary policy is similarly effective and more flexible. For cost-push inflation, supply-side policy is more appropriate but slow. Fiscal policy is less suitable for cost-push inflation. Additionally, the political feasibility and time horizon matter: fiscal policy may be unpopular due to tax increases or spending cuts, while monetary policy is more independent. In a high inflation scenario, a combination of policies may be best: tight monetary policy to quickly reduce demand, supplemented by supply-side measures to address underlying cost pressures.
Conclusion
Fiscal policy can be an effective tool for reducing demand-pull inflation, but it is not always the best way. Its drawbacks include output loss, unemployment, and ineffectiveness against cost-push inflation. Monetary policy is often more practical for quick action, and supply-side policy is better for long-term cost-push inflation. Therefore, the extent to which fiscal policy is the best depends on the specific circumstances; it is rarely the sole best policy, and a mix of policies is usually superior.
Fiscal policy can be effective against demand-pull inflation but is not always the best way; monetary policy is often more flexible and supply-side policy better for cost-push inflation, so a combination of policies is usually superior.
Background Concept
Inflation is a sustained increase in the general price level. High inflation can be caused by excess aggregate demand (demand-pull) or rising costs of production (cost-push). Fiscal policy uses government spending and taxation to influence AD. Monetary policy uses interest rates and money supply. Supply-side policy aims to increase AS. The AD/AS model is used to analyse the effects of these policies on the price level and real output.
Understanding the Question
The question asks to assess the extent to which fiscal policy is the best way to reduce a high rate of inflation. 'Assess' requires a balanced analysis and a justified conclusion. The mark scheme allocates 8 marks for AO1/AO2 (knowledge, understanding, analysis) and 4 marks for AO3 (evaluation). The top band requires detailed knowledge, developed analysis, and a justified conclusion. The response must compare fiscal policy with at least one other policy and reach a conclusion.
Approach
First, define inflation and fiscal policy. Then analyse how contractionary fiscal policy works: reduce G or increase T -> lower AD -> lower price level. Discuss its effectiveness against demand-pull inflation and its drawbacks (output loss, unemployment, ineffectiveness against cost-push). Then compare with monetary policy (interest rates, money supply) and supply-side policy (increase AS). Evaluate which policy is best under different circumstances. Conclude that fiscal policy is not always the best; it depends on the cause of inflation and other factors.
Step-by-Step Reasoning
- Define inflation and high rate. Explain that high inflation is harmful.
- Fiscal policy: contractionary fiscal policy reduces AD. Diagram: AD shifts left, price level falls, output falls. This is effective for demand-pull inflation but causes recession. For cost-push inflation, fiscal policy may worsen the recession without addressing cost increases.
- Monetary policy: raising interest rates reduces consumption and investment, shifting AD left. It is quick and flexible. However, it also reduces output and may have time lags. It is also less effective if investment is interest-inelastic.
- Supply-side policy: policies like training, deregulation, tax reforms increase AS. This shifts SRAS right, lowering price level and increasing output. It addresses cost-push inflation directly. But it takes time to implement and has delayed effects.
- Evaluation: Compare the policies. For demand-pull inflation, both fiscal and monetary policy can work, but monetary policy is often preferred due to speed and independence. For cost-push inflation, supply-side policy is more appropriate. Fiscal policy is less suitable for cost-push. Also consider political feasibility: fiscal policy may be unpopular. A combination of policies may be best: tight monetary policy to quickly reduce demand, plus supply-side measures to address cost pressures.
- Conclusion: Fiscal policy is not always the best; its effectiveness depends on the cause of inflation. The extent to which it is best is limited; other policies may be more suitable in many cases.
Key Takeaways
- Fiscal policy can reduce demand-pull inflation but at the cost of lower output.
- Monetary policy is a common alternative with similar effects but more flexibility.
- Supply-side policy addresses cost-push inflation without reducing output.
- The best policy depends on the cause of inflation and other factors.
- A justified conclusion must weigh the pros and cons and state a clear judgement.
Common Mistakes
- One-sided analysis: only discussing fiscal policy without comparing alternatives.
- Ignoring the cause of inflation: assuming fiscal policy works for all types.
- No conclusion or a vague conclusion.
- Failing to use AD/AS analysis or diagrams.
- Overlooking the 'high rate' aspect: policies may differ for moderate vs high inflation.
Things to Be Careful About
- Clearly distinguish between demand-pull and cost-push inflation.
- Use AD/AS diagrams to support analysis (optional but helpful).
- Ensure evaluation is developed and not just a list of points.
- The conclusion must be justified and address the specific question.
- Mention time lags, political feasibility, and other real-world considerations.
With the help of a diagram, explain two ways in which a fall in the balance of trade in goods may affect the value of a floating exchange rate and consider the extent to which a change in the relative rate of interest between two countries may have a greater impact on the exchange rate.
Answer
AO1: Diagram and explanation of two ways a fall in balance of trade in goods affects exchange rate
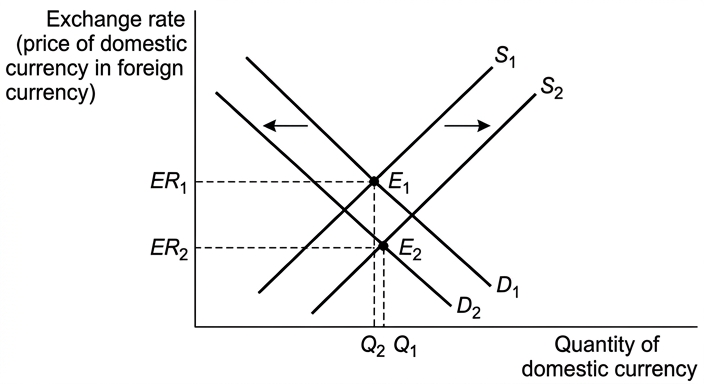
A fall in the balance of trade in goods (a larger deficit or smaller surplus) means either exports have fallen or imports have risen. If exports fall, there is less foreign demand for the domestic currency, shifting the demand curve left, depreciating the currency. If imports rise, domestic residents need more foreign currency, so they supply more domestic currency, shifting the supply curve right, also depreciating the currency. Both effects work to lower the exchange rate.
AO2: Analysis of the impact of a change in relative interest rates
A change in the relative rate of interest between two countries affects hot money flows. If the domestic interest rate rises relative to foreign rates, foreign investors seek higher returns, increasing demand for the domestic currency (to buy domestic assets). This shifts the demand curve right, causing the exchange rate to appreciate. Conversely, if the domestic interest rate falls relative to foreign rates, capital outflows occur, increasing supply of the domestic currency, causing depreciation. The extent of the impact depends on factors such as the size of the interest rate differential, the mobility of capital, confidence in the economy, and the presence of other factors affecting the exchange rate (e.g., trade flows, speculation). In the short run, interest rate changes can cause large and rapid movements in exchange rates due to the speed of capital flows.
AO3: Evaluation of which has a greater impact
Whether a change in relative interest rates has a greater impact than a fall in the balance of trade depends on the time horizon and the responsiveness of capital flows. In the short run, interest rate changes often have a larger and more immediate effect because financial markets adjust quickly, whereas trade flows adjust more slowly. However, in the long run, trade flows are more fundamental and persistent, so a sustained deterioration in the trade balance may have a more lasting depreciating effect. Additionally, if capital markets are not fully liberalised or if there is low confidence, interest rate changes may have limited impact. Therefore, while interest rate changes can dominate in the short term, the trade balance is more significant in the long term. Overall, the relative impact depends on the specific circumstances, but interest rate changes often have a greater short-term effect.
Conclusion: A change in relative interest rates is likely to have a greater impact on the exchange rate in the short run due to the speed of capital flows, but a fall in the balance of trade may have a more persistent effect in the long run.
A change in relative interest rates is likely to have a greater short-term impact on the exchange rate due to the speed of capital flows, but a fall in the balance of trade may have a more persistent long-term effect; the overall impact depends on circumstances.
Background Concept
This question deals with the determination of a floating exchange rate. In a floating exchange rate system, the value of a currency is determined by the forces of demand and supply in the foreign exchange market. The demand for a currency comes from foreign buyers who want to purchase the country's goods, services, or assets. The supply of a currency comes from domestic residents who need foreign currency to buy imports or invest abroad. Any factor that changes demand or supply will cause the exchange rate to change.
The balance of trade in goods is a component of the current account. A fall in the balance of trade (a larger deficit or smaller surplus) means either exports have fallen or imports have risen. This directly affects the demand for and supply of the domestic currency.
Interest rates affect capital flows. If a country's interest rate rises relative to other countries, it attracts foreign investment (hot money), increasing demand for its currency. Conversely, a fall in relative interest rates leads to capital outflows, increasing supply of the currency.
Understanding the Question
The question has two parts: first, explain two ways a fall in the balance of trade in goods affects a floating exchange rate, using a diagram. Second, consider the extent to which a change in relative interest rates may have a greater impact. The command word "explain" requires a clear chain of reasoning, and "consider the extent" requires evaluation. The marks are split: 3 for knowledge (diagram and identification of the two ways), 3 for analysis (explaining the interest rate channel), and 2 for evaluation (comparing the two).
Approach
Start by drawing a foreign exchange market diagram. Show the initial equilibrium. Then show two shifts: supply right (from increased imports) and demand left (from decreased exports). Explain each shift. Then analyse how interest rate changes affect the exchange rate via hot money flows. Finally, evaluate which factor has a greater impact, considering time horizon, capital mobility, and other factors. Conclude with a justified judgement.
Step-by-Step Reasoning
-
Diagram: Draw a standard demand and supply diagram for the domestic currency. Label axes: exchange rate (price of domestic currency in foreign currency) on vertical axis, quantity of domestic currency on horizontal axis. Draw initial demand curve D1 (downward sloping) and supply curve S1 (upward sloping). Mark initial equilibrium E1 with exchange rate ER1 and quantity Q1.
-
First way: fall in exports: If exports fall, foreign buyers need less domestic currency to pay for them. This reduces demand for the domestic currency, shifting the demand curve left from D1 to D2. At the original exchange rate, there is excess supply, so the exchange rate falls to a new equilibrium E2 with lower exchange rate ER2.
-
Second way: rise in imports: If imports rise, domestic residents need more foreign currency to pay for them. They supply more domestic currency to the foreign exchange market, shifting the supply curve right from S1 to S2. At the original exchange rate, there is excess supply, so the exchange rate falls. The new equilibrium is at E3 (or combine both shifts to a single new equilibrium). In reality, both may happen simultaneously, reinforcing the depreciation.
-
Interest rate channel: A rise in the domestic interest rate relative to foreign rates attracts foreign investors who want to earn higher returns. They need to buy domestic currency to invest, increasing demand for the currency (shift demand right). This causes the exchange rate to appreciate. Conversely, a fall in relative interest rates leads to capital outflows, increasing supply of the currency (shift supply right), causing depreciation. The size of the effect depends on the interest rate differential, the ease of capital movement, and confidence in the economy.
-
Evaluation: Compare the two channels. Trade flows are relatively slow to adjust because they depend on contracts, production, and consumption patterns. Capital flows can adjust almost instantly, so interest rate changes often have a larger short-run impact. However, trade flows are more persistent; a sustained trade deficit will continuously put downward pressure on the currency. Also, if capital markets are not fully open or if there is political instability, interest rate changes may have little effect. Therefore, the relative impact depends on the time horizon and the specific context. In the short run, interest rate changes are likely more powerful; in the long run, trade balance matters more.
-
Conclusion: A change in relative interest rates is likely to have a greater short-term impact, but a fall in the balance of trade may have a more persistent long-term effect. The overall impact depends on circumstances.
Key Takeaways
- A floating exchange rate is determined by demand and supply of the currency.
- The balance of trade affects exchange rates through changes in demand for exports and supply for imports.
- Interest rate differentials affect exchange rates through capital flows (hot money).
- The relative impact of trade vs. capital flows depends on time horizon and market conditions.
- Diagrams are essential for explaining exchange rate determination.
Common Mistakes
- Drawing a diagram without labelling axes or curves correctly.
- Confusing a movement along the curve with a shift of the curve.
- Forgetting to explain both ways (exports and imports) for the trade balance.
- Not linking the interest rate change to capital flows explicitly.
- Providing a one-sided evaluation without a conclusion.
- Using the wrong diagram (e.g., AD/AS instead of foreign exchange market).
Things to Be Careful About
- Ensure the diagram is fully labelled: axes, curves, equilibrium points, shift arrows.
- Clearly distinguish between the two effects on the trade balance.
- When discussing interest rates, specify "relative" interest rates (compared to other countries).
- In evaluation, consider both short-run and long-run perspectives.
- The conclusion should directly answer the question about which has a greater impact.
Assess whether an improvement in the terms of trade or a surplus on the current account of the balance of payments is of more benefit to an economy.
Introduction
An improvement in the terms of trade means that export prices rise relative to import prices, so a given volume of exports can buy more imports. A surplus on the current account means that the value of exports of goods, services, and income flows exceeds imports. Both can bring benefits, but their relative merits depend on the underlying causes and the time horizon.
Benefits of an improvement in the terms of trade
An improvement in the terms of trade allows a country to purchase more imports for the same export volume, raising real national income and living standards. For example, if export prices rise due to increased global demand, the country can import more capital goods, boosting productivity. It may also signal economic strength, attracting foreign direct investment. However, an improvement may be caused by domestic inflation, which reduces competitiveness and may lead to a current account deficit in the long run. If the improvement is due to a fall in import prices (e.g., lower oil prices), it is unambiguously beneficial.
Benefits of a current account surplus
A current account surplus means the country is earning more from abroad than it spends. This directly adds to aggregate demand (since net exports are positive), stimulating economic growth and employment. It also strengthens the currency and builds foreign exchange reserves, providing a buffer against external shocks. A surplus may indicate a competitive export sector. However, a surplus can be the result of under-consumption domestically (e.g., high saving rates), which may reduce living standards if resources are diverted away from domestic consumption. It can also be inflationary if the economy is near full capacity, as export demand pushes up prices.
Evaluation
Which is more beneficial depends on the cause and the economic context. An improvement in the terms of trade that is driven by genuine productivity gains or favourable global demand is highly beneficial as it raises living standards without causing overheating. However, if it is due to inflation, it is harmful. A current account surplus is beneficial if it reflects strong export competitiveness and is sustainable, but if it is achieved by suppressing domestic consumption, it may reduce welfare. In the short run, a current account surplus provides a direct boost to GDP and employment, which is often a priority for policymakers. In the long run, an improvement in the terms of trade can raise the sustainable standard of living. Additionally, a surplus may lead to trade tensions and protectionist responses, whereas an improvement in the terms of trade is generally welcomed.
Conclusion
Overall, a current account surplus is likely to be of more immediate benefit to an economy because it directly stimulates growth and employment, which are key macroeconomic objectives. However, an improvement in the terms of trade is more beneficial in the long run if it reflects genuine improvements in productivity and purchasing power. The net benefit depends on the specific circumstances, but for most economies, a sustainable current account surplus combined with favourable terms of trade is ideal. If forced to choose, a current account surplus provides more tangible short-term benefits.
A current account surplus is generally of more immediate benefit to an economy as it directly boosts aggregate demand and employment, but an improvement in the terms of trade may be more beneficial in the long run if it reflects genuine productivity gains. The net benefit depends on the underlying causes and context.
Background Concept
The terms of trade measure the ratio of export prices to import prices. An improvement means export prices rise relative to import prices, so the country can buy more imports with the same export revenue. The current account records the balance of trade in goods, services, primary income, and secondary income. A surplus means the country is a net lender to the rest of the world.
Both concepts relate to a country's external position and living standards. An improvement in the terms of trade increases real income, while a current account surplus adds to aggregate demand. However, each has potential drawbacks.
Understanding the Question
The question asks to "assess whether an improvement in the terms of trade or a surplus on the current account is of more benefit to an economy." This is a comparative evaluation. The command word "assess" requires a balanced analysis and a justified conclusion. The marks are 12, with 8 for analysis and 4 for evaluation. The top band requires detailed knowledge, developed analysis, and a justified conclusion.
Approach
First, define both terms. Then analyse the benefits of an improvement in the terms of trade, including potential drawbacks. Then analyse the benefits of a current account surplus, including drawbacks. Then evaluate which is more beneficial, considering time horizon, underlying causes, and trade-offs. Conclude with a clear judgement.
Step-by-Step Reasoning
-
Define terms: Terms of trade = (index of export prices / index of import prices) x 100. An improvement means the index rises. Current account surplus: exports > imports + net income flows.
-
Benefits of terms of trade improvement:
- Higher real income: same export volume buys more imports, raising consumption possibilities.
- Improved living standards: cheaper imports reduce cost of living.
- Attracts FDI: signals economic strength.
- However, if caused by inflation, it reduces competitiveness and may worsen the current account.
- If caused by a fall in import prices (e.g., oil), it is clearly beneficial.
-
Benefits of current account surplus:
- Boosts aggregate demand: net exports add to GDP, stimulating growth and employment.
- Strengthens currency: may reduce import costs.
- Builds foreign reserves: provides stability.
- However, may indicate under-consumption: if domestic saving is high, living standards may be lower than potential.
- Can be inflationary if economy is at full capacity.
- May lead to trade retaliation.
-
Evaluation:
- Time horizon: surplus gives immediate demand boost; terms of trade improvement may take time to affect living standards.
- Cause: a terms of trade improvement from productivity is better than one from inflation; a surplus from competitiveness is better than one from suppressed consumption.
- Trade-offs: a surplus may come at the expense of domestic consumption; terms of trade improvement may reduce export competitiveness if due to rising export prices.
- Policy objectives: if the goal is short-run growth, surplus is better; if long-run living standards, terms of trade improvement is better.
-
Conclusion: A current account surplus is likely more beneficial in the short run for growth and employment, but an improvement in the terms of trade is more beneficial in the long run for living standards. The net benefit depends on context, but for most economies, a surplus provides more immediate and tangible benefits.
Key Takeaways
- Terms of trade and current account surplus are related but distinct concepts.
- Both have benefits and drawbacks.
- Evaluation requires considering causes, time horizon, and trade-offs.
- A justified conclusion must directly answer the question.
Common Mistakes
- Confusing terms of trade with balance of trade.
- One-sided analysis: only discussing benefits without drawbacks.
- Failing to compare the two directly.
- Providing a conclusion that is vague or does not address the question.
- Not using economic terminology precisely.
Things to Be Careful About
- Define terms clearly at the start.
- Ensure analysis is developed, not just listing points.
- Use examples to support arguments.
- In evaluation, weigh the two against each other on specific criteria.
- The conclusion should be justified and specific to the question.