Economics 9708/21 — May/June 2025
Cambridge AS Level · AS Level Data Response and Essays · worked solutions for every part, with the mark scheme
Topics Price Stability · Monetary Policy · Aggregate Demand and Aggregate Supply · Production Possibility Curves · Methods of Government Intervention in Markets · Elasticities of Demand · +5 more
Inflation rate falls in the United States (US), but fears continue over the economic outlook
Americans have been worried about the rate of inflation in the US, especially the increases in food, rent, energy and vehicle prices.
Content removed due to copyright restrictions.
One economist stated that ‘we still expect the impact of the increase in interest rates to push the economy into a mild recession in the first half of 2023’.
Sources: Adapted from ‘Economic growth beats forecasts in US’, The Times, 27 January 2023 and adapted from ‘Inflation rate falls in America – but fears continue over economic outlook’, The Times, 28 January 2023
Using the data in Table 1.1, compare changes in the inflation rate and changes in the interest rate in the US.
Answer
- The inflation rate rose and then fell, whereas the interest rate rose continuously over the period.
- The proportionate changes in the interest rate were consistently larger than the proportionate changes in the inflation rate.
The inflation rate rose and then fell, while the interest rate rose continuously; the proportionate changes in the interest rate were always greater than those of the inflation rate.
Background Concept
Inflation rate measures the percentage change in the general price level over time. Interest rate is the cost of borrowing money, set by the central bank (Federal Reserve in the US). Comparing their changes helps understand the relationship between monetary policy and price stability.
Understanding the Question
The question asks to compare changes in the inflation rate and the interest rate using data from Table 1.1. The table likely shows monthly figures for both variables. The mark scheme requires explicit comparisons, not separate descriptions of each variable.
Approach
Look at the overall trend of each variable over the period. Then compare the direction and magnitude of changes. The mark scheme awards marks for two specific comparisons: one about the direction (inflation rose then fell vs. interest rate rose continuously) and one about the relative size of changes (interest rate changes proportionally larger).
Step-by-Step Reasoning
- Identify the trend in inflation: it increased initially and then decreased. This is a rise and fall.
- Identify the trend in interest rate: it increased every month, so it rose continuously.
- Compare: the inflation rate changed direction, while the interest rate did not.
- Compare the proportionate changes: the percentage change in the interest rate each month was larger than the percentage change in the inflation rate. This indicates that the interest rate was adjusted more aggressively relative to inflation.
- State both comparisons clearly.
Key Takeaways
- When comparing data series, focus on similarities and differences in trends and magnitudes.
- Avoid simply describing each series separately; make explicit comparative statements.
Common Mistakes
- Describing the inflation rate and interest rate separately without linking them.
- Quoting numbers without interpreting the comparison.
- Only mentioning one comparison when two are required.
Things to Be Careful About
- Use comparative language such as 'whereas', 'while', 'compared to'.
- Ensure the comparisons are accurate based on the data provided.
Explain one reason why using the Consumer Price Index (CPI) to measure the inflation rate in the US may not produce an accurate result.
Answer
One reason is that the CPI is based on a fixed basket of goods and services that represents the average spending patterns of households. However, over time, consumers change their buying habits, for example substituting cheaper products when prices rise. If the basket is not updated frequently enough, it may no longer reflect actual consumption, leading to an overestimation or underestimation of the true inflation rate.
The CPI basket may become outdated as consumer spending patterns change, leading to inaccurate measurement of inflation.
Background Concept
The Consumer Price Index (CPI) measures the average change in prices paid by consumers for a fixed basket of goods and services. It is used to calculate inflation. However, it has limitations because consumer behaviour and product availability change over time.
Understanding the Question
The question asks for one reason why CPI may not produce an accurate result. The mark scheme accepts either the substitution bias (basket becomes unrepresentative) or the infrequent updating of weights. We need to explain the reason clearly.
Approach
Choose one reason and explain it fully. The reason should include the underlying cause and the consequence for accuracy.
Step-by-Step Reasoning
- State that CPI uses a fixed basket based on average household spending.
- Explain that consumer spending patterns change over time (e.g., substitution towards cheaper goods when prices rise).
- If the basket is not updated regularly, it no longer represents what people actually buy.
- Conclude that this leads to an inaccurate measure of the true cost of living and inflation rate.
Key Takeaways
- CPI is a useful but imperfect measure of inflation.
- Common limitations include substitution bias, new product bias, quality change bias, and outlet substitution bias.
- Understanding these limitations is important for interpreting inflation data.
Common Mistakes
- Giving multiple reasons without developing any one fully.
- Confusing CPI with other price indices like RPI or GDP deflator.
- Not explaining why the inaccuracy occurs.
Things to Be Careful About
- Stick to one reason as required.
- Use precise economic terminology (e.g., 'substitution bias', 'basket of goods').
- Relate the explanation to the US context if possible, but not necessary.
‘In an attempt to bring about disinflation, the Federal Reserve used a contractionary monetary policy.’ Consider whether disinflation is more harmful than deflation.
Answer
Disinflation is a fall in the rate of inflation, meaning prices are still rising but at a slower pace. It can reduce the problems of high inflation, such as menu costs and uncertainty, but some inflationary costs remain. Deflation is a fall in the general price level. It can be harmful if caused by a fall in aggregate demand, leading to lower output, higher unemployment, and deferred consumption.
Whether disinflation is more harmful than deflation depends on the severity and duration. A mild disinflation is generally less harmful than a deep deflation that triggers a recession. However, a prolonged disinflation could still damage investment, while a mild deflation from improved productivity might be beneficial. On balance, deflation is typically more harmful because it can lead to a deflationary spiral, whereas disinflation is often a desired outcome of policy.
Deflation is generally more harmful than disinflation because it can lead to a deflationary spiral and recession, while disinflation is often a policy goal to reduce inflation without causing a downturn.
Background Concept
Disinflation refers to a decrease in the rate of inflation; prices are still rising but more slowly. Deflation refers to a sustained fall in the general price level. Both have different causes and consequences. The question asks to consider which is more harmful, requiring an evaluative judgement.
Understanding the Question
The question provides context: the Federal Reserve used contractionary monetary policy to bring about disinflation. The core task is to compare the harm of disinflation versus deflation. The mark scheme awards marks for definitions, effects, and evaluation. A one-sided answer (only discussing one) can only get 2 marks max.
Approach
- Define disinflation and deflation clearly.
- Explain the potential harmful effects of each.
- Evaluate which is more harmful based on criteria such as severity, duration, and economic impact.
- Reach a justified conclusion.
Step-by-Step Reasoning
- Define disinflation: a fall in the inflation rate (e.g., from 5% to 3%). Prices are still rising.
- Explain effects of disinflation: reduces costs of high inflation (menu costs, uncertainty, redistribution), but some costs remain; may be associated with slower growth if caused by demand-side policies.
- Define deflation: a fall in the general price level (negative inflation).
- Explain effects of deflation: if caused by falling AD, leads to lower output, higher unemployment, and a deflationary spiral (consumers delay purchases expecting lower prices, further reducing AD). Can also increase real debt burdens.
- Compare: disinflation is often a policy objective and less disruptive; deflation is typically associated with recession and is harder to escape.
- Evaluate: consider exceptions (e.g., productivity-driven deflation may be benign; severe disinflation could still be painful). Conclude that deflation is generally more harmful.
Key Takeaways
- Disinflation and deflation are distinct concepts.
- Deflation is usually more dangerous for an economy.
- Evaluation requires weighing different scenarios.
Common Mistakes
- Confusing disinflation with deflation.
- Only discussing one side (e.g., only deflation).
- Not providing a conclusion.
- Giving a vague evaluation without criteria.
Things to Be Careful About
- Use precise definitions: disinflation is a slowdown in price increases, not a fall in prices.
- Distinguish between 'good' deflation (supply-side) and 'bad' deflation (demand-side).
- The conclusion should be justified, not just a statement.
Answer
Inevitable case: Higher interest rates increase the cost of borrowing for consumers and firms. Consumer spending on durable goods and investment spending fall, reducing aggregate demand (AD). Additionally, higher interest rates may increase firms' costs, reducing short-run aggregate supply (SRAS). The combined effect shifts AD left and SRAS left, leading to lower real output and higher unemployment, potentially causing a recession. The US data shows interest rates rose from 0.25% in January 2022 to 4.50% in December 2022, a significant increase.
Not inevitable case: The impact depends on the interest elasticity of demand and supply. If consumers and firms are not very responsive to interest rate changes, the fall in AD may be small. Other factors, such as strong consumer confidence or expansionary fiscal policy, could offset the contractionary effect. Moreover, the economy may have been growing strongly, so the interest rate rise only slows growth rather than causing a recession. Time lags mean the full effect may not be felt immediately.
Evaluation: The likelihood of recession depends on the magnitude of the rate increases, the sensitivity of spending, and the state of the economy. Given the rapid and large increases in the US, a recession is possible but not inevitable. The Federal Reserve may pause or reverse rates if recession risks become severe. Therefore, while higher interest rates increase the risk of recession, they do not make it inevitable.
Conclusion: Increases in the interest rate do not make a recession inevitable because the outcome depends on elasticity, other policies, and economic conditions. However, the aggressive tightening in the US made a recession more likely.
Increases in the interest rate do not make a recession inevitable; the outcome depends on interest elasticity, other factors, and policy responses, but they significantly increase the risk.
Background Concept
Monetary policy transmission mechanism: higher interest rates reduce borrowing and spending, decreasing AD. Also, higher rates can increase firms' costs, reducing SRAS. A recession is a significant decline in economic activity. The question asks whether such a recession is inevitable given the interest rate increases.
Understanding the Question
The question is from a data-response context: the US Federal Reserve raised interest rates sharply. The command word 'assess' requires a two-sided analysis and a conclusion. The mark scheme allocates up to 4 marks for analysis (both sides) and up to 2 marks for evaluation (including 1 for conclusion).
Approach
- Present the case for inevitability: explain the chain of reasoning from higher interest rates to lower AD and AS, leading to recession.
- Present the case against inevitability: explain why the effect may be muted (elasticity, other factors, time lags).
- Evaluate by weighing the factors: magnitude of rate increases, state of the economy, policy responses.
- Conclude with a justified judgement on inevitability.
Step-by-Step Reasoning
- Inevitable side:
- Higher interest rates increase cost of borrowing for consumers (mortgages, credit cards) and firms (loans for investment).
- Consumption and investment fall, shifting AD left.
- Higher rates may also increase firms' financing costs, shifting SRAS left (cost-push).
- Leftward shifts in AD and SRAS reduce real GDP and increase unemployment, potentially causing a recession.
- Use data: interest rates rose from 0.25% to 4.50% in 2022, a substantial increase.
- Not inevitable side:
- Interest elasticity of demand: if consumers and firms are not sensitive to rates (e.g., essential spending, long-term contracts), the fall in AD may be small.
- Other factors can offset: strong consumer confidence, rising incomes, expansionary fiscal policy (e.g., tax cuts), or external demand.
- The economy may have been above potential, so a slowdown is not necessarily a recession.
- Time lags: the full effect of rate hikes takes 12-18 months; the economy may adjust.
- Evaluation:
- The magnitude of rate increases in the US was large and rapid, increasing the likelihood of a recession.
- However, the US economy was strong, and the Fed may adjust policy if recession risks materialise.
- The outcome is not inevitable; it depends on the balance of these factors.
- Conclusion: Higher interest rates make a recession more likely but not inevitable.
Key Takeaways
- Monetary policy affects the economy through AD and AS channels.
- The impact of interest rate changes is not automatic; it depends on elasticities and other conditions.
- 'Assess' questions require a balanced argument and a clear conclusion.
Common Mistakes
- Only presenting one side (inevitable or not inevitable).
- Not using the data from the extract (e.g., specific interest rate figures).
- Failing to provide a conclusion or giving a vague one.
- Confusing recession with slowdown.
Things to Be Careful About
- Use the extract's data to support the analysis.
- Distinguish between a recession (negative growth) and a slowdown (lower but still positive growth).
- The conclusion should directly answer the question of inevitability.
Assess whether the Federal Reserve setting an inflation target as part of its monetary policy is likely to be helpful for the US economy.
Answer
Helpful aspects: An inflation target provides a clear nominal anchor for monetary policy. It helps shape inflation expectations, making it easier to maintain price stability. If households and firms expect low inflation, wage demands and price-setting behaviour become more moderate, reducing the risk of a wage-price spiral. The target also increases the accountability and transparency of the Federal Reserve, which can enhance credibility and confidence in the economy.
Unhelpful aspects: A rigid inflation target may force the Federal Reserve to raise interest rates aggressively even when the economy is weak, potentially causing a recession. The target may be difficult to achieve in the short run due to supply shocks (e.g., energy prices). Moreover, the Federal Reserve has a dual mandate (price stability and maximum employment), and an exclusive focus on inflation could conflict with employment objectives. The balancing act may lead to policy mistakes.
Evaluation: The helpfulness of an inflation target depends on its design (e.g., a range rather than a point, flexibility to respond to shocks) and the credibility of the central bank. In the US context, the Federal Reserve's flexible inflation targeting (average inflation targeting) allows some leeway. Given the recent high inflation, a target has been useful in guiding policy and expectations. However, the risk of recession from over-tightening remains.
Conclusion: Setting an inflation target is likely to be helpful for the US economy as it provides a framework for credible monetary policy and anchors expectations, but its success depends on flexible implementation and consideration of other macroeconomic objectives.
An inflation target is likely to be helpful as it anchors expectations and provides policy credibility, but its effectiveness depends on flexible implementation and balancing with other objectives.
Background Concept
Inflation targeting is a monetary policy framework where the central bank sets a specific inflation rate as its primary goal. The Federal Reserve adopted a flexible form of inflation targeting (average inflation targeting) in 2020. The question asks whether this is helpful for the US economy.
Understanding the Question
The question is from a data-response context about US inflation and interest rates. The command word 'assess' requires a two-sided analysis and a conclusion. The mark scheme allocates up to 4 marks for analysis (helpful and unhelpful) and up to 2 marks for evaluation (including 1 for conclusion).
Approach
- Present the helpful aspects: anchoring expectations, credibility, transparency, preventing wage-price spiral.
- Present the unhelpful aspects: rigidity, conflict with employment mandate, risk of recession, difficulty with supply shocks.
- Evaluate by considering the design of the target (flexibility), the economic context, and trade-offs.
- Conclude with a justified judgement on whether it is likely to be helpful.
Step-by-Step Reasoning
- Helpful:
- An inflation target provides a clear goal, guiding policy decisions.
- It anchors inflation expectations: if people believe the central bank will achieve the target, they adjust their behaviour accordingly, making it easier to maintain low inflation.
- It increases accountability: the central bank can be judged against the target.
- It can prevent a wage-price spiral: if workers expect low inflation, they demand smaller wage increases, keeping costs down.
- Unhelpful:
- A rigid target may force the central bank to tighten policy even during a recession, worsening the downturn.
- Supply shocks (e.g., oil price rises) can push inflation above target temporarily; strict adherence would require contractionary policy that harms output.
- The Federal Reserve has a dual mandate; focusing solely on inflation may neglect employment.
- The target may be difficult to achieve precisely, leading to loss of credibility if missed.
- Evaluation:
- The US uses flexible average inflation targeting, which allows inflation to run above target for a time to compensate for periods below target. This reduces the risk of excessive tightening.
- The recent high inflation made the target useful as a communication tool to signal commitment to price stability.
- However, the trade-off between inflation and employment remains; the Fed must balance both.
- Conclusion: On balance, an inflation target is helpful because it provides a framework that enhances credibility and anchors expectations, but its success depends on flexible implementation and consideration of other objectives.
Key Takeaways
- Inflation targeting is a common monetary policy framework.
- It has benefits for credibility and expectations but also potential drawbacks.
- 'Assess' questions require a balanced argument and a clear conclusion.
Common Mistakes
- Only discussing one side (helpful or unhelpful).
- Not relating the analysis to the US context (e.g., the Federal Reserve's specific approach).
- Failing to provide a conclusion or giving a vague one.
- Confusing inflation targeting with other policy rules.
Things to Be Careful About
- Distinguish between a strict target and a flexible target.
- Mention the dual mandate of the Federal Reserve.
- Use the extract's context (high inflation, interest rate increases) to support the analysis.
With the help of a diagram, explain the reasons for a movement within a production possibility curve (PPC) and a shift of a PPC and consider the extent to which opportunity cost determines the shape of a PPC.
Answer
A production possibility curve (PPC) shows the maximum combinations of two goods an economy can produce given its resources and technology.
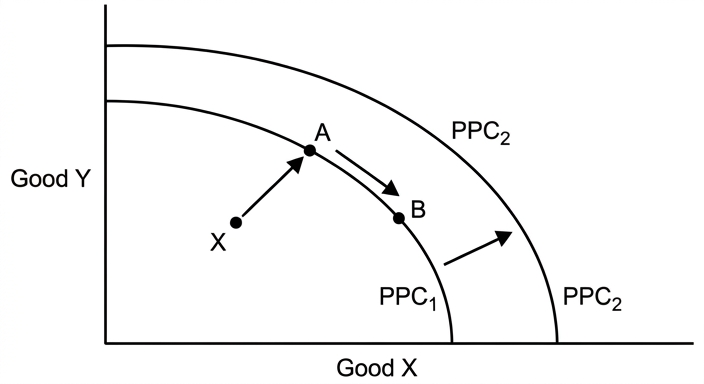
Movement within a PPC: A movement from a point inside the PPC to a point on the PPC (or along the PPC) is caused by a reallocation of existing resources. For example, moving from point X inside to point A on the curve uses unemployed resources more efficiently. A movement along the PPC (e.g., from A to B) involves reallocating resources from one good to another, incurring an opportunity cost (the amount of the other good forgone).
Shift of a PPC: An outward shift of the PPC (from PPC1 to PPC2) is caused by an increase in the quantity or quality of resources (land, labour, capital, enterprise) or an improvement in technology. This allows more of both goods to be produced, so opportunity cost is not involved in the shift itself.
Opportunity cost and the shape of the PPC: The shape of the PPC is determined by opportunity cost. If opportunity cost is constant (resources are equally suited to producing both goods), the PPC is a straight line. If opportunity cost is increasing (resources are not equally suited), the PPC is concave to the origin, reflecting that as more of one good is produced, the opportunity cost in terms of the other good rises. Therefore, opportunity cost determines the shape to a large extent. However, the position of the PPC (its distance from the origin) is determined by the quantity and quality of resources and technology, not by opportunity cost. So while opportunity cost explains the curvature, it does not determine the location of the curve.
Conclusion: Opportunity cost is the key factor determining the shape of the PPC, but the extent is limited to the curvature; the position is determined by resource availability and technology.
Opportunity cost determines the shape of the PPC (constant vs increasing), but not its position; thus the extent is that shape is fully determined by opportunity cost, while shifts are caused by resource/technology changes.
Background Concept
A production possibility curve (PPC) illustrates the fundamental economic problem of scarcity and choice. It shows the maximum possible output combinations of two goods that an economy can produce when all resources are fully and efficiently employed. The curve is typically concave to the origin due to increasing opportunity cost: as more of one good is produced, resources that are less suited to that good are used, so the opportunity cost in terms of the other good rises. A straight-line PPC represents constant opportunity cost, which is rare in reality.
Understanding the Question
This question has two parts: first, explain the reasons for a movement within a PPC and a shift of a PPC; second, consider the extent to which opportunity cost determines the shape of a PPC. The command word "explain" requires a clear chain of reasoning, and "consider the extent" requires evaluation. The question explicitly asks for a diagram, so a correctly labelled PPC diagram is essential for AO1 marks. The mark scheme awards up to 3 marks for knowledge (diagram labels), 3 for analysis (reasons for movement and shift), and 2 for evaluation (judgement on opportunity cost and shape).
Approach
Start by drawing a PPC diagram with correct labels. Then explain that a movement within the PPC (from inside to on the curve, or along the curve) is due to reallocation of resources, and a shift is due to changes in resource quantity/quality or technology. For the evaluation, distinguish between constant and increasing opportunity cost and how they affect shape. Conclude that opportunity cost determines shape but not position.
Step-by-Step Reasoning
-
Diagram: Draw axes for Good Y and Good X. Draw a concave PPC. Label points: inside point X (unemployment/inefficiency), point A on the curve (efficient), point B further along (different combination). Draw a second PPC outward. Label all curves and axes. This earns AO1 marks.
-
Movement within PPC: Explain that moving from X to A uses unemployed resources, so no opportunity cost (more of both goods). Moving from A to B along the curve reallocates resources, so opportunity cost arises (less of Good Y to get more Good X). This is analysis.
-
Shift of PPC: An outward shift occurs when the economy's productive capacity increases. This can be due to an increase in the quantity of factors (e.g., more labour, new land) or an improvement in quality (e.g., better education, technology). The shift allows more of both goods, so no opportunity cost is involved in the shift itself (the economy can have more of both). This is analysis.
-
Opportunity cost and shape: The shape of the PPC reflects the nature of opportunity cost. If all resources are equally productive in both goods, opportunity cost is constant, and the PPC is a straight line. If resources are specialised, opportunity cost increases as more of one good is produced, giving a concave shape. Thus, opportunity cost determines the shape. However, the position (how far out the curve is) depends on the total quantity and quality of resources, not on opportunity cost. So the extent is that shape is fully determined by opportunity cost, but the location is not.
-
Evaluation: The question asks "consider the extent". A strong answer will acknowledge that while opportunity cost is crucial for shape, it does not affect the position. Also, note that in reality, most PPCs are concave due to increasing opportunity cost, so opportunity cost is a key determinant. But the extent is limited to shape; shifts are caused by other factors.
Key Takeaways
- A PPC diagram must be correctly labelled to earn marks.
- Movement within a PPC involves reallocation; shift involves changes in resources/technology.
- Opportunity cost determines the curvature (constant vs increasing), not the position.
- Evaluation requires a balanced judgement on the extent.
Common Mistakes
- Drawing a PPC without labels on axes or curves.
- Confusing movement along the curve with shift of the curve.
- Stating that a shift involves opportunity cost (it does not, because more of both goods can be produced).
- Not addressing the "extent" part of the question, i.e., only describing shape without evaluating how much opportunity cost determines it.
- Forgetting to include a diagram when required.
Things to Be Careful About
- Ensure the diagram is fully explained in the text.
- Use correct terminology: "reallocation of resources" for movement, "increase in quantity/quality of resources or technology" for shift.
- In the evaluation, clearly state that opportunity cost determines shape but not position, and conclude on the extent.
Assess whether a shift to the right of a PPC is only caused by an increase in the quantity of resources.
Introduction
A production possibility curve (PPC) shows the maximum combinations of two goods an economy can produce. A shift to the right (outward) indicates an increase in productive capacity. The question asks whether such a shift is only caused by an increase in the quantity of resources. This essay argues that while an increase in the quantity of resources is one cause, improvements in the quality of resources and technological change are equally important, and often more significant in the long run.
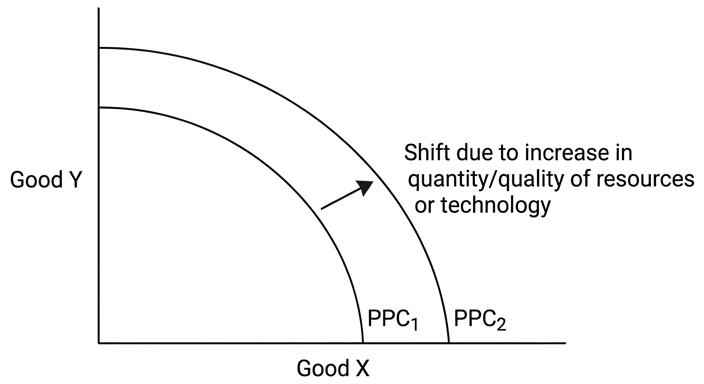
The case that an increase in the quantity of resources causes a shift
An increase in the quantity of factors of production – land, labour, capital, and enterprise – directly expands the economy's ability to produce. For example, a growing population increases the labour force; discovery of new natural resources adds to land; investment in physical capital increases the stock of machinery. With more inputs, the economy can produce more of all goods, shifting the PPC outward. This is a straightforward and intuitive cause.
The case that other factors also cause a shift
However, a shift to the right can also occur without any increase in the quantity of resources. Improvements in the quality of resources, such as better education and training (human capital), enhance labour productivity, allowing more output per worker. Similarly, technological advancements – new production methods, better machinery, improved organisation – enable more efficient use of existing resources. These factors increase the economy's productive capacity without requiring additional quantities of inputs. For instance, the Industrial Revolution dramatically shifted PPCs outward through technological innovation, not just population growth.
Evaluation
Both quantity and quality/technology are important causes. In the short run, quantity increases (e.g., new oil fields) can cause rapid shifts. In the long run, however, quality improvements and technological progress are more sustainable and often drive continuous growth. Developed economies rely heavily on innovation and human capital to shift their PPCs, while developing economies may initially benefit from increasing resource quantity. The question uses the word "only", which is too restrictive. A shift to the right can be caused by any combination of these factors. Therefore, it is not only caused by an increase in the quantity of resources.
Conclusion
A shift to the right of a PPC is not solely caused by an increase in the quantity of resources; improvements in the quality of resources and technological change are also significant causes. The relative importance varies, but the statement is false as it stands.
No, a shift to the right of a PPC is not only caused by an increase in the quantity of resources; improvements in the quality of resources and technological change are also important causes.
Background Concept
The PPC is a fundamental tool to illustrate scarcity and choice. A shift to the right represents economic growth – an increase in the economy's ability to produce goods and services. This can come from either more inputs (extensive growth) or better use of existing inputs (intensive growth). The question tests understanding of the causes of such shifts.
Understanding the Question
The question asks to "assess whether a shift to the right of a PPC is only caused by an increase in the quantity of resources." The command word "assess" requires a balanced evaluation and a justified conclusion. The mark scheme is levels-based, with AO1+AO2 out of 8 and AO3 out of 4. The top band requires detailed knowledge, developed analysis, and a justified conclusion. The indicative content mentions quantity, quality, and technology. The evaluation should weigh the relative importance and conclude that it is not only quantity.
Approach
First, define PPC and shift. Then present the argument that quantity is a cause. Then present the counter-argument that quality and technology are also causes. Evaluate by comparing their significance in different contexts. Conclude that the statement is false because multiple factors cause shifts.
Step-by-Step Reasoning
-
Define PPC and shift: Explain that a PPC shows maximum output combinations. A rightward shift means the economy can produce more of both goods.
-
Quantity of resources: Explain how an increase in any factor (land, labour, capital, enterprise) increases productive capacity. Use examples: population growth, new mineral discoveries, investment in factories. This is a valid cause.
-
Quality of resources: Explain that better education, training, and health improve labour productivity. Similarly, better management and organisation increase efficiency. These allow more output without increasing quantity. Example: a more skilled workforce can produce more with the same number of workers.
-
Technological change: New inventions and innovations improve production methods. This can be embodied in new capital goods or new processes. Example: the internet revolution increased productivity across many sectors.
-
Evaluation: Compare the three causes. Quantity increases may be limited by resource availability; quality and technology can provide sustained growth. In developed economies, technological progress is the main driver. In developing economies, quantity increases (e.g., more labour) may be more significant initially. The word "only" is too strong; all three are causes. Therefore, the statement is false.
-
Conclusion: A justified conclusion that a shift to the right is not only caused by an increase in the quantity of resources; quality and technology are also important.
Key Takeaways
- PPC shifts can result from both quantitative and qualitative changes.
- "Only" in the question signals that the answer must challenge the exclusivity.
- Evaluation requires comparing the importance of different factors.
- A diagram can illustrate the shift but is not required; if used, it must be explained.
Common Mistakes
- Only discussing quantity and ignoring quality/technology.
- Failing to evaluate the relative importance.
- Providing a one-sided answer (only quantity or only quality).
- Not reaching a clear conclusion.
- Using a diagram without explanation.
Things to Be Careful About
- The question says "only caused by an increase in the quantity of resources." So the answer must address the exclusivity.
- Use specific examples to support points.
- Ensure the conclusion directly answers the question: "No, it is not only caused by..."
- The essay should be well-organised with clear paragraphs.
With the help of a diagram, explain how changes in a subsidy can influence the price and quantity sold of a product in a market and consider how expenditure on a subsidy is affected by the price elasticity of demand for the product.
Answer
Diagram
Explanation
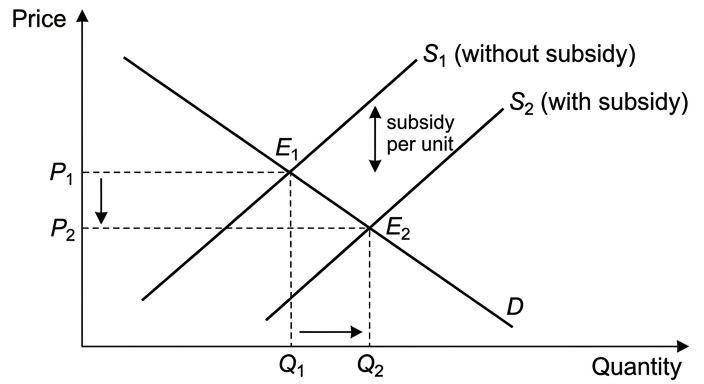
A subsidy is a payment by the government to producers, reducing their costs of production. An increase in the subsidy shifts the supply curve to the right (from S1 to S2). This leads to a lower equilibrium price (from P1 to P2) and a higher equilibrium quantity (from Q1 to Q2). A decrease in the subsidy would shift supply leftwards, raising price and reducing quantity.
Evaluation
The total expenditure on the subsidy equals the subsidy per unit multiplied by the quantity sold. If demand is price elastic, the percentage increase in quantity is greater than the percentage fall in price, so total subsidy expenditure rises. If demand is price inelastic, the quantity increase is proportionally smaller, so total expenditure may fall. Therefore, the impact of a subsidy on government spending depends on the price elasticity of demand for the product.
A subsidy lowers price and raises quantity; the effect on subsidy expenditure depends on PED: elastic demand increases expenditure, inelastic demand reduces it.
Background Concept
A subsidy is a form of government intervention in markets, typically used to encourage consumption of merit goods or support producers. It reduces the cost of production, shifting the supply curve rightwards. The price elasticity of demand (PED) measures the responsiveness of quantity demanded to a change in price. PED is crucial for determining the impact of a subsidy on market outcomes and government expenditure.
Understanding the Question
This question asks you to explain how changes in a subsidy affect price and quantity, using a diagram. It then requires you to consider how the government's expenditure on the subsidy is influenced by the price elasticity of demand. The command words are 'explain' (AO1/AO2) and 'consider' (AO3). You must provide a diagram, explain the mechanism, and evaluate the role of PED.
Approach
Start by defining a subsidy and drawing the standard diagram. Show an increase in subsidy shifting supply rightwards, leading to lower price and higher quantity. Then explain the effect of a decrease. For the evaluation, consider how the total subsidy expenditure (subsidy per unit × quantity) changes with PED. Use the concept of elastic vs inelastic demand to compare the proportional changes in price and quantity.
Step-by-Step Reasoning
-
Diagram: Draw a demand and supply diagram. Label axes: Price (vertical) and Quantity (horizontal). Draw a downward-sloping demand curve D and an upward-sloping supply curve S1. Mark initial equilibrium E1 at price P1 and quantity Q1. Then draw a new supply curve S2 to the right of S1, representing an increase in subsidy. The vertical distance between S1 and S2 is the subsidy per unit. Mark new equilibrium E2 at lower price P2 and higher quantity Q2.
-
Explanation of subsidy increase: The subsidy reduces producers' costs, so they are willing to supply more at each price. The supply curve shifts right. At the original price, there is excess supply, so price falls until a new equilibrium is reached. Consumers pay a lower price, and quantity traded increases.
-
Explanation of subsidy decrease: A reduction in subsidy increases costs, shifting supply leftwards, raising price and reducing quantity.
-
Evaluation of subsidy expenditure: Government expenditure on the subsidy = subsidy per unit × quantity sold. When demand is price elastic (PED > 1), the percentage increase in quantity is larger than the percentage fall in price, so total expenditure rises. When demand is price inelastic (PED < 1), the quantity increase is small relative to the price fall, so total expenditure may fall. If demand is unit elastic, expenditure remains unchanged.
Key Takeaways
- Subsidies shift supply, lowering price and increasing quantity.
- The effect on government expenditure depends on PED.
- Elastic demand leads to higher subsidy expenditure; inelastic demand leads to lower expenditure.
- Diagrams must be fully labelled and explained.
Common Mistakes
- Drawing the subsidy as a shift in demand instead of supply.
- Forgetting to label axes and curves.
- Not explaining the diagram in words.
- Treating the evaluation as a simple statement without linking to PED.
- Confusing subsidy expenditure with consumer expenditure.
Things to Be Careful About
- Ensure the diagram shows the correct shift direction.
- Clearly state that the subsidy per unit is the vertical distance between supply curves.
- In the evaluation, explicitly state the relationship between PED and total expenditure.
- Use correct terminology: 'price elasticity of demand', 'subsidy expenditure'.
Assess whether an increase in the tax on a demerit good is always the best way to reduce the consumption of such a product.
Introduction
A demerit good is a good that is over-consumed due to imperfect information about its negative effects, such as cigarettes or alcohol. An indirect tax increases the price of the good, aiming to reduce consumption. This essay assesses whether such a tax is always the best method to reduce consumption of a demerit good.
Advantages of an increase in tax
An increase in indirect tax shifts the supply curve leftwards, raising the market price. If demand is price elastic, the quantity demanded falls significantly, reducing consumption. The tax also generates government revenue, which can be used to fund health education or treatment of related harms. It is a relatively simple policy to implement and can be targeted at specific goods.
Limitations of an increase in tax
If demand for the demerit good is price inelastic (e.g., addictive goods like cigarettes), the tax increase leads to only a small reduction in consumption. The tax may be regressive, disproportionately affecting low-income consumers. Alternatives such as information campaigns, minimum prices, or outright bans may be more effective in some cases. Additionally, high taxes can encourage black markets, undermining the policy.
Evaluation
The effectiveness of a tax depends on the price elasticity of demand. For goods with elastic demand (e.g., sugary drinks), a tax can significantly reduce consumption. For inelastic goods, complementary policies like education and smoking bans are needed. The 'best' method also depends on government objectives: if revenue generation is important, a tax may be preferred; if reducing consumption is the sole aim, a ban might be more effective. However, bans can be costly to enforce and may lead to illegal markets. Information campaigns address the root cause of imperfect information but may have delayed effects.
Conclusion
An increase in tax on a demerit good is not always the best way to reduce consumption. Its effectiveness is limited when demand is inelastic, and alternative policies may be more appropriate in certain contexts. A combination of policies, including tax, information, and regulation, is often the most effective approach to reducing consumption of demerit goods.
An increase in tax on a demerit good is not always the best way; its effectiveness depends on price elasticity of demand and the availability of alternative policies. A combination of policies is often more effective.
Background Concept
Demerit goods are goods that are over-consumed because consumers underestimate the long-term costs (e.g., health risks). Examples include cigarettes, alcohol, and gambling. Governments intervene to reduce consumption using policies such as taxes, information campaigns, minimum prices, and bans. An indirect tax increases the price, aiming to reduce quantity demanded. The price elasticity of demand (PED) determines how much consumption falls. Other policies target the information failure directly.
Understanding the Question
The question asks you to 'assess whether an increase in the tax on a demerit good is always the best way to reduce the consumption of such a product.' The command word 'assess' requires a balanced discussion of advantages and disadvantages, and a justified conclusion. The word 'always' indicates that you should consider conditions under which a tax might not be the best method. You need to evaluate the tax against alternative policies.
Approach
Start by defining demerit goods and the purpose of the tax. Then present the case for the tax: how it works, its benefits. Then present the limitations: inelastic demand, regressive effects, alternatives. In the evaluation, weigh the factors: PED, government objectives, effectiveness of alternatives. Conclude with a justified judgement that answers the question directly.
Step-by-Step Reasoning
-
Define demerit good and tax: A demerit good is over-consumed due to imperfect information. An indirect tax (e.g., excise duty) increases the price, reducing consumption if demand is elastic.
-
Advantages of tax:
- Shifts supply left, raising price.
- If PED > 1, consumption falls significantly.
- Generates revenue for government to address negative externalities.
- Easy to implement and enforce.
-
Limitations of tax:
- If PED < 1 (e.g., addictive goods), consumption falls only slightly.
- Regressive: low-income consumers spend a larger proportion of income on the good.
- Alternatives may be more effective: information campaigns correct the information failure; minimum prices prevent cheap sales; bans eliminate consumption but may create black markets.
- High taxes can lead to smuggling and illegal production.
-
Evaluation:
- The effectiveness of a tax depends on PED. For elastic goods, tax is effective; for inelastic goods, it is not.
- The 'best' method depends on the specific good and government priorities. If revenue is needed, tax is good; if consumption reduction is paramount, a ban might be better but has enforcement costs.
- Information campaigns address the root cause but take time and may not change behaviour.
- A combination of policies often works best: tax to raise price, information to change preferences, and regulation to limit availability.
-
Conclusion: A tax is not always the best way. It is most effective when demand is elastic and when combined with other policies. The answer should state that it depends on the context.
Key Takeaways
- Demerit goods are over-consumed due to imperfect information.
- Tax increases price and reduces consumption, but effectiveness depends on PED.
- Alternatives include information campaigns, minimum prices, and bans.
- A balanced evaluation must consider both sides and reach a justified conclusion.
- The word 'always' requires you to identify conditions where the statement does not hold.
Common Mistakes
- One-sided answer: only discussing advantages or disadvantages.
- No conclusion or a vague conclusion.
- Ignoring the role of PED.
- Not considering alternative policies.
- Descriptive rather than analytical: listing points without developing the reasoning.
- Failing to address the 'always' aspect.
Things to Be Careful About
- Ensure the essay is balanced: give equal weight to both sides.
- Use economic terminology: price elasticity of demand, indirect tax, demerit good, information failure.
- Develop each point with a chain of reasoning.
- The conclusion must be justified and directly answer the question.
- Avoid making value judgements without economic reasoning.
Explain how the circular flow of income in an economy changes when that economy moves from a closed to an open economy and consider what determines the extent of the change.
Answer
AO1 Knowledge and understanding
In a closed economy, the circular flow of income consists of income flowing from firms to households (factor payments: wages, rent, interest, profit) and then from households back to firms (spending on goods and services). The only injections into this flow are investment (I) and government spending (G), while the only withdrawals (leakages) are savings (S) and taxes (T). Equilibrium occurs when total injections equal total withdrawals.
AO2 Analysis
When the economy opens to international trade, exports (X) become an additional injection into the circular flow, and imports (M) become an additional withdrawal. The circular flow expands if X > M (a net injection) and contracts if M > X (a net withdrawal). The change from a closed to an open economy therefore alters the equilibrium condition to: I + G + X = S + T + M. The size of the change depends on the magnitude of trade flows relative to the size of the economy.
AO3 Evaluation
The extent of the change is determined by:
- The degree of openness of the economy (the ratio of exports and imports to GDP).
- The marginal propensity to import (MPM): a higher MPM means a larger share of any increase in income is spent on imports, increasing the withdrawal.
- The price and income elasticities of demand for exports and imports, which affect the responsiveness of trade flows to changes in income or exchange rates.
- The size of the multiplier effect, which amplifies the impact of any net injection or withdrawal.
In conclusion, the extent of the change depends primarily on the openness of the economy and the responsiveness of trade flows, with more open economies experiencing larger changes in the circular flow.
The extent of the change depends on the openness of the economy, the marginal propensity to import, and the elasticities of demand for exports and imports.
Background Concept
The circular flow of income is a model that shows the flow of money between households and firms in an economy. Income is generated when firms pay households for factor services (land, labour, capital, enterprise). This income is then spent on goods and services produced by firms, creating a circular flow. In a closed economy, there is no foreign sector. Injections are additions to the circular flow (I and G) that increase spending, while withdrawals (S and T) remove spending. Equilibrium occurs when injections equal withdrawals.
Understanding the Question
This question asks you to explain how the circular flow changes when an economy moves from closed to open. The key addition is the foreign sector: exports and imports. You must also consider what determines the extent of the change. The command word "explain" requires a clear description and analysis of the mechanism. The phrase "and consider" indicates a short evaluation (AO3) – you need to identify factors that influence the size of the impact, not just state that it changes.
Approach
First, recall the circular flow in a closed economy: list the injections and withdrawals. Then, for an open economy, add exports as an injection and imports as a withdrawal. Explain how the equilibrium condition changes. For the evaluation, think about what makes the trade sector more or less significant: the size of trade flows, the propensity to import, and elasticities. Provide a conclusion that summarises the key determinants.
Step-by-Step Reasoning
-
Define the circular flow in a closed economy: Households supply factors of production to firms and receive income (wages, rent, interest, profit). They spend this income on goods and services, which returns to firms as revenue. The government and investment sectors add injections (G and I) and withdrawals (S and T). Equilibrium: I + G = S + T.
-
Introduce the foreign sector: In an open economy, exports (X) are spending by foreigners on domestic goods, so they add to the circular flow. Imports (M) are spending by domestic residents on foreign goods, so they remove spending from the flow. The new equilibrium condition: I + G + X = S + T + M.
-
Analyse the change: If X > M, there is a net injection, which increases national income if the economy is below full capacity. If M > X, there is a net withdrawal, which reduces income. The magnitude of the change depends on the size of the trade imbalance relative to the economy.
-
Evaluate the determinants:
- Openness: A larger trade sector (higher X+M/GDP) means a bigger impact.
- Marginal propensity to import (MPM): The fraction of additional income spent on imports. A higher MPM means a larger leakage from the circular flow, reducing the multiplier effect.
- Elasticities: If demand for exports is price elastic, a change in the exchange rate will have a larger effect on export revenue. Similarly, income elasticity of demand for imports affects how much imports rise as income grows.
- Multiplier effect: The size of the multiplier (1/(1-MPC+MPM)) determines how much an initial injection or withdrawal is amplified. A higher MPM reduces the multiplier.
-
Conclusion: The extent of the change is not fixed; it depends on structural characteristics of the economy. The most important factor is the degree of openness and the responsiveness of trade flows to income and price changes.
Key Takeaways
- The circular flow model helps visualise the impact of the foreign sector on national income.
- Exports are injections, imports are withdrawals.
- The equilibrium condition changes from I+G=S+T to I+G+X=S+T+M.
- The extent of the change depends on the size of trade flows, the marginal propensity to import, and elasticities.
Common Mistakes
- Only describing the circular flow in a closed economy without discussing the change to an open economy (AO2 max 2 marks).
- Confusing injections and withdrawals: remember exports are an injection, imports a withdrawal.
- Forgetting the evaluation part: some candidates only explain the change but do not consider what determines the extent.
- Providing a one-sided evaluation: the mark scheme requires a valid judgement and conclusion.
Things to Be Careful About
- Clearly label the injections and withdrawals for both closed and open economies.
- Use the correct terminology: injections, withdrawals, leakages.
- In the evaluation, mention specific determinants rather than vague statements.
- Ensure the conclusion directly answers the "consider what determines the extent" part.
Assess whether the potential benefits of free trade always outweigh the arguments for protectionism.
Introduction
Free trade refers to the exchange of goods and services between countries without government restrictions such as tariffs, quotas, or subsidies. The theory of comparative advantage suggests that free trade allows countries to specialise in what they do best, leading to a more efficient allocation of resources and higher global output. However, protectionism – the use of trade barriers to shield domestic industries – is often argued for on various grounds. This essay assesses whether the potential benefits of free trade always outweigh the arguments for protectionism.
Benefits of free trade
- Specialisation and efficiency: According to comparative advantage, countries specialise in producing goods where they have a lower opportunity cost. This leads to a more efficient use of resources and an increase in world output. For example, a country with a comparative advantage in agriculture can produce food more efficiently, while another focuses on manufacturing.
- Lower prices and greater choice for consumers: Free trade increases competition, which can reduce prices and improve quality. Consumers gain access to a wider variety of products from around the world.
- Economic growth and higher living standards: Trade allows countries to access larger markets, enabling economies of scale. This can boost productivity, investment, and economic growth. Historically, countries that have embraced free trade, such as the East Asian economies, have experienced rapid growth.
- Transfer of technology and knowledge: Trade facilitates the spread of ideas, technology, and management practices, which can improve productivity and innovation.
Arguments for protectionism
- Infant industry argument: New industries in developing countries may not be able to compete with established foreign firms. Temporary protection allows them to grow and achieve economies of scale, after which they can compete without protection. For example, many countries protected their automobile industries initially.
- Declining industries (sunset industries): Protection can give time for workers and capital to move to other sectors, avoiding sudden unemployment and social disruption.
- Strategic industries: Industries such as defence, energy, and food security may be protected to ensure self-sufficiency in times of crisis.
- Anti-dumping: Dumping occurs when foreign firms sell goods below cost to capture market share. Protection can prevent unfair competition.
- Protection of domestic employment: In the short run, free trade can lead to job losses in import-competing industries. Protectionism may preserve jobs, but at the cost of higher prices for consumers.
- Current account deficit: Protectionism can be used to reduce a trade deficit by restricting imports.
Evaluation
The benefits of free trade are well-established in economic theory and have been supported by empirical evidence of growth and poverty reduction. However, the arguments for protectionism are not without merit. The infant industry argument is particularly relevant for developing countries, but protection must be temporary and targeted; otherwise, it can lead to inefficiency and rent-seeking. Strategic industries may justify protection for national security, but these are often a small part of the economy. Anti-dumping measures can address unfair practices, but they can also be misused as disguised protectionism.
The key question is whether the benefits of free trade always outweigh the arguments for protectionism. The answer is not absolute. In the short run, the costs of adjustment – such as job losses and structural unemployment – can be significant, and protectionism may be a politically necessary cushion. However, in the long run, free trade tends to raise overall welfare and growth. The net benefit depends on the specific context: the stage of development, the nature of the industry, and the availability of alternative policies (e.g., retraining programmes, social safety nets) to address the costs of adjustment.
Conclusion
While the theoretical case for free trade is strong and its benefits in terms of efficiency, growth, and consumer welfare are substantial, the claim that these benefits always outweigh the arguments for protectionism is too sweeping. In certain circumstances, such as protecting infant industries or strategic sectors, temporary protection may be justified and can lead to long-term benefits. However, protectionism should be used sparingly and with clear exit strategies, because it typically reduces overall welfare compared to free trade. Therefore, the benefits of free trade generally outweigh the arguments for protectionism, but not always – the correct answer depends on the specific economic and political context.
The benefits of free trade generally outweigh the arguments for protectionism, but not always; the outcome depends on the specific context, such as the stage of development and the nature of the industry.
Background Concept
Free trade is the absence of barriers to trade between countries. The theory of comparative advantage, developed by David Ricardo, shows that even if one country is less efficient in producing all goods, it still benefits from trade by specialising in the good where its absolute disadvantage is smallest (i.e., where it has a comparative advantage). This leads to a more efficient allocation of resources and higher total output. Protectionism involves government measures to restrict trade, such as tariffs (taxes on imports), quotas (limits on quantity), subsidies to domestic industries, and non-tariff barriers.
Understanding the Question
The question requires you to assess whether the potential benefits of free trade always outweigh the arguments for protectionism. The word "always" is an absolute claim; you need to challenge it. The command word "Assess" means you must provide a balanced evaluation and reach a justified conclusion. The mark scheme's Level 3 for AO1/AO2 requires detailed explanations supported by examples, and Level 2 for AO3 requires a justified conclusion and developed evaluative comments.
Approach
Structure your answer as follows:
- Introduction: define free trade and protectionism, state the question.
- Present the benefits of free trade in detail, with examples.
- Present the arguments for protectionism in detail, with examples.
- Evaluate: weigh the two sides, consider the context (short run vs long run, developed vs developing countries, alternative policies).
- Conclusion: answer the question directly, explaining under what conditions free trade benefits may or may not outweigh protectionism.
Step-by-Step Reasoning
-
Benefits of free trade:
- Specialisation according to comparative advantage increases world output. For example, Portugal has a comparative advantage in wine, England in cloth – both gain from trade.
- Consumers benefit from lower prices and greater variety. Competition forces firms to be efficient.
- Trade allows economies of scale, leading to lower average costs.
- Access to larger markets stimulates investment and innovation.
- Empirical evidence: countries that have opened up to trade (e.g., China, South Korea) have experienced rapid economic growth and poverty reduction.
-
Arguments for protectionism:
- Infant industry: New industries need protection from established foreign competitors. Example: South Korea protected its steel industry in the 1960s, which later became globally competitive. However, protection must be temporary and not lead to inefficiency.
- Sunset industries: Protection can ease the transition for workers and capital. For example, the EU provides temporary protection for its steel industry to allow restructuring.
- Strategic industries: Defence, energy, food security – reliance on imports may be risky. Example: Japan protects its rice industry for food security.
- Anti-dumping: Dumping is selling at below cost to drive competitors out of business. Tariffs can offset the unfair advantage. Example: US anti-dumping duties on Chinese steel.
- Protection of domestic employment: In the short run, free trade can cause job losses. Protectionism saves jobs but at the cost of higher prices and inefficiency.
- Current account deficit: Reducing imports can improve the trade balance, but may provoke retaliation.
-
Evaluation:
- The benefits of free trade are long-term and aggregate; the costs of adjustment are short-term and concentrated on specific groups. Whether the benefits always outweigh the costs depends on the ability to compensate losers and the speed of adjustment.
- The infant industry argument is valid if the protected industry has potential comparative advantage and the protection is temporary. However, governments often fail to withdraw protection, leading to inefficient industries.
- Strategic industries are a legitimate exception, but the scope is limited.
- Anti-dumping can be justified but is often abused for protectionist purposes.
- Alternative policies: instead of protectionism, governments can use retraining programmes, social safety nets, and infrastructure investment to help displaced workers. These may be more efficient than trade barriers.
- The question's use of "always" is too strong: there are cases where protectionism can be beneficial, but the general presumption should be in favour of free trade.
-
Conclusion: State that free trade is generally beneficial, but not always. The answer depends on the specific context. Provide a justified judgement: in most cases, free trade's benefits outweigh protectionism, but exceptions exist for infant industries, strategic sectors, and anti-dumping, especially when combined with complementary policies.
Key Takeaways
- The theory of comparative advantage provides a strong case for free trade.
- Protectionism arguments are often based on short-term or distributional concerns.
- A balanced evaluation considers both sides and the context.
- The conclusion must address the "always" claim and provide a conditional answer.
Common Mistakes
- One-sided answer: only discussing benefits of free trade or only arguments for protectionism. This leads to a maximum of Level 2 for AO1/AO2 and no evaluation marks.
- Lack of development: listing points without explanation. For example, saying "free trade increases growth" without explaining how.
- No conclusion or a vague conclusion like "it depends" without specifying on what.
- Ignoring the word "always" – failing to challenge the absolute claim.
- Using no examples: the mark scheme notes that explanations are supported by examples where appropriate.
Things to Be Careful About
- Ensure the essay is balanced: give roughly equal weight to both sides in terms of analysis.
- Use economic terminology accurately: comparative advantage, opportunity cost, economies of scale, dumping, etc.
- In the evaluation, explicitly weigh the arguments and state which side is stronger and why.
- The conclusion should be justified: explain the conditions under which your judgement holds.
- Avoid making normative statements without support; use evidence and reasoning.
Explain the difference between a budget surplus and a budget deficit and consider the extent to which a budget surplus is better than a budget deficit.
Answer
AO1: Knowledge and understanding
- A government budget is a financial statement showing planned government revenue and expenditure for a fiscal year.
- A budget surplus occurs when government revenue exceeds government expenditure.
- A budget deficit occurs when government expenditure exceeds government revenue.
AO2: Analysis
- A budget surplus allows the government to reduce the national debt, lowering future interest payments and freeing up funds for other spending. It can also build reserves for economic downturns. However, a surplus may indicate that taxes are too high or spending too low, which could reduce aggregate demand and slow economic growth.
- A budget deficit can be used to finance expansionary fiscal policy, increasing aggregate demand and reducing unemployment during a recession. It can also fund public investment in infrastructure. However, persistent deficits increase the national debt, leading to higher interest payments and potential crowding out of private investment. Large deficits may also be inflationary if the economy is near full capacity.
AO3: Evaluation
- Whether a budget surplus is better than a deficit depends on the state of the economy. In a recession, a deficit may be preferable to stimulate demand. In a boom, a surplus can help cool the economy and reduce debt. Therefore, it is not always better to have a surplus; the appropriate fiscal stance depends on the economic cycle. A surplus is generally better when the economy is overheating, while a deficit is better during a downturn. So the extent to which a surplus is better is limited to specific economic conditions.
A budget surplus is not inherently better than a deficit; the appropriate fiscal stance depends on the economic cycle, with deficits preferable during recessions and surpluses during booms.
Background Concept
A government budget is a financial plan for a fiscal year, detailing expected revenue (mainly from taxes) and planned expenditure (on public services, infrastructure, debt interest, etc.). A budget surplus (revenue > expenditure) and a budget deficit (expenditure > revenue) are two possible outcomes. The national debt is the accumulated stock of past deficits minus surpluses. Fiscal policy refers to the use of government spending and taxation to influence the economy. Expansionary fiscal policy (higher spending or lower taxes) typically leads to a deficit, while contractionary fiscal policy (lower spending or higher taxes) tends to produce a surplus.
Understanding the Question
The question asks you to first explain the difference between a budget surplus and a deficit (AO1), then analyse the benefits and limitations of each (AO2), and finally consider the extent to which a surplus is better than a deficit (AO3). The command word "consider the extent to which" requires a judgement that is not absolute; you must weigh both sides and reach a conclusion. The mark scheme explicitly warns against confusing this with the current account of the balance of payments.
Approach
Start with clear definitions of surplus and deficit. Then discuss the advantages and disadvantages of each, making sure to cover both. Finally, evaluate by comparing them in different economic contexts (recession vs boom) and conclude that neither is universally better.
Step-by-Step Reasoning
- Definitions: State what a government budget is, then define surplus and deficit. These are straightforward and earn up to 3 marks.
- Analysis of surplus: Benefits include debt reduction, lower future interest payments, and a buffer for future crises. Limitations include potential drag on AD if the surplus is achieved through high taxes or low spending, which can slow growth and increase unemployment.
- Analysis of deficit: Benefits include stimulating AD during a recession, reducing unemployment, and funding public investment. Limitations include rising national debt, crowding out of private investment, and potential inflation if the economy is at full capacity.
- Evaluation: The key is that the desirability of a surplus or deficit depends on the economic cycle. In a recession, a deficit is beneficial; in a boom, a surplus is beneficial. Therefore, a surplus is not always better; it is better only in certain conditions. This leads to a justified conclusion.
Key Takeaways
- Budget surplus and deficit are not inherently good or bad; their impact depends on the economic context.
- A surplus can be contractionary; a deficit can be expansionary.
- Always consider both sides when asked to "consider the extent to which".
- Do not confuse government budget with the current account.
Common Mistakes
- Confusing budget deficit with current account deficit (the question explicitly warns against this).
- Only discussing one side (surplus or deficit) – this limits AO2 marks to 2 and forfeits all AO3 marks.
- Providing a one-sided conclusion without justification.
- Failing to define terms clearly.
Things to Be Careful About
- Use precise terminology: "government budget", "budget surplus", "budget deficit", "national debt".
- Ensure the analysis is balanced: mention both benefits and limitations for each.
- The conclusion must be a judgement, not a summary. State clearly that the extent to which a surplus is better depends on the economic situation.
- Keep the answer focused on the government budget, not the balance of payments.
Introduction
Expansionary fiscal policy involves an increase in government spending and/or a decrease in taxes to boost aggregate demand (AD). The question asks whether it always benefits an economy, implying that there are conditions under which it may not.
Advantages of expansionary fiscal policy
- It increases AD (C + I + G + X – M), leading to higher real GDP and lower unemployment if the economy is below full employment.
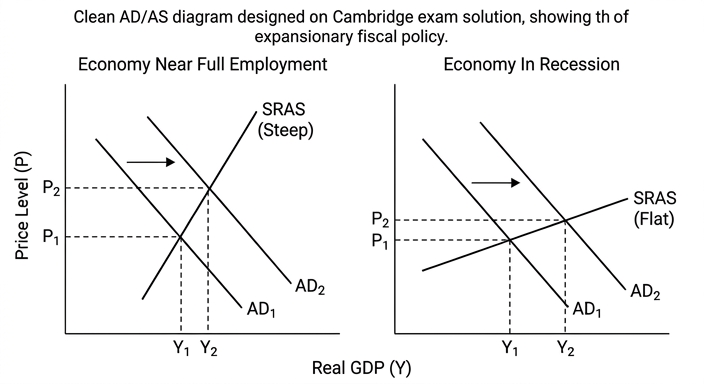
In the diagram, AD shifts from AD1 to AD2, raising output from Y1 to Y2 and the price level from P1 to P2. The increase in output reduces cyclical unemployment.
- It can be targeted: infrastructure spending increases productive capacity in the long run (supply-side effect).
- It can help avoid a deflationary spiral by boosting demand.
Disadvantages of expansionary fiscal policy
- If the economy is at or near full employment, the increase in AD will be inflationary (price level rises significantly, output changes little).
- Financing the deficit may increase the national debt, leading to higher future taxes or crowding out of private investment if the government borrows from the loanable funds market.
- Time lags: implementation lag (political process) and impact lag (multiplier process) may mean the policy takes effect too late, potentially overheating the economy.
- Political constraints: may be used for short-term electoral gain rather than long-term benefit.
Evaluation
- The net benefit depends on the state of the economy: in a deep recession, benefits likely outweigh costs; in a boom, costs likely outweigh benefits.
- The size and composition of the fiscal stimulus matter: well-targeted spending on infrastructure may have supply-side benefits, while across-the-board tax cuts may be less effective.
- The effectiveness also depends on the multiplier effect, which varies with the marginal propensity to consume and the openness of the economy.
- Alternative policies (monetary policy, supply-side policy) may be more appropriate in some circumstances.
Conclusion
Expansionary fiscal policy is not always beneficial. It is most beneficial when the economy is in a recession with high unemployment and low inflation. In other circumstances, it may cause inflation, increase national debt, and crowd out private investment. Therefore, the statement that it always benefits an economy is false; its benefits are conditional on the economic context.
Expansionary fiscal policy is not always beneficial; its effectiveness depends on the state of the economy, the size and composition of the policy, and the presence of crowding out and time lags. It is most beneficial during recessions and least beneficial when the economy is at full capacity.
Background Concept
Expansionary fiscal policy is a demand-side policy aimed at increasing aggregate demand (AD) through higher government spending or lower taxes. AD = C + I + G + (X – M). The AD/AS model shows the impact on real output and the price level. The short-run aggregate supply (SRAS) curve is upward-sloping; its slope determines how much of the AD increase goes to output versus prices. In a recession, SRAS is relatively flat (spare capacity), so output rises a lot with little inflation. At full employment, SRAS is steeper, so the same AD increase causes more inflation and less output growth.
Understanding the Question
The command word "Assess whether" requires a balanced evaluation of both sides and a justified conclusion. The word "always" is an absolute, so the answer must show that it is not always beneficial. The question is from Paper 2 part (b), worth 12 marks, with AO1+AO2 out of 8 and AO3 out of 4. The top band (Level 3) requires detailed knowledge, developed analysis, and a justified conclusion.
Approach
Structure the essay with an introduction, advantages, disadvantages, evaluation, and conclusion. Use an AD/AS diagram to illustrate the effect. In the evaluation, discuss the state of the economy, the size and composition of the policy, crowding out, time lags, and alternative policies. Conclude that it is not always beneficial.
Step-by-Step Reasoning
- Introduction: Define expansionary fiscal policy and state the issue.
- Advantages: Explain how it increases AD, reduces unemployment, and can have supply-side effects. Reference the diagram: AD shifts right, output and price level rise. Emphasise that this is beneficial when there is a negative output gap.
- Disadvantages: Explain inflation risk when near full employment, crowding out (government borrowing raises interest rates, reducing private investment), national debt burden, and time lags. Also note political economy issues.
- Evaluation: Weigh the advantages and disadvantages. The key factor is the state of the economy. Also consider the multiplier, the composition of spending, and the possibility of using other policies. This leads to a nuanced conclusion.
- Conclusion: State clearly that expansionary fiscal policy is not always beneficial; it depends on the context.
Key Takeaways
- Expansionary fiscal policy is a powerful tool but not a panacea.
- The AD/AS model is essential for analysing its effects.
- Always consider the state of the economy (recession vs boom) when evaluating fiscal policy.
- Be aware of crowding out, time lags, and the national debt.
- A justified conclusion must address the specific wording of the question (here, "always").
Common Mistakes
- One-sided answer: only discussing advantages or disadvantages – this loses all evaluation marks.
- No diagram: the top band expects use of analytical tools; a diagram helps achieve Level 3.
- Vague conclusion: e.g., "it depends" without saying on what and how.
- Confusing fiscal policy with monetary policy.
- Ignoring the word "always" – the answer must challenge the absolute.
Things to Be Careful About
- Label the AD/AS diagram clearly: axes, curves, shifts, equilibrium points.
- Explain the diagram in the text; do not just draw it.
- Use economic terminology: aggregate demand, multiplier, crowding out, national debt, inflationary gap.
- Ensure the conclusion is justified and directly answers the question.
- Keep the essay focused on the question; avoid irrelevant digressions.