Economics 9708/14 — May/June 2025
Cambridge AS Level · AS Level Multiple Choice · answer key with instant marking and worked solutions
Topics Fiscal Policy · Monetary Policy · Balance of Payments · Classification of Goods and Services · Demand and Supply · The Circular Flow of Income · +17 more
Tap an option under each question to check it — your score builds as you go.
What is a common criticism of economics?
Options
A It fails to establish theories of economic behaviour.
B It is unable to construct models of how an economy might work.
C It lacks the ability to use and apply mathematics.
D It is very difficult to undertake laboratory experiments in economics.
Reasoning
Economics is a social science. Unlike natural sciences such as physics or chemistry, it is very difficult to conduct controlled laboratory experiments because human behaviour is complex and cannot be isolated from the real-world environment. This is a common criticism of economics.
Answer
D
D
Background Concept
Economics is classified as a social science. This means it studies human behaviour in the context of scarcity and choice. Like other sciences, it aims to build theories and models to explain and predict behaviour. However, a key limitation is that economists cannot usually run controlled laboratory experiments in the way a chemist or physicist can. In a lab, a natural scientist can hold all other factors constant (ceteris paribus) and change just one variable to observe its effect. In economics, the 'laboratory' is the whole economy, and it is impossible to control all the other influences on people's decisions. This makes it harder to isolate cause and effect and to test theories definitively.
Understanding the Question
This is a multiple-choice question asking for a 'common criticism' of economics. The question is testing your understanding of the nature of economics as a discipline. You need to identify which of the four options represents a genuine and well-known limitation of economics, rather than a false statement about what economics can or cannot do.
Approach
Read each option carefully. Ask yourself: Is this a true statement about economics? And is it a criticism that is commonly made? Eliminate any option that is factually incorrect about what economics does. The correct answer will be the one that points to a real methodological weakness.
Step-by-Step Reasoning
- Option A: 'It fails to establish theories of economic behaviour.' This is false. Economics has many well-established theories, such as the law of demand, the theory of comparative advantage, and the quantity theory of money. This is not a valid criticism.
- Option B: 'It is unable to construct models of how an economy might work.' This is also false. Economists routinely build models (e.g., the circular flow model, the AD/AS model) to simplify and analyse the economy. Model-building is a core part of economics.
- Option C: 'It lacks the ability to use and apply mathematics.' This is incorrect. Economics makes extensive use of mathematics, from simple algebra and graphs to calculus and econometrics. Mathematical application is a strength, not a weakness.
- Option D: 'It is very difficult to undertake laboratory experiments in economics.' This is a true and common criticism. Because economics studies human decision-making in complex, real-world settings, it is very hard to set up controlled experiments. This limits the ability to test theories and establish causal relationships with the same certainty as in the natural sciences.
Therefore, D is the correct answer.
Key Takeaways
- Economics is a social science, not a natural science.
- A key limitation of economics is the difficulty of conducting controlled experiments.
- This does not mean economics lacks theories, models, or mathematical tools; it means its methods of testing are different and often more challenging.
Common Mistakes
- Choosing A or B because of a vague sense that economics is 'not a real science'. Remember that economics does establish theories and build models; the criticism is about the difficulty of testing them.
- Choosing C because of a dislike of maths. The question asks for a common criticism, not a personal opinion. Economics is actually very mathematical.
Things to Be Careful About
- Read the question carefully: it asks for a 'common criticism', not a statement of what economics is. All four options are statements about economics, but only one is a genuine criticism.
- Do not overthink. The difficulty of laboratory experiments is a standard point made in the first chapter of any economics textbook when discussing methodology.
What is an essential requirement for a market economy to be able to allocate its resources?
Options
A freedom of entry and exit
B private ownership of property
C many buyers and sellers
D perfect product knowledge
Answer
For a market economy to allocate resources through the price mechanism, private ownership of property is essential. Without private property rights, individuals and firms lack the legal entitlement to own, use, and exchange goods and assets, so markets cannot function. Freedom of entry and exit (A) and many buyers and sellers (C) are features of competitive markets but not essential for allocation; a monopoly can still allocate via prices. Perfect product knowledge (D) is unrealistic and not required. Therefore, the correct answer is B.
B
Background Concept
A market economy allocates resources through the price mechanism, where the forces of demand and supply determine what is produced, how, and for whom. For this system to work, individuals and firms must have the legal right to own, use, and transfer property – including land, capital, and goods. This is private property rights. Without them, there is no incentive to produce or trade, and prices cannot emerge from voluntary exchange. The price mechanism relies on property rights to function.
Understanding the Question
The question asks for an essential requirement – something that must be present for a market economy to allocate resources at all. It is not asking for a feature that improves efficiency or competition, but a fundamental condition without which resource allocation via markets would be impossible.
Approach
Evaluate each option against the definition of a market economy:
- B: Private ownership of property – is this truly essential?
- A: Freedom of entry and exit – is this necessary for allocation, or just for competition?
- C: Many buyers and sellers – is this required, or can a market exist with few participants?
- D: Perfect product knowledge – is this realistic or necessary?
Eliminate options that are not essential, and confirm the one that is indispensable.
Step-by-Step Reasoning
-
Private ownership of property (B) – In a market economy, resources are privately owned. Owners decide how to use them based on prices and profit signals. If property were collectively owned (as in a planned economy), the price mechanism would not guide allocation because there would be no private incentive to respond to prices. Therefore, private property is the institutional foundation of a market economy. Without it, markets cannot exist.
-
Freedom of entry and exit (A) – This is important for competition and for resources to move to their most valued uses, but it is not essential for allocation. Even if entry is restricted (e.g., a monopoly), the existing firm still allocates resources using prices. The market still functions, albeit imperfectly. So A is not essential.
-
Many buyers and sellers (C) – This is a condition for perfect competition, but a market can allocate resources with only one buyer (monopsony) or one seller (monopoly). For example, a local electricity provider is a monopoly but still allocates electricity via prices. So C is not essential.
-
Perfect product knowledge (D) – This is unrealistic and not required. Markets operate with imperfect information all the time; consumers and firms make decisions based on available knowledge. The price mechanism still works, though outcomes may be less efficient. So D is not essential.
Thus, only B is an essential requirement.
Key Takeaways
- The fundamental institutional requirement for a market economy is private property rights.
- Features of perfect competition (free entry, many participants, perfect knowledge) are not necessary for resource allocation to occur via markets.
- Understanding the difference between necessary conditions and desirable conditions is crucial in economics.
Common Mistakes
- Choosing 'freedom of entry and exit' because it seems important for competition, but forgetting that allocation can still happen without it.
- Confusing 'market economy' with 'perfectly competitive market' – the question is about the system, not a specific market structure.
- Thinking that perfect knowledge is required, but in reality markets function with imperfect information.
Things to Be Careful About
- The question was discounted in the original exam, but the economic reasoning clearly points to B as the correct answer.
- Always focus on the word 'essential' – it means without which it cannot function.
- Private property rights are the bedrock of a market economy; without them, there is no incentive to respond to prices.
Under which conditions are free market forces most likely to allocate resources efficiently in an economy?
Options
| demerit goods | merit goods | public goods | |
|---|---|---|---|
| A | a few | a few | a few |
| B | many | many | a few |
| C | none | many | none |
| D | none | none | none |
Reasoning
Free market forces allocate resources efficiently when goods are private (rival and excludable) and there are no externalities or information failures. The three types of goods listed all involve market failure:
- Merit goods (e.g. education, healthcare) are under-consumed if left to the market because consumers have imperfect information about their long-term benefits.
- Demerit goods (e.g. cigarettes, alcohol) are over-consumed because consumers underestimate the negative consequences.
- Public goods (e.g. national defence, street lighting) are non-rival and non-excludable, so the free market fails to provide them at all (the free-rider problem).
Therefore, free market forces are not likely to allocate resources efficiently for any of these three types of goods. The only row in the table where all three are marked 'none' is option D.
Answer
D
D
Background Concept
In a free market economy, resources are allocated through the price mechanism. For this allocation to be efficient (maximising total surplus), goods must be private goods — they are rival (one person's consumption reduces availability for others) and excludable (sellers can prevent non-payers from consuming). When these conditions hold, the market can reach an efficient outcome. However, certain types of goods violate these conditions, leading to market failure where the market either under-provides, over-provides, or fails to provide the good at all.
- Merit goods are goods that are under-consumed if left to the market because consumers have imperfect information about their long-term benefits (e.g. education, healthcare). The market fails by providing too little.
- Demerit goods are over-consumed because consumers underestimate the harmful effects (e.g. cigarettes, alcohol). The market fails by providing too much.
- Public goods are non-rival (one person's consumption does not reduce availability for others) and non-excludable (it is impossible or costly to prevent non-payers from consuming). This leads to the free-rider problem, and the market fails to provide them at all.
Understanding the Question
The question asks: "Under which conditions are free market forces most likely to allocate resources efficiently in an economy?" It presents a table with three columns: demerit goods, merit goods, and public goods. The rows (A, B, C, D) show different combinations of 'a few', 'many', or 'none' for each type. We need to pick the row where free market forces are most likely to allocate resources efficiently. Since free market forces fail for all three types, the correct answer is the row where all three have 'none'.
Approach
- Recall the defining characteristics of each type of good and the associated market failure.
- Determine whether free market forces can allocate resources efficiently for each type.
- For each option, check if the pattern matches the analysis.
- Select the option that aligns with the conclusion that the market fails for all three.
Step-by-Step Reasoning
- Step 1: Merit goods. Free market allocation leads to under-consumption because consumers do not fully appreciate the benefits (e.g. education). The government often provides or subsidises them. Therefore, free market forces are not efficient for merit goods.
- Step 2: Demerit goods. Free market allocation leads to over-consumption because consumers ignore negative externalities or long-term harm (e.g. alcohol). Government often taxes or bans them. Therefore, free market forces are not efficient for demerit goods.
- Step 3: Public goods. Free market fails to provide them at all because of non-excludability and non-rivalry (free-rider problem). Government must provide them directly. Therefore, free market forces are not efficient for public goods.
Now evaluate the options:
- Option A: 'a few' for all three. This would imply that for some of these goods, market forces work efficiently. But the analysis shows zero efficiency for all three. So A is incorrect.
- Option B: 'many' for demerit and merit goods, 'a few' for public goods. This suggests that for many merit and demerit goods, market forces work, but they fail for a few public goods. This is wrong because market failure is inherent for all three types.
- Option C: 'none' for demerit goods, 'many' for merit goods, 'none' for public goods. This suggests that for merit goods, market forces work for many of them, which is false.
- Option D: 'none' for all three. This matches the conclusion that free market forces are inefficient for all three types of goods. Therefore, D is correct.
Thus, the correct choice is D.
Key Takeaways
- Free market forces allocate resources efficiently only for private goods (rival and excludable) with no externalities or information failures.
- Merit goods, demerit goods, and public goods all involve market failure, so the market does not allocate efficiently.
- When a question asks about conditions for efficient allocation, immediately identify the characteristics of the goods and whether they are private or subject to market failure.
Common Mistakes
- Confusing merit goods with private goods: Some students think merit goods are like private goods because they are provided by the market, but they forget the information failure leads to under-consumption.
- Thinking public goods can be provided by the market: The free-rider problem means the market will not provide public goods at all, so they are a clear case of market failure.
- Misreading the table: The table uses 'none', 'a few', 'many' to indicate the extent to which market forces are efficient. Students might pick a row with 'many' for some good, thinking that market forces work for many of them, but the correct answer requires 'none' for all.
Things to Be Careful About
- The question specifically asks about free market forces — not government intervention. So we focus on what the market alone would do.
- The term 'conditions' refers to the type of goods, not other factors like competition or property rights.
- Always recall the precise definitions: merit goods have positive externalities/information failure; demerit goods have negative externalities/information failure; public goods have non-rivalry and non-excludability.
- In a multiple-choice question, eliminate options systematically by applying the theory to each column.
What does a production possibility curve show?
Options
A the actual demand in an economy given its existing resources
B the maximum output an economy can achieve using existing resources
C the maximum output an economy can ever achieve
D the minimum combinations of output an economy can achieve
A production possibility curve (PPC) illustrates the maximum possible combinations of two goods or services that an economy can produce given its existing resources and technology, assuming full and efficient use of those resources. Option B correctly states this. Option A refers to actual demand, which is not shown by a PPC. Option C ignores the constraint of existing resources and technology. Option D refers to minimum combinations, which is incorrect as a PPC shows maximum output.
Answer
B
B
Background Concept
A production possibility curve (PPC) is a graphical representation of the maximum combinations of two goods or services that an economy can produce when all resources are fully and efficiently utilised, given the existing technology and resource base. It illustrates the fundamental economic problem of scarcity: because resources are limited, producing more of one good requires sacrificing some of the other good, known as opportunity cost. The PPC is typically bowed outward (increasing opportunity cost) or linear (constant opportunity cost).
Understanding the Question
The question asks for the definition of what a production possibility curve shows. It is a straightforward recall question testing the core meaning of the PPC. The correct answer is the statement that the PPC shows the maximum output an economy can achieve using existing resources.
Approach
To answer, recall the key features of a PPC: it shows maximum potential output given existing resources and technology, not actual demand, not an unattainable maximum, and not minimum combinations. Then evaluate each option against these features.
Step-by-Step Reasoning
- Option A: 'The actual demand in an economy given its existing resources' – The PPC is about supply-side potential, not demand. Actual demand is determined by consumer preferences and income, which are not directly represented on a PPC.
- Option B: 'The maximum output an economy can achieve using existing resources' – This is the correct definition. The PPC shows the frontier of possible output combinations, assuming full and efficient use of resources.
- Option C: 'The maximum output an economy can ever achieve' – This is incorrect because the PPC is based on existing resources and technology; it can shift outward over time with growth, but the curve itself does not show future potential.
- Option D: 'The minimum combinations of output an economy can achieve' – This is the opposite of the PPC's purpose; a PPC shows maximum, not minimum, output.
Therefore, option B is correct.
Key Takeaways
- The PPC is a fundamental model illustrating scarcity, choice, and opportunity cost.
- It shows the maximum possible output with existing resources and technology.
- Points on the curve represent efficient production; points inside represent inefficiency; points outside are unattainable.
Common Mistakes
- Confusing the PPC with a demand curve or a production function.
- Thinking that the PPC shows actual output rather than potential output.
- Believing that the PPC shows the maximum output ever achievable, ignoring the role of resources and technology.
Things to Be Careful About
- The PPC assumes full employment and efficient use of all resources. It does not account for unemployment or waste.
- The PPC is a static model; it does not show changes over time unless shifted by growth.
- The shape of the PPC reflects the law of increasing opportunity cost, but this is not directly tested in this question.
A city built a new stadium to host the World Athletics championships. The city authorities also ensured clean air by closing factories and making their workers unemployed during the championships.
Which part of this is an example of non-rival consumption?
Options
A The improved air quality also benefited those who did not have to pay for it.
B The private costs and external costs were borne by the city authorities.
C The stadium could be used after the championships.
D The unemployed factory workers were entitled to free tickets to the stadium.
Answer
Non-rival consumption means that one person's use of a good or service does not reduce the quantity available for others. The improved air quality could be enjoyed by everyone in the city simultaneously — one person breathing clean air does not use it up or prevent others from also breathing it. This is the non-rival characteristic of a public good.
Answer
A
A
Background Concept
Non-rivalry is one of the two defining characteristics of a public good. A good is non-rival if its consumption by one person does not diminish the amount available for anyone else. For example, a lighthouse signal or national defence: one person benefiting does not reduce the benefit to others. The other characteristic is non-excludability — it is impossible or very costly to prevent anyone from consuming the good. Together, non-rivalry and non-excludability create the free-rider problem, which is why public goods tend to be under-provided by the market.
Understanding the Question
The question presents a scenario: a city builds a stadium for a World Athletics championship and also closes factories to ensure clean air, causing unemployment. It asks which part of this scenario is an example of non-rival consumption. The key is to identify which of the four options describes a situation where one person's consumption does not reduce the amount available for others.
Approach
Read each option carefully and test it against the definition of non-rivalry. Eliminate options that describe other economic concepts — non-excludability, private costs, external costs, or transfer payments — and select the one that fits non-rivalry.
Step-by-Step Reasoning
-
Option A: "The improved air quality also benefited those who did not have to pay for it." Clean air is non-rival: one person breathing clean air does not reduce the amount of clean air available for others. The fact that some people did not pay for it points to non-excludability, but the core of the statement is that many people can benefit simultaneously — that is non-rival consumption. This is the correct answer.
-
Option B: "The private costs and external costs were borne by the city authorities." This describes cost-bearing, not consumption. Private costs are the costs directly incurred by the decision-maker (the city), and external costs are costs imposed on third parties. This is about who pays, not about whether consumption is rival or non-rival.
-
Option C: "The stadium could be used after the championships." This describes durability or future use, not non-rivalry. A stadium is rival in consumption: if one person sits in a seat, that seat is not available for someone else. The fact that it can be used again later is about its lifespan, not about the nature of consumption at any given moment.
-
Option D: "The unemployed factory workers were entitled to free tickets to the stadium." This describes a transfer (free tickets) to compensate for job loss. It is about entitlement and compensation, not about the consumption characteristics of the stadium or the air.
Key Takeaways
- Non-rival consumption means one person's use does not reduce availability for others.
- Clean air, national defence, and street lighting are classic examples of non-rival goods.
- Distinguish non-rivalry from non-excludability (cannot prevent consumption), durability (can be used again), and cost concepts (private/external costs).
Common Mistakes
- Confusing non-rivalry with non-excludability. Option A includes both, but the question asks specifically for non-rival consumption. The key is that many can benefit without diminishing the good.
- Thinking that a stadium is non-rival because it can be used by many people over time. In fact, at any one time, a seat is rival — one person occupies it.
- Mistaking a transfer payment (free tickets) for a consumption characteristic.
Things to Be Careful About
- Read the question precisely: it asks for "non-rival consumption", not "non-excludability" or "public good" in general.
- Focus on the act of consumption itself, not on who pays or who is entitled to receive.
Along which axis can the market demand curve be aggregated from individual demand curves?
Options
A both the horizontal and the vertical axis
B the horizontal axis only
C the horizontal or the vertical axis but not both
D the vertical axis only
Answer
The market demand curve shows the total quantity demanded by all consumers at each price. To derive it, we add the quantities demanded by each individual at every given price. This is a horizontal summation along the quantity axis. The vertical axis (price) is the same for all individuals, so summing vertically would add prices at a given quantity, which is not how market demand is constructed. Hence, the market demand curve is aggregated along the horizontal axis only.
Answer
B
B
Background Concept
A demand curve plots the relationship between price and quantity demanded. An individual demand curve shows how much one consumer wishes to buy at each price. The market demand curve is the sum of all individual demand curves in a market. The correct method of aggregation is horizontal summation: for each price, add the quantities demanded by all individuals. This yields the total quantity demanded at that price. The market demand curve is therefore the horizontal sum of individual demand curves.
Understanding the Question
The question asks along which axis the market demand curve can be aggregated from individual demand curves. The options refer to the horizontal axis (quantity) and the vertical axis (price). The correct answer is that aggregation is done along the horizontal axis only. This is a fundamental concept in microeconomics: market demand is the sum of quantities at each price, not the sum of prices at each quantity.
Approach
Recall the definition of a market demand curve: it shows the total quantity demanded at each price. To build it, start with a price, find the quantities each individual demands, and add them. This is a horizontal addition because the quantity axis is horizontal. The price axis is common to all individuals, so vertical aggregation would add prices at a given quantity, which is not relevant.
Step-by-Step Reasoning
- A demand curve has price on the vertical axis and quantity on the horizontal axis.
- Individual demand curves show quantity demanded as a function of price.
- To obtain the market demand, fix a price, say P0.
- Read the quantity demanded by individual A at P0, add the quantity demanded by individual B at P0, and so on.
- This sum gives the total quantity demanded at P0. Plot this point.
- Repeat for all prices. The resulting curve is the market demand curve.
- This process is called horizontal summation because we add quantities (horizontal axis values) at each price.
- Vertical summation would involve adding prices at a given quantity, which is not how market demand is derived. That method is used for aggregating supply curves vertically (e.g., industry supply) or for adding marginal benefits in public goods, but not for market demand.
- Therefore, the market demand curve is aggregated along the horizontal axis only.
Key Takeaways
- Market demand is the sum of individual demands at each price, i.e., horizontal summation.
- The horizontal axis measures quantity, the vertical axis measures price.
- This concept is essential for understanding how demand curves shift when the number of consumers changes.
Common Mistakes
- Confusing horizontal and vertical summation: Some students think that market demand is the average of individual demands, or that it is the sum of prices at each quantity. Neither is correct.
- Thinking that both axes can be used: The question includes option A (both axes) and C (either but not both). These are incorrect because the vertical axis is not used for aggregation in demand.
- Applying vertical summation incorrectly: Vertical summation is used in other contexts (e.g., adding marginal benefit curves for public goods, or adding industry supply curves). It is not applicable to market demand from individual demand curves.
Things to Be Careful About
- Always remember that aggregation is along the quantity axis for demand curves.
- The same logic applies to supply curves: market supply is the horizontal sum of individual supply curves.
- In multiple-choice questions, watch for distractors that suggest vertical summation or both axes.
In the diagram, D1 is the initial demand curve for student places at universities.
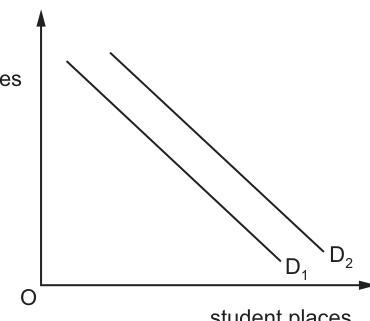
What could cause the demand curve to shift to D2?
Options
A a decrease in student fees for universities
B a decrease in the level of youth unemployment
C an increase in graduate earnings compared with non-graduate earnings
D higher A Level grades demanded for university entrance
Working
A rightward shift of the demand curve from D1 to D2 represents an increase in demand for university places, meaning more students are willing and able to purchase places at every given fee level.
- Option A: A decrease in student fees is a change in the price of the good itself, which causes a movement along the demand curve, not a shift of the curve. So this is incorrect.
- Option B: A decrease in youth unemployment means more young people are in employment, raising the opportunity cost of attending university. This would reduce demand for places, shifting the curve left, not right. So this is incorrect.
- Option C: An increase in graduate earnings compared with non-graduate earnings raises the expected future benefit of a university degree, making university more attractive to prospective students. This increases demand at every fee level, shifting the demand curve right to D2. This is correct.
- Option D: Higher A Level grades demanded for university entrance create a barrier to entry, meaning fewer students qualify for university places. This reduces demand, shifting the curve left. So this is incorrect.
Answer
C
C
Background Concept
A demand curve illustrates the relationship between the price of a good or service (in this case, university fees, plotted on the vertical axis) and the quantity of that good or service demanded (the number of student places, plotted on the horizontal axis), holding all other factors constant (ceteris paribus).
A change in the price of the good itself causes a movement along the existing demand curve: a fall in price leads to a movement down and to the right (higher quantity demanded), while a rise in price leads to a movement up and to the left (lower quantity demanded).
By contrast, a shift of the entire demand curve (leftward for a decrease in demand, rightward for an increase in demand) is caused by changes in non-price determinants of demand: factors that alter consumers' willingness or ability to purchase the good at every given price level. For a normal good such as higher education, key non-price determinants include expected future income (or the income premium from obtaining the qualification), the prices of related goods (e.g. alternative pathways like apprenticeships), consumer tastes and preferences, expectations about future labour market conditions, and the number of eligible buyers in the market.
Understanding the Question
The question provides a diagram showing two parallel downward-sloping demand curves for university student places: D1 (the initial demand curve) and D2 (a curve to the right of D1). A rightward shift from D1 to D2 means that at every possible fee level, a larger quantity of student places is demanded. The question asks which of the four listed options would cause this increase in demand.
This is a 1-mark multiple-choice question that tests two core concepts: the distinction between a movement along a demand curve and a shift of the demand curve, and the specific non-price factors that increase demand for higher education.
Approach
To answer this question, first apply the core distinction: if the option describes a change in the price of university places itself, it will cause a movement along D1, not a shift to D2, so it can be eliminated immediately. For the remaining options, assess whether the change would make university more or less attractive to prospective students: a factor that increases willingness or ability to apply for places at every fee level will shift demand right, while a factor that reduces willingness or ability will shift it left.
Step-by-Step Reasoning
- First, confirm the meaning of the diagram: D2 lies to the right of D1, so at any given fee level, the quantity of places demanded is higher under D2. This is an increase in demand, not an increase in quantity demanded (which would be a movement along D1).
- Evaluate Option A: A decrease in student fees is a fall in the own price of university places. Changes in own price only ever cause movements along the existing demand curve, not shifts of the curve. A lower fee would lead to a movement down and to the right along D1, not a shift to D2. Therefore, Option A is incorrect.
- Evaluate Option B: Youth unemployment measures the share of 16–24 year olds who are without work and actively seeking employment. A decrease in youth unemployment means more young people are in paid employment rather than in full-time education or unemployed. Attending university requires students to give up employment income, so the opportunity cost of studying rises when youth unemployment is low (as the alternative wage you could earn is higher). A higher opportunity cost reduces the willingness of young people to apply to university, so demand falls, shifting the curve left, not right. Therefore, Option B is incorrect.
- Evaluate Option C: Graduate earnings are the typical wages earned by people who hold a university degree, while non-graduate earnings are the typical wages for those without a degree. An increase in graduate earnings relative to non-graduate earnings raises the lifetime financial return to obtaining a degree, making university more attractive to prospective students. At every given fee level, more people are now willing and able to apply for places, so demand increases, shifting the curve right from D1 to D2. Therefore, Option C is correct.
- Evaluate Option D: Higher A Level grades demanded for university entrance raises the minimum academic entry requirement for courses. Fewer students will meet this higher threshold, so the pool of eligible applicants shrinks. With fewer people able to purchase university places, demand falls, shifting the curve left. Therefore, Option D is incorrect.
Key Takeaways
- The key distinction to master is between a movement along the demand curve (caused only by a change in the good's own price) and a shift of the demand curve (caused by changes in non-price determinants).
- An increase in demand (rightward shift) occurs when a non-price factor makes consumers more willing or able to buy the good at every price level.
- For higher education, demand is heavily influenced by the expected future earnings premium of a degree, as this affects the perceived net benefit of attending university after accounting for fees and the opportunity cost of study.
Common Mistakes
- Confusing a movement along the demand curve with a shift: a very common error is to select Option A, incorrectly assuming that a fall in price increases demand. In reality, a fall in price increases quantity demanded (a movement along the curve), not demand itself.
- Misinterpreting the effect of youth unemployment: some students assume lower unemployment means more people can afford university, but in fact lower youth unemployment raises the opportunity cost of studying (as you give up a higher wage to attend), reducing demand.
- Misunderstanding entry requirements: higher A Level requirements reduce the number of eligible applicants, so demand falls, rather than rising as some students incorrectly assume.
Things to Be Careful About
- Always check first whether a change is to the good's own price: if it is, it cannot shift the demand curve, only cause a movement along it.
- When analysing demand for education, remember that demand depends on both the direct cost of attending (fees) and the indirect costs (opportunity cost of lost earnings) as well as the expected future benefits (higher graduate earnings, better employment prospects).
- The diagram shows a parallel shift, which means the slope of the demand curve (the sensitivity of demand to fee changes) is unchanged: the factor affecting demand alters overall willingness to apply, not how responsive students are to fee changes.
A survey into the market for good X found that it is an inferior good and a close substitute for good Y.
Which values for the income elasticity of demand for good X and its cross elasticity of demand with respect to the price of good Y would support this?
Options
| income elasticity of demand for good X | cross elasticity of demand for good X with respect to the price of good Y | |
|---|---|---|
| A | -1.2 | -0.9 |
| B | -1.2 | +0.9 |
| C | +1.2 | -0.9 |
| D | +1.2 | +0.9 |
Reasoning
An inferior good has a negative income elasticity of demand (YED), meaning that as income rises, demand for good X falls. A close substitute has a positive cross elasticity of demand (XED) with respect to the price of good Y, meaning that an increase in the price of Y leads to an increase in demand for X.
Looking at the options:
- A: YED = -1.2 (correct for inferior), XED = -0.9 (negative, indicates complements, not substitutes) -> incorrect.
- B: YED = -1.2 (correct), XED = +0.9 (correct for substitutes).
- C: YED = +1.2 (positive, normal good), XED = -0.9 (complements) -> incorrect.
- D: YED = +1.2 (normal good), XED = +0.9 (substitutes, but YED wrong) -> incorrect.
Only option B has both signs correct.
Answer
B
B
Background Concept
Price elasticity of demand (PED) measures responsiveness of quantity demanded to a change in price. Income elasticity of demand (YED) measures responsiveness of quantity demanded to a change in income. Cross elasticity of demand (XED) measures responsiveness of quantity demanded of one good to a change in the price of another good.
Sign conventions:
- YED > 0: normal good (demand rises with income). YED < 0: inferior good (demand falls with income).
- XED > 0: the two goods are substitutes (rise in price of one increases demand for the other). XED < 0: the two goods are complements (rise in price of one reduces demand for the other).
Understanding the Question
The question describes good X as an inferior good and a close substitute for good Y. We are asked to select the correct pair of YED for X and XED of X with respect to the price of Y. The table gives four combinations of signs. The task is to identify which combination matches the descriptions.
Approach
- Recall the sign rule for YED: inferior good -> negative YED.
- Recall the sign rule for XED: substitutes -> positive XED.
- Examine each option and reject any that violates either sign requirement.
Step-by-Step Reasoning
- Option A: YED = -1.2 (negative, so X is inferior – correct). XED = -0.9 (negative, meaning X and Y are complements, not substitutes – incorrect). Eliminate.
- Option B: YED = -1.2 (negative, inferior – correct). XED = +0.9 (positive, substitutes – correct). Both signs match the description.
- Option C: YED = +1.2 (positive, normal good – fails the inferior condition). XED = -0.9 (negative, complements – fails substitution). Eliminate.
- Option D: YED = +1.2 (positive, normal good – fails). XED = +0.9 (positive, substitutes – correct for that part, but YED wrong). Eliminate.
Thus only option B is fully consistent.
Key Takeaways
- The sign of YED distinguishes normal from inferior goods.
- The sign of XED distinguishes substitutes from complements.
- Magnitudes (e.g., 1.2 vs 0.9) are irrelevant to this classification; only the sign matters.
Common Mistakes
- Confusing the sign rules: e.g., thinking that substitutes have negative XED, or that inferior goods have positive YED.
- Selecting an option where only one of the two signs is correct, without checking the other.
Things to Be Careful About
- The question asks for the values that support the description, not the values that are possible for such goods. The magnitudes are arbitrary but the signs must be correct.
- Note that a close substitute implies a positive XED, but the size indicates how close the substitution is; a value of +0.9 indicates a fairly strong substitute, but any positive value would be acceptable.
- The income elasticity of -1.2 indicates that good X is a strong inferior good (luxury inferior? Actually, a negative YED magnitude >1 means it is income elastic, but the inferiority is still captured by the sign).
What is the likely nature of the price elasticity of supply of a crop such as rice?
Options
A highly elastic in both the short and the long run as rice is an essential product
B highly elastic in the short run and more inelastic in the long run as production methods improve
C highly inelastic in both the short and the long run as the land area of a country is fixed
D highly inelastic in the short run and more elastic in the long run as it takes time to plant rice
Analysis
Rice is an agricultural crop with a significant production period. In the short run, supply is highly inelastic because it is not possible to quickly increase the quantity produced. In the long run, farmers can adjust planting decisions and land use, making supply more elastic. Therefore, the correct answer is D.
Answer
D
D
Background Concept
Price elasticity of supply (PES) measures the responsiveness of quantity supplied to a change in price. It is calculated as: PES = % change in quantity supplied / % change in price. The value of PES depends on how easily producers can change output when the price changes. A key factor is the time period. In the short run, at least one factor of production is fixed, so firms cannot easily adjust output. In the long run, all factors are variable, and firms can expand or contract production more freely. For agricultural products like rice, the short run is limited by the growing season – you cannot instantly plant more rice. In the long run, farmers can decide to plant more or less, use more land, or adopt new technology.
Understanding the Question
This is a multiple-choice question asking you to identify the likely nature of the price elasticity of supply of a crop such as rice, considering both the short run and the long run. The options present combinations of elastic/inelastic in the short run and long run. You need to apply the theory of PES and the specific characteristics of agricultural production to determine the correct combination.
Approach
First, recall the meaning of elastic and inelastic supply. Elastic supply means a small price change leads to a large change in quantity supplied (PES > 1). Inelastic supply means quantity supplied changes little in response to a price change (PES < 1). For rice, think about the production process: it takes months to grow rice. In the short run (say, within a growing season), farmers cannot increase output quickly if the price rises – they already planted what they have. So supply is inelastic. In the long run (over several seasons), farmers can respond to higher prices by planting more rice, or to lower prices by planting less. So supply becomes more elastic. Therefore, the correct answer should state that supply is highly inelastic in the short run and more elastic in the long run. Evaluate each option against this.
Step-by-Step Reasoning
- Define PES and the time factor. PES is low when production is inflexible in the short run. For rice, the production cycle is fixed.
- Short run: farmers cannot change the amount of rice already in the ground. An increase in price will not immediately increase the quantity available; only existing stocks can be sold, but these are limited. So supply is highly inelastic (PES close to 0).
- Long run: farmers can adjust land area, use more inputs, improve technology, etc. Over several seasons, the quantity supplied can be increased significantly in response to higher prices, making supply more elastic (PES > 1, but not necessarily perfectly elastic).
- Option D: "highly inelastic in the short run and more elastic in the long run as it takes time to plant rice" – this matches the analysis.
- Option A: "highly elastic in both the short and the long run as rice is an essential product" – essentiality affects demand, not supply. Supply elasticity depends on production flexibility, not necessity. Incorrect.
- Option B: "highly elastic in the short run and more inelastic in the long run as production methods improve" – the opposite of what happens. Production methods improve over time, making supply more elastic, not less. Incorrect.
- Option C: "highly inelastic in both the short and the long run as the land area of a country is fixed" – land area is fixed, but land can be used for different crops. In the long run, farmers can switch land use, so supply of a specific crop like rice can become more elastic. Land fixity is not a binding constraint because land can be reallocated. Incorrect.
Thus, D is the correct answer.
Key Takeaways
- The time period is a crucial determinant of PES. In the short run, supply is generally more inelastic; in the long run, it is more elastic.
- For agricultural products, the production cycle makes short-run supply particularly inelastic.
- When answering MCQ questions on PES, consider the nature of the good and the time horizon.
- Do not confuse factors affecting demand elasticity with supply elasticity.
Common Mistakes
- Choosing option A because of the idea that essential goods have inelastic demand, but that is about demand, not supply. The question is about supply elasticity, not demand elasticity.
- Thinking that because land is fixed, supply of any crop is always inelastic. In the long run, land can be reallocated among crops, so supply of a specific crop can be elastic.
- Assuming that production methods improve and make supply more inelastic – improvement actually makes supply more elastic because it becomes easier to increase output.
- Not distinguishing between short run and long run; some students may think supply is inelastic in both periods because of land constraints, but land is variable in the long run.
Things to Be Careful About
- Read the question carefully: it asks about the “likely nature” of supply elasticity, not demand elasticity.
- Remember that the time period is the key: short run – at least one factor fixed; long run – all factors variable.
- For any agricultural product, the supply response takes time due to biological lags.
- In MCQs, eliminate options that contradict the basic theory of supply elasticity over time.
The price of laptop computers falls.
The price of which product is likely to rise as a result?
Options
A desktop computers
B carrying cases for laptop computers
C monitors for desktop computers
D workstation tables for desktop computers
Answer
When the price of laptop computers falls, the quantity demanded of laptops increases. Carrying cases for laptops are a complementary good; as more laptops are purchased, the demand for carrying cases rises. This increase in demand shifts the demand curve for cases to the right, raising their equilibrium price. Therefore, the correct answer is B.
B
Background Concept
In economics, goods can be related in consumption. Complements are goods that are used together, such as laptops and carrying cases. A fall in the price of a good increases the quantity demanded of that good, which in turn increases the demand for its complements. Substitutes are goods that can replace each other, such as laptops and desktop computers. A fall in the price of a good reduces the demand for its substitutes. These relationships are measured by cross-price elasticity of demand: negative for complements, positive for substitutes.
Understanding the Question
The question asks: when the price of laptops falls, which product is likely to experience a rise in price? The answer depends on whether the product is a complement or a substitute to laptops. We need to evaluate each option and determine its relationship to laptops.
Approach
For each option, identify whether it is a complement, substitute, or unrelated to laptops. If it is a complement, demand for it will increase, raising its price. If it is a substitute, demand will decrease, lowering its price. If it is unrelated, there will be little or no effect.
Step-by-Step Reasoning
-
Option A: Desktop computers – Desktops and laptops are substitutes. When laptops become cheaper, consumers switch from desktops to laptops. The demand for desktops falls, shifting the demand curve left, and the equilibrium price of desktops falls. So A is incorrect.
-
Option B: Carrying cases for laptop computers – Carrying cases are complements to laptops. When the price of laptops falls, the quantity demanded of laptops rises. This increases the demand for carrying cases, shifting the demand curve for cases to the right. The equilibrium price of cases rises. So B is correct.
-
Option C: Monitors for desktop computers – Monitors are complements to desktops. Since the demand for desktops falls (as explained), the demand for monitors also falls. This reduces the price of monitors. So C is incorrect.
-
Option D: Workstation tables for desktop computers – Workstation tables are also complements to desktops. The same logic applies: demand for desktops falls, so demand for workstation tables falls, and their price falls. So D is incorrect.
Thus, only the price of carrying cases for laptops is likely to rise.
Key Takeaways
- Understanding the relationship between goods (complements and substitutes) is essential for predicting how changes in one market affect related markets.
- A fall in the price of a good leads to an increase in the quantity demanded of that good, which increases demand for its complements and decreases demand for its substitutes.
- This logic is directly applicable to multiple-choice questions and real-world market analysis.
Common Mistakes
- Confusing complements and substitutes: some students might think that if laptops become cheaper, demand for all computer-related products increases, but this is not true for substitutes or goods that are complements to substitutes.
- Overlooking the distinction between movement along the demand curve and shift in demand: the fall in laptop price is a movement along its demand curve, but it causes a shift in the demand for related goods.
Things to Be Careful About
- Carefully identify the relationship: carrying cases are complements to laptops, not to desktops.
- Remember that the price of a good rises only if the demand for it increases; this happens for complements when the price of the main good falls.
- In a multiple-choice question, eliminate options that are substitutes or complements to substitutes.
Assuming normal demand and supply for a product, what will definitely increase consumer surplus?
Options
A a shift in the demand curve to the left
B a shift in the demand curve to the right
C a shift in the supply curve to the left
D a shift in the supply curve to the right
Consumer surplus is the area above the market price and below the demand curve. With normal downward-sloping demand and upward-sloping supply: a rightward shift in supply lowers equilibrium price and increases quantity. The lower price expands the area of consumer surplus (more consumers benefit and each existing consumer pays less). This effect is unambiguous. Shifts in demand or a leftward supply shift either raise price or reduce willingness to pay, making any increase in consumer surplus uncertain.
Answer
D
D
Background Concept
Consumer surplus is the difference between the maximum price consumers are willing to pay for a good and the actual price they pay. Graphically, on a demand and supply diagram, it is the triangular area below the demand curve and above the market price, out to the equilibrium quantity. A change in consumer surplus occurs whenever the equilibrium price or the demand curve shifts.
Understanding the Question
The question asks which of four possible shifts (demand left, demand right, supply left, supply right) will definitely increase consumer surplus. The word 'definitely' is crucial: the increase must be guaranteed regardless of exact elasticities or the size of the shift. Normal demand and supply means downward-sloping demand and upward-sloping supply.
Approach
Consider each option in turn. For a change to definitely increase consumer surplus, the price must fall without reducing the demand curve's height (willingness to pay). A rightward shift in supply lowers price and leaves demand unchanged, so consumer surplus expands. The other three options either raise price, lower willingness to pay, or both, making the net effect ambiguous or negative.
Step-by-Step Reasoning
- Shift in supply to the right (Option D): Supply increases → equilibrium price falls, quantity rises. For every unit, the new price is lower, so existing consumers pay less (surplus per unit rises). New consumers who were previously priced out now buy, adding to total surplus. With demand unchanged, the entire area between the demand curve and the new lower price is larger. This is an unambiguous increase.
- Shift in supply to the left (Option C): Supply decreases → price rises, quantity falls. Price rises shrink consumer surplus per unit, and fewer units are consumed. Consumer surplus definitely decreases.
- Shift in demand to the left (Option A): Demand falls → price and quantity both fall. The price fall could increase surplus on the remaining units, but the demand curve itself shifts down (willingness to pay declines). The net effect depends on the magnitude of the shift and elasticities; consumer surplus may increase, decrease, or stay the same. Not definite.
- Shift in demand to the right (Option B): Demand rises → price and quantity both rise. The higher price reduces surplus on existing units, but the extra units add surplus. Again, the net effect is ambiguous (typically consumer surplus falls if demand is elastic, but not certain). Not definite.
Only supply right guarantees an increase.
Key Takeaways
- Consumer surplus changes are determined by changes in price and in the willingness to pay (demand).
- A supply shift that lowers price unambiguously raises consumer surplus; a supply shift that raises price unambiguously lowers it.
- Demand shifts have ambiguous effects on consumer surplus because both price and the demand curve move together.
Common Mistakes
- Thinking that any increase in quantity (e.g., from demand rising) automatically increases consumer surplus – forgetting that the price rise reduces surplus per unit.
- Confusing consumer surplus with total revenue or producer surplus.
- Ignoring the 'definitely' condition and assuming a shift in demand always increases consumer surplus.
Things to Be Careful About
- Always consider the shape of the curves: 'normal' implies downward-sloping demand and upward-sloping supply; results may differ for perfectly elastic/inelastic curves.
- Use a diagram mental check: a rightward supply shift clearly expands the triangle between demand and price.
- 'Definitely' means under any plausible normal elasticities; supply right is the only safe choice.
A government in a market economy decides to subsidise the provision of the internet in remote parts of a country.
What is the most likely reason for doing this?
Options
A to decrease provision of a demerit good
B to increase provision of a merit good
C to provide a public good
D to reduce negative externalities
Answer
The internet is a merit good because it is under-consumed due to imperfect information or lack of access in remote areas. A subsidy reduces the price to consumers, increasing consumption towards the socially optimal level. Therefore, the most likely reason is to increase provision of a merit good (Option B).
B
Background Concept
Merit goods are goods that are under-consumed in a free market because consumers have imperfect information about their benefits, leading to positive externalities. Government intervention, such as subsidies, can increase consumption to the socially optimal level. Demerit goods are over-consumed due to imperfect information about negative effects, and are taxed. Public goods are non-excludable and non-rival, often provided directly by government. Negative externalities are costs imposed on third parties, reduced by taxes or regulation.
Understanding the Question
The question asks for the most likely reason a government subsidises internet provision in remote areas. The internet is a merit good because it has positive externalities (e.g., improved education, business opportunities) and is under-consumed due to lack of access or awareness. A subsidy lowers price, increasing consumption.
Approach
Recall definitions of merit goods, demerit goods, public goods, and externalities. Evaluate each option: A is about demerit goods (subsidy would increase, not decrease); B is about merit goods (subsidy increases provision); C is about public goods (internet is not a pure public good; it is excludable and rival, so subsidy is not the typical method for public goods; direct provision is more common); D is about negative externalities (subsidy would increase a good with negative externalities, which is counterproductive). B is the most consistent.
Step-by-Step Reasoning
- Option A: decrease provision of a demerit good. Demerit goods are over-consumed (e.g., alcohol, tobacco). Government typically uses taxes or bans to reduce consumption. A subsidy would increase consumption, not decrease. So A is incorrect.
- Option B: increase provision of a merit good. Merit goods are under-consumed due to imperfect information. Internet in remote areas has positive externalities (e.g., access to information, economic opportunities). A subsidy reduces price, increases consumption, and addresses the under-consumption. So B is correct.
- Option C: provide a public good. Public goods are non-excludable and non-rival (e.g., street lighting, national defence). The internet is excludable (you can block access) and rival (bandwidth can be congested), so it is not a pure public good. While government might provide internet infrastructure as a quasi-public good, the question says "subsidise the provision", not provide directly. Subsidising private providers is more typical for merit goods. So C is not the most likely reason.
- Option D: reduce negative externalities. Internet provision has positive externalities, not negative. If there were negative externalities (e.g., increased screen time), government would tax or regulate, not subsidise. So D is incorrect.
Thus, the most likely reason is to increase provision of a merit good.
Key Takeaways
Understanding the classification of goods (merit, demerit, public) and the appropriate government intervention for each. Subsidies are used to increase consumption of merit goods, taxes to reduce consumption of demerit goods, direct provision for public goods, and regulations/taxes for negative externalities.
Common Mistakes
- Confusing merit goods with public goods. The internet is often mistakenly thought of as a public good, but it is excludable and rival (though it has positive externalities).
- Thinking that a subsidy is used to reduce negative externalities; it is used to increase positive externalities.
- Assuming that all government provision of goods is for public goods.
Things to Be Careful About
- The question asks for the "most likely reason". Consider the economic rationale rather than other possible reasons.
- Remember that merit goods are under-consumed due to imperfect information, so subsidy corrects this.
- Distinguish between "subsidise" and "directly provide". Subsidies encourage private provision, which is typical for merit goods.
Who is intended to benefit from an agricultural buffer stock scheme during periods of plentiful harvests?
Options
A consumers of food
B growers of food
C processors of food
D taxpayers
Reasoning
During periods of plentiful harvests, the market supply of food increases, which would lead to a fall in price and a reduction in growers' revenue. An agricultural buffer stock scheme aims to stabilise prices by buying up the surplus from growers at a support price, thereby ensuring their income is protected. The scheme is therefore intended to benefit growers of food.
Answer
B
B
Background Concept
A buffer stock scheme is a government intervention designed to stabilise the price of a primary commodity (such as food) by buying up surplus when supply is plentiful (to support the price) and selling from stock when supply is scarce (to prevent the price from rising too high). The scheme typically sets a floor price (minimum) and a ceiling price (maximum). Its main objectives are to protect producers from low prices during gluts and consumers from high prices during shortages, though it also aims to smooth income fluctuations for growers.
Understanding the Question
The question asks: "Who is intended to benefit from an agricultural buffer stock scheme during periods of plentiful harvests?" The key words are "intended to benefit" and "during plentiful harvests". This focuses on the immediate objective of the scheme when there is a surplus. The intended beneficiary is the group whose income or welfare the scheme directly aims to protect at that specific time. It is not asking about the ultimate distribution of costs and benefits across all stakeholders.
Approach
Recognise that a buffer stock scheme acts like a price floor during surplus. The authority commits to buy any amount offered at the floor price. This prevents the market price from falling below that floor. Since plentiful harvests would otherwise drive the market price down, the scheme supports growers' revenue. Therefore, the intended beneficiary is clearly the growers. The other options (consumers, processors, taxpayers) are either unaffected in the way the scheme intends or may face costs.
Step-by-Step Reasoning
- Plentiful harvests shift the supply curve for food to the right. In a free market, this would reduce equilibrium price and increase quantity.
- With a buffer stock scheme in place, a floor price (minimum price) is set above the free-market equilibrium. During the surplus, the authority buys the excess supply (the surplus at the floor price) from growers.
- This action ensures growers receive the floor price for all they produce, rather than a lower free-market price. Their total revenue is therefore higher than without intervention.
- The intended purpose of this purchase is to protect grower incomes from the price collapse that would otherwise occur. Hence, growers are the intended beneficiaries.
- Consumers may benefit indirectly if the scheme also stabilises prices over time, but during a surplus they would have paid lower prices without intervention; they are not the intended beneficiary in this period.
- Processors of food face higher raw material costs due to the support price, so they are not beneficiaries.
- Taxpayers bear the cost of buying and storing the surplus, so they are not intended beneficiaries; they are the ones who finance the scheme.
Key Takeaways
- Buffer stock schemes are designed to stabilise prices and protect producers from low prices during good harvests.
- The intended beneficiary during a surplus is the grower (producer).
- The scheme can also protect consumers during shortages, but that is a different phase of the scheme.
- Understanding the timing and mechanism (buy vs. sell) is crucial to answering such questions correctly.
Common Mistakes
- Assuming the scheme always benefits consumers: in a surplus, consumers would prefer lower prices, so the scheme prevents that, making consumers worse off in that period.
- Focusing on the cost to taxpayers: the question asks about "intended to benefit", not who bears the cost. The scheme is designed to benefit growers, even though taxpayers pay for it.
- Confusing buffer stock schemes with price floors that only set a minimum without stockholding: a buffer stock specifically involves buying surplus, which is key to supporting price during gluts.
Things to Be Careful About
- Read the question precisely: "during periods of plentiful harvests" specifies the market condition. The intended beneficiary changes with the phase of the buffer stock cycle.
- Separate the intended effect from the actual outcome: the scheme may have unintended consequences (e.g., overproduction, storage costs), but the question asks about the intent.
- Know the roles of different stakeholders: growers supply the commodity, processors buy it, consumers purchase final goods, taxpayers finance intervention.
A government decides to increase indirect taxes, abolish the agricultural subsidy and lower the income level at which tax becomes payable.
What would be the most likely consequence of these changes?
Options
A a decrease in cost-push inflation
B an increase in income inequality
C an increase in the balance of payments deficit
D an increase in the budget deficit
Answer
The package of higher indirect taxes, the removal of the agricultural subsidy, and a lower income tax threshold all disproportionately reduce the real disposable incomes of lower-income households. Indirect taxes are regressive, removal of the subsidy raises food prices (which form a larger share of low-income budgets), and extending income tax liability to previously exempt low earners further reduces their net income. These effects increase the gap between low and high incomes, making an increase in income inequality the most likely consequence. The other options are inconsistent: cost-push inflation would rise (not fall), the budget deficit would fall (revenue up, spending down), and the effect on the balance of payments is ambiguous.
B
Background Concept
Income inequality refers to the uneven distribution of income among individuals or households in an economy. Regressive taxes (such as indirect taxes) take a larger proportion of income from low-income earners than from high-income earners. A lower income tax threshold means individuals start paying income tax at a lower level of earnings, which extends the tax burden to lower-income workers and can make the overall tax system less progressive. Agricultural subsidies keep food prices lower; their removal raises costs for consumers, particularly affecting low-income households who spend a higher share of their income on food.
Understanding the Question
The question presents three simultaneous policy changes: (1) an increase in indirect taxes, (2) the abolition of an agricultural subsidy, and (3) a lowering of the income level at which tax becomes payable (i.e., a lower personal allowance). It asks for the most likely consequence among four options. This requires reasoning about the joint effect of these policies on key macroeconomic and distributional outcomes, not just on one policy in isolation.
Approach
First, identify the effect of each policy separately, then combine them to see which of the four outcomes (inflation, inequality, trade balance, budget deficit) is most consistently and unambiguously affected. For inequality, note that all three policies tend to reduce the real income of low-income groups relative to high-income groups. For inflation, both higher indirect taxes and removal of a subsidy are likely to raise prices, not lower them. For the budget deficit, revenue from indirect taxes and from a broader income tax base rises while spending on subsidies falls, so the deficit shrinks. For the balance of payments, the net effect on net exports is ambiguous because higher prices may reduce competitiveness but lower domestic spending may reduce imports.
Step-by-Step Reasoning
- Indirect taxes increased: These are typically regressive; they raise prices of goods, reducing real purchasing power more for low-income households who spend a higher proportion of their income on taxed items. This tends to widen income inequality.
- Agricultural subsidy abolished: The subsidy kept food prices lower. Its removal raises food prices. Since food is a necessity and forms a larger share of spending for low-income households, this again hits the poor hardest, increasing inequality.
- Lower income tax threshold: Previously some low earners paid no income tax; now they do (or pay at a higher marginal rate because the starting point is lower). This directly reduces their disposable income, further increasing the gap between low and high incomes.
Combined, all three policies push in the same direction: lower real incomes for the poor relative to the rich, so income inequality rises (Option B). - Option A (decrease in cost-push inflation): Indirect taxes and removal of a subsidy are both cost-raising measures, so they increase cost-push inflation, not decrease it. Hence A is wrong.
- Option D (increase in the budget deficit): Revenue increases (higher indirect taxes, more people paying income tax) and spending decreases (subsidy removed), so the budget deficit falls (or surplus rises). D is wrong.
- Option C (increase in the balance of payments deficit): Higher domestic prices could worsen the trade balance by making exports less competitive and imports cheaper relative to domestic goods. However, lower real incomes reduce demand for imports, which could improve the trade balance. The net effect is ambiguous and not the most likely direct consequence. C is less likely than B.
Thus, the most likely consequence is an increase in income inequality.
Key Takeaways
- When multiple government policies are implemented simultaneously, the net effect on a particular variable may be reinforcing or offsetting. Here all three reinforce inequality.
- Regressive taxes and removal of subsidies that benefit low-income groups are powerful drivers of inequality.
- In multiple-choice questions, each option should be evaluated against the combined effect, not just one policy.
Common Mistakes
- Focusing on only one policy and ignoring the combined effect. For example, a student might see the lower income tax threshold and think it reduces inequality because more people pay tax and there is more redistribution, but overlook that it actually reduces net income for low earners.
- Assuming that higher indirect taxes always reduce inflation (they are cost-push, not demand-reducing in the short run).
- Confusing the budget deficit effect: some students think any tax increase raises the deficit (incorrect – it raises revenue) or that removing a subsidy raises spending (it reduces spending).
Things to Be Careful About
- Read each option carefully: 'decrease in cost-push inflation' is the opposite of what these policies do.
- Remember that indirect taxes and subsidy removal are both supply-side cost increases.
- The term 'lower the income level at which tax becomes payable' means reducing the tax-free allowance, which increases the tax burden on low incomes; it does not mean lowering tax rates.
- In an MCQ, pick the 'most likely' – even if another option is possible under specific assumptions, the question asks for the most likely overall consequence.
What can be calculated using the formula (nominal GDP x price index in base year) / price index in current year?
Options
A gross national income
B real gross domestic product
C net domestic income
D net domestic product
Answer
The formula (nominal GDP × price index in base year) / price index in current year is the standard method to calculate real GDP, which adjusts nominal GDP for changes in the price level. Therefore, the correct answer is B.
B
Background Concept
Gross Domestic Product (GDP) is the total value of final goods and services produced in an economy over a period. Nominal GDP is measured at current prices, so it can rise either because output increases or because prices increase. To measure changes in real output alone, we must adjust nominal GDP for inflation. A price index (such as the GDP deflator or CPI) measures the average price level relative to a base year (where the index is typically 100). The formula:
real GDP = (nominal GDP × price index in base year) / price index in current year
gives a measure of GDP valued at constant base-year prices — that is, real GDP.
Understanding the Question
The question simply asks which macroeconomic aggregate is obtained from this specific formula. It tests whether the student recognises the standard deflation procedure used in national income accounting. The options include related but distinct concepts: GNI (which includes net income from abroad), net domestic income (which subtracts depreciation and net indirect taxes), and net domestic product (which subtracts depreciation). Only real GDP is directly given by this formula.
Approach
- Recall the purpose of a price index — to remove the effect of price changes from nominal values.
- Recognise that multiplying nominal GDP by (base year index / current year index) yields a value expressed in base-year prices.
- Identify this as real GDP, by definition.
- Eliminate the other options: GNI, net domestic income, and net domestic product each require additional adjustments (e.g., adding net factor income from abroad, subtracting depreciation or indirect taxes).
Step-by-Step Reasoning
- Step 1: Write down the given formula: (nominal GDP × price index in base year) / price index in current year.
- Step 2: Interpret it: Dividing by the current year price index scales down the nominal value when prices have risen (index > base), and multiplying by the base year index restores the scale so the result is in base-year prices. (Since the base year index is usually 100, the formula often appears as (nominal GDP / price index in current year) × 100, but the given form is equivalent.)
- Step 3: This matches the textbook definition of real GDP: output valued at constant base-year prices.
- Step 4: Check each option:
- Gross National Income (option A) equals GDP plus net primary income from abroad. The formula contains no such adjustment, so A is incorrect.
- Net Domestic Income (option C) is GNI minus capital consumption (depreciation) and net indirect taxes; again, not captured by the formula.
- Net Domestic Product (option D) is GDP minus depreciation; the formula makes no deduction for depreciation, so D is incorrect.
- Step 5: Therefore, only option B, real gross domestic product, is correct.
Key Takeaways
- Nominal and real values must be distinguished: nominal measures include price changes; real measures remove them.
- A price index is used to deflate nominal GDP to obtain real GDP.
- The formula (nominal GDP × base year price index) / current year price index is the standard deflation technique.
- Other national income aggregates (GNI, NNI, NDP) require additional components beyond price adjustment.
Common Mistakes
- Confusing real GDP with GNI: students may forget that GNI includes net income from abroad, which is not in the formula.
- Thinking the formula gives net domestic product: forgetting that depreciation is not subtracted.
- Misunderstanding the role of the base year index: some students think the formula produces nominal GDP; it actually removes inflation from nominal GDP.
- Not recognising that an MCQ like this simply requires identifying the definition; overcomplicating with irrelevant calculations.
Things to Be Careful About
- The price index in the formula can be any index (GDP deflator, CPI) as long as it is consistent. For the exam, the principle is what matters.
- The base year price index is typically 100; the formula still works if it is given as a different number.
- Remember that “real” means adjusted for inflation, not adjusted for population or any other factor.
- Ensure you read the options carefully — “gross national income” and “net domestic product” are common distractors that sound similar to GDP.
What is always regarded as a cause, rather than a consequence, of a change in the circular flow of income?
Options
A a decrease in government tax revenue
B an increase in consumption spending
C an increase in savings
D an increase in the value of exports
Reasoning
The circular flow of income consists of injections (investment, government spending, exports) and leakages (savings, taxes, imports). A change in an injection is a cause of a change in the circular flow, whereas changes in leakages can be consequences. An increase in exports (D) is an increase in an injection, so it is a cause. Option A: a decrease in government tax revenue could be a consequence of lower income or a policy change; it is not always a cause. Option B: an increase in consumption spending may result from higher income, making it a consequence. Option C: an increase in savings is a leakage and often a consequence of higher income. Therefore D is always a cause.
Answer
D
D
Background Concept
The circular flow of income model shows the flow of spending, income and output between households and firms, with injections from outside the basic flow (investment, government spending, exports) and leakages from the flow (savings, taxes, imports). Equilibrium occurs when total injections equal total leakages. A change in any injection or leakage can disrupt equilibrium.
Understanding the Question
This MCQ asks which of the four options is always a cause, not a consequence, of a change in the circular flow. It tests understanding of the direction of causation: whether a variable initiates a change in the flow or is itself changed by the flow. The word 'always' is important because some options could be either cause or consequence in different circumstances.
Approach
Identify each option as an injection or leakage. Recall that injections are exogenous shocks that can start a change; leakages are often endogenous responses to changes in income. Evaluate each option against the 'always cause' criterion.
Step-by-Step Reasoning
- Exports (D): Exports are an injection into the circular flow. An increase in exports directly raises aggregate demand and income, causing a multiplier expansion. It is universally a cause, not a consequence, of a change in the flow.
- Decrease in government tax revenue (A): Tax revenue depends on income; if income falls, tax revenue falls. So it can be a consequence. Also, a government could cut tax rates, which would be a cause. But 'a decrease in government tax revenue' does not specify the reason, so it is not always a cause.
- Increase in consumption spending (B): Consumption is partly determined by income (consumption function), so an increase in consumption can be a consequence of higher income. It could also be an autonomous increase (e.g., lower interest rates), but then it would be a cause. Again, not always a cause.
- Increase in savings (C): Savings is a leakage and generally increases as income rises, making it a consequence. It could also be caused by a change in saving propensity, but again not always a cause. Thus only D is always a cause.
Key Takeaways
Understanding injections and leakages is fundamental to the circular flow; recognise that exports are always an exogenous injection, while government revenue, consumption and savings often respond to income.
Common Mistakes
Confusing a leakage with a cause; thinking that any change in a component can be a cause; overlooking the word 'always' and picking an option that can sometimes be a consequence.
Things to Be Careful About
Read the question carefully: 'always regarded as a cause' means for all reasonable interpretations. Distinguish between autonomous changes and induced changes.
The table shows some data for an economy.
| investment ($ million) | exports ($ million) | government expenditure ($ million) | savings ($ million) | imports ($ million) | taxation ($ million) | national income ($ million) |
|---|---|---|---|---|---|---|
| 200 | 100 | 50 | 125 | 62.5 | 62.5 | 600 |
| 200 | 100 | 50 | 150 | 75 | 75 | 700 |
| 200 | 100 | 50 | 175 | 87.5 | 87.5 | 800 |
| 200 | 100 | 50 | 200 | 100 | 100 | 900 |
What is the equilibrium level of national income?
Options
A $600 million
B $700 million
C $800 million
D $900 million
Working
In the circular flow, equilibrium national income occurs where total injections equal total leakages:
Injections = I + G + X = 200 + 50 + 100 = 350 (constant across all rows).
Leakages = S + T + M
- Row 1 (Y = 600): 125 + 62.5 + 62.5 = 250
- Row 2 (Y = 700): 150 + 75 + 75 = 300
- Row 3 (Y = 800): 175 + 87.5 + 87.5 = 350
- Row 4 (Y = 900): 200 + 100 + 100 = 400
Equilibrium occurs where leakages = injections = 350, which is at Y = 800.
Answer
C
C
Background Concept
The circular flow of income model shows the flows of money between households, firms, the government, and the foreign sector. In an open economy with government, equilibrium national income occurs when total injections (spending that does not come from domestic households' consumption) equal total leakages (income that does not flow back into domestic spending on goods and services). Injections are investment (I), government expenditure (G), and exports (X). Leakages are savings (S), taxation (T), and imports (M). At equilibrium, I + G + X = S + T + M, and the economy has no tendency to expand or contract.
Understanding the Question
The table provides four different levels of national income (Y) from 600 to 900, each with associated values of S, T, and M that increase with Y. I, G, and X are fixed at 200, 50, and 100 respectively. The question asks for the equilibrium level of national income. Since the data shows a constant level of injections and increasing leakages as Y rises, equilibrium is where the two totals match.
Approach
- Compute total injections: I + G + X = 200 + 50 + 100 = 350. Note this is the same for every row.
- For each row, compute total leakages: S + T + M.
- Find the row where leakages equal 350.
- The corresponding Y is the equilibrium level.
Step-by-Step Reasoning
- Injections = I + G + X = 200 + 50 + 100 = 350.
- Row Y=600: S=125, T=62.5, M=62.5; sum = 125+62.5+62.5 = 250. Leakages (250) < injections (350) -> excess injections cause national income to rise.
- Row Y=700: S=150, T=75, M=75; sum = 150+75+75 = 300. Leakages still less than injections -> income still rising.
- Row Y=800: S=175, T=87.5, M=87.5; sum = 175+87.5+87.5 = 350. Leakages = injections -> equilibrium.
- Row Y=900: S=200, T=100, M=100; sum = 200+100+100 = 400. Leakages > injections -> income would fall back toward equilibrium.
Thus, only at Y=800 does the condition hold, so that is the equilibrium.
Key Takeaways
- Equilibrium in the circular flow is defined by injections = leakages.
- Injections can be constant while leakages vary with income; the equilibrium is where they cross.
- This method avoids needing consumption function data and is straightforward if the table is given.
Common Mistakes
- Confusing injections with leakages, e.g., summing I+G+X with S+T+M and looking for equality to Y.
- Adding all six numbers in a row and comparing to Y, which is irrelevant.
- Trying to compute AD = C + I + G + X - M but lacking C data; instead using the injection-leakage approach is simpler and correct.
- Overlooking that I, G, X are constant, so only leakages change.
Things to Be Careful About
- Ensure you correctly identify the components: I, G, X are injections; S, T, M are leakages.
- Check each row's arithmetic carefully.
- The equilibrium is not necessarily the highest Y; it is where the condition holds.
The diagram shows an economy’s aggregate demand curve.
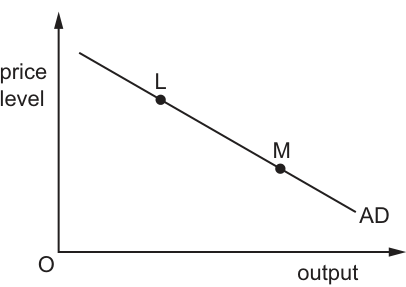
What explains the downward movement from L to M along the AD curve?
Options
A an increase in tariffs leading to decreased imports
B a decrease in taxes on firms, causing an increase in short-run aggregate supply
C an increase in consumer confidence, prompting higher spending on local goods as well as imports
D a slow-down in economic activity, resulting in decreased investment spending
Reasoning
A movement along the aggregate demand (AD) curve occurs when the AD curve itself does not shift, and the change in the price level leads to a change in the quantity of output demanded. Options A, C and D all describe factors that shift the AD curve (changes in net exports, consumption or investment), so they cannot explain a movement along the existing AD curve. Option B describes a decrease in taxes on firms, which reduces firms' costs and causes the short-run aggregate supply (SRAS) curve to shift right. This rightward shift in SRAS leads to a lower equilibrium price level and higher equilibrium real output, which corresponds to the downward movement from L to M along the unchanged AD curve.
Answer
B
B
Background Concept
The aggregate demand (AD) curve illustrates the inverse relationship between the overall price level in an economy and the total quantity of real goods and services demanded, with price level on the vertical axis and real output on the horizontal axis. It slopes downward due to three effects: the wealth effect (lower price levels increase the real value of household wealth, raising consumption), the interest rate effect (lower price levels reduce demand for money, lowering interest rates and raising investment), and the international trade effect (lower domestic price levels make domestic goods more competitive relative to imports, raising net exports).
A critical distinction in AD/AS analysis is between a movement along a curve and a shift of a curve. A movement along the AD curve happens when the AD curve itself remains unchanged, and a change in the price level leads to a change in the quantity of output demanded. This can be triggered by either a change in AD (which would shift the entire curve, not cause a movement along it) or a shift in the aggregate supply (AS) curve, which alters the equilibrium price level and output while leaving AD fixed.
A shift of the AD curve occurs when any of its components change: consumption (C), investment (I), government spending (G), or net exports (X-M). A rightward shift means more output is demanded at every price level, while a leftward shift means less. Short-run aggregate supply (SRAS) is upward sloping in the short run, as firms supply more output when the price level rises (given sticky nominal wages). A rightward shift in SRAS means firms supply more output at every price level, typically due to lower production costs.
Understanding the Question
The question provides an AD curve with two points: L (higher price level, lower real output) and M (lower price level, higher real output). The downward movement from L to M is explicitly a movement along the existing AD curve, not a shift of the curve. The task is to identify which of the four options explains this movement. The key constraint is that the AD curve does not shift, so the cause must be a change in another variable (here, AS) that alters the equilibrium price level and output while leaving AD unchanged.
Approach
To solve this, we use the movement-vs-shift distinction for AD:
- First, eliminate any option that describes a change in a component of AD (C, I, G, or X-M), as these would shift the entire AD curve, not cause a movement along the existing curve.
- Identify the option that describes a change in AS, which would shift the SRAS curve and lead to a new equilibrium point moving along the fixed AD curve.
- Confirm the direction of the AS shift matches the observed movement: lower price level and higher output requires a rightward shift in SRAS.
Step-by-Step Reasoning
- First, characterise the movement from L to M: it is a downward movement along the AD curve, so the price level falls and real output rises, with the AD curve itself unchanged.
- Evaluate Option A: An increase in tariffs is a tax on imported goods, which raises the price of imports and reduces the quantity of imports purchased. Since net exports (X-M) are a component of AD, a fall in imports increases (X-M), which shifts the AD curve to the right. A rightward shift of AD would lead to a higher equilibrium price level and higher output, which is a shift of the curve, not a movement along the existing AD curve. So A is incorrect.
- Evaluate Option C: An increase in consumer confidence raises household willingness to spend, increasing consumption (C), a component of AD. Even if higher consumer confidence leads to higher spending on imports (increasing M), the net effect on AD is likely positive, shifting the AD curve to the right. Again, this is a shift of the curve, not a movement along it. So C is incorrect.
- Evaluate Option D: A slow-down in economic activity reduces business confidence and expected profits, leading to lower investment spending (I), another component of AD. A fall in I shifts the AD curve to the left, leading to lower output and a lower price level, but this is a shift of the AD curve, not a movement along the existing curve. So D is incorrect.
- Evaluate Option B: A decrease in taxes on firms (such as lower corporation tax or taxes on production inputs) reduces firms' costs of production. Lower costs make it more profitable for firms to supply more output at every price level, so the short-run aggregate supply (SRAS) curve shifts to the right. A rightward shift in SRAS intersects the fixed AD curve at a new equilibrium with a lower price level and higher real output, which is exactly the downward movement from L to M along the AD curve. So B is correct.
Key Takeaways
- A movement along a curve occurs when the curve itself does not shift, and the change is in the variable on the axis that the curve is a function of (for AD, the price level). A shift of the curve occurs when a non-price factor changes the quantity demanded/supplied at every price level.
- Movements along the AD curve can be caused by shifts in either AD or AS: a shift in AD moves the entire curve, while a shift in AS moves the equilibrium point along the fixed AD curve.
- When answering AD/AS questions, always first identify whether the change described is a shift or a movement along, then match the cause to the correct curve.
Common Mistakes
- Confusing movements along AD with shifts of AD: Many students assume any change in output or price level is a shift of AD, but a movement along AD occurs when AD is unchanged and the equilibrium moves due to a shift in AS.
- Forgetting that AS shifts cause movements along AD: Students often only associate movements along AD with changes in the price level caused by AD shifts, but shifts in AS also change the equilibrium price level and output, leading to movements along the fixed AD curve.
- Misidentifying the components of AD: Forgetting that net exports (X-M) are part of AD, so changes in tariffs or exchange rates that affect imports/exports shift AD, not cause movements along it.
Things to Be Careful About
- Pay close attention to the question wording: the phrase "along the AD curve" explicitly tells you the AD curve does not shift, so you can immediately eliminate any option that describes a change to an AD component.
- Confirm the direction of the shift: a movement to lower price level and higher output requires a rightward shift in SRAS, which matches the effect of lower taxes on firms' costs.
- Avoid assuming that only AD changes can cause movements along AD: shifts in AS are a common cause of movements along the AD curve, as they alter the equilibrium price level while AD remains fixed.
Long-run aggregate supply (AS) in an economy can be represented diagrammatically in different ways.
For which AS curve would a long-term fall in aggregate demand always be likely to result in the level of employment remaining unchanged?
Options
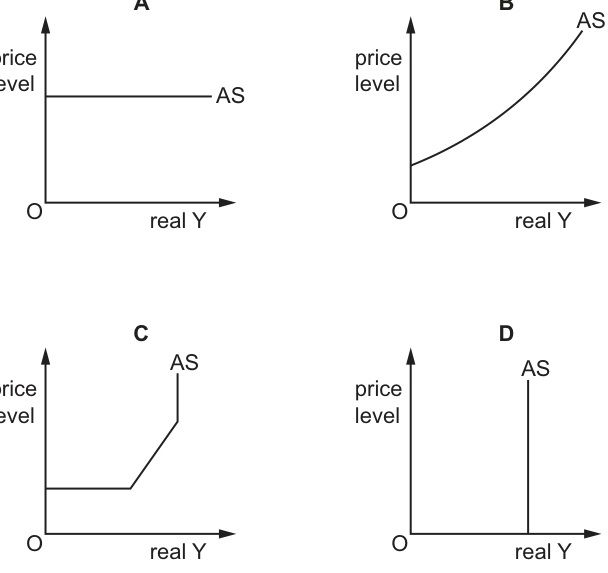
Working
Long-run aggregate supply (LRAS) is vertical at the full-employment level of real output, as in the long run all factors of production are fully employed and output is determined by productive capacity, not aggregate demand. A long-term fall in aggregate demand will only reduce the price level, with no change to real output or the level of employment, since output remains fixed at the full-employment level. Of the four options, only diagram D shows a vertical AS curve, which represents LRAS.
Answer
D
D
Background Concept
Aggregate supply (AS) shows the total quantity of goods and services that firms in an economy are willing and able to produce at different price levels, over a given time period. The long-run aggregate supply (LRAS) curve represents the economy's maximum sustainable output when all factors of production (land, labour, capital, enterprise) are fully employed at their normal capacity, known as potential GDP or full-employment output. The LRAS curve is vertical because, in the long run, the price level has no effect on the quantity of output supplied: output is determined solely by the quantity, quality and productivity of the economy's factors of production, not by the overall level of aggregate demand. This reflects the classical economic assumption that all markets, including the labour market, clear in the long run, so the economy operates at the natural rate of unemployment (the level of unemployment consisting only of frictional and structural unemployment, with no cyclical unemployment). In contrast, short-run aggregate supply (SRAS) is upward sloping, because in the short run some input prices (such as wages) are sticky and do not adjust immediately to changes in the price level, so a higher price level makes production more profitable and firms increase output. The extreme Keynesian view of SRAS is horizontal at below-full-employment output, as there is excess capacity and widespread unemployment, so output can rise without putting upward pressure on prices.
Understanding the Question
The question asks which shape of AS curve would mean that a long-term (long-run) fall in aggregate demand (AD) leaves the level of employment unchanged. Aggregate demand is the total demand for goods and services in an economy at different price levels, comprising consumption (C), investment (I), government spending (G) and net exports (X-M). A fall in AD means that at every price level, the total quantity of output demanded is lower than before. The question specifies this is a long-term change, so we are evaluating the long-run equilibrium outcome, not short-run fluctuations. Employment is directly linked to real output: higher output requires more workers to produce it, ceteris paribus, so unchanged employment means unchanged real output. The four options show different AS curve shapes: A is perfectly horizontal, B is upward sloping, C is horizontal then upward then vertical (the Keynesian AS curve), and D is perfectly vertical. We need to identify which shape corresponds to the long-run AS curve, where output (and thus employment) is independent of aggregate demand in the long run.
Approach
To answer this, we first recall the core properties of the long-run aggregate supply curve: it is vertical at the full-employment level of output, because in the long run, output is determined by the economy's productive capacity, not by aggregate demand. A fall in AD will only reduce the price level in the long run, with no change to real output or employment, as the economy returns to its potential output level. We then match this property to the four diagram options, eliminating any curve that allows output (and thus employment) to change when AD shifts. We can also rule out options by considering their short-run implications: any non-vertical AS curve will allow output and employment to fall when AD falls, at least in the short run, and for the Keynesian curve (C) even in the long run if the economy is not initially at full employment.
Step-by-Step Reasoning
- First, confirm the properties of LRAS: The vertical LRAS curve is positioned at the full-employment level of real output, where the economy's unemployment rate equals the natural rate of unemployment. This level of output is determined by the available quantity of factors of production, their productivity, and the state of technology, none of which are affected by changes in aggregate demand in the long run.
- Analyse the effect of a long-run fall in AD: When AD falls, the AD curve shifts leftwards. If the AS curve is vertical (LRAS), the new long-run equilibrium occurs at the same level of real output as before, but at a lower price level. Since output is unchanged, the number of workers needed to produce that output is also unchanged, so employment remains at its original full-employment level. Any temporary short-run rise in unemployment as wages adjust is eliminated in the long run, which is the time frame specified in the question.
- Evaluate each option against this requirement:
- Option A (horizontal AS): This represents the extreme Keynesian short-run AS curve, where there is abundant excess capacity and unemployed resources. A fall in AD would lead to an equivalent fall in real output and employment, with no change in the price level, as firms can cut output without lowering prices. Employment does not remain unchanged, so A is incorrect.
- Option B (upward-sloping AS): This is the standard short-run AS curve, where some input prices are sticky in the short run. A fall in AD leads to a lower equilibrium price level, lower real output, and lower employment, as firms reduce production in response to weaker demand. Employment changes, so B is incorrect.
- Option C (Keynesian AS curve, horizontal then upward then vertical): This curve has three sections. If the economy is operating in the horizontal section (below full employment), a fall in AD reduces output and employment with no change in the price level. If the economy is in the upward-sloping section, output, employment and the price level all fall. Only if the economy is already at the vertical (full-employment) section would a fall in AD only lower the price level, leaving output and employment unchanged. The question asks which curve would always be likely to result in unchanged employment following a fall in AD. Since the C curve only produces this outcome if the economy is already at full employment (which is not always the case), it does not meet the requirement, so C is incorrect.
- Option D (vertical AS): This is the LRAS curve. By definition, a vertical AS curve fixes real output at the full-employment level regardless of the price level, which is determined by aggregate demand. A long-run fall in AD will only lower the price level, with no change to real output or employment, as the economy remains at its potential output. This matches the question's requirement exactly, so D is the correct answer.
Key Takeaways
- The long-run aggregate supply (LRAS) curve is always vertical at the full-employment level of real output, because long-run output is determined by the economy's productive capacity (factors of production, technology) rather than aggregate demand.
- In the long run, changes in aggregate demand only affect the price level, not real output or employment, because all input prices (including wages) adjust to return the economy to full employment.
- Short-run aggregate supply curves are upward sloping (or horizontal in the extreme Keynesian case) because of short-run stickiness in input prices, so AD changes do affect output and employment in the short run.
- When answering multiple choice questions on AS curves, always link the shape to the time horizon and underlying assumptions: vertical = long run, full employment; upward sloping = short run, sticky wages; horizontal = extreme Keynesian short run, excess capacity.
Common Mistakes
- Confusing LRAS with SRAS: A very common mistake is selecting the upward-sloping SRAS curve (option B) as the answer, forgetting that LRAS is vertical. Students often mix up the shapes of short-run and long-run AS curves, leading to incorrect answers.
- Ignoring the time frame: The question specifies a long-term fall in AD, so short-run effects are irrelevant. Some students choose option C, thinking the vertical section of the Keynesian AS curve is LRAS, but forget that the curve only has a vertical section at full employment, so it does not guarantee unchanged employment for all positions of the economy.
- Misunderstanding the link between output and employment: Some students think that a fall in AD could leave employment unchanged even with an upward-sloping AS curve, but this is incorrect: lower output always requires fewer workers, ceteris paribus, so any AS curve that allows output to fall when AD falls will also lead to lower employment.
- Overlooking the word "always" in the question: The question asks which curve would always result in unchanged employment. Option C only does this if the economy is already at full employment, so it does not meet the "always" requirement, making it incorrect.
Things to Be Careful About
- Always note the time frame specified in the question: long-run changes require considering fully flexible input prices and the vertical LRAS curve, while short-run changes involve sticky prices and upward-sloping SRAS.
- Pay attention to absolute terms in the question: the word "always" means the AS curve must produce the stated outcome (unchanged employment) regardless of the economy's initial position. Only the vertical LRAS curve meets this condition, as it fixes output at potential GDP at all price levels.
- When interpreting AS curve diagrams, confirm that the vertical axis is the price level and the horizontal axis is real output (real Y), as standard in AD/AS analysis. The vertical curve (D) shows that real output is fixed at a specific level no matter what the price level is, which is the defining feature of LRAS.
If a country is suffering from deflation, what would be the best policy to reflate the economy?
Options
A increase corporation tax
B increase income tax
C reduce interest rates
D reduce spending on education
Answer
Deflation indicates a persistent fall in the general price level, typically caused by weak aggregate demand. To reflate the economy, the central bank should pursue expansionary monetary policy. Reducing the policy interest rate lowers the cost of borrowing for households and firms, encouraging consumption and investment. This increases aggregate demand, raising both real output and the price level, thereby countering deflation. The other options are all contractionary: increasing corporation tax (A) or income tax (B) reduces disposable income and investment; reducing spending on education (D) directly cuts government expenditure and aggregate demand. None of these would reflate the economy.
Answer
C
C
Background Concept
Deflation is a sustained decrease in the general price level, often associated with a recessionary gap where aggregate demand (AD) is insufficient to maintain full employment. In such a situation, the economy may experience falling output and rising unemployment. Reflation refers to policies aimed at increasing aggregate demand to raise the price level back towards the target and stimulate economic activity.
Expansionary monetary policy involves central bank actions to increase the money supply and lower interest rates. Lower interest rates reduce the cost of borrowing, encouraging consumption (especially of durable goods) and investment. This shifts the AD curve to the right, increasing real GDP and the price level. Conversely, contractionary fiscal policy (higher taxes or lower government spending) reduces AD and would worsen deflation.
Understanding the Question
The question presents a scenario of a country suffering from deflation and asks for the "best policy to reflate the economy." The word "best" implies that among the options, only one is expansionary. The student must recognize that deflation signals weak AD and that reflation requires increasing AD. Options A, B, and D are contractionary (higher taxes reduce disposable income; lower government spending reduces AD). Option C (reduce interest rates) is expansionary and therefore the correct answer.
Approach
The approach is to classify each option as expansionary or contractionary in terms of its effect on aggregate demand. Since deflation is a symptom of insufficient demand, only expansionary policies will cure it. Options A, B, and D are clearly contractionary; only C is expansionary. No calculations are needed; the reasoning is straightforward.
Step-by-Step Reasoning
- Identify the economic condition: Deflation means the general price level is falling, typically due to a leftward shift of AD or a rightward shift of AS. In the context of reflation, the concern is usually demand-side deflation.
- Goal of reflation: Increase aggregate demand to raise the price level and output.
- Evaluate each option:
- A: Increase corporation tax – This reduces post-tax profits, leading firms to cut investment and possibly reduce employment. Investment is a component of AD, so AD falls. Contractionary. Not suitable.
- B: Increase income tax – Reduces households' disposable income, lowering consumption (largest component of AD). Contractionary. Not suitable.
- C: Reduce interest rates – Lower interest rates reduce the cost of borrowing for consumption and investment, and also reduce the incentive to save. This stimulates consumption and investment, shifting AD right. Expansionary. This is the correct policy.
- D: Reduce spending on education – This is a cut in government spending (G), a direct reduction in AD. Contractionary. Not suitable.
- Conclusion: Only option C is expansionary and would help reflate the economy. The others would worsen deflation.
Key Takeaways
- Deflation generally requires expansionary demand-side policies.
- Expansionary monetary policy (lower interest rates) is a key tool.
- Contractionary fiscal policy (higher taxes or lower government spending) is inappropriate during deflation.
- Recognizing whether a policy is expansionary or contractionary is a fundamental skill.
Common Mistakes
- Confusing deflation with disinflation (a fall in the rate of inflation) and incorrectly applying policies for inflation.
- Thinking that reducing government spending (like education) is always good because it reduces the budget deficit, but during deflation it worsens the recessionary gap.
- Failing to classify policies correctly: taxes and spending cuts reduce AD.
- Choosing a tax increase because they associate it with "revenue" – but the question asks about reflating, not balancing the budget.
Things to Be Careful About
- Ensure you understand the direction of policy change: "reduce" vs "increase". The question uses "reduce interest rates" which is expansionary; "increase tax" is contractionary.
- Remember that "reflate" means to stimulate aggregate demand to increase the price level, not to reduce it.
- In the exam, always match the policy to the specific economic problem.
What would be a positive effect on the growth of an economy in the short run, if the government reduced a direct tax on individual earnings?
Options
A Food prices would increase because of shortages.
B Imports of luxury cars would increase to satisfy a change in demand.
C Savings would increase because of additional disposable income.
D The consumption of domestically produced goods would increase.
Reasoning
A reduction in direct tax on individual earnings increases households' disposable income. This is likely to lead to an increase in consumption expenditure, a component of Aggregate Demand (AD). An increase in AD shifts the AD curve to the right, leading to an increase in real output in the short run, assuming spare capacity. This represents short-run economic growth. Therefore, option D is correct.
Answer
D
D
Background Concept
This question tests the understanding of fiscal policy and its impact on short-run economic growth. A direct tax on individual earnings, such as income tax, affects disposable income. When the government reduces it, households have more after-tax income. The marginal propensity to consume determines how much of that extra income is spent on consumption. Consumption is a component of Aggregate Demand (AD = C + I + G + X-M). An increase in consumption shifts AD right, leading to higher real output if the economy is operating below full capacity (Keynesian range of AS). Short-run growth is defined as an increase in real GDP, which can be achieved by increasing AD or AS.
Understanding the Question
The question asks: 'What would be a positive effect on the growth of an economy in the short run, if the government reduced a direct tax on individual earnings?' It is a multiple choice with four options. The key is to identify which of the listed outcomes directly contributes to an increase in real output. The phrase 'positive effect on growth' means an increase in real GDP. 'Short run' implies we consider immediate demand-side effects, not long-run supply-side adjustments. Also, 'direct tax on individual earnings' is typically income tax.
Approach
To answer, trace the chain: tax cut → higher disposable income → higher consumption spending → higher AD → higher real output (if short-run AS is upward sloping or horizontal). Then evaluate each option against this mechanism. Option D matches. For the distractors, consider why they do not represent positive growth: A (food prices up) does not indicate higher output; B (imports increase) is a leakage that does not raise domestic output; C (savings increase) is a leakage that reduces the immediate boost to AD.
Step-by-Step Reasoning
Start with the effect of the tax cut. A reduction in direct tax on earnings increases households' disposable income (the income left after paying tax). Assume households have a positive marginal propensity to consume (MPC). So a portion of the extra income is spent on consumption. This consumption spending is part of AD. The increase in consumption shifts the AD curve to the right. In the short run, if there is spare capacity (unemployed resources), the economy can increase real output without causing inflation. Therefore, real GDP rises, which is short-run economic growth. This matches option D.
Now check each distractor:
A: 'Food prices would increase because of shortages.' This describes a price increase due to supply constraints (shortages), not an increase in output. It could be cost-push inflation, not growth. Moreover, the tax cut does not cause shortages; shortages might arise from supply shocks, not demand increase.
B: 'Imports of luxury cars would increase to satisfy a change in demand.' An increase in imports is a leakage from the circular flow (M in X-M). Imports do not contribute to domestic GDP; they represent spending on foreign output. So this does not directly cause domestic growth. However, the increase in imports might be a consequence of higher consumption, but it does not constitute a positive effect on growth; rather, it dampens the multiplier effect.
C: 'Savings would increase because of additional disposable income.' Savings are a leakage (S in the circular flow). While savings can finance investment in the long run, in the short run, an increase in savings reduces the consumption multiplier. The immediate effect on AD is less than if the money were spent. So it is not a direct positive effect on growth; in fact, if all extra income is saved, AD does not increase, and growth may not occur.
Thus, only D directly describes a positive effect on growth: increased consumption of domestically produced goods boosts AD and output.
Key Takeaways
- Understand the multiplier process: tax cuts increase disposable income, leading to increased consumption and AD.
- Distinguish between leakages (savings, imports, taxes) and injections (investment, government spending, exports).
- Short-run growth comes from increases in AD (when spare capacity exists) or SRAS.
- Be careful: increased imports do not contribute to domestic GDP; they worsen the trade balance and reduce the multiplier.
Common Mistakes
- Choosing B because 'imports increase' might seem like a sign of higher demand, but imports are a leakage, not a boost to domestic output.
- Confusing savings with a direct driver of growth: savings can lead to investment but only after a time lag; the question specifies short run, so immediate consumption effect matters more.
- Thinking that price increases automatically mean growth: inflation can occur without output growth (stagflation).
- Misunderstanding 'growth' as simply any increase in economic activity: positive growth means an increase in real GDP.
Things to Be Careful About
- Read the question carefully: 'positive effect on the growth' and 'short run'. Short-run growth is typically demand-driven.
- Distinguish between growth in nominal GDP (which could be due to inflation) and real GDP.
- Consider the circular flow: leakages reduce the impact of an injection; tax cuts are an injection by increasing disposable income, but the effect depends on MPC and the extent of leakages.
- For MCQs, evaluate each option against the defined chain of reasoning.
What is not a monetary policy measure?
Options
A credit regulations for banks
B interest rate changes
C increased government subsidies
D money supply changes
Reasoning
Monetary policy refers to measures taken by the central bank to control the money supply, interest rates, and credit availability to influence aggregate demand. Options A (credit regulations for banks), B (interest rate changes), and D (money supply changes) are all tools of monetary policy. Option C (increased government subsidies) is a fiscal policy measure, as it involves government spending on goods, services, or transfers. Hence, it is not a monetary policy measure.
Answer
C
C
Background Concept
Monetary policy refers to actions by a central bank to control the supply of money, interest rates, and credit conditions in order to influence aggregate demand and macroeconomic objectives. Common tools include open market operations (buying/selling government securities to change the money supply), changes in the policy interest rate (e.g., base rate), and reserve requirements or credit regulations for commercial banks. Fiscal policy, on the other hand, involves government decisions on taxation and spending. Changes in government subsidies are part of fiscal policy because they represent government expenditure intended to achieve social or economic objectives.
Understanding the Question
The question asks: "What is not a monetary policy measure?" This is a negative identification question. The candidate must know the definition and typical instruments of monetary policy and be able to identify which of the four options does not belong to that set. The options are: A credit regulations for banks, B interest rate changes, C increased government subsidies, D money supply changes. All except one are standard monetary policy tools. The command word is "What is not", requiring elimination.
Approach
The approach is straightforward: recall the standard instruments of monetary policy. For each option, determine if it falls under the control of the central bank and is used to influence aggregate demand via money, credit, and interest rates. Then identify the odd one out. C is the only option that involves government spending, which is a fiscal tool.
Step-by-Step Reasoning
- Option A: Credit regulations for banks. Central banks often impose regulations on lending, such as reserve requirements, loan-to-value ratios, or margin requirements. These control the amount of credit banks can create, affecting the money supply and aggregate demand. This is a monetary policy measure.
- Option B: Interest rate changes. Central banks set a key policy rate (e.g., the discount rate or repo rate) which influences short-term interest rates throughout the economy. Changes in interest rates affect borrowing, spending, and investment, and are a primary tool of monetary policy.
- Option D: Money supply changes. Central banks can expand or contract the money supply through open market operations, quantitative easing, or changing reserve requirements. This directly affects liquidity and is a core monetary policy measure.
- Option C: Increased government subsidies. Subsidies are payments by the government to firms or individuals, typically to lower the price of essential goods or support certain industries. This is a fiscal policy measure, decided by the government, not the central bank. It is not a monetary policy measure.
Therefore, the correct answer is C.
Key Takeaways
- Monetary policy: central bank actions on money, credit, interest rates.
- Fiscal policy: government actions on taxes and spending.
- Subsidies are fiscal, not monetary.
- Be able to categorise common economic policies.
Common Mistakes
- Confusing fiscal and monetary policy: some students might think all government economic measures are monetary.
- Not knowing that credit regulations (like reserve requirements) are part of monetary policy.
- Thinking that interest rate changes are only fiscal (unlikely, but some may confuse).
Things to Be Careful About
- The question asks for what is NOT a monetary policy measure, so pick the one that is not.
- Ensure you understand the distinction: central bank vs government.
- Subsidies are not monetary; they involve government expenditure.
The government has a macroeconomic objective of low unemployment. It has recently decreased interest rates.
What may limit the effectiveness of this tool in achieving the objective of low unemployment?
Options
A a lack of productive capacity
B excess demand in the economy
C increased government spending on infrastructure
D low levels of welfare benefits
Reasoning
Lowering interest rates is an expansionary monetary policy that increases aggregate demand (AD). If the economy lacks productive capacity (i.e., is at or near full employment), the short-run aggregate supply (SRAS) curve is highly inelastic. The rightward shift of AD then causes a rise in the price level but little or no increase in real output. Consequently, firms do not hire additional workers, and unemployment does not fall. Therefore, a lack of productive capacity limits the effectiveness of this tool.
Answer
A
A
Background Concept
Expansionary monetary policy, such as a decrease in interest rates, is designed to stimulate aggregate demand (AD) by encouraging consumption and investment. The AD/AS model is used to analyse the impact of such a policy on the macroeconomy. The effect on real output and the price level depends critically on the slope of the aggregate supply curve. When the economy has spare capacity (a Keynesian range), SRAS is relatively flat, so an increase in AD raises output significantly with little inflation. When the economy is at full capacity (the classical range), SRAS is vertical or very steep, so an increase in AD raises the price level but leaves real output unchanged.
Understanding the Question
The question states that the government aims to reduce unemployment and has cut interest rates. It asks what factor may limit the effectiveness of this policy in achieving low unemployment. The correct answer is A: a lack of productive capacity. This means the economy is already at or near full employment; any further stimulus cannot increase output, so unemployment cannot be reduced further. The other options are distractors: B (excess demand) suggests the economy is already overheating, which might not be a limitation but rather a reason not to use the policy; C (increased government spending) would reinforce the policy, not limit it; D (low welfare benefits) might affect labour supply but does not directly limit monetary policy.
Approach
Use the AD/AS framework to reason through the effect of expansionary monetary policy under different supply conditions. Identify that the limiting factor is when the economy is at full capacity, meaning the AS curve is inelastic. Also consider alternative scenarios to confirm why the other options are not correct.
Step-by-Step Reasoning
- Expansionary monetary policy: a decrease in interest rates reduces the cost of borrowing, encouraging firms to invest and households to spend. This increases consumption (C) and investment (I), shifting the AD curve to the right.
- The impact on real output and unemployment depends on the position of the economy on the aggregate supply curve.
- If there is a lack of productive capacity (i.e., the economy is at full employment), the SRAS is vertical or very steep. The rightward shift of AD raises the price level (inflation) but does not increase real output.
- Because real output does not rise, firms do not need to hire additional workers, so unemployment remains unchanged. The policy is ineffective in reducing unemployment.
- In contrast, if there is spare capacity, the SRAS is relatively elastic, and the same AD shift would increase real output and reduce unemployment. But the question asks what may limit effectiveness; the absence of spare capacity does.
- Checking other options:
- B: Excess demand (demand-pull inflation) is a symptom of an economy already beyond full capacity. It does not limit the tool; it suggests the tool is already misused.
- C: Increased government spending would further increase AD, potentially worsening inflation, but it does not limit the tool's effectiveness in reducing unemployment (it might even reduce unemployment if there is spare capacity).
- D: Low welfare benefits may affect the natural rate of unemployment (e.g., by reducing the reservation wage), but they do not directly interfere with the transmission mechanism of monetary policy.
Key Takeaways
- The effectiveness of demand-side policies (including monetary policy) to reduce unemployment depends on the state of the economy, specifically on whether there is spare capacity.
- The AD/AS model is essential for predicting policy outcomes.
- A lack of productive capacity (full employment) renders expansionary monetary policy ineffective for reducing unemployment, instead causing inflation.
Common Mistakes
- Assuming that lower interest rates always reduce unemployment without considering the supply side.
- Confusing the objective of low unemployment with price stability; when the economy is at full capacity, the policy may actually conflict with price stability.
- Choosing B (excess demand) because it seems like a problem, but excess demand is a consequence of being beyond capacity, not a limitation of the policy itself.
- Misunderstanding that 'lack of productive capacity' is synonymous with 'full employment' or 'vertical aggregate supply'.
Things to Be Careful About
- Distinguish between the short-run and long-run aggregate supply curves. In the short run, if there is spare capacity, SRAS is upward sloping but not vertical, so expansionary policy can work. In the long run, LRAS is vertical, so the policy only causes inflation.
- The phrase 'lack of productive capacity' should be interpreted as the economy operating at or near its potential output.
- When answering multiple-choice questions, eliminate options that are obviously not limiting factors; sometimes the correct answer is the one that directly addresses the constraint on the transmission mechanism.
The table shows the ability of two countries, P and Q, to produce two goods, Y and Z.
| production of good Y per person | production of good Z per person | |
|---|---|---|
| country P | 1000 | 1600 |
| country Q | 1500 | 2000 |
Which statement is correct?
Options
A P has an absolute advantage in Z and Q has a comparative advantage in Y.
B P has an absolute advantage in Z and Q has an absolute advantage in Y.
C P has a comparative advantage in Y and Q has an absolute advantage in Z.
D P has a comparative advantage in Z and Q has an absolute advantage in Y.
Working
Absolute advantage:
- Country Q produces 1500 Y per person, while P produces 1000 Y per person, so Q has the absolute advantage in Y.
- Country Q produces 2000 Z per person, while P produces 1600 Z per person, so Q also has the absolute advantage in Z.
Comparative advantage (opportunity cost):
- For country P: opportunity cost of 1 Y = 1600 Z / 1000 Y = 1.6 Z. Opportunity cost of 1 Z = 1000 Y / 1600 Z = 0.625 Y.
- For country Q: opportunity cost of 1 Y = 2000 Z / 1500 Y = 1.333 Z. Opportunity cost of 1 Z = 1500 Y / 2000 Z = 0.75 Y.
Comparing opportunity costs:
- For good Y: Q has a lower opportunity cost (1.333 Z < 1.6 Z), so Q has the comparative advantage in Y.
- For good Z: P has a lower opportunity cost (0.625 Y < 0.75 Y), so P has the comparative advantage in Z.
Option D correctly states: P has a comparative advantage in Z and Q has an absolute advantage in Y.
Answer
D
D
Background Concept
In international trade theory, absolute advantage refers to the ability of a country to produce a good using fewer resources (or higher output per person) than another country. Comparative advantage, on the other hand, refers to the ability to produce a good at a lower opportunity cost – i.e., giving up less of another good in production. The law of comparative advantage states that countries can gain from trade if they specialise in the good in which they have a comparative advantage, even if one country has an absolute advantage in both goods. Opportunity cost is calculated as the ratio of the output sacrificed per unit of the good produced.
Understanding the Question
The question provides a table showing output per person of two goods (Y and Z) for two countries (P and Q). The task is to determine which statement correctly identifies the absolute and comparative advantages of the countries. We need to compute both absolute advantage (by comparing output per person directly) and comparative advantage (by calculating opportunity costs).
Approach
First, determine absolute advantage: for each good, the country with the higher output per person has the absolute advantage. Second, calculate the opportunity cost of producing one unit of each good in each country. For country P, opportunity cost of 1 Y = (Z output per person) / (Y output per person). Similarly for good Z. Then compare opportunity costs across countries: the country with the lower opportunity cost for a good has the comparative advantage in that good.
Step-by-Step Reasoning
-
Absolute advantage:
- Good Y: P 1000, Q 1500 => Q has absolute advantage.
- Good Z: P 1600, Q 2000 => Q has absolute advantage.
So Q has absolute advantage in both goods.
-
Opportunity costs:
- For P:
- Cost of 1 Y = 1600 Z / 1000 Y = 1.6 Z
- Cost of 1 Z = 1000 Y / 1600 Z = 0.625 Y
- For Q:
- Cost of 1 Y = 2000 Z / 1500 Y = 1.333 Z
- Cost of 1 Z = 1500 Y / 2000 Z = 0.75 Y
- For P:
-
Comparative advantage:
- For Y: P's opportunity cost = 1.6 Z, Q's = 1.333 Z. Since 1.333 < 1.6, Q has the comparative advantage in Y.
- For Z: P's opportunity cost = 0.625 Y, Q's = 0.75 Y. Since 0.625 < 0.75, P has the comparative advantage in Z.
Thus, P has comparative advantage in Z, and Q has absolute advantage in Y (and also in Z, but the statement only mentions Y). Option D is correct.
Key Takeaways
- Absolute advantage is about higher output per person; comparative advantage is about lower opportunity cost.
- A country can have an absolute advantage in both goods but still benefit from trade if opportunity costs differ.
- Calculating opportunity cost correctly (using the ratio of the other good) is crucial.
- Comparative advantage determines the pattern of specialisation and trade.
Common Mistakes
- Confusing absolute and comparative advantage: thinking that if a country is better at producing both, it should produce both. In reality, comparative advantage matters for trade.
- Miscalculating opportunity cost: e.g., inverting the ratio (using Y/Z instead of Z/Y for the opportunity cost of Y). Always set it as 'what you give up per unit of what you produce'.
- Forgetting to compare opportunity costs across countries; simply knowing the opportunity cost for one country is not enough.
- Thinking that absolute advantage implies comparative advantage in the same good.
Things to Be Careful About
- Carefully note which good's opportunity cost you are calculating. For good Y, use the ratio (Z output / Y output).
- Keep the units consistent: the opportunity cost of Y is in terms of Z, and vice versa.
- Double-check arithmetic: 1600/1000 = 1.6, 2000/1500 = 1.333, etc.
- In multiple-choice questions, verify each option against your calculations to ensure you select the correct one.
A trading country can produce two goods, X and Y. It specialises completely in the production of good Y.
What will be the opportunity cost to the country of consuming additional imports of good X?
Options
A the additional imports of good X
B the increase in the resources required to produce good X
C the reduction in the domestic consumption of good Y
D the reduction in the resources available to produce good Y
Reasoning
The country specialises completely in good Y and exports Y to earn foreign exchange to import good X. The opportunity cost of consuming additional imports of good X is the good Y that must be given up (exported) in order to obtain those imports. This means domestic consumption of good Y must fall. Option C correctly identifies this.
Option A is incorrect: the additional imports themselves are the benefit, not the cost.
Option B is incorrect: the country does not produce good X, so no resources are diverted to its production.
Option D is incorrect: specialisation means resources are fully employed in producing Y, and the opportunity cost is the reduction in consumption of Y, not in the resources available to produce Y.
Answer
C
C
Background Concept
Opportunity cost is the next best alternative forgone when a choice is made. It is not the total of all alternatives, but the single most highly valued option given up. In the context of international trade, when a country specialises in the production of a good in which it has a comparative advantage, it exports that good to pay for imports of other goods. The opportunity cost of importing an additional unit is the quantity of exports that must be given up to obtain it, which reduces domestic consumption of the export good.
Understanding the Question
The question describes a country that has completely specialised in producing good Y. It wants to consume additional imports of good X. The question asks for the opportunity cost to the country of consuming those additional imports. The key is recognising that to import X, the country must export Y, and therefore domestic consumption of Y must fall. The opportunity cost is thus the reduction in consumption of Y (option C).
Approach
Identify what the country gives up to get the imports. Since it specialises completely in Y, it does not produce X at all. To obtain X it must trade Y for X. The next best alternative forgone is therefore the Y that could have been consumed domestically but is instead exported. This matches option C. Eliminate the other options: A describes what is gained, not given up; B and D refer to resources, but the country is not reallocating resources away from X (it produces none) nor reducing resources for Y (it continues to use all resources for Y).
Step-by-Step Reasoning
- The country produces only Y, using all its resources to do so.
- To consume X, it must import X from abroad.
- To pay for imports of X, it must export some of its Y output.
- The Y that is exported cannot be consumed domestically.
- Thus, the domestic consumption of Y is reduced by the amount exported.
- The next best alternative use of the exported Y was domestic consumption. Therefore, the opportunity cost of consuming additional X is the reduction in domestic consumption of Y.
Option C directly states this. The other options are incorrect because:
- Option A: The additional imports of X are the benefit, not the cost.
- Option B: The country does not produce X, so there is no increase in resources to produce X; even if it did, that would be a reallocation, not the opportunity cost of imports.
- Option D: Resources remain fully employed in Y; they are not reduced. The opportunity cost is the consumption forgone, not a reduction in factor availability.
Key Takeaways
- Opportunity cost is always about the next best alternative forgone, not about what is obtained.
- In international trade, specialisation and exchange mean that imports have an opportunity cost in terms of exports forgone.
- When a country specialises completely, domestic consumption of the export good falls to allow imports.
Common Mistakes
- Confusing the benefit (the additional imports) with the cost. Many students might choose A because they think the cost is the imports themselves.
- Thinking that opportunity cost involves a reduction in resources (D) rather than a reduction in consumption.
- Assuming the country must divert resources from X production (B), but it wasn't producing X at all.
Things to Be Careful About
- Read the scenario carefully: “specialises completely” means it produces only Y. Any consumption of X must come through trade.
- Opportunity cost is measured in terms of the next best alternative foregone by the decision-maker (the country), not in terms of abstract resource quantities.
- The question uses the phrase “consuming additional imports of good X”. The opportunity cost is what the country gives up to consume those imports, which is the reduction in consumption of Y.
What are the terms of trade?
Options
A the difference in value between a country’s exports and imports
B the rate at which one currency can be exchanged for another
C the rate at which tariffs can legally be applied to exports and imports
D the ratio of average export prices to average import prices
Answer
The terms of trade are defined as the ratio of a country's average export prices to its average import prices. This corresponds to option D.
D
Background Concept
The terms of trade (TOT) measure the relative price of a country’s exports compared to its imports. It is calculated as:
TOT = (Index of average export prices / Index of average import prices) × 100
A rise in the index (improvement in the TOT) means a country can buy more imports for the same quantity of exports. Conversely, a deterioration means it must export more to buy the same quantity of imports. This concept is distinct from the balance of trade (difference between export and import values), the exchange rate (price of one currency in terms of another), and tariff rates (taxes on imports).
Understanding the Question
The question asks for the correct definition of the terms of trade among four options. Three are plausible distractors: the balance of trade (net export value), the exchange rate, and a tariff-related concept. The question tests whether the candidate knows the precise definition of this international trade term.
Approach
Recognise that the terms of trade is a ratio of prices, not a difference in values (A), not a currency exchange rate (B), and not a legal limit on tariffs (C). Option D matches the standard textbook definition.
Step-by-Step Reasoning
- Option A describes the balance of trade (exports minus imports in value terms), not the terms of trade. The terms of trade is a price ratio, not a value difference.
- Option B describes the exchange rate (price of one currency in another), which relates to currency markets, not trade prices.
- Option C describes a possible tariff rule, which is unrelated to the terms of trade definition.
- Option D correctly states the ratio of average export prices to average import prices, which is exactly how the terms of trade are defined in economics.
Thus, the correct answer is D.
Key Takeaways
- The terms of trade is a ratio of export to import prices, not a value measure.
- It measures how much import can be purchased per unit of export.
- Distinguishing it from the balance of trade, exchange rate, and protectionist measures is important for accurate economic literacy.
Common Mistakes
- Confusing the terms of trade with the balance of trade (a value difference).
- Thinking it refers to exchange rates because both involve “rates” or “trade”.
- Assuming it relates to tariffs or protectionism because of the word “trade”.
Things to Be Careful About
- Always check the precise wording: “ratio of prices” not “difference in values”.
- In calculation questions, ensure the correct indices are used and the base year is considered.
- Be aware that an improvement in the terms of trade is not always beneficial; it may reflect weak export demand or falling import prices.
An Australian family purchases a holiday to New Zealand and an Australian mining company sells coal to China.
Four students, A, B, C and D, are asked where these transactions appear in the current account of Australia’s balance of payments.
Which student is correct?
Options
| holiday to New Zealand | coal to China | |
|---|---|---|
| A | service export | good export |
| B | service export | good import |
| C | service import | good export |
| D | service import | good import |
Working
A holiday purchased from New Zealand by an Australian family is a service provided by New Zealand to Australia. For Australia, this is an import of a service (an outflow on the services account). Coal sold to China by an Australian mining company is a good produced in Australia and sold abroad. For Australia, this is an export of a good (an inflow on the goods account).
Answer
C
C
Background Concept
The current account of the balance of payments records transactions in goods, services, primary income (e.g. investment income) and secondary income (e.g. transfers). Trade in goods includes physical items such as coal, machinery, food. Trade in services includes intangible items such as tourism, transport, insurance, financial services. An export is a sale to a non-resident, bringing money into the country; an import is a purchase from a non-resident, sending money out.
Understanding the Question
The question presents two transactions involving Australia: (1) an Australian family buys a holiday in New Zealand, and (2) an Australian mining company sells coal to China. Four students give different classifications of these transactions as either a good/service export or import. We need to identify which student is correct. The key is to correctly identify whether each transaction is an export or import for Australia, and whether it is a good or a service.
Approach
Classify each transaction separately:
- For the holiday: the Australian family is a resident of Australia, and they are purchasing a service (the holiday experience) from New Zealand. This is an import of a service for Australia.
- For the coal: the Australian mining company is a resident of Australia, and they are selling a physical good (coal) to China. This is an export of a good for Australia.
Then match these classifications to the options in the table.
Step-by-Step Reasoning
-
Holiday to New Zealand: The Australian family is spending money in New Zealand for a holiday. The holiday is a service (accommodation, tours, etc.). Since the money flows from Australia to New Zealand, it is an import for Australia. So it is a service import.
-
Coal to China: The Australian mining company sells coal to China. Coal is a physical good. Money flows from China to Australia, so it is an export for Australia. So it is a good export.
-
Now look at the options:
- A: service export / good export → incorrect (holiday is import)
- B: service export / good import → incorrect (both wrong)
- C: service import / good export → correct
- D: service import / good import → incorrect (coal is export)
Thus student C is correct.
Key Takeaways
- The current account distinguishes between goods and services.
- An export is a sale to a non-resident; an import is a purchase from a non-resident.
- Tourism is a service; physical products are goods.
- Always consider the residency of the buyer and seller to determine export/import.
Common Mistakes
- Confusing the direction: thinking that an Australian buying a holiday abroad is an export because the money leaves Australia. Actually, it is an import of a service because the service is provided by a foreign country.
- Misclassifying services as goods: holidays, insurance, transport are services, not goods.
- Not paying attention to the residency: if the family were from New Zealand buying a holiday in Australia, it would be a service export for Australia.
Things to Be Careful About
- Read the question carefully: the family is Australian, so the transaction is from Australia's perspective.
- Remember that the current account records transactions between residents and non-residents.
- Goods are tangible; services are intangible. Coal is a good; a holiday is a service.
A government believes its current account deficit will be beneficial in the long run.
What is the most likely reason for this?
Options
A Immigration has increased.
B It imports capital goods.
C It exports raw materials.
D It reduces unemployment.
Reasoning
A current account deficit means the value of imports exceeds exports. If the deficit is due to importing capital goods (machinery, equipment), these can be used to increase the economy's productive capacity, leading to higher output and exports in the long run. This can eventually improve the current account. Therefore, the government may view such a deficit as beneficial.
Answer
B
B
Background Concept
A current account deficit occurs when a country's imports of goods, services, and income transfers exceed its exports. Not all deficits are harmful; the key is what the imports are used for. Imports of consumer goods provide immediate consumption but do not enhance future productive capacity. In contrast, imports of capital goods (e.g., machinery, equipment, technology) are investments that can increase the economy's productive capacity, leading to higher output, productivity, and eventually greater exports. This can improve the current account in the long run.
Understanding the Question
The question asks: why might a government believe its current account deficit will be beneficial in the long run? The answer must identify a reason that turns a short-term deficit into a long-term gain. The options present four possible causes of a deficit: increased immigration, importing capital goods, exporting raw materials, and reducing unemployment. Only one of these is likely to generate future benefits that outweigh the immediate deficit.
Approach
Evaluate each option in turn:
- A: Immigration increases demand for imports (e.g., food, housing) but does not necessarily boost productive capacity; it may even worsen the deficit without long-run benefit.
- B: Importing capital goods directly increases productive capacity, enabling future export growth and import substitution. This is the classic argument for a 'good' deficit.
- C: Exporting raw materials is a source of export revenue, not a cause of a deficit. If the country exports raw materials, that tends to improve the current account, not cause a deficit.
- D: Reducing unemployment may increase output and exports, but the deficit itself is not caused by reducing unemployment; rather, a deficit might be associated with higher imports due to increased demand. The link to long-run benefit is indirect and weaker than B.
Thus, B is the most likely reason.
Step-by-Step Reasoning
-
Option A: Immigration has increased. Immigration raises the population, increasing demand for goods and services, including imports. This can widen the current account deficit. However, immigrants also contribute to the labour force and may boost productive capacity over time, but the effect is uncertain and not as direct as importing capital goods. The question asks for the 'most likely' reason, and immigration's long-run benefit is less certain and slower to materialise.
-
Option B: It imports capital goods. Capital goods are used to produce other goods and services. By importing advanced machinery or technology, the economy can increase its productive capacity, improve efficiency, and raise potential output. This can lead to higher exports in the future (as domestic firms become more competitive) and reduce the need for imports of certain goods (import substitution). Thus, a deficit caused by capital goods imports can be seen as an investment that pays off in the long run. This is a standard argument in development economics and trade theory.
-
Option C: It exports raw materials. Exporting raw materials is a source of export revenue, which improves the current account. It does not cause a deficit; rather, it helps reduce a deficit. Therefore, this option does not explain why a deficit would be beneficial.
-
Option D: It reduces unemployment. Reducing unemployment typically increases aggregate demand and output. Higher output may lead to higher exports, but also higher imports due to increased income. The net effect on the current account is ambiguous. Moreover, the deficit itself is not caused by reducing unemployment; the deficit might be a consequence of expansionary policies. The long-run benefit of lower unemployment is real, but the question specifically links the deficit to the benefit. Option B provides a direct causal link: the deficit (imports of capital goods) causes the long-run benefit (increased productive capacity).
Therefore, the most likely reason is B.
Key Takeaways
- Not all current account deficits are harmful; the composition of imports matters.
- Imports of capital goods can be considered investment that enhances future productive capacity and export performance.
- When evaluating the desirability of a deficit, consider whether it finances consumption or investment.
- This question tests the ability to distinguish between different causes of a deficit and their long-run implications.
Common Mistakes
- Assuming any current account deficit is automatically bad. Many students might think deficits are always harmful and overlook the possibility of beneficial deficits.
- Confusing capital goods with consumer goods. Capital goods are used in production, while consumer goods are for immediate consumption.
- Misinterpreting option C: exporting raw materials is a positive for the current account, not a cause of deficit.
- Overlooking the 'long run' aspect: some options (like immigration) might have long-run benefits but are less direct and less certain than importing capital goods.
Things to Be Careful About
- Read the question carefully: it asks for the 'most likely reason' the government believes the deficit will be beneficial. This requires a comparative judgement among the options.
- Understand the difference between a deficit caused by consumption imports and one caused by investment imports.
- Remember that the current account includes trade in goods and services, primary income, and secondary income. Here, the focus is on goods imports.
- In multiple-choice questions, eliminate clearly wrong options first (C is clearly not a cause of deficit). Then compare the remaining options for the strongest link to long-run benefit.
A country has a freely floating exchange rate.
In which circumstance is it most likely to appreciate?
Options
A A competitor trading country experiences a fall in the value of its currency.
B Increased administrative burdens are placed on companies within this country wishing to buy imports.
C There is a fall in demand for its exports.
D There is a fall in the level of its rate of interest.
Reasoning
Under a freely floating exchange rate, the value of a currency is determined by demand and supply in the foreign exchange market. The currency appreciates when demand for it rises or supply of it falls.
Option B: Increased administrative burdens on companies wishing to buy imports make importing more costly and time-consuming. This reduces the quantity of imports demanded, which reduces the demand for foreign currency and therefore reduces the supply of the domestic currency on the foreign exchange market. A fall in supply of the domestic currency, with demand unchanged, causes the currency to appreciate.
Options A, C, and D all lead to a decrease in demand for the domestic currency (or an increase in its supply), causing depreciation, not appreciation.
Answer
B
B
Background Concept
In a freely floating exchange rate system, the value of a currency is determined by the forces of demand and supply in the foreign exchange market. The demand for a currency comes from foreigners who want to buy the country's exports, invest in its assets, or speculate on its value. The supply of a currency comes from domestic residents who need foreign currency to buy imports, invest abroad, or for other purposes. An appreciation occurs when the demand for the currency increases or the supply decreases, causing the exchange rate to rise (the currency becomes more valuable relative to other currencies).
Understanding the Question
The question asks: under a freely floating exchange rate, which of the four circumstances is most likely to cause the currency to appreciate? We need to evaluate each option and determine which one would increase demand for the domestic currency or reduce its supply, leading to an appreciation. The other options would likely cause depreciation.
Approach
For each option, consider its effect on the demand for and supply of the domestic currency in the foreign exchange market. Use the basic model: demand for domestic currency arises from exports, capital inflows, and speculation; supply arises from imports, capital outflows, and other uses. Identify whether the event increases demand, decreases supply, or does the opposite. Only the option that leads to an increase in demand or a decrease in supply (or both) will cause appreciation.
Step-by-Step Reasoning
Option A: A competitor trading country experiences a fall in the value of its currency.
- When a competitor's currency depreciates, its exports become cheaper in international markets. This makes the competitor's goods more attractive relative to this country's exports. As a result, demand for this country's exports is likely to fall. Lower export demand reduces the demand for this country's currency (since foreigners need less of it to buy exports). A decrease in demand for the currency, with supply unchanged, leads to depreciation, not appreciation. So A is incorrect.
Option B: Increased administrative burdens are placed on companies within this country wishing to buy imports.
- Administrative burdens (such as extra paperwork, licensing requirements, or inspections) make importing more difficult and costly. This discourages imports. When imports fall, domestic residents need less foreign currency to pay for them. Consequently, the supply of the domestic currency on the foreign exchange market decreases (because fewer domestic currency units are sold to obtain foreign currency). A decrease in supply of the domestic currency, with demand unchanged, causes the currency to appreciate. This is the only option that leads to appreciation. So B is correct.
Option C: There is a fall in demand for its exports.
- A fall in export demand directly reduces the demand for the domestic currency (since foreigners need less of it to buy exports). This decrease in demand causes depreciation. So C is incorrect.
Option D: There is a fall in the level of its rate of interest.
- A lower interest rate makes domestic financial assets less attractive to foreign investors. This reduces capital inflows (or increases capital outflows as domestic investors seek higher returns abroad). The demand for the domestic currency falls (fewer foreigners want to buy it to invest), and the supply may increase (as domestic residents sell the currency to buy foreign assets). Both effects lead to depreciation. So D is incorrect.
Therefore, only option B is likely to cause appreciation.
Key Takeaways
- The exchange rate under a floating system is determined by demand and supply of the currency.
- Factors that increase demand for the currency (e.g., higher exports, higher interest rates, increased foreign investment) cause appreciation.
- Factors that decrease supply of the currency (e.g., lower imports, reduced capital outflows) also cause appreciation.
- Trade barriers that reduce imports can lead to appreciation by reducing the supply of the domestic currency.
- It is important to distinguish between effects on demand and supply of the currency.
Common Mistakes
- Confusing the effect of imports on the foreign exchange market: imports create a supply of the domestic currency (to buy foreign currency), not a demand for it. Reducing imports reduces supply, which can cause appreciation.
- Thinking that a fall in exports always leads to appreciation: it actually reduces demand, causing depreciation.
- Assuming that a fall in interest rates attracts foreign investment: the opposite is true; lower interest rates make domestic assets less attractive, reducing demand for the currency.
- Overlooking the role of administrative burdens as a trade barrier that reduces imports.
Things to Be Careful About
- Always consider both demand and supply sides of the foreign exchange market.
- Remember that appreciation means the currency becomes more valuable (exchange rate rises).
- In a floating system, the central bank does not intervene, so the exchange rate adjusts freely to changes in demand and supply.
- Administrative burdens on imports are a form of non-tariff barrier; they reduce the quantity of imports, which reduces the supply of the domestic currency.
A country has a current account deficit.
What would be classified as a protectionist measure to restore the current account to equilibrium?
Options
A allow the exchange rate to appreciate
B increase income tax
C increase import tariffs
D increase the rate of interest
Answer
A current account deficit means the country's spending on imports exceeds its export earnings. A protectionist measure directly restricts imports. Increasing import tariffs raises the price of foreign goods, reducing the quantity of imports demanded and narrowing the deficit. This is a protectionist policy.
Answer
C
C
Background Concept
Protectionism refers to government policies that restrict international trade to protect domestic industries from foreign competition. Common protectionist measures include tariffs (taxes on imports), import quotas (limits on the quantity of imports), export subsidies, and non-tariff barriers such as excessive administrative requirements. The purpose is often to reduce a trade deficit, protect infant industries, or safeguard domestic employment.
Current account deficit occurs when a country's total payments for imports of goods, services, primary income, and secondary income exceed its total receipts from exports. A deficit implies the country is borrowing from abroad or running down its foreign assets.
Understanding the Question
The question asks which of four options would be classified as a protectionist measure to restore a current account deficit to equilibrium. The key is to identify which policy directly restricts imports or promotes exports through trade barriers, rather than affecting the economy indirectly through macroeconomic variables.
Approach
Evaluate each option against the definition of protectionism:
- A (allow the exchange rate to appreciate): This is an exchange rate policy, not a trade barrier. Appreciation makes exports more expensive and imports cheaper, worsening the deficit — the opposite of what is needed.
- B (increase income tax): This is a fiscal policy tool. It reduces disposable income, which may lower import spending indirectly, but it is not a protectionist measure.
- C (increase import tariffs): This is a classic protectionist measure — a direct tax on imports that raises their price and reduces import quantity.
- D (increase the rate of interest): This is a monetary policy tool. Higher interest rates may attract foreign capital and appreciate the currency, but they do not directly restrict trade.
Only option C fits the definition of protectionism.
Step-by-Step Reasoning
- Define protectionism: Policies that directly restrict the free flow of goods and services across borders, such as tariffs, quotas, and subsidies for domestic exporters.
- Assess each option:
- A: Exchange rate appreciation is a market outcome or policy choice, not a trade barrier. It would likely increase imports and reduce exports, worsening the deficit.
- B: Income tax changes affect aggregate demand and may reduce imports, but this is an indirect effect of fiscal policy, not a protectionist measure.
- C: Import tariffs are a direct tax on imported goods, raising their price and reducing demand for them. This is a textbook protectionist measure.
- D: Interest rate changes affect capital flows and the exchange rate, but do not directly restrict trade.
- Conclusion: Only option C is a protectionist measure.
Key Takeaways
- Protectionism is about direct trade barriers, not macroeconomic policy tools.
- Tariffs, quotas, and export subsidies are protectionist; fiscal and monetary policies are not.
- A current account deficit can be addressed by protectionist measures, but also by expenditure-switching policies (e.g., depreciation) or expenditure-reducing policies (e.g., contractionary fiscal/monetary policy).
Common Mistakes
- Confusing exchange rate policy with protectionism. Allowing the currency to depreciate is an expenditure-switching policy, not protectionism.
- Thinking that any policy that reduces imports is protectionist. Fiscal and monetary policies can reduce imports indirectly but are not classified as protectionist.
- Misidentifying interest rate changes as trade policy.
Things to Be Careful About
- The question asks specifically for a "protectionist measure" — the answer must be a direct trade barrier.
- Understand that protectionism is a subset of trade policy, distinct from macroeconomic policy.
- Remember that tariffs are the most common example of protectionism in multiple-choice questions.
Your score so far
Answer a question to start scoring
Your marks add up here as you work through the paper.