Economics 9708/13 — May/June 2025
Cambridge AS Level · AS Level Multiple Choice · answer key with instant marking and worked solutions
Topics Fiscal Policy · Classification of Goods and Services · Price Elasticity of Supply · Methods of Government Intervention in Markets · Aggregate Demand and Aggregate Supply · Monetary Policy · +15 more
Tap an option under each question to check it — your score builds as you go.
A tourist visits a government-owned tropical beach. She pays $10 to enter but finds it overcrowded.
Which type of good is the beach?
Options
A a free good
B an inferior good
C a public good
D a private good
Reasoning
The beach is excludable (a fee is charged) and rival (overcrowding occurs). These are the characteristics of a private good. It is not a free good because there is a positive price. It is not a public good because it is both excludable and rival. 'Inferior good' is a demand classification, not a type of good based on rivalry and excludability.
Answer
D
D
Background Concept
Goods are classified in economics based on two characteristics: rivalry and excludability. A good is rival if one person's consumption reduces the amount available for others. A good is excludable if it is possible to prevent people from consuming it (e.g., by charging a price).
- Private goods are both rival and excludable. Most goods we buy, like food, clothing, and cinema tickets, are private goods.
- Public goods are non-rival and non-excludable. Examples: street lighting, national defence. They are often provided by the government because the private sector would underprovide them due to the free-rider problem.
- Free goods are goods that are not scarce, such as sunlight or air. They have zero opportunity cost and are available at zero price.
- Inferior goods are a demand-side concept: goods for which demand falls as income rises. This is not related to rivalry/excludability.
Understanding the Question
The question describes a government-owned tropical beach. The tourist pays $10 to enter and finds it overcrowded. We need to identify which type of good the beach is from the options given. The key clues are: (1) a fee is charged (excludability), (2) overcrowding occurs (rivalry). The beach is government-owned, but that does not automatically make it a public good.
Approach
Apply the definitions: check if the good is excludable (yes, because a fee is charged) and rival (yes, because overcrowding suggests that more visitors reduce the quality for others). Then match to the correct category: private good. Eliminate the other options: free good (no price), public good (non-excludable and non-rival), inferior good (income-related, not relevant).
Step-by-Step Reasoning
-
Excludability: The beach charges an entry fee of $10. This means the owner can prevent people from using the beach without paying. Therefore, the beach is excludable.
-
Rivalry: The beach is described as 'overcrowded'. This implies that the consumption of the beach by one person reduces the availability or quality for others. If the beach were non-rival, additional visitors would not reduce the enjoyment of existing visitors. Therefore, the beach is rival.
-
Classification: A good that is both rival and excludable is a private good. Even though the beach is government-owned, it is still a private good in economic terms because it possesses these characteristics. Many state-owned enterprises provide private goods (e.g., public transport, state-owned utilities).
-
Eliminate other options:
- A free good: A free good is available at zero price and is not scarce. The beach charges a fee, so it is not a free good.
- B an inferior good: This is a type of normal good defined by a negative income elasticity of demand. The question does not provide any information about income, and the good's classification as inferior is unrelated to its rivalry/excludability. Hence, incorrect.
- C a public good: Public goods are non-rival and non-excludable. The beach is both excludable (fee) and rival (overcrowded), so it fails both conditions. Even if it were government-owned, it is not a public good.
Therefore, the correct answer is D: a private good.
Key Takeaways
- The classification of goods into private, public, free, etc., is based on the characteristics of rivalry and excludability, not on who owns them or whether a price is charged.
- A good can be provided by the government and still be a private good if it is rival and excludable.
- 'Inferior good' is a separate concept related to income elasticity, not to the nature of the good itself.
- When answering classification questions, always check for rivalry and excludability first.
Common Mistakes
- Confusing 'government-owned' with 'public good'. Many students think that because the government provides something, it must be a public good. But the government also provides private goods (e.g., toll roads, public transport).
- Thinking that 'free' in 'free good' means 'no price'. A free good must also be abundant with zero opportunity cost. The beach is scarce (overcrowded) and has a price, so it is not a free good.
- Misunderstanding 'inferior good' as a type of poor-quality good. Inferior good is defined by its demand response to income, not by its inherent quality.
Things to Be Careful About
- Pay attention to the exact wording of the question: 'overcrowded' indicates rivalry; 'pays $10 to enter' indicates excludability.
- Do not assume that any good provided by the government is a public good; check the two criteria.
- Remember that public goods are non-rival and non-excludable; if either condition fails, it is not a pure public good.
- For one-mark multiple-choice questions, often the fastest way is to eliminate the obviously wrong options first, then confirm the remaining one.
The diagram shows a country’s production possibilities. Points K, L, M, N, R and S represent different combinations of capital goods and consumer goods. Point K cannot be achieved unless there is economic growth. Point M lies on the country’s production possibility curve.
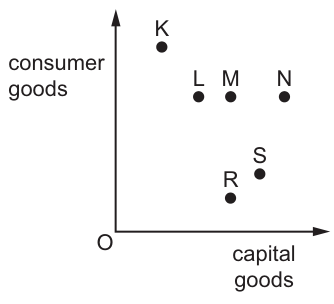
Which two points must be on opposite sides of the country’s production possibility curve?
Options
A K and N
B L and R
C N and R
D R and S
Reasoning
A production possibility curve (PPC) shows the maximum possible output combinations of two goods an economy can produce with its current resources and technology, assuming full and efficient resource use.
- Points ON the PPC (e.g. point M) are attainable and productively efficient.
- Points INSIDE the PPC (e.g. points L, R, S) are attainable but productively inefficient, as resources are unemployed or misallocated.
- Points OUTSIDE the PPC (e.g. points K, N) are unattainable with current resources and technology; economic growth would be required to reach them.
Opposite sides of the PPC therefore consist of one point inside the curve and one point outside the curve. Evaluating the options:
- A: K (outside) and N (outside) are on the same side of the PPC.
- B: L (inside) and R (inside) are on the same side of the PPC.
- C: N (outside) and R (inside) are on opposite sides of the PPC.
- D: R (inside) and S (inside) are on the same side of the PPC.
Answer
C
C
Background Concept
A production possibility curve (PPC, also called a production possibility frontier, PPF) is a fundamental economic model that illustrates the trade-offs an economy faces when allocating its scarce resources between the production of two different goods or services. The curve is typically drawn as concave to the origin, reflecting the law of increasing opportunity cost: as production of one good increases, the opportunity cost of producing additional units of that good rises, because resources that are less suited to producing that good must be reallocated.
There are three key positions relative to the PPC, each with a distinct economic meaning:
- Points on the PPC: These represent output combinations that are attainable with the economy's current resources and technology, and where all resources are being used fully and efficiently. This is the point of productive efficiency: it is impossible to produce more of one good without producing less of the other.
- Points inside the PPC: These are also attainable, but they represent inefficient use of resources. This could be due to unemployment of labour, idle capital, or misallocation of resources. It is possible to produce more of both goods without sacrificing any output of the other, by moving to a point on the PPC.
- Points outside the PPC: These represent output combinations that are unattainable with the economy's current level of resources and technology. To reach a point outside the PPC, the economy would need to experience economic growth: an increase in the quantity or quality of its resources, or technological progress that allows more output to be produced from the same inputs.
Understanding the Question
This 1-mark multiple-choice question tests your ability to interpret a PPC diagram and classify points according to their position relative to the curve. The diagram shows consumer goods on the vertical axis and capital goods on the horizontal axis, with six labelled points: K, L, M, N, R, S. The question explicitly states that point M lies on the PPC, and point K cannot be achieved without economic growth (so K is outside the PPC). The task is to identify which pair of points lies on opposite sides of the PPC: that is, one point inside the curve and one point outside the curve.
Approach
To solve this question, follow these steps:
- First, use the given information to anchor your classification: M is on the PPC, K is outside the PPC.
- Classify each remaining point relative to the PPC, using the axis labels to judge whether a point has more or less of each good than the maximum possible (the PPC):
- A point with more of one or both goods than the maximum shown by the PPC is outside the curve.
- A point with less of one or both goods than the maximum shown by the PPC is inside the curve.
- Eliminate options where both points are on the same side (both inside or both outside), leaving the pair with one inside and one outside.
Step-by-Step Reasoning
Let's classify each point based on the diagram:
- Point M: Given as on the PPC, so it is the efficiency benchmark for its level of consumer goods output.
- Point K: Explicitly stated as unattainable without growth, so it is outside the PPC. It has more consumer goods and more capital goods than any point on the current PPC.
- Point L: Lies on the same horizontal line as M (same quantity of consumer goods) but to the left of M (fewer capital goods). Since M is the maximum possible capital goods for that level of consumer goods, L is inside the PPC.
- Point N: Lies on the same horizontal line as M (same quantity of consumer goods) but to the right of M (more capital goods). This exceeds the maximum possible capital goods for that level of consumer goods, so N is outside the PPC.
- Point S: Lies below N (fewer consumer goods) and to the right of R (more capital goods than R). It has less of both goods than the maximum possible combination, so it is inside the PPC.
- Point R: Lies below S (fewer consumer goods) and to the left of S (fewer capital goods). It has less of both goods than the maximum possible, so it is inside the PPC.
Now evaluate each option:
- Option A (K and N): Both K and N are outside the PPC, so they are on the same side. Incorrect.
- Option B (L and R): Both L and R are inside the PPC, so they are on the same side. Incorrect.
- Option C (N and R): N is outside the PPC, R is inside the PPC, so they are on opposite sides. Correct.
- Option D (R and S): Both R and S are inside the PPC, so they are on the same side. Incorrect.
Key Takeaways
- The three positions relative to a PPC (on, inside, outside) correspond to three distinct economic outcomes: productive efficiency, inefficiency/unemployed resources, and unattainable output.
- To classify a point, compare its quantities of both goods to the maximum possible shown by the PPC: if it has more of either good than the PPC allows, it is outside; if it has less of both, it is inside.
- Points on the same horizontal or vertical line as a point on the PPC can still be on opposite sides of the curve if they have more of one good than the PPC permits.
Common Mistakes
- Misclassifying points to the right of a PPC point as inside: If a point has the same quantity of the vertical-axis good but more of the horizontal-axis good than a point on the PPC, it is outside the curve, not inside. This is a common error because students focus only on one axis when judging position.
- Assuming points on the same horizontal line are on the same side: Points L and N are on the same horizontal line as M (on the PPC), but L is inside (fewer capital goods) and N is outside (more capital goods), so they are on opposite sides of the curve.
- Confusing unattainable with inefficient: Points outside the PPC are not just inefficient — they are impossible to reach with current resources, while points inside are inefficient but attainable.
Things to Be Careful About
- Always check both axes when classifying a point: a point can be outside the PPC even if it has the same quantity of one good as a point on the curve, as long as it has more of the other good.
- The question asks for points on opposite sides of the curve, not opposite ends of the curve. This means one inside and one outside, not two points on the curve at opposite ends.
- Do not confuse economic growth (which shifts the PPC outward, making previously outside points attainable) with movements along or inside the existing PPC.
A firm produces 100 units of good Y and 200 units of good X with a fixed amount of resources. This firm wants to increase production of good Y to 120 units and as a result it can now only produce 170 units of good X.
What is the opportunity cost of producing the extra 20 units of good Y?
Options
A 20 units of good X
B 30 units of good X
C 120 units of good X
D 170 units of good X
Working
Opportunity cost is the next best alternative forgone. To produce an extra 20 units of good Y, the firm reduces production of good X from 200 units to 170 units.
Opportunity cost = 200 - 170 = 30 units of good X.
Answer
B
B
Background Concept
Opportunity cost is a fundamental concept in economics. It is defined as the cost of the next best alternative that is given up when a choice is made. It is not simply the monetary cost of a decision, but the value of the best thing you could have done instead. In the context of production, if a firm (or an economy) reallocates its scarce resources to produce more of one good, it must produce less of another good. The amount of the other good that is sacrificed is the opportunity cost of producing the extra units of the first good.
Understanding the Question
This question presents a simple production scenario. A firm has a fixed amount of resources. Initially, it produces 200 units of good X and 100 units of good Y. The firm then decides to increase the production of good Y by 20 units (from 100 to 120). To do this, it must divert resources away from producing good X. As a result, the production of good X falls from 200 units to 170 units. The question asks for the opportunity cost of producing the extra 20 units of good Y. This is a direct application of the definition: what is given up (the next best alternative) to get the extra Y?
Approach
The approach is straightforward. Identify the 'next best alternative' that is forgone. The firm gives up some units of good X to get more of good Y. The opportunity cost is the number of units of good X that are sacrificed. This is calculated by finding the difference between the original quantity of good X and the new quantity of good X.
Step-by-Step Reasoning
- Identify the initial situation: The firm produces 200 units of good X and 100 units of good Y.
- Identify the new situation: The firm produces 170 units of good X and 120 units of good Y.
- Identify the change in good Y (the choice made): The firm increases production of good Y by 20 units (120 - 100 = 20).
- Identify the change in good X (the alternative forgone): To increase production of good Y, the firm must reduce production of good X. The reduction is 200 - 170 = 30 units.
- Apply the definition of opportunity cost: The opportunity cost of the 20 extra units of good Y is the 30 units of good X that the firm can no longer produce. This is the 'next best alternative' that was sacrificed.
Therefore, the correct answer is B: 30 units of good X.
Key Takeaways
- Opportunity cost is not the total cost of a choice, but the value of the single best alternative that is given up.
- In production, it is measured by the amount of one good that must be sacrificed to produce more of another.
- The calculation is often a simple subtraction: original quantity of the forgone good minus the new quantity.
Common Mistakes
- Choosing A (20 units of good X): This is a common error where a student confuses the change in good Y (20 units) with the opportunity cost. The opportunity cost is the amount of the other good given up, not the amount of the good gained.
- Choosing C (120 units of good X) or D (170 units of good X): These answers show a misunderstanding of the concept. A student might pick the new total of good X (170) or the new total of good Y (120) without understanding that the cost is the change in the quantity of the forgone good.
Things to Be Careful About
- Always read the question carefully to identify which good is being increased and which good is being sacrificed.
- The opportunity cost is always expressed in terms of the good that is given up, not the good that is gained.
- Ensure you are calculating the change in the quantity of the forgone good, not the total quantity produced.
What is the most likely benefit of specialisation to a firm?
Options
A increase in motivation of employees
B increase in imports from other countries
C increase in the number of employees
D increase in the level of output
Answer
Specialisation allows workers to focus on a narrow range of tasks, developing greater skill and speed. This raises labour productivity, enabling the firm to produce more output from the same quantity of inputs. Therefore, the most likely benefit is an increase in the level of output.
Answer
D
D
Background Concept
Specialisation, also known as the division of labour, occurs when workers concentrate on a limited set of tasks rather than producing a whole product from start to finish. Adam Smith famously described this using a pin factory example: a single worker making pins by hand might produce only a few per day, but when the process is broken into many specialised steps, ten workers can produce tens of thousands. The key economic benefit is a rise in labour productivity — more output per worker per hour — which lowers average costs and increases the firm's total output.
Understanding the Question
This is a multiple-choice question asking for the most likely benefit of specialisation to a firm. The firm is the decision-making unit, so the correct answer must be a direct advantage that accrues to the firm itself, not to the wider economy or to employees. The four options are:
- A: increase in motivation of employees
- B: increase in imports from other countries
- C: increase in the number of employees
- D: increase in the level of output
Only one of these is a direct, predictable outcome of specialisation for the firm.
Approach
Evaluate each option against the known effects of specialisation. Eliminate options that are not direct benefits, that are uncertain, or that describe economy-wide rather than firm-level outcomes. The correct answer is the one that is both a likely and a direct consequence.
Step-by-Step Reasoning
Option A — increase in motivation of employees: Specialisation often involves repetitive, narrow tasks, which can actually reduce motivation and lead to boredom or alienation. While some workers may enjoy mastering a single skill, the overall effect on motivation is ambiguous and often negative. This is not a reliable benefit.
Option B — increase in imports from other countries: Specialisation within a firm does not directly cause imports. Imports are a macroeconomic phenomenon related to international trade. A firm might import more inputs if it specialises in assembly, but that is not a benefit of specialisation — it is a possible side effect, and not the most likely or direct one.
Option C — increase in the number of employees: Specialisation does not necessarily increase the number of employees. In fact, by raising productivity, a firm might produce the same output with fewer workers. The number of employees could rise if the firm expands, but that is an indirect and uncertain consequence, not a direct benefit.
Option D — increase in the level of output: This is the classic, well-documented benefit. By allowing workers to become faster and more skilled at their specific tasks, specialisation raises labour productivity. With the same or fewer inputs, the firm can produce more goods or services. This directly increases the firm's output, which is the most likely and most direct benefit.
Therefore, D is correct.
Key Takeaways
- Specialisation (division of labour) primarily raises labour productivity, leading to higher output per worker.
- The main benefit to the firm is increased output and lower average costs.
- Be careful to distinguish between benefits to the firm (output, costs) and broader effects (trade, employment levels) or uncertain outcomes (motivation).
Common Mistakes
- Choosing A (motivation) because of a vague association with 'skill development' — but the repetitive nature of specialised work often reduces motivation.
- Choosing C (more employees) because specialisation is sometimes linked to larger firms — but the causal link is weak; output can rise without hiring more people.
- Confusing specialisation within a firm with international specialisation and trade (option B).
Things to Be Careful About
- Read the question carefully: it asks for the benefit to a firm, not to the economy or to workers.
- Remember that the most direct and predictable effect of specialisation is on productivity and output, not on employment numbers or motivation.
Which row correctly identifies goods that would be expected to be produced in a mixed economy?
Options
| goods that are excludable and rival in consumption | goods that are non-excludable and non-rival in consumption | goods that have private and external benefits | |
|---|---|---|---|
| A | ✓ | ✓ | ✓ |
| B | ✓ | ✓ | ✗ |
| C | ✓ | ✗ | ✓ |
| D | ✗ | ✗ | ✓ |
Answer
A mixed economy combines market and government provision. Private goods (excludable and rival) are produced by the market. Public goods (non-excludable and non-rival) would be underprovided by the market, so the government produces them. Merit goods (goods that have private and external benefits) are under-consumed due to imperfect information, so the government provides or subsidises them. Therefore, in a mixed economy, all three types of goods are produced. Row A correctly identifies all three.
Answer
A
A
Background Concept
Goods can be classified by their characteristics of rivalry and excludability. Private goods are both rival (one person's consumption reduces availability for others) and excludable (sellers can prevent non-payers from consuming). They are efficiently provided by markets because firms can charge a price and profit. Public goods are non-rival and non-excludable; once provided, one person's consumption does not reduce availability, and it is impossible to exclude non-payers. This creates a free-rider problem, so the market underprovides them, and government intervention is needed. Merit goods are goods that have positive externalities (external benefits) in addition to private benefits, and they are often under-consumed because consumers have imperfect information about the long-term benefits. Governments may provide or subsidise them to correct the market failure. A mixed economy uses both market forces and government intervention to allocate resources, producing all three types.
Understanding the Question
The question presents a table with three types of goods defined by their characteristics: goods that are excludable and rival (private goods), goods that are non-excludable and non-rival (public goods), and goods that have private and external benefits (merit goods). It asks which row correctly identifies the goods that would be expected to be produced in a mixed economy. We need to know for each type whether it is produced in a mixed economy. The correct answer is the row that has a checkmark (✓) for all three types.
Approach
Recall the definition of each type and determine whether a mixed economy produces them. Private goods are produced by the market. Public goods are produced by the government because the market fails. Merit goods are produced (or subsidised) by the government to address under-consumption. Therefore, all three are produced in a mixed economy. Only row A has all three checkmarks.
Step-by-Step Reasoning
-
Goods that are excludable and rival in consumption – These are private goods. In a mixed economy, the market sector produces private goods efficiently. The government may also produce some private goods (e.g., state-owned enterprises), but the key point is that private goods are definitely produced. So this category should be checked.
-
Goods that are non-excludable and non-rival in consumption – These are public goods. The market underprovides them due to the free-rider problem. In a mixed economy, the government steps in to provide public goods (e.g., defence, street lighting). So this category should be checked.
-
Goods that have private and external benefits – These are merit goods (or goods with positive externalities). Again, the market underprovides them because consumers may not fully appreciate the external benefits. In a mixed economy, the government provides or subsidises such goods (e.g., education, healthcare). So this category should be checked.
Thus, all three types are produced in a mixed economy. The only row with all three checkmarks is row A.
- Row B: misses merit goods (✗ for goods with private and external benefits) – incorrect.
- Row C: misses public goods (✗ for non-excludable and non-rival) – incorrect.
- Row D: misses private goods (✗ for excludable and rival) and public goods (✗), only has merit goods – incorrect.
Therefore, the correct answer is A.
Key Takeaways
- The classification of goods into private, public, and merit goods helps explain why governments intervene in mixed economies.
- A mixed economy produces all three types: private goods via markets, public goods and merit goods via government provision or subsidy.
- Understanding the characteristics (excludability, rivalry, externalities) is essential for analysing market failure and government policy.
Common Mistakes
- Thinking that public goods are not produced at all in a mixed economy. In reality, the government provides them.
- Confusing merit goods with public goods. Merit goods are rival and excludable but have positive externalities; they are not public goods.
- Assuming that a mixed economy only produces private goods or only produces goods that the market can provide. The correct view is that the government supplements the market where it fails.
Things to Be Careful About
- Read the definitions in the table carefully: "goods that are excludable and rival" = private goods; "non-excludable and non-rival" = public goods; "goods that have private and external benefits" = merit goods.
- Remember that "produced" in a mixed economy includes both market production and government provision/subsidisation.
- Do not confuse "goods that have private and external benefits" with goods that are purely public; they are distinct categories.
A theatre has a fixed number of tickets to sell for each performance.
What is the price elasticity of supply?
Options
A perfectly elastic
B perfectly inelastic
C unit elastic and negative
D unit elastic and positive
Reasoning
The theatre has a fixed number of tickets for each performance. This means the quantity supplied cannot change at all in response to a change in price. Price elasticity of supply (PES) measures the responsiveness of quantity supplied to a change in price. If quantity supplied does not change when price changes, PES = 0, which is defined as perfectly inelastic supply.
Answer
B
B
Background Concept
Price elasticity of supply (PES) measures the responsiveness of the quantity supplied of a good or service to a change in its price. The formula is:
PES = (% change in quantity supplied) / (% change in price)
The coefficient can range from 0 to infinity. Key values are:
- PES = 0: Perfectly inelastic supply. Quantity supplied does not change at all when price changes. The supply curve is a vertical line.
- PES between 0 and 1: Inelastic supply. Quantity supplied changes by a smaller percentage than the price change.
- PES = 1: Unit elastic supply. Quantity supplied changes by the same percentage as the price change.
- PES > 1: Elastic supply. Quantity supplied changes by a larger percentage than the price change.
- PES = infinity: Perfectly elastic supply. Quantity supplied can change by any amount at a given price. The supply curve is a horizontal line.
PES is always positive because price and quantity supplied are positively related (the law of supply).
Understanding the Question
The question describes a theatre that has a fixed number of tickets for each performance. This is a classic example of a good with a perfectly inelastic supply. The question asks for the price elasticity of supply in this situation. The answer choices are the four main categories of elasticity: perfectly elastic, perfectly inelastic, unit elastic and negative (impossible for supply), and unit elastic and positive.
Approach
The key is to recognise that 'fixed number of tickets' means the quantity supplied is constant regardless of the price. Apply the definition of PES: if quantity supplied does not change, the numerator of the PES formula is zero, so PES = 0. This corresponds to perfectly inelastic supply.
Step-by-Step Reasoning
-
Identify the scenario: The theatre has a fixed number of tickets. This means the quantity supplied (the number of tickets available) is constant. It cannot be increased or decreased in response to a change in the ticket price.
-
Recall the definition of PES: PES = (% change in quantity supplied) / (% change in price).
-
Apply the definition: If the quantity supplied is fixed, then any change in price results in a 0% change in quantity supplied. Therefore, PES = 0% / (% change in price) = 0.
-
Match the coefficient to the correct term: A PES of 0 is defined as perfectly inelastic supply. The supply curve is a vertical line.
-
Evaluate the options:
- A (perfectly elastic): This would mean the quantity supplied could change by an infinite amount at a given price. This is the opposite of a fixed supply.
- B (perfectly inelastic): This is correct, as explained.
- C (unit elastic and negative): Unit elastic means PES = 1. A negative PES for supply is impossible because price and quantity supplied move in the same direction.
- D (unit elastic and positive): Unit elastic means PES = 1, which would require the quantity supplied to change by the same percentage as the price. This is not the case for a fixed supply.
Key Takeaways
- A fixed or perfectly unresponsive quantity supplied is the defining characteristic of perfectly inelastic supply (PES = 0).
- The supply curve for a good with perfectly inelastic supply is a vertical line.
- Common examples of perfectly inelastic supply include tickets for a specific event, seats on a particular flight, or land in a specific location.
- PES is always positive because of the law of supply.
Common Mistakes
- Confusing perfectly inelastic with perfectly elastic: A common error is to think that a fixed supply means the supplier cannot change the price, which is incorrect. The supplier can change the price, but the quantity supplied remains the same. Perfectly elastic supply means the supplier can sell any quantity at a given price.
- Thinking of unit elastic: A student might incorrectly think that because the number of tickets is fixed, the percentage change in quantity is zero, but then incorrectly calculate PES as 1 (perhaps confusing it with PED where a fixed quantity might imply unit elasticity along a certain curve). The correct calculation for PES with a fixed quantity is 0.
- Forgetting the sign: Supply elasticities are always positive. Options with a negative sign can be immediately eliminated.
Things to Be Careful About
- Read the question carefully: 'fixed number of tickets' is the key phrase that determines the elasticity.
- Distinguish between the elasticity of supply and the elasticity of demand. The question specifically asks for the price elasticity of supply.
- Remember the definitions of the different elasticity values (perfectly inelastic, inelastic, unit elastic, elastic, perfectly elastic) and what they imply about the shape of the supply curve.
The diagram shows the market for computers in a country.
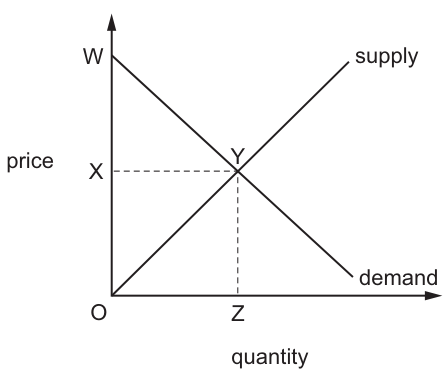
Which area represents consumer surplus?
Options
A WYX
B XYO
C WYO
D OYZ
Reasoning
Consumer surplus is the benefit consumers gain because they pay a market price lower than the maximum they are willing to pay for each unit purchased. On a demand and supply diagram, it is represented by the area under the demand curve, above the equilibrium market price, up to the equilibrium quantity.
In the given diagram, the downward-sloping demand curve starts at point W on the price axis. The equilibrium is at point Y, where demand meets supply, giving an equilibrium price of OX and equilibrium quantity of OZ. The area bounded by the demand curve, the price line OX, and the vertical line at OZ is the triangle WYX, which matches the definition of consumer surplus.
Answer
A
A
Background Concept
Consumer surplus is a core welfare economics concept that measures the net benefit consumers receive from purchasing a good at the market price, rather than the higher maximum price they would have been willing to pay for each individual unit. The demand curve plots this maximum willingness to pay for each quantity, so consumer surplus is always the area under the demand curve, above the prevailing market price, for all units actually purchased. It is used to assess how much better off consumers are as a result of participating in a market.
Understanding the Question
This 1-mark multiple-choice question provides a standard demand and supply diagram for the computer market, with labelled points W, X, Y, Z and axes for price (vertical) and quantity (horizontal). It asks which of the four listed areas represents consumer surplus. The task requires recalling the definition of consumer surplus and applying it to the specific features of the given diagram, then selecting the matching option from A to D.
Approach
First, recall the precise definition of consumer surplus and its standard graphical representation. Then locate the key features of the provided diagram: the downward-sloping demand curve (starting at W), upward-sloping supply curve (starting at O), equilibrium point Y, equilibrium price OX, and equilibrium quantity OZ. Match the definition to the area formed by these features, and eliminate incorrect options by recalling what the other areas represent.
Step-by-Step Reasoning
- Start with the definition of consumer surplus: it is the total gap between what consumers are willing to pay (shown by the demand curve) and what they actually pay (the market equilibrium price), summed across all units purchased. Graphically, this is the area under the demand curve, above the market price, up to the equilibrium quantity.
- Identify the equilibrium from the diagram: demand and supply intersect at point Y. The horizontal dashed line from Y to the price axis gives the equilibrium price OX, and the vertical dashed line from Y to the quantity axis gives the equilibrium quantity OZ.
- Map the definition to the diagram: the area under the demand curve (from W down to Y), above the market price line OX, and bounded by the quantity axis up to OZ, forms a triangle with vertices at W, Y and X. This is area WYX.
- Verify by eliminating incorrect options:
- Option B (XYO, also called OXY) is the area below the market price OX and above the supply curve: this is producer surplus, the equivalent welfare gain for producers, not consumers.
- Option C (WYO) is the total area between the demand and supply curves up to equilibrium quantity: this is total economic surplus (the sum of consumer and producer surplus), not just consumer surplus.
- Option D (OYZ) is the area below the supply curve up to equilibrium quantity: this represents the total variable cost of producing the equilibrium quantity, not a consumer benefit.
- The only area matching the definition of consumer surplus is WYX, so the correct answer is A.
Key Takeaways
- Consumer surplus is always the area above the market price, below the demand curve, and to the left of the equilibrium quantity on a demand and supply diagram.
- Producer surplus is the area below the market price, above the supply curve, and to the left of equilibrium quantity — these two surplus areas are often confused, so always check which curve you are measuring against.
- Total economic surplus is the sum of consumer and producer surplus, equal to the entire area between the demand and supply curves up to the equilibrium quantity.
Common Mistakes
- Mixing up consumer and producer surplus: this is the most common error, leading students to select option B (producer surplus) instead of the correct A.
- Misidentifying the boundaries of the area: for example, selecting option C (total surplus) by forgetting that consumer surplus only covers the area above the market price, not the entire gap between demand and supply.
- Forgetting that consumer surplus only applies to units actually bought (up to equilibrium quantity), not all units consumers might theoretically want.
Things to Be Careful About
- Always use the demand curve (not the supply curve) when identifying consumer surplus, as it reflects consumers' willingness to pay, which is the basis of the concept.
- Check the vertices of the area carefully: the three points of the consumer surplus triangle are the demand curve intercept on the price axis (W), the equilibrium point (Y), and the equilibrium price on the price axis (X).
- Confirm the area is above the market price, not below it, to represent the gap between willingness to pay and actual payment.
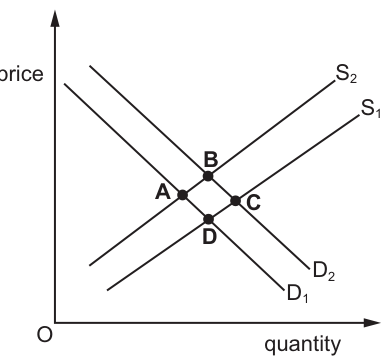
The diagram shows the market demand for and supply of foodstuffs for an economy.
This economy has faced a decrease in the supply of foodstuffs and, at the same time, an increase in demand for foodstuffs by consumers.
Which point represents the market equilibrium following these changes?
Options
A point A on Fig. 8.1
B point B on Fig. 8.1
C point C on Fig. 8.1
D point D on Fig. 8.1
Reasoning
A decrease in the supply of foodstuffs causes the supply curve to shift leftwards from S1 to S2. An increase in consumer demand causes the demand curve to shift rightwards from D1 to D2. The new market equilibrium occurs at the intersection of the new demand curve (D2) and the new supply curve (S2), which is point B.
Answer
B
B
Background Concept
This question relies on the demand and supply model, the core framework for analysing how competitive markets operate. In this model, the demand curve shows the relationship between the price of a good and the quantity consumers are willing and able to buy, ceteris paribus. The supply curve shows the relationship between the price of a good and the quantity firms are willing and able to sell, ceteris paribus. Market equilibrium is the point where the quantity demanded equals the quantity supplied (Qd = Qs): at this price, there is no surplus or shortage, so there is no tendency for the price to change. Curves shift (rather than moving along them) when there is a change in a non-price determinant of demand or supply: for example, changes in income, tastes, input costs, or the number of buyers/sellers. A rightward shift of demand represents an increase in demand (more is demanded at every price), while a leftward shift represents a decrease. A rightward shift of supply represents an increase in supply (more is supplied at every price), while a leftward shift represents a decrease.
Understanding the Question
The question describes two simultaneous changes in the market for foodstuffs: (1) a decrease in supply, and (2) an increase in consumer demand. It provides a diagram with the original demand curve (D1), original supply curve (S1), the shifted demand curve (D2, to the right of D1, representing higher demand), and the shifted supply curve (S2, to the left of S1, representing lower supply). Four equilibrium points are labelled: A (intersection of D1 and S2), B (intersection of D2 and S2), C (intersection of D2 and S1), D (intersection of D1 and S1). The task is to identify which point is the new market equilibrium after both changes have taken effect. This is a 1-mark multiple-choice question testing basic application of demand and supply shift analysis.
Approach
To solve this, follow two steps:
- First, confirm the direction of each curve shift based on the changes described:
- A decrease in supply shifts the supply curve left (from S1 to S2).
- An increase in demand shifts the demand curve right (from D1 to D2).
- Recall that market equilibrium is always at the intersection of the relevant demand and supply curves. Since both curves have shifted, the new equilibrium must be at the intersection of the new demand curve (D2) and the new supply curve (S2), not a mix of old and new curves or the original curves. Then match this intersection to the labelled points in the diagram.
Step-by-Step Reasoning
- First, identify the original market equilibrium: this is where the original demand curve (D1) meets the original supply curve (S1), which is point D. This is the equilibrium before any of the described changes occur.
- Analyse the first change: a decrease in the supply of foodstuffs. This could be caused by events such as a poor harvest, higher costs of agricultural inputs (e.g. fuel, fertilizer), or a reduction in the number of food producers. A decrease in supply means that at every price level, firms are willing and able to sell less food than before. This causes the entire supply curve to shift leftwards, from S1 to S2.
- Analyse the second change: an increase in consumer demand for foodstuffs. This could be caused by rising household incomes (if food is a normal good), a shift in consumer preferences towards healthier eating, or an increase in the size of the population. An increase in demand means that at every price level, consumers are willing and able to buy more food than before. This causes the entire demand curve to shift rightwards, from D1 to D2.
- Find the new equilibrium: after both shifts, the market will settle at the point where the new quantity demanded equals the new quantity supplied. This is the intersection of the new demand curve (D2) and the new supply curve (S2). Looking at the diagram, this intersection is labelled point B.
- Eliminate the other options:
- Point A is the intersection of the original demand (D1) and new supply (S2): this would only be correct if demand had not changed, which contradicts the question.
- Point C is the intersection of the new demand (D2) and original supply (S1): this would only be correct if supply had not changed, which contradicts the question.
- Point D is the intersection of the original demand and original supply: this is the pre-change equilibrium, not the new one.
- Note the change in equilibrium price: both shifts put upward pressure on the price of food. The leftward supply shift means less food is available at each price, pushing prices up. The rightward demand shift means more consumers want to buy food at each price, also pushing prices up. So the new equilibrium price at B is higher than the original price at D. The change in equilibrium quantity is ambiguous: the rightward demand shift tends to raise quantity, while the leftward supply shift tends to lower quantity. The actual change in quantity depends on the relative size of the two shifts, but this does not affect the identification of the equilibrium point, which is unambiguously B.
Key Takeaways
- A shift in a demand or supply curve is triggered by a change in a non-price determinant (e.g. income, costs, tastes), not a change in the price of the good itself (which causes a movement along the curve).
- When multiple changes occur in a market, the new equilibrium is always at the intersection of the new demand and new supply curves, after all shifts have been applied.
- When demand increases (shifts right) and supply decreases (shifts left) at the same time, the equilibrium price will definitely rise, while the change in equilibrium quantity depends on which shift is larger.
Common Mistakes
- Confusing shifts with movements along curves: Some students incorrectly think that a change in the price of food causes a shift in demand or supply, rather than a movement along the existing curve. This leads to misidentifying the shifted curves.
- Only applying one of the two changes: Students may pick point A (only supply shifted) or point C (only demand shifted), forgetting that the question states both changes happen at the same time, so both curves must shift.
- Selecting the original equilibrium: Some students pick point D, which is the equilibrium before any changes, not after.
- Misidentifying the direction of shifts: For example, thinking a decrease in supply shifts the curve right, or an increase in demand shifts left, which leads to selecting the wrong intersection point.
Things to Be Careful About
- Always check the direction of the shifts first: an increase in demand is a rightward shift, a decrease in supply is a leftward shift. The diagram labels D2 to the right of D1 (so higher demand) and S2 to the left of S1 (so lower supply), which matches the changes described.
- Ensure you use the new curves for both demand and supply when both have changed: do not mix an old curve with a new one unless the question explicitly asks for the effect of only one change.
- Remember that equilibrium is defined as the point where Qd = Qs, so it must always be the intersection of the relevant demand and supply curves, regardless of the direction of shifts.
What is true for income elasticity of demand but not for price elasticity of demand?
Options
A It helps firms differentiate between goods with elastic and inelastic demand.
B It helps firms differentiate between normal and inferior goods.
C It helps firms predict the changes in the quantity demanded.
D It helps firms predict the changes in sales revenues.
Answer
Income elasticity of demand (YED) measures the responsiveness of quantity demanded to a change in income. A positive YED identifies a normal good; a negative YED identifies an inferior good. Price elasticity of demand (PED) measures responsiveness to a change in the good's own price and cannot distinguish between normal and inferior goods. Therefore, the correct answer is B.
B
Background Concept
Elasticities measure the responsiveness of one variable to a change in another. Price elasticity of demand (PED) measures how quantity demanded responds to a change in the good's own price. Income elasticity of demand (YED) measures how quantity demanded responds to a change in consumers' income. Each has a unique set of applications based on what it measures.
Understanding the Question
The question asks which statement is true for YED but NOT for PED. This is a comparative question: you need to identify a property or application that is exclusive to YED. The four options present potential uses of elasticity concepts. The correct one will be something PED cannot do but YED can.
Approach
Review each option and ask: "Can PED do this?" If yes, the option is wrong because the question requires something true for YED but NOT for PED. If PED cannot do it, check whether YED can. The unique feature of YED is its ability to classify goods by their income responsiveness.
Step-by-Step Reasoning
-
Option A: "It helps firms differentiate between goods with elastic and inelastic demand." Both PED and YED have elastic and inelastic ranges. PED directly classifies goods as elastic (|PED| > 1) or inelastic (|PED| < 1). YED can also be elastic or inelastic, but this is not unique to YED. So A is wrong.
-
Option B: "It helps firms differentiate between normal and inferior goods." This is the defining application of YED. A positive YED means the good is normal (demand rises as income rises). A negative YED means the good is inferior (demand falls as income rises). PED says nothing about income responsiveness; it only measures price responsiveness. PED cannot classify goods as normal or inferior. This is unique to YED. So B is correct.
-
Option C: "It helps firms predict the changes in the quantity demanded." Both PED and YED can predict changes in quantity demanded. PED predicts the effect of a price change; YED predicts the effect of an income change. This is not unique to YED. So C is wrong.
-
Option D: "It helps firms predict the changes in sales revenues." PED is directly used to predict revenue changes from price changes (if demand is elastic, a price cut raises revenue; if inelastic, a price cut lowers revenue). YED can also be used to predict revenue changes from income changes, but this is not unique to YED. So D is wrong.
Key Takeaways
- YED is the only elasticity that can distinguish normal goods from inferior goods based on the sign of the coefficient.
- PED is used for pricing decisions and revenue predictions from price changes.
- Both PED and YED can predict changes in quantity demanded, but for different reasons (price vs. income).
Common Mistakes
- Confusing the applications of PED and YED. Students often think PED can classify goods as normal or inferior, but it cannot.
- Thinking that any elasticity can predict revenue changes. While both can, the question asks for something true for YED but NOT for PED, so a shared property is incorrect.
Things to Be Careful About
- Read the question carefully: "true for income elasticity of demand but not for price elasticity of demand." This means the property must be exclusive to YED.
- Remember the sign of YED is crucial: positive = normal, negative = inferior. PED has no such sign-based classification for income effects.
The table shows the supply and demand for avocados in kilograms (kg).
| price per kg ($) | quantity demanded per day (kg) | quantity supplied per day (kg) |
|---|---|---|
| 45 | 170 | 230 |
| 40 | 190 | 190 |
| 35 | 210 | 150 |
| 30 | 230 | 110 |
As a result of lower transport costs, supply rises by 60 kg at all prices.
What is the new equilibrium price?
Options
A $45
B $40
C $35
D $30
Working
Original supply at each price:
- $45: 230 kg
- $40: 190 kg
- $35: 150 kg
- $30: 110 kg
After a 60 kg increase:
- $45: 290 kg
- $40: 250 kg
- $35: 210 kg
- $30: 170 kg
Demand unchanged:
- $45: 170 kg
- $40: 190 kg
- $35: 210 kg
- $30: 230 kg
Equilibrium occurs where quantity demanded = quantity supplied. This happens at $35 per kg, where both are 210 kg.
Answer
C
C
Background Concept
This question tests the concept of market equilibrium and how a change in supply affects the equilibrium price. In a competitive market, the equilibrium price is where the quantity demanded equals the quantity supplied. A change in supply (caused by lower transport costs) shifts the supply curve to the right, meaning at every price, producers are willing to supply more. This leads to a surplus at the original price, putting downward pressure on price until a new equilibrium is reached. The size of the shift and the responsiveness of demand determine the new equilibrium.
Understanding the Question
The question provides a schedule of demand and supply for avocados at various prices. It then tells us that lower transport costs increase supply by 60 kg at all prices. We are asked to find the new equilibrium price. This is a straightforward application of supply shift and equilibrium identification. The command is to calculate the new equilibrium price; no evaluation needed.
Approach
First, add 60 kg to the original quantity supplied at each price to get the new supply schedule. Then, look for the price where the new quantity supplied equals the quantity demanded (which has not changed). That price is the new equilibrium. The options are given, so we can check each price.
Step-by-Step Reasoning
- Write down the original data from the table.
- Increase each quantity supplied by 60 kg.
- Compare the new quantities supplied with the quantities demanded.
- At $45: demand 170, supply 290 -> surplus -> price will fall.
- At $40: demand 190, supply 250 -> surplus -> price will fall.
- At $35: demand 210, supply 210 -> equilibrium.
- At $30: demand 230, supply 170 -> shortage -> price will rise.
- Therefore, the new equilibrium price is $35 per kg, option C.
If we had to calculate without options, we could interpolate, but here the exact match is given.
Key Takeaways
- A shift in supply changes the equilibrium price and quantity in opposite directions (price falls, quantity rises when supply increases, ceteris paribus).
- To find the new equilibrium after a supply shift, compute the new supply schedule and match with unchanged demand.
- The equilibrium condition is Qd = Qs.
Common Mistakes
- Forgetting to add the shift to all prices, or adding only to one price.
- Confusing a shift in supply with a shift in demand — the question clearly states lower transport costs affect supply.
- Misreading the table: the original equilibrium was at $40 (190 = 190). After the shift, the new equilibrium is at $35, not $40. Some might mistakenly think the original equilibrium remains.
- Not checking all prices: the equilibrium might not be exactly at one of the given prices if the schedule is not continuous; here it matches exactly.
Things to Be Careful About
- Units: the quantities are in kg per day, the price is per kg.
- Ensure you add 60 to the quantity supplied, not to the price or demand.
- The shift is 'at all prices', meaning parallel shift; not a change in slope.
- If the shift had been a percentage, it would be different, but here it's a fixed absolute increase.
A construction firm estimates that the price elasticity of supply in building a nuclear power plant is +0.1.
What might explain this?
Options
A The firm can easily find new land as required.
B The firm is competing with many other construction firms.
C The firm needs time to hire the highly skilled labour required.
D There is a lack of close substitutes for nuclear power.
Reasoning
A price elasticity of supply of +0.1 means supply is very inelastic: the quantity supplied changes very little in response to a price change. This occurs when it is difficult or time-consuming to increase output. Option C – the firm needs time to hire highly skilled labour – directly explains this, because time is a key factor affecting PES: in the short run, supply is less elastic.
Option A is incorrect: easily finding new land would make supply more elastic, not less. Option B is irrelevant: the number of competing firms affects market supply, not the firm's ability to increase output. Option D is about demand-side substitutability, not supply.
Answer
C
C
Background Concept
Price elasticity of supply (PES) measures the responsiveness of quantity supplied to a change in price. It is calculated as:
PES = % change in quantity supplied / % change in price
A PES of +0.1 is very inelastic (between 0 and 1). This means that a 1% increase in price leads to only a 0.1% increase in quantity supplied. Supply is inelastic when producers cannot easily or quickly increase output. Key factors affecting PES include:
- Time period: supply is more elastic in the long run because firms can adjust all factors of production.
- Availability of spare capacity: if firms are already operating at full capacity, supply is inelastic.
- Ease of storing stock: firms with large inventories can increase supply quickly.
- Complexity of production: products that require specialised labour or long production processes have inelastic supply.
Understanding the Question
The question gives a specific PES value of +0.1 for building a nuclear power plant. The task is to identify which of four options is a plausible reason for such a low elasticity. The options test understanding of what makes supply inelastic: bottlenecks in production, time requirements, or constraints on factors of production. The other options are either irrelevant or would increase elasticity.
Approach
We evaluate each option against the known factors that affect price elasticity of supply. Option C directly involves time and skilled labour, which are classic constraints on supply responsiveness. The other options are eliminated because they either suggest the opposite effect (A), are irrelevant to supply elasticity (B), or relate to demand elasticity (D).
Step-by-Step Reasoning
-
Option A: The firm can easily find new land as required.
- If land is easily available, the firm can expand its operations quickly, making supply more elastic. This would produce a higher PES, not a low one. So this option does not explain the low PES.
-
Option B: The firm is competing with many other construction firms.
- Many competing firms might affect the market supply curve, but it does not directly affect the firm's own ability to increase output. Competition does not make supply inelastic. In fact, many firms in an industry can sometimes mean more potential for aggregate supply to respond, but this is not a clear factor. This option is irrelevant.
-
Option C: The firm needs time to hire the highly skilled labour required.
- This is a classic reason for inelastic supply: if the firm cannot quickly obtain the necessary inputs (especially specialised labour), it cannot increase output in response to a price rise. The need for time implies short-run constraints, leading to low PES. This correctly explains the value of +0.1.
-
Option D: There is a lack of close substitutes for nuclear power.
- Lack of substitutes affects the price elasticity of demand (consumers have fewer alternatives, so demand is less elastic). It has no direct bearing on the supply side. The question is about PES, so this is irrelevant.
Therefore, the only plausible explanation is C.
Key Takeaways
- Price elasticity of supply depends on the ability and speed with which producers can increase output.
- Time is a crucial factor: the longer the time period, the more elastic supply tends to be.
- Factors like availability of inputs, spare capacity, and production complexity affect PES.
- Do not confuse factors affecting PES with those affecting PED (e.g., availability of substitutes).
Common Mistakes
- Choosing Option A: Thinking that easy availability of land might reduce supply elasticity, but it actually increases it.
- Choosing Option D: Confusing supply elasticity with demand elasticity; lack of substitutes affects demand, not supply.
- Choosing Option B: Assuming that competition reduces a firm's ability to raise price, but competition does not directly affect the quantity response to a price change.
Things to Be Careful About
- Always read the question carefully: it asks for an explanation of a low PES, not a high PES.
- Remember that the PES value is positive (supply curves slope upward) and its magnitude indicates responsiveness.
- Distinguish between factors that affect the elasticity of supply and those that affect the elasticity of demand.
- Time is a central factor: short-run supply is usually inelastic, long-run supply more elastic.
Which statement about maximum and minimum prices is correct?
Options
A With an effective maximum price for a product, a shortage will develop.
B With an effective maximum price for a product, the market price will rise.
C With an effective minimum price for a product, rationing will be necessary.
D With an effective minimum price for a product, the market price will fall.
Answer
An effective maximum price is set below the free-market equilibrium. At this lower price, quantity demanded exceeds quantity supplied, creating a shortage. Therefore, statement A is correct.
A
Background Concept
A maximum price (price ceiling) is a legally imposed upper limit on the price of a good or service. It is 'effective' only when set below the free-market equilibrium price. At that lower price, the quantity demanded by consumers exceeds the quantity supplied by producers, leading to a persistent shortage. A minimum price (price floor) is a legally imposed lower limit, effective when set above the equilibrium, leading to a surplus.
Understanding the Question
The question asks which of four statements about maximum and minimum prices is correct. It tests the basic understanding of how effective price controls affect market outcomes: shortage or surplus, and whether the market price rises or falls. The correct answer is the one that accurately describes the consequence of an effective maximum price.
Approach
Recall the standard analysis: an effective maximum price is below equilibrium -> shortage. An effective minimum price is above equilibrium -> surplus. Evaluate each option against this framework.
Step-by-Step Reasoning
- Option A: 'With an effective maximum price for a product, a shortage will develop.' This is correct. At a price below equilibrium, demand exceeds supply.
- Option B: 'With an effective maximum price for a product, the market price will rise.' This is false. The maximum price prevents the market price from rising to equilibrium; it is held down.
- Option C: 'With an effective minimum price for a product, rationing will be necessary.' This is false. A minimum price creates a surplus, not a shortage. Rationing is typically associated with shortages (e.g., under a maximum price).
- Option D: 'With an effective minimum price for a product, the market price will fall.' This is false. The minimum price holds the price above equilibrium; it does not cause it to fall.
Key Takeaways
- Effective maximum price -> shortage (excess demand).
- Effective minimum price -> surplus (excess supply).
- The 'effectiveness' of a price control depends on its position relative to the free-market equilibrium.
Common Mistakes
- Confusing the effects of maximum and minimum prices (e.g., thinking a maximum price creates a surplus).
- Assuming that a price control always 'works' regardless of its level relative to equilibrium.
Things to Be Careful About
- The word 'effective' is crucial: a maximum price set above equilibrium has no effect; a minimum price set below equilibrium has no effect.
- Rationing is a response to shortage, not surplus.
A flood-control dam is an example of a good provided directly by a government.
Which statement relating to the direct provision of a flood-control dam is not correct?
Options
A It allows the government to tackle the failure to provide public goods.
B It forces the government to incur an opportunity cost.
C It involves the supply of a merit good.
D It is an example of government allocation of resources.
Reasoning
A flood-control dam is a public good because it is non-rival and non-excludable. It is not a merit good, which is defined as a good that is under-consumed due to imperfect information. Therefore, the incorrect statement is C.
Answer
C
C
Background Concept
Public goods are goods that are non-rival (one person's consumption does not reduce the amount available for others) and non-excludable (it is impossible or very costly to exclude anyone from consuming the good). Because of the free-rider problem, private markets fail to provide public goods, so governments often step in to provide them directly. Merit goods are goods that are under-consumed in a free market because individuals do not have perfect information about the benefits of consuming them (e.g., education, healthcare). They are often private goods that have positive externalities. Flood-control dams are a classic example of a public good: they protect an entire area from flooding, and it is impractical to exclude individuals from the protection. The government's direct provision of such a dam involves an opportunity cost (the resources used could have been employed elsewhere) and is a clear example of government allocation of resources.
Understanding the Question
The question asks: 'Which statement relating to the direct provision of a flood-control dam is not correct?' Four statements are given, and only one is false. To answer, we must correctly classify the flood-control dam and understand the implications of government provision. The options touch on: (A) addressing the failure to provide public goods, (B) opportunity cost, (C) involvement of a merit good, (D) government allocation of resources. The false statement is the one that misclassifies the dam as a merit good.
Approach
First, identify the nature of the good: a flood-control dam is a public good. Then evaluate each statement against this classification. Statements A, B, and D are true; statement C is false because a flood-control dam is a public good, not a merit good.
Step-by-Step Reasoning
-
Option A: 'It allows the government to tackle the failure to provide public goods.' This is correct. Public goods are under-provided by the market due to the free-rider problem. Direct government provision is a way to address this market failure. The flood-control dam is a public good, so this statement is correct.
-
Option B: 'It forces the government to incur an opportunity cost.' This is correct. When the government spends resources on the dam, those resources cannot be used for other purposes (e.g., building a school or reducing taxes). Opportunity cost is a fundamental concept in economics that applies to all choices, including government decisions.
-
Option C: 'It involves the supply of a merit good.' This is incorrect. A merit good is a good that is under-consumed due to imperfect information about its benefits. Common examples are education and healthcare. A flood-control dam is a public good, not a merit good. The benefit of flood protection is well-understood; the market failure is non-excludability, not imperfect information. Therefore, this statement is false.
-
Option D: 'It is an example of government allocation of resources.' This is correct. Direct provision of goods and services is a method of government intervention where the government allocates resources to produce goods that are not provided by the private sector. The dam is a clear example of this.
Thus, the incorrect statement is C.
Key Takeaways
- Public goods are non-rival and non-excludable; merit goods are under-consumed due to imperfect information.
- Government intervention always involves an opportunity cost.
- Direct provision is a method of government allocation of resources.
- Be able to classify goods correctly: public goods, merit goods, private goods.
Common Mistakes
- Confusing public goods with merit goods: many students mistakenly think that all government-provided goods are merit goods. For example, a flood-control dam is a public good, not a merit good.
- Forgetting that opportunity cost applies to government spending as well as private spending.
- Thinking that any good provided by the government is automatically a public good – some government-provided goods are private goods (e.g., postal services), but the dam is a public good.
Things to Be Careful About
- Use precise definitions: public goods are defined by non-rivalry and non-excludability; merit goods are defined by under-consumption due to imperfect information.
- A flood-control dam is a textbook example of a public good, not a merit good.
- When evaluating statements, check each one against the correct classification of the good.
- Remember that opportunity cost is a universal concept, so option B is always true for any government spending.
- Option D is straightforward: direct provision is a form of resource allocation by the government.
A country depends heavily on the production of an agricultural product, good X. It decides to introduce a buffer stock scheme for good X. The government allocates a fixed amount of money for setting up and running the scheme.
In which situation is the scheme least likely to run out of money?
Options
| ability of new farmers to start growing good X | cost of storing good X | global demand for good X | |
|---|---|---|---|
| A | easy | high | constant |
| B | easy | low | rising |
| C | difficult | high | constant |
| D | difficult | low | rising |
Reasoning
A buffer stock scheme buys the good when the market price is low and sells when it is high. The scheme's money is spent on purchases and storage, and replenished by sales. For the scheme to be least likely to run out of money, it needs limited need to buy (i.e., limited surplus) and good opportunities to sell at a profit (i.e., rising demand) while keeping costs low.
- Ability of new farmers to start growing good X: If entry is difficult, supply is less responsive to price, reducing the risk of large surpluses that force the scheme to buy heavily. Easy entry raises that risk. So 'difficult' is better.
- Cost of storing good X: Low storage costs preserve the scheme's funds. High costs drain them. So 'low' is better.
- Global demand for good X: Rising global demand means the scheme can sell its stocks at higher prices, potentially making a profit and replenishing its money. Constant demand offers no such improvement. So 'rising' is better.
Option D combines all three favourable conditions: difficult entry, low storage cost, and rising demand. This makes it the situation least likely to run out of money.
Answer
D
D
Background Concept
A buffer stock scheme is a government intervention designed to stabilise the price of a commodity, typically an agricultural product subject to volatile supply and demand. The scheme buys the good when the market price falls below a target floor price, accumulating stocks. It sells from those stocks when the price rises above a target ceiling price, releasing them onto the market. The scheme is funded by a fixed budget allocated by the government. Its financial sustainability depends on how much it must spend on purchases and storage, and how much revenue it generates from sales.
Understanding the Question
The question asks: in which situation is the scheme least likely to run out of money? This means the scenario where the scheme's budget is most secure — where the combination of factors makes it most likely that the scheme can cover its costs and not need additional funding. The three factors given are:
- Ability of new farmers to start growing good X (easy or difficult) — affects supply responsiveness.
- Cost of storing good X (high or low) — affects the scheme's operating expenses.
- Global demand for good X (constant or rising) — affects the scheme's ability to sell stocks at favourable prices.
The options are combinations of these factors (A, B, C, D). We need to identify which combination is most financially favourable for the scheme.
Approach
Consider each factor in turn, determining which level (easy/difficult, high/low, constant/rising) reduces the risk of the scheme running out of money. Then, find the option that has all the favourable levels. The favourable combination is: difficult entry, low storage cost, rising demand. That is option D.
Step-by-Step Reasoning
-
Ability of new farmers to start growing good X
- If entry is easy, more farmers can respond to the guaranteed floor price by increasing production. This can create a persistent surplus, forcing the scheme to buy large quantities year after year, depleting its funds quickly.
- If entry is difficult (e.g., because of high startup costs, limited land, or regulatory barriers), supply is less elastic. Surpluses are less likely to be large, so the scheme's buying obligations remain smaller and more manageable.
- Conclusion: Difficult entry is favourable.
-
Cost of storing good X
- The scheme must store the commodity it buys, incurring costs for warehousing, insurance, spoilage, etc.
- If storage costs are high, these expenses eat into the scheme's budget every period, reducing the funds available for future purchases or requiring more frequent sales.
- If storage costs are low, the scheme can hold stocks more cheaply, preserving its money.
- Conclusion: Low storage cost is favourable.
-
Global demand for good X
- When global demand is rising, the equilibrium price tends to increase over time. The scheme can sell its stocks at higher prices, possibly making a profit that replenishes its funds. Rising demand also reduces the risk of a prolonged surplus because the market absorbs more.
- When global demand is constant, there is no such upward price trend. The scheme may struggle to sell its stocks without making a loss, especially if it bought at the floor price and can only sell at the ceiling price (which may be close to the floor). Constant demand also offers no automatic correction for surpluses.
- Conclusion: Rising demand is favourable.
-
Combine the favourable levels:
- Favourable: difficult entry, low storage cost, rising demand.
- This corresponds to Option D.
-
Check the other options to confirm:
- Option A (easy, high, constant): all unfavourable — most likely to run out of money.
- Option B (easy, low, rising): easy entry is unfavourable, but low storage and rising demand help. Still not as good as D because supply could be excessive.
- Option C (difficult, high, constant): difficult entry is good, but high storage costs and constant demand harm finances.
- Option D (difficult, low, rising): all three favourable — least likely to run out of money.
Key Takeaways
- Buffer stock schemes are costly; their success depends on supply responsiveness, storage costs, and market demand trends.
- Easy entry into production can ruin a buffer stock by creating endless surpluses.
- Low storage costs and rising demand improve the scheme's financial viability.
- When comparing combinations, identify the most favourable values for each factor and find the option that contains all of them.
Common Mistakes
- Thinking that 'easy entry' is good because the scheme can buy more? Actually, buying more depletes funds faster.
- Overlooking the role of storage costs: high storage costs can drain the budget even if other conditions are good.
- Assuming constant demand is safer than rising demand: constant demand offers no appreciation of stock value, whereas rising demand can generate profits.
- Confusing 'least likely to run out of money' with 'most likely to succeed in stabilising prices'; the question is specifically about financial sustainability.
Things to Be Careful About
- Read the question precisely: 'least likely to run out of money' — not 'most likely to stabilise prices'.
- Consider each factor independently before combining.
- Note that 'ability of new farmers to start growing' affects supply elasticity; relate it to the scheme's purchase obligations.
- 'Global demand' affects the scheme's selling price; distinguish between constant and rising.
- For buffer stock schemes, the budget is fixed, so anything that increases costs or reduces revenue increases the risk of running out of money.
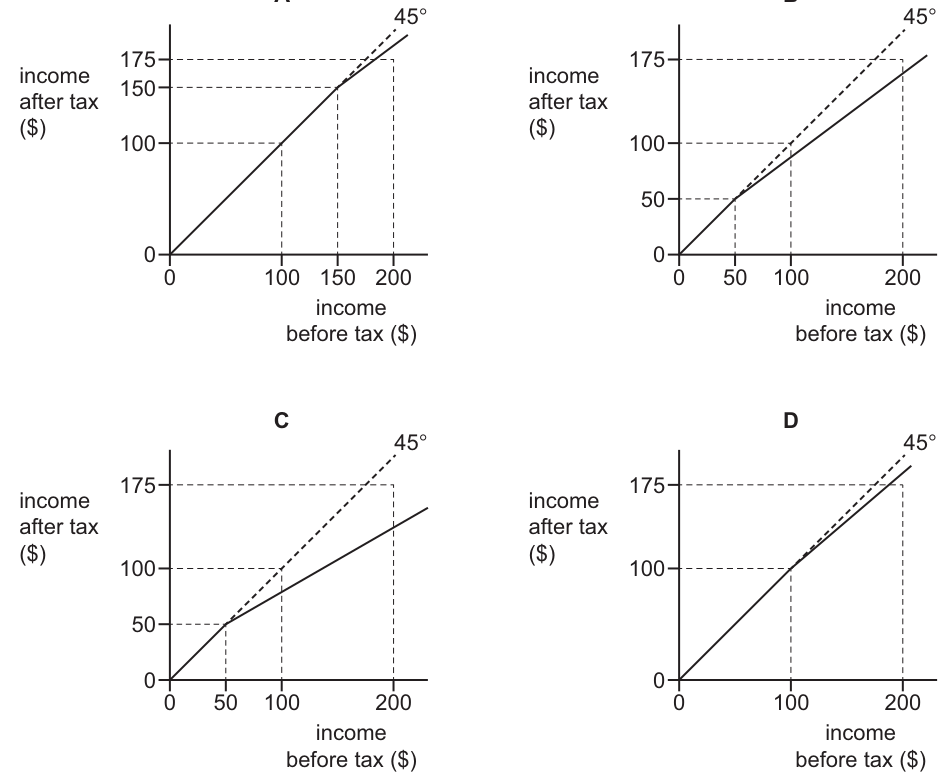
The graph shows an individual’s income before and after the deduction of income tax.
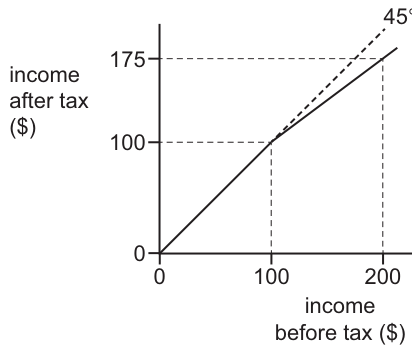
Which change to this income tax system is most progressive?
Options
Answer
A progressive tax system is one where the average rate of tax rises as income rises. On the graph, this is shown by the after-tax income line falling progressively further below the 45-degree line (which represents zero tax) at higher levels of before-tax income, meaning the gap between before-tax and after-tax income widens.
- Option A introduces a higher tax rate only above $150, but the total tax paid at $200 remains $25 (an average rate of 12.5%), the same as the current system.
- Option B introduces a constant tax rate after a $50 allowance. This is a proportional system, not a progressive one, and the average rate at $200 is also 12.5%.
- Option C introduces a higher tax rate after $100. At $200 before-tax income, after-tax income is $150, meaning $50 tax is paid. This is an average rate of 25%, which is higher than the current 12.5% and rises more steeply with income.
- Option D keeps the same constant rate after $100 as the current system, so it is not more progressive.
Because Option C results in the highest average tax rate at high income levels and the greatest increase in the tax burden as income rises, it is the most progressive change.
Answer
C
C
Background Concept
A progressive tax is a tax system in which the average rate of tax increases as the taxpayer's income rises. This means higher-income individuals pay not just more tax in total, but a larger proportion of their income in tax than lower-income individuals. Graphically, this is represented by an after-tax income line that starts at the origin (or after a tax-free allowance) and then bends away from the 45-degree line with a progressively flatter slope, indicating that each additional dollar of income is taxed at a higher marginal rate. By contrast, a proportional tax (flat tax) has a constant slope after any allowance, and a regressive tax would see the after-tax income line become steeper (or the average rate fall) as income rises.
Understanding the Question
The question presents Fig. 15.1, showing the current income tax system: individuals pay no tax on the first $100 of income (the line follows the 45-degree line), and on income between $100 and $200 they keep $75 out of every $100 earned, implying a 25% tax rate on that slice. At $200 before-tax income, after-tax income is $175, so total tax is $25, giving an average tax rate of 12.5%.
The question asks which of the four alternative systems (A, B, C, D) is the most progressive change from this current system. This requires comparing how much the average tax rate rises with income under each option, specifically at the highest income shown ($200).
Approach
The most direct way to answer is to calculate or estimate the average tax rate at $200 before-tax income for each option, or to observe how far the after-tax income line falls below the 45-degree line at that point. The option with the lowest after-tax income at $200 (i.e., the highest tax burden relative to the 45-degree line) is the most progressive, because it extracts the largest proportion of income from the highest earners.
Alternatively, examine the marginal tax rates (the slope of the after-tax line): a system that introduces higher marginal rates at lower income thresholds, or that applies a higher rate to a larger portion of income, is more progressive.
Step-by-Step Reasoning
Current system (Fig. 15.1):
- Tax-free allowance: $100.
- Tax on income above $100: 25% (since after-tax income rises from $100 to $175 when before-tax income rises from $100 to $200, a $25 tax on $100 income).
- Total tax at $200 income: $25.
- Average tax rate at $200: 25 / 200 = 12.5%.
Option A: Tax-free allowance up to $100, then a higher tax rate after $150.
- From the graph, after-tax income at $200 is $175.
- This implies total tax remains $25.
- The higher rate applies only to the top $50 of income ($150–$200), but the average rate across the full $200 is still 12.5%.
- This is not more progressive than the current system in terms of overall burden at $200.
Option B: Tax-free allowance up to $50, then a constant tax rate.
- After-tax income at $200 is $175.
- Total tax is $25 on $200 income = 12.5% average rate.
- Because the rate is constant above $50, this is a proportional tax system (after the allowance), not a progressive one. The average rate rises from 0% to 12.5%, but this is the same final average as the current system.
Option C: Tax-free allowance up to $50, then a steeper tax rate after $100.
- After-tax income at $200 is $150 (reading from the graph).
- Total tax is $50 on $200 income.
- Average tax rate at $200: 50 / 200 = 25%.
- This is double the current average rate. The marginal tax rate on income above $100 is 50% (since after-tax income rises by $50 when before-tax income rises by $100 from $100 to $200).
- Because the average rate rises much more steeply with income (from 0% to 25%), this is the most progressive option.
Option D: Tax-free allowance up to $100, then a constant tax rate.
- After-tax income at $200 is $175, identical to the current system.
- This represents no change in progressivity.
Conclusion: Option C imposes the highest tax burden on high-income earners ($50 tax vs $25 in the other options) and has the steepest rise in the average tax rate, making it the most progressive.
Key Takeaways
- A progressive tax is defined by a rising average tax rate as income increases.
- On an income before-tax / after-tax graph, progressivity is shown by the after-tax line bending further away from the 45-degree line at higher incomes (the vertical gap between the 45-degree line and the after-tax line widens).
- To compare progressivity, calculate the total tax paid (or average rate) at a high income level; the highest average rate indicates the most progressive system.
- A constant tax rate after an allowance is proportional, not progressive.
Common Mistakes
- Confusing marginal with average rates: A system may have a high marginal rate on a small top slice (Option A) but still have a low average rate. Progressivity depends on the average burden across the whole income.
- Assuming any allowance creates progressivity: Options B and D have allowances but are proportional (constant rate) after the allowance, so they are not progressive in the sense of rising average rates.
- Reading the graph backwards: Some students look at the slope of the after-tax line and think a steeper line means higher tax. Actually, a flatter line (further from the 45-degree line) means higher tax.
- Ignoring the base: Option A's "higher rate" sounds progressive, but because it applies only to a small top slice, the overall system is barely more progressive than the original.
Things to Be Careful About
- Always check the average tax rate at the highest income level shown to judge progressivity.
- Ensure you distinguish between a tax-free allowance (which makes the system start at zero) and a progressive structure (which requires the rate to rise).
- When reading the graph, trace the after-tax income line carefully to the $200 mark on the horizontal axis and read the corresponding vertical value to determine the tax paid.
- Remember that "most progressive" means the greatest increase in the proportion of income taken as tax, not necessarily the highest total tax revenue.
Which source of income is not included in measuring real GDP?
Options
A pension paid to retired people
B profits made by firms
C rent paid to landlords
D wages paid to nurses
Answer
GDP measures the value of goods and services produced in an economy using the income method, which sums factor incomes: wages, rent, interest, and profit. Transfer payments, such as pensions, are not payments for current production and are therefore excluded from GDP. Among the options:
- A: Pension paid to retired people – a transfer payment, not included.
- B: Profits made by firms – factor income, included.
- C: Rent paid to landlords – factor income, included.
- D: Wages paid to nurses – factor income, included.
The correct answer is A.
A
Background Concept
Real GDP is the total value of all final goods and services produced within a country's borders over a period, adjusted for inflation. It can be measured via the output, expenditure, or income approach. The income approach sums factor incomes: wages and salaries, rent, interest, and profit. These are payments to factors of production (labour, land, capital, enterprise) for their contribution to current production.
Transfer payments – such as pensions, unemployment benefits, and social security – are payments made by the government to individuals without any corresponding production of goods or services. They are redistributions of income, not payments for current output. Hence, they are excluded from GDP to avoid double-counting and to ensure GDP reflects only production.
Understanding the Question
The question asks which source of income is NOT included in measuring real GDP. It lists four possible sources: a pension, profits, rent, and wages. The key is to identify which one is a transfer payment rather than a factor payment for current production. The correct answer is the pension, as it is not a payment for a factor of production.
Approach
- Recall the components of the income approach to GDP: wages, rent, interest, profit.
- Recognize that transfer payments are not part of GDP.
- Evaluate each option against this criterion.
- Select the option that is a transfer payment.
Step-by-Step Reasoning
- Option A: Pension paid to retired people – A pension is a transfer payment from the government (or a pension fund) to individuals who are not currently providing labour services in exchange. It is not a payment for current production. Thus, it is not included in GDP.
- Option B: Profits made by firms – Profit is the return to enterprise (a factor of production). It is included in GDP as part of the income approach.
- Option C: Rent paid to landlords – Rent is the return to land (a factor of production). It is included in GDP.
- Option D: Wages paid to nurses – Wages are the return to labour (a factor of production). Nurses provide a service (healthcare) which is part of current production. Wages are included in GDP.
Therefore, the only option that is not a factor payment for current production is the pension.
Key Takeaways
- GDP measures production, not all income flows.
- Transfer payments are excluded from GDP because they do not correspond to current production of goods or services.
- The income approach to GDP includes wages, rent, interest, and profit.
Common Mistakes
- Confusing transfer payments with factor payments. For example, thinking that a pension is a form of wage or that it is included because it is a regular payment.
- Not recognizing that government spending on pensions is a transfer payment, while government spending on wages (e.g., nurses) is a factor payment.
Things to Be Careful About
- The income method of GDP includes only payments for the use of factors of production in the current period.
- Transfer payments are not part of GDP, but they are part of personal income and can affect consumption and thus GDP indirectly.
- In the expenditure approach, government spending on goods and services (including wages) is included, but transfer payments are not counted as government consumption.
The table shows some labour market statistics.
| million | |
|---|---|
| number of people of working age | 45 |
| number of people unemployed | 2 |
| number of people in the labour force | 40 |
| number of people in the population | 80 |
What is the unemployment rate?
Options
A 2.5%
B 5%
C 6.25%
D 12.5%
Working
Unemployment rate = (Number of unemployed / Labour force) x 100
= (2 million / 40 million) x 100
= 0.05 x 100 = 5%
Answer
B
B
Background Concept
The unemployment rate is a key macroeconomic indicator that measures the proportion of the labour force that is without work but actively seeking employment. The labour force includes all employed and unemployed individuals of working age who are either working or actively looking for work. It excludes those not seeking work, such as students, retirees, and discouraged workers.
Understanding the Question
This question provides a table with labour market statistics for a country. The relevant figures are:
- Number of people unemployed: 2 million
- Number of people in the labour force: 40 million
The question asks for the unemployment rate. The other figures (working-age population 45 million, total population 80 million) are distractors. The correct denominator is the labour force, not the working-age population or total population.
Approach
Apply the standard formula for the unemployment rate:
Unemployment rate = (Number of unemployed / Labour force) x 100
Substitute the given values and compute the percentage.
Step-by-Step Reasoning
- Identify the correct numerator: number of unemployed = 2 million.
- Identify the correct denominator: labour force = 40 million.
- Divide: 2 / 40 = 0.05.
- Multiply by 100 to express as a percentage: 0.05 x 100 = 5%.
- Match the result to the options: 5% corresponds to option B.
Note: If the working-age population (45 million) were used as the denominator, the rate would be 2/45 ≈ 4.44%, which is not among the options. If the total population (80 million) were used, the rate would be 2/80 = 2.5% (option A), which is incorrect because the unemployment rate is defined relative to the labour force, not the total population.
Key Takeaways
- The unemployment rate is always calculated as a percentage of the labour force, not the total population or working-age population.
- The labour force consists of employed plus unemployed individuals who are actively seeking work.
- Careful reading of the table is essential to select the correct figures.
Common Mistakes
- Using the working-age population (45 million) as the denominator, leading to an incorrect rate not listed.
- Using the total population (80 million) as the denominator, which gives 2.5% (option A) – a common error because it seems intuitive to use the whole population.
- Confusing the labour force with the working-age population; the labour force excludes those not participating (e.g., students, retirees).
Things to Be Careful About
- Always identify the labour force figure explicitly; it may be labelled as 'labour force' or 'economically active population'.
- Ensure the numerator is the number of unemployed, not the number of employed or any other category.
- Double-check the units (millions) and perform the division correctly.
- In multiple-choice questions, verify that your calculated answer matches one of the options exactly.
The diagram shows aggregate demand (AD) and aggregate supply (AS) where the initial equilibrium is at point X.
The central bank forecasts a rise in raw material costs. The government plans to increase spending on health.
What would be the new equilibrium in the short run if the forecasts prove to be accurate and the government plans are implemented?
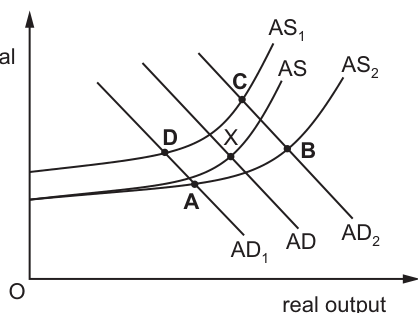
Options
A point A on Fig. 18.1
B point B on Fig. 18.1
C point C on Fig. 18.1
D point D on Fig. 18.1
Reasoning
A rise in raw material costs increases firms' production costs, so short-run aggregate supply (SRAS) shifts to the left, from AS to AS1. Increased government spending on health is expansionary fiscal policy, which raises aggregate demand, so AD shifts to the right, from AD to AD2. The new short-run equilibrium occurs at the intersection of the new AD curve (AD2) and the new AS curve (AS1), which is point C.
Answer
C
C
Background Concept
The aggregate demand and aggregate supply (AD/AS) model is used to analyse the determination of an economy's real output (real GDP) and the general price level in the short run and long run. Aggregate demand (AD) represents the total demand for goods and services in an economy at different price levels, and is composed of consumption (C), investment (I), government spending (G) and net exports (X - M), so AD = C + I + G + (X - M). The AD curve is downward-sloping: a higher price level reduces the real value of money holdings, raises interest rates, and makes domestic goods less competitive, all of which reduce total demand. Short-run aggregate supply (SRAS) represents the total supply of goods and services that firms are willing to produce at different price levels in the short run, when some input costs (such as wages) are fixed. The SRAS curve is upward-sloping: a higher price level raises firms' profitability, so they increase output. Shifts in the AD curve are caused by changes in any of its components (C, I, G, X-M). Shifts in the SRAS curve are caused by changes in production costs, such as changes in the price of raw materials, wages, or productivity. Fiscal policy refers to government decisions about taxation and spending to influence macroeconomic objectives. Expansionary fiscal policy involves increasing government spending or cutting taxes to raise AD, while contractionary fiscal policy involves cutting spending or raising taxes to lower AD.
Understanding the Question
This question presents an AD/AS diagram with an initial short-run equilibrium at point X, where the original AD and AS curves intersect. Two events are forecast or planned: (1) a rise in raw material costs, which is a negative supply-side shock, and (2) an increase in government spending on health, which is expansionary fiscal policy. The question asks for the new short-run equilibrium if both of these events occur. This is a 1-mark multiple-choice question that tests the ability to identify the direction of shifts in AD and SRAS from separate shocks, and to locate the new equilibrium at the intersection of the shifted curves.
Approach
To solve this, we will analyse the effect of each event separately first, then combine their effects:
- First, determine how a rise in raw material costs affects the SRAS curve: higher input costs increase firms' production costs, so at every price level, firms are willing to supply less output. This shifts SRAS to the left.
- Second, determine how increased government health spending affects the AD curve: higher government spending is a component of AD, so this increases total demand at every price level, shifting AD to the right.
- Finally, locate the intersection of the new (right-shifted) AD curve and the new (left-shifted) SRAS curve on the diagram, which is the new short-run equilibrium.
Step-by-Step Reasoning
- Effect of the rise in raw material costs: Raw materials are a key input for most firms. When raw material costs rise, the cost of producing each unit of output increases. In the short run, firms will only be willing to supply the same level of output if the price level rises to cover the higher costs. This means the entire SRAS curve shifts to the left (inwards), from the original AS curve to AS1, as shown in the diagram. A leftward shift of SRAS raises the equilibrium price level and reduces equilibrium real output, all else equal.
- Effect of increased government health spending: Government spending on health is a direct component of aggregate demand (the G in AD = C + I + G + (X - M)). When the government increases spending on health, it is injecting more money into the economy, raising total demand for goods and services at every price level. This shifts the AD curve to the right (outwards), from the original AD curve to AD2, as shown in the diagram. A rightward shift of AD raises both the equilibrium price level and equilibrium real output, all else equal.
- Combining the two shifts: When both events occur, we have a simultaneous leftward shift of SRAS (to AS1) and a rightward shift of AD (to AD2). The new short-run equilibrium is the point where these two new curves intersect. Looking at the diagram:
- Point A is the intersection of AD1 (left-shifted AD) and the original AS: this would be the outcome of contractionary fiscal policy with no supply shock, so incorrect.
- Point B is the intersection of AD2 (right-shifted AD) and the original AS: this would be the outcome of expansionary fiscal policy with no supply shock, so incorrect.
- Point C is the intersection of AD2 (right-shifted AD) and AS1 (left-shifted AS): this matches the combined effect of both events, so this is the correct new equilibrium.
- Point D is the intersection of the original AD and AS1 (left-shifted AS): this would be the outcome of the supply shock with no fiscal expansion, so incorrect.
- The new equilibrium at point C will have a higher price level than the original equilibrium at X. The change in real output depends on the relative size of the AD and AS shifts: in this diagram, output at C is slightly higher than at X, but the key identifier is that it is the intersection of the two shifted curves.
Key Takeaways
- To analyse simultaneous shocks in the AD/AS model, first determine the direction of each curve shift separately, then find their intersection.
- A rise in input costs (such as raw materials) is a negative supply shock that shifts SRAS left, raising the price level and reducing output.
- Expansionary fiscal policy (increased government spending) shifts AD right, raising both the price level and output.
- Always check that the equilibrium point you select is the intersection of the shifted curves, not the original ones.
Common Mistakes
- Mixing up the direction of shifts: some students incorrectly think higher raw material costs shift AS right (because firms produce more to cover higher costs), or that higher government spending shifts AD left (because of crowding out, which is a longer-run effect not relevant to the short-run AD shift here). These errors lead to selecting the wrong equilibrium point.
- Selecting the intersection of only one shifted curve with the original other curve (e.g. point B or D) instead of the intersection of both shifted curves.
- Confusing short-run and long-run effects: the question specifies the short run, so we do not need to consider shifts in the long-run aggregate supply (LRAS) curve, which would only occur if the shocks affect the economy's productive capacity over time.
- Forgetting that the question specifies both events occur, so only the intersection of both shifted curves is correct.
Things to Be Careful About
- Always label the direction of each shift clearly: left for a decrease in supply, right for an increase in demand.
- Check the diagram's curve labels carefully: AS1 is the left-shifted SRAS, AS2 is the right-shifted SRAS; AD1 is the left-shifted AD, AD2 is the right-shifted AD.
- Remember that the question asks for the short-run equilibrium, so we only consider the SRAS curve, not the LRAS.
- Ensure that the selected point is the intersection of the two curves that have shifted in response to the events described, not any other intersection on the diagram.
An economy is experiencing a period of deflation.
What must be happening?
Options
A The average price level is falling.
B The output of the economy is falling.
C The rate of inflation is falling.
D The real value of money is falling.
Deflation is defined as a sustained fall in the general (average) price level. Option A correctly states this.
- Option B (output falling) is a recession, not necessarily deflation. Output can fall without deflation (e.g., stagflation).
- Option C (rate of inflation falling) describes disinflation, not deflation. Deflation means the price level is falling, not just the inflation rate.
- Option D (real value of money falling) is the opposite of what happens during deflation: when prices fall, the purchasing power of money rises, so its real value increases.
Answer
A
A
Background Concept
Deflation is a macroeconomic term describing a sustained decrease in the general price level of goods and services. It is the opposite of inflation. The inflation rate measures the percentage change in the price level from one period to the next. Deflation occurs when the inflation rate becomes negative (i.e., the price level falls). It is important to distinguish deflation from disinflation, which is a slowing down of the inflation rate (prices still rising but more slowly).
Understanding the Question
The question asks: "An economy is experiencing a period of deflation. What must be happening?" It gives four options. The phrase "must be happening" implies that the correct answer is a necessary condition for deflation. We need to select the statement that is always true when deflation occurs.
Approach
Start from the definition of deflation: a sustained fall in the average price level. Then examine each option to see if it is a logical consequence of deflation. Eliminate any that are not strictly necessary or that describe something different.
Step-by-Step Reasoning
-
Option A: "The average price level is falling." This is the definition of deflation. If deflation is occurring, the price level must be falling. So A is correct.
-
Option B: "The output of the economy is falling." During deflation, output may fall (as in a recessionary deflation) but it is not necessary. For example, an economy could experience deflation due to increased productivity and technological progress, leading to lower costs and prices while output rises. The Great Depression saw both deflation and falling output, but the two are not inseparable. Hence, B is not a "must happen" condition.
-
Option C: "The rate of inflation is falling." If the inflation rate is falling but still positive, that is disinflation, not deflation. Deflation requires the inflation rate to become negative. Option C could be true in the transition from inflation to deflation, but it is not the same as deflation itself. Moreover, deflation could persist with the inflation rate remaining negative but steady; the rate itself might not be falling further. So C does not "must" happen.
-
Option D: "The real value of money is falling." The real value of money is its purchasing power. When the general price level falls, each unit of currency buys more goods and services, so the real value of money rises. This is the opposite of what is stated. During inflation, the real value of money falls. During deflation, it increases. Therefore D is false.
Thus only A is a certain characteristic of deflation.
Key Takeaways
- Deflation is a fall in the average price level (negative inflation).
- Disinflation is a slowdown in the rate of inflation (prices still rising but slower).
- Real value of money moves inversely to the price level: deflation increases purchasing power; inflation decreases it.
- Do not confuse deflation with a fall in output or a fall in the inflation rate.
Common Mistakes
- Confusing deflation with disinflation (option C). Many students think that a falling inflation rate means prices are falling, but it only means prices are rising less quickly. Deflation requires the price level to actually decline.
- Assuming deflation always accompanies a recession (option B). While deflation can be harmful and often coincides with economic downturns, it is not a necessary condition.
- Misunderstanding the real value of money (option D). Some students might mistakenly think that when prices fall, money loses value because goods become cheaper, but that is exactly when money gains value.
Things to Be Careful About
- Read the question carefully: it asks for what "must" be happening. A condition that sometimes happens but is not guaranteed is incorrect.
- Keep the definitions precise: deflation is a fall in the price level, not a fall in the rate of inflation.
- Real value of money is 1 / price level; if the price level falls, real value rises.
What is the most likely consequence of economic growth?
Options
A a fall in the price of raw materials
B a rise in youth unemployment
C a worsening current account balance
D reduced demand-pull inflationary pressures
Answer
Economic growth raises real incomes, which increases the demand for imports (both consumer and capital goods). Given UK growth rates, unless exports rise correspondingly, the current account balance tends to worsen. Options A, B and D are less likely: raw material prices usually rise with higher demand, youth unemployment typically falls as labour demand grows, and demand-pull inflationary pressures intensify, not diminish, during periods of fast growth.
Final Answer
C
C
Background Concept
Economic growth is an increase in the productive capacity of the economy, measured by the rate of increase in real GDP. As an economy grows, household incomes rise, and firms invest more. This generally raises aggregate demand (AD) and, depending on the state of the economy, may also increase aggregate supply (AS) in the long run.
A common consequence of faster growth is an increase in imports. The UK has a high marginal propensity to import (MPM) – as income rises, consumers spend some of that extra income on foreign goods, and businesses import more raw materials and capital equipment. Unless exports grow at the same pace, the current account on the balance of payments moves towards deficit.
Understanding the Question
This is a one-mark multiple-choice question asking for the most likely consequence of economic growth. It tests whether you can identify which of the four outcomes actually tends to occur as a result of growth, rather than being a cause or an unrelated effect. The command word is implicit – you must select the one option that is most consistent with standard macroeconomic theory and evidence.
Approach
Consider each option in turn against what we know about the effects of growth:
- Option A: a fall in the price of raw materials. Economic growth increases demand for raw materials (to produce goods and services), which tends to push their prices up, not down. This is unlikely.
- Option B: a rise in youth unemployment. Growth typically creates more jobs, reducing unemployment for all age groups, including the youth. This is unlikely.
- Option C: a worsening current account balance. As argued, growth raises imports. If the growth is domestically generated and not accompanied by a proportionate rise in exports, the trade balance (and therefore the current account) will deteriorate. This is a well-documented empirical regularity in many countries.
- Option D: reduced demand-pull inflationary pressures. Growth is often associated with rising demand, which can cause demand-pull inflation. The opposite – reduced inflationary pressure – would suggest the economy is operating below capacity, which is not the typical consequence of growth. This is unlikely.
Only option C stands up to scrutiny as the most likely consequence.
Step-by-Step Reasoning
- Economic growth raises real incomes (GDP per capita).
- Higher incomes increase consumption spending, some of which falls on imported goods and services.
- Businesses also import more capital goods and raw materials to expand production.
- Unless exports rise by a similar amount (which would require foreign income growth or improved competitiveness), the trade in goods and services balance moves into deficit.
- This worsens the current account balance (which includes trade in goods and services plus net income flows).
- The other options can be eliminated:
- Raw material prices rise with demand (not fall).
- Youth unemployment falls as job vacancies increase.
- Demand-pull inflation rises, not falls, because AD increases relative to AS.
Key Takeaways
- Growth has predictable consequences on key macroeconomic variables: imports rise, the current account tends to worsen (unless the growth is export-led).
- Always distinguish between a cause and a consequence when evaluating such options.
- This question tests the ability to link a single macroeconomic change (growth) to its likely impact on different sectors of the economy.
Common Mistakes
- Choosing A because a student may think more supply of goods reduces raw material prices, but raw materials are inputs, and growth raises demand for them, pushing prices up.
- Choosing D because of confusion: growth can be associated with lower inflation if it is driven by supply-side improvements, but the question asks for the most likely consequence; demand-pull pressure is more typical, especially in the short run.
- Not considering the marginal propensity to import: failing to apply the link between income and imports.
Things to Be Careful About
- The question says “most likely consequence” – not “always true.” Even if under specific circumstances one of the other options could occur, C is the typical, well-established outcome.
- Remember that growth can also improve the current account if it enhances export competitiveness (e.g., through productivity gains), but the question asks for the most likely consequence, which is a deterioration due to rising imports.
- Avoid overcomplicating: a one-mark MCQ expects clear, direct economic reasoning.
A government wants to operate a tighter monetary policy.
What would it increase?
Options
A budget surplus
B interest rate
C money supply
D rates of taxation
Reasoning
Tighter monetary policy is contractionary, aimed at reducing aggregate demand and controlling inflation. The central bank can increase interest rates to discourage borrowing and spending. Option A (budget surplus) and D (rates of taxation) are fiscal policy tools, not monetary. Option C (money supply) would be reduced, not increased, in a tightening. Therefore, the correct answer is to increase the interest rate.
Answer
B
B
Background Concept
Monetary policy refers to actions taken by a central bank to manage the money supply and interest rates in order to achieve macroeconomic objectives such as price stability, low unemployment, and economic growth. The main tools of monetary policy include changing the policy interest rate, altering the money supply through open market operations, and adjusting credit regulations. A 'tighter' or contractionary monetary policy is used to reduce aggregate demand, typically to combat inflation. It involves increasing interest rates, reducing the money supply, or tightening credit availability.
Fiscal policy, in contrast, is the use of government spending and taxation to influence the economy. It is controlled by the government, not the central bank. This question tests the ability to distinguish between these two policy areas and to identify the correct tool for a tightening monetary stance.
Understanding the Question
The question asks: 'A government wants to operate a tighter monetary policy. What would it increase?' It provides four options: A budget surplus, B interest rate, C money supply, D rates of taxation. The key is to recognise that 'tighter monetary policy' means contractionary, and that the central bank (often independent, but the question says 'government' loosely) would increase interest rates. The other options are either fiscal policy tools (A and D) or the opposite of what a tightening would do (C).
The question is a single-step recall item, worth 1 mark. It requires knowledge of the basic tools of monetary policy and the difference between monetary and fiscal policy.
Approach
Eliminate options that are clearly fiscal: A (budget surplus) is a fiscal outcome, not a policy tool; D (rates of taxation) is fiscal. Then consider the remaining two: B and C. Tighter monetary policy means reducing the money supply or increasing interest rates. Option C (increase money supply) is expansionary, not contractionary. Therefore, only B remains. The approach is logical elimination combined with knowledge of what each tool does.
Step-by-Step Reasoning
-
Identify the meaning of 'tighter monetary policy': it is contractionary monetary policy, intended to slow down the economy and reduce inflation. The central bank can either increase interest rates or reduce the money supply.
-
Examine each option:
- Option A: budget surplus. A budget surplus occurs when government revenue exceeds spending. This is a fiscal concept, not a monetary policy tool. While a surplus can be contractionary, it is not a tool of monetary policy. So A is incorrect.
- Option B: interest rate. Increasing the policy interest rate (e.g., the bank rate or federal funds rate) makes borrowing more expensive, reducing consumption and investment, thus decreasing aggregate demand. This is a standard tool of contractionary monetary policy. So B is correct.
- Option C: money supply. Increasing the money supply is expansionary monetary policy, the opposite of tightening. Therefore C is incorrect.
- Option D: rates of taxation. Changing tax rates is a fiscal policy tool, not monetary. Increasing taxes reduces disposable income and aggregate demand, but this is not part of monetary policy. So D is incorrect.
-
Therefore, the only option that is both a monetary policy tool and consistent with tightening is B: increase the interest rate.
Key Takeaways
- Tighter (contractionary) monetary policy involves increasing interest rates, reducing the money supply, or tightening credit.
- Monetary policy is distinct from fiscal policy, which uses government spending and taxation.
- When answering multiple-choice questions, first identify the policy area (monetary vs. fiscal) and then determine whether the action is expansionary or contractionary.
Common Mistakes
- Confusing fiscal policy with monetary policy: choosing budget surplus or taxation because they also reduce aggregate demand. The question specifically asks for 'monetary policy', so fiscal tools are irrelevant.
- Thinking that increasing the money supply is part of tightening: this is expansionary, so it is the opposite.
- Not reading the word 'tighter' carefully: some students might pick 'increase money supply' if they think monetary policy is always about increasing something.
Things to Be Careful About
- The term 'government' in the question is a bit loose; in many economies the central bank is independent, but the question uses 'government' to mean the monetary authority. This is not a trick.
- Remember that monetary policy tools are controlled by the central bank, not the Treasury. Options A and D are under the control of the government (fiscal authority).
- Always consider the direction of the policy: 'tighter' means contractionary, so the action should reduce aggregate demand, not increase it.
Which action is classified as a fiscal policy measure?
Options
A fixing a currency to another country’s currency
B tightening credit regulations on banks
C providing guidance to industry and the public
D managing changes in the level of government debt
Reasoning
Fiscal policy involves government spending and taxation decisions that affect the budget and the national debt. Managing changes in the level of government debt directly relates to fiscal policy because the national debt reflects the accumulation of budget deficits. Option A (fixing a currency) is an exchange rate policy, option B (tightening credit regulations) is monetary policy, and option C (providing guidance) is a supply-side or information policy. Therefore, only option D is a fiscal policy measure.
Answer
D
D
Background Concept
Fiscal policy refers to the use of government spending and taxation to influence the economy. It is primarily concerned with the government’s budget position—whether it runs a deficit (spending exceeds tax revenue) or a surplus (tax revenue exceeds spending). The national debt is the cumulative total of past deficits, minus any surpluses. Managing the level of government debt, therefore, is an outcome of fiscal policy decisions. In contrast, monetary policy is conducted by the central bank and involves controlling the money supply and interest rates. Supply-side policy aims to improve the productive capacity of the economy through measures such as training, infrastructure, and deregulation.
Understanding the Question
The question asks you to identify which of four actions is classified as a fiscal policy measure. This is a straightforward classification task that tests your understanding of the boundaries between fiscal, monetary, and supply-side policies. You need to recall the definition of fiscal policy and apply it to each option.
Approach
Start by recalling the definition of fiscal policy: government decisions on taxation and spending that affect the budget and national debt. Then examine each option:
- A: Fixing a currency to another country’s currency is an exchange rate policy (a form of monetary policy).
- B: Tightening credit regulations on banks is a tool of monetary policy (credit controls).
- C: Providing guidance to industry and the public is a supply-side policy or information provision, not fiscal.
- D: Managing changes in the level of government debt directly relates to fiscal policy because debt changes arise from budget deficits or surpluses.
Thus, D is the correct answer.
Step-by-Step Reasoning
-
Option A: fixing a currency to another country’s currency. This is an exchange rate policy. Under a fixed exchange rate system, the central bank intervenes in foreign exchange markets to maintain the peg. This is part of monetary policy, not fiscal policy. Fiscal policy does not directly involve setting exchange rates.
-
Option B: tightening credit regulations on banks. This involves the central bank imposing restrictions on lending, such as higher reserve requirements or stricter loan-to-value ratios. This is a monetary policy tool aimed at controlling the money supply and credit creation. It is not a fiscal policy measure.
-
Option C: providing guidance to industry and the public. This could include issuing advice on best practices, providing information to consumers, or encouraging investment in certain sectors. Such guidance is often classified as supply-side policy (improving information and efficiency) or regulatory policy, but it does not involve changes in government spending or taxation. Therefore, it is not fiscal policy.
-
Option D: managing changes in the level of government debt. The government’s debt level changes when it runs a budget deficit (borrowing) or a surplus (repaying debt). These decisions are made through fiscal policy—the government chooses its spending and tax levels, which determine the budget balance. Hence, managing the debt level is a fiscal policy measure.
Therefore, the correct answer is D.
Key Takeaways
- Fiscal policy is about government spending and taxation, which affect the budget and national debt.
- Monetary policy involves central bank actions on money supply, interest rates, and credit.
- Supply-side policy aims to increase the economy’s productive capacity.
- Be able to classify policies correctly by their primary tools and objectives.
Common Mistakes
- Confusing fiscal policy with monetary policy: e.g., thinking that credit regulations (B) or exchange rate fixing (A) are fiscal. They are not.
- Thinking that providing guidance (C) is fiscal because it is a government action. However, fiscal policy specifically involves changes in spending or taxation, not just advice.
- Not recognising that managing government debt is a direct consequence of fiscal policy, so it is indeed a fiscal policy measure.
Things to Be Careful About
- Remember that fiscal policy is conducted by the government (treasury), while monetary policy is conducted by the central bank.
- The national debt is a stock variable; changes in it are due to flows (deficits/surpluses) that result from fiscal policy decisions.
- In multiple-choice questions, check each option against the definition of fiscal policy rather than assuming a general government action is fiscal.
The table shows government spending and revenue over a three-year period.
| year | government spending ($bn) | government revenue ($bn) |
|---|---|---|
| 1 | 90 | 100 |
| 2 | 110 | 110 |
| 3 | 130 | 115 |
What can be concluded from the data?
Options
A A budget surplus becomes a budget deficit in year 3.
B National debt is likely to be falling by the end of year 3.
C The current account balance is in equilibrium in year 2.
D The economy is at full employment equilibrium in year 2.
Working
Year 1: Spending 90, Revenue 100 -> Budget surplus of 10. Year 2: Both 110 -> Balanced budget. Year 3: Spending 130, Revenue 115 -> Budget deficit of 15. Therefore, a surplus in year 1 is followed by a deficit in year 3, so option A is correct.
Answer
A
A
Background Concept
Government budget balance: surplus when revenue exceeds spending, deficit when spending exceeds revenue, balanced when equal. National debt is the accumulated stock of past deficits minus surpluses.
Understanding the Question
The table gives government spending and revenue for three years. The question asks what can be concluded from the data. We need to evaluate each option.
Approach
Calculate the budget balance for each year. Then examine each option: A relates to budget surplus and deficit, B relates to national debt, C is about current account (irrelevant), D about full employment (not shown). Only A is directly supported.
Step-by-Step Reasoning
Calculate: Year 1: 100 - 90 = 10 surplus; Year 2: 110 - 110 = 0 balanced; Year 3: 115 - 130 = -15 deficit. So the budget goes from surplus to deficit. Option A is correct. Option B: National debt is the accumulated stock. Although surplus in year 1 reduces debt, deficit in year 3 increases it. Without knowing the starting debt, we cannot conclude it is falling. Option C: The current account balance is separate from the government budget, so no conclusion. Option D: Full employment equilibrium requires information about the macroeconomy, not just the budget. So only A is valid.
Key Takeaways
Understand the difference between budget balance (flow) and national debt (stock). Be able to compute surplus/deficit from data. Avoid confusing government budget with other economic concepts.
Common Mistakes
Thinking that a budget surplus necessarily means national debt is falling (it does, but only if the surplus is applied to reduce debt, and subsequent deficits may offset). Also, confusing budget balance with current account balance.
Things to Be Careful About
Read the data carefully: spending and revenue are given. Ensure you compute revenue minus spending. Distinguish between flow and stock. Do not infer beyond the data.
Which statement about supply-side policies is correct?
Options
A They solve the problem of demand deficient unemployment.
B They do not involve an opportunity cost.
C They reduce unemployment but do not affect the price level.
D They may reduce regional unemployment.
Reasoning
Supply-side policies aim to increase the productive capacity of the economy by shifting the LRAS curve to the right. They reduce all types of unemployment by improving the flexibility and efficiency of labour markets, which can lower the natural rate of unemployment. This includes structural and regional unemployment (e.g. through training and infrastructure). However, they do not directly target demand-deficient (cyclical) unemployment, which requires demand-side measures. They involve opportunity cost because government spending on, for example, training has alternative uses. While they can lower the price level in the long run by increasing potential output, they also affect prices, so statement C is incorrect.
Answer
D
D
Background Concept
Supply-side policies are measures designed to increase the productive capacity of the economy, shifting the long-run aggregate supply (LRAS) curve to the right. They focus on improving the efficiency and quantity of factors of production, such as labour and capital. The key objectives are to increase productivity, encourage competition, and reduce the natural rate of unemployment. They are distinct from demand-side policies (fiscal and monetary) which target aggregate demand.
Understanding the Question
This multiple-choice question asks which statement about supply-side policies is correct. Four statements are given, and only one is accurate. The question tests knowledge of the scope and limitations of supply-side policy, particularly regarding unemployment types and opportunity cost.
Approach
Evaluate each option one by one, using economic theory:
- Option A: Demand-deficient (cyclical) unemployment is caused by insufficient AD, so supply-side policies are not the direct solution.
- Option B: All economic choices involve opportunity cost; supply-side spending has alternative uses.
- Option C: Supply-side policies can reduce unemployment and also affect the price level (by lowering it as LRAS shifts right).
- Option D: Supply-side policies can target regional unemployment through training and infrastructure investment in specific areas.
Step-by-Step Reasoning
Option A: Demand-deficient unemployment arises when AD is too low to employ all workers at current wages. The cure is to increase AD (fiscal or monetary expansion). Supply-side policies do not directly raise AD; they expand potential output. Thus A is false.
Option B: The opportunity cost of using resources for supply-side policies (e.g. building a training centre) is the next best alternative forgone (e.g. healthcare or tax cuts). The opportunity cost is real, so B is false.
Option C: Supply-side policies can reduce unemployment (structural, frictional, regional) by improving labour market flexibility. They also affect the price level: by increasing LRAS, they can lower the price level for a given AD, or reduce inflationary pressure. Thus C is false because they do affect the price level.
Option D: Some supply-side policies are region-specific, such as enterprise zones, infrastructure projects in depressed areas, and government-funded training programmes. These can reduce regional unemployment by improving the attractiveness of the area for investment and by equipping workers with skills needed locally. This statement is correct.
Key Takeaways
- Supply-side policies increase the economy's productive capacity and affect LRAS.
- They are not suitable for curing demand-deficient unemployment.
- They involve opportunity cost and affect both unemployment and the price level.
- They can be targeted to reduce regional unemployment.
Common Mistakes
- Confusing supply-side and demand-side policies. Some students think supply-side policies can cure any type of unemployment, but cyclical unemployment is a demand-side issue.
- Assuming that supply-side policies have no opportunity cost because they are 'structural' or 'long-term'.
- Thinking that supply-side policies only affect unemployment and not prices; in AD/AS analysis, a rightward LRAS shift lowers the price level ceteris paribus.
- Selecting option A because supply-side policies increase potential output, but that does not directly address a shortfall in AD.
Things to Be Careful About
- Read each option carefully and apply precise definitions.
- Remember that opportunity cost exists for all government spending, regardless of the policy type.
- Distinguish between the natural rate of unemployment (affected by supply-side) and cyclical unemployment (affected by demand-side).
A government has a target to reduce the rate of inflation.
Why might it not want to raise interest rates to achieve this target?
Options
A aggregate demand may fall
B aggregate supply may fall
C saving may fall
D the exchange rate may fall
Answer
Raising the rate of interest reduces aggregate demand by decreasing consumption and investment, which would help to reduce demand-pull inflation. However, higher interest rates can also reduce aggregate supply by increasing firms' borrowing costs and reducing long-term investment, lowering productive capacity. This reduction in aggregate supply could increase cost-push inflation, working against the government's target. Therefore, the government may not want to raise interest rates because of the potential fall in aggregate supply, making option B the correct answer.
B
Background Concept
Monetary policy involves the use of interest rates, money supply, and credit regulations to achieve macroeconomic objectives such as price stability. Raising interest rates is a contractionary policy typically used to reduce demand-pull inflation by lowering consumption and investment, which shifts the AD curve left. However, inflation can also be cost-push, originating from a leftward shift of the SRAS curve due to rising costs of production. An increase in interest rates can affect aggregate supply by raising firms' borrowing costs, thereby increasing production expenses, and by discouraging capital investment, which reduces the economy's productive capacity in the long run.
Understanding the Question
The question asks: Given that the government wants to reduce inflation, why might it choose NOT to raise interest rates? This requires recognising that while raising interest rates reduces aggregate demand (which would lower demand-pull inflation), it also has a potential harmful effect on aggregate supply. If aggregate supply falls, the price level could rise, counteracting the disinflationary goal. The candidate must identify which of the four options correctly captures this undesired effect.
Approach
First, establish the main effect of higher interest rates on AD (a fall) and note that this is beneficial for reducing demand-pull inflation. Then consider the possible effect on AS (a fall) and recognise that this would be undesirable. Examine each option: A is a beneficial effect, so it would be a reason 'for' using the policy, not 'against'. C and D describe changes that are empirically incorrect – saving rises and the exchange rate appreciates when interest rates increase. Option B is thus the only valid reason for not raising rates.
Step-by-Step Reasoning
-
Effect on AD: Higher interest rates increase the cost of borrowing for households and firms. Consumption and investment fall, reducing aggregate demand. If inflation is demand-pull, lower AD reduces upward pressure on prices. This is a positive outcome for the inflation target, so it would encourage the use of interest rates, not discourage it. Hence option A does not explain why the government might avoid raising rates.
-
Effect on AS: Higher interest rates can also affect the supply side. Firms with variable-rate loans face higher interest costs, increasing their expenses. This can shift the SRAS curve leftwards, raising the price level (cost-push inflation). Additionally, higher rates discourage long-term investment in capital, potentially reducing the economy's productive capacity and shifting the LRAS leftwards. A fall in AS would either increase inflation or limit the reduction in inflation from the AD fall. This is a legitimate concern, so option B is correct.
-
Effect on saving: Higher interest rates increase the reward for saving, so saving tends to rise, not fall. Therefore option C is factually incorrect.
-
Effect on the exchange rate: Higher interest rates attract foreign capital inflows, increasing demand for the domestic currency, causing an appreciation (a rise in the exchange rate), not a fall. Therefore option D is also incorrect.
Thus only option B provides a plausible reason: raising interest rates could reduce aggregate supply, undermining the disinflationary goal.
Key Takeaways
- Changes in interest rates affect not only aggregate demand but also aggregate supply, though the supply effect is often slower and more indirect.
- A policy that reduces AD may be desirable to reduce demand-pull inflation, but if it also reduces AS, it could be self-defeating.
- Always consider possible side effects when evaluating the net impact of a policy.
- In multiple-choice questions, read the question carefully to determine whether it asks for an advantage or a disadvantage of a policy.
Common Mistakes
- Choosing option A because it is a true statement about the effect of higher rates, without checking whether it is a reason for or against using the policy.
- Thinking that higher interest rates will reduce saving (the opposite is true).
- Assuming that higher interest rates will depreciate the exchange rate (they normally appreciate it).
Things to Be Careful About
- Distinguish between a policy's intended effect and its unintended consequences. The question asks for the side effect that makes the policy less attractive.
- Know the basic direction of causality: higher interest rates -> lower investment and consumption (AD down); higher rates -> higher saving; higher rates -> capital inflows -> exchange rate appreciation.
- Recognise that aggregate supply effects are relevant even if they are not immediate; they can offset the demand-side benefits.
Which argument in favour of protectionism is not generally regarded as economically valid?
Options
A Once the protected industry becomes established, it will produce efficiently.
B It prevents heavily subsidised imports from competing unfairly against domestic goods.
C It provides time for the protected industry’s workers to be retrained for other work.
D It increases the standard of living of the population in general.
Reasoning
Protectionism is generally justified by the infant industry argument (A), the anti-dumping argument (B), and the adjustment assistance argument (C). However, protectionism reduces competition and leads to higher prices for consumers, which lowers real incomes and the standard of living. Therefore, the claim that it increases the standard of living (D) is not economically valid.
Answer
D
D
Background Concept
Protectionism refers to government policies that restrict international trade to protect domestic industries from foreign competition. Common arguments in favour of protectionism include the infant industry argument (temporary protection to allow a new industry to become competitive), the anti-dumping argument (preventing foreign firms from selling below cost to drive out domestic competitors), and the adjustment assistance argument (providing time for workers to retrain and move to other sectors). However, mainstream economics holds that free trade generally increases overall welfare by allowing specialisation according to comparative advantage, leading to lower prices and greater variety for consumers. Protectionism reduces these gains and typically lowers the standard of living.
Understanding the Question
The question asks which of the four listed arguments in favour of protectionism is not generally regarded as economically valid. This means we need to identify the argument that most economists would reject as a sound justification for trade barriers. The options present three commonly cited valid arguments (A, B, C) and one that is widely considered invalid (D).
Approach
Evaluate each option against standard economic theory and the consensus among economists. For each, consider whether the argument is accepted as a legitimate rationale for protectionism, even if it has limitations. The invalid argument will be the one that contradicts basic economic principles.
Step-by-Step Reasoning
- Option A: Once the protected industry becomes established, it will produce efficiently. This is the infant industry argument. It is considered valid in theory: temporary protection can allow a new industry to achieve economies of scale and become competitive. However, in practice it is often misused, but the argument itself is economically valid.
- Option B: It prevents heavily subsidised imports from competing unfairly against domestic goods. This is the anti-dumping argument. Dumping (selling below cost) can be predatory, and protection against it is allowed under WTO rules. Economists generally accept this as a valid reason for temporary tariffs.
- Option C: It provides time for the protected industry’s workers to be retrained for other work. This is the adjustment assistance argument. Protection can give workers time to retrain and move to growing sectors, reducing the social costs of trade liberalisation. This is considered a valid transitional justification.
- Option D: It increases the standard of living of the population in general. This is not generally regarded as valid because protectionism raises prices for consumers, reduces choice, and leads to inefficient allocation of resources. While it may benefit specific groups (e.g., protected industry workers), it typically reduces overall economic welfare and living standards. Therefore, this argument is rejected by most economists.
Key Takeaways
- The three commonly accepted arguments for protectionism are the infant industry argument, the anti-dumping argument, and the adjustment assistance argument.
- The claim that protectionism raises the general standard of living is not supported by economic theory; free trade is generally associated with higher living standards.
- Understanding which arguments are considered valid helps in evaluating trade policy debates.
Common Mistakes
- Assuming that all arguments for protectionism are equally valid. Some are more accepted than others.
- Confusing the infant industry argument with the idea that protectionism always leads to efficiency (it does not; it can lead to inefficiency if protection is permanent).
- Thinking that protectionism benefits everyone; in reality, it creates winners and losers, and the net effect is usually negative for the overall economy.
Things to Be Careful About
- The question asks for the argument that is not generally regarded as economically valid. This is a negative selection: we need to pick the one that is least accepted.
- Option D is the only one that makes a broad claim about the general population's standard of living, which is directly contradicted by the principle of comparative advantage and the gains from trade.
- Be precise: the other three arguments have some validity, even if they have limitations or are sometimes misapplied.
A country has a deficit on the current account of the balance of payments.
What would be expected to increase the deficit?
Options
A an appreciation of the exchange rate
B an increase in domestic productivity
C an introduction of import quotas
D a rise in subsidies to domestic firms
Answer
A. An appreciation of the exchange rate makes exports more expensive and imports cheaper, so net exports fall, worsening the current account deficit. The other options would reduce the deficit or have no effect.
B. An increase in domestic productivity may improve competitiveness, increasing exports and reducing the deficit.
C. Import quotas directly reduce imports, reducing the deficit.
D. Subsidies to domestic firms may lower costs, improve competitiveness, increase exports, and reduce the deficit.
Therefore, only A increases the deficit.
A
Background Concept
A current account deficit occurs when the value of imports of goods, services, primary income, and secondary income exceeds the value of exports. The current account is part of the balance of payments. An appreciation of the exchange rate means the domestic currency becomes stronger relative to foreign currencies. This makes exports more expensive in foreign currency and imports cheaper in domestic currency. Typically, this leads to a fall in the quantity of exports and an increase in the quantity of imports, reducing net exports and worsening the current account deficit.
Understanding the Question
The question states that a country already has a current account deficit and asks which of the four options would be expected to increase that deficit. "Increase the deficit" means make it larger (more negative). We need to evaluate the effect of each option on the current account balance.
Approach
We will consider each option in turn, using basic demand and supply analysis for exchange rates and trade. For each option, we determine whether it would likely improve (reduce the deficit) or worsen (increase the deficit) the current account.
Step-by-Step Reasoning
Option A: An appreciation of the exchange rate
- Appreciation means the domestic currency buys more foreign currency.
- Exports become more expensive for foreign buyers: the price in foreign currency rises. Assuming demand for exports is price elastic (typically in the long run), the quantity of exports demanded falls.
- Imports become cheaper for domestic consumers: the domestic price of imported goods falls. The quantity of imports demanded rises.
- Net exports (exports minus imports) decrease. Since the current account deficit is essentially net exports (plus net income flows, but the question focuses on trade), a decrease in net exports increases the deficit.
- Therefore, A is expected to increase the deficit.
Option B: An increase in domestic productivity
- Higher productivity reduces costs of production, making domestic firms more competitive.
- This could lead to lower prices of exports, increasing export quantity.
- It may also reduce the need for imports if domestic goods become cheaper substitutes.
- Overall, net exports likely increase, reducing the deficit. So B does not increase the deficit.
Option C: An introduction of import quotas
- Import quotas directly limit the quantity of imports.
- This reduces the volume of imports, improving the trade balance and reducing the deficit. So C does not increase the deficit.
Option D: A rise in subsidies to domestic firms
- Subsidies lower costs for domestic firms, making them more competitive.
- This can increase exports and possibly reduce imports as domestic goods become cheaper relative to foreign goods.
- Net exports improve, reducing the deficit. So D does not increase the deficit.
Therefore, only option A is correct.
Key Takeaways
- An appreciation of the exchange rate typically worsens the current account deficit (unless the Marshall-Lerner condition is not met, but at AS level the standard effect is assumed).
- Other factors that improve competitiveness (productivity, subsidies, quotas) tend to reduce the deficit.
- Understanding the direction of causation is crucial for multiple-choice questions.
Common Mistakes
- Confusing appreciation with depreciation: appreciation raises the currency's value, making exports less competitive.
- Thinking that appreciation always improves the trade balance (it does the opposite in the short run).
- Not considering the effect on both exports and imports.
Things to Be Careful About
- The question asks "increase the deficit", so a larger negative number.
- The Marshall-Lerner condition states that depreciation improves the current account only if the sum of PED for exports and imports is greater than 1. But at AS level, the standard assumption is that appreciation worsens the deficit.
- Be careful with the wording: "increase the deficit" means make it more negative.
A government increases the import quota of cars.
What is the likely effect of this?
Options
A jobs will be created in the domestic car industry
B prices of cars will fall for domestic consumers
C specialisation is reduced
D trading partners will retaliate
Answer
An import quota restricts the quantity of cars that can be imported. This reduces the total supply of cars available in the domestic market, shifting the supply curve leftwards. With demand unchanged, the equilibrium price rises. Therefore, prices of cars will fall for domestic consumers is incorrect — prices will rise. The correct answer is B.
B
Background Concept
An import quota is a physical limit on the quantity of a good that can be imported into a country over a given period. It is a form of protectionism — a government policy to restrict international trade. The immediate effect of a quota is to reduce the supply of the imported good in the domestic market. Using standard demand and supply analysis, a leftward shift of the supply curve (from S1 to S2) leads to a higher equilibrium price (P2 > P1) and a lower equilibrium quantity (Q2 < Q1) compared to the free-trade situation. Domestic consumers face higher prices and reduced choice. The domestic industry may benefit from reduced competition, but that is not the same as job creation being guaranteed — jobs could rise or fall depending on how the industry responds.
Understanding the Question
This is a multiple-choice question asking for the likely effect of an increase in the import quota of cars. The question tests the candidate's understanding of the basic mechanics of a quota. The four options present possible outcomes: job creation in the domestic industry (A), lower prices for consumers (B), reduced specialisation (C), and retaliation by trading partners (D). The correct answer is the one that follows directly from the standard economic analysis of a quota.
Approach
- Recall the definition and effect of an import quota: it restricts supply, raising price.
- Evaluate each option against this logic.
- Option B claims prices will fall — this is the opposite of the predicted effect, so it is the correct answer (the question asks for the likely effect, and the other three are either incorrect or not the most direct effect).
Step-by-Step Reasoning
- An import quota is a limit on the quantity of imports. Increasing the quota means allowing more imports, not fewer. Wait — the question says "increases the import quota". This is a critical detail. An increase in the quota means the government allows a larger quantity of imports than before. This is an expansion of the quota, not a restriction. So the supply of cars in the domestic market increases (rightward shift of supply), leading to a lower equilibrium price. Therefore, option B — prices of cars will fall for domestic consumers — is correct.
Let's re-evaluate each option:
-
A: jobs will be created in the domestic car industry. More imports mean more competition for domestic producers. Domestic firms may lose market share and reduce output, potentially leading to job losses, not job creation. So A is incorrect.
-
B: prices of cars will fall for domestic consumers. As argued, an increase in the quota raises supply, lowering price. This is the direct and likely effect. B is correct.
-
C: specialisation is reduced. Specialisation refers to countries focusing on producing goods where they have a comparative advantage. More trade (via a larger quota) generally increases specialisation, not reduces it. So C is incorrect.
-
D: trading partners will retaliate. Retaliation is possible but not a certain or direct economic effect. It is a political outcome, not a guaranteed consequence. The question asks for the "likely effect", and the price effect is more immediate and certain. D is not the best answer.
Thus, B is the correct choice.
Key Takeaways
- An import quota restricts supply; increasing the quota expands supply.
- The direct market effect of an expanded quota is lower prices for consumers.
- Always read the exact wording: "increases the import quota" means more imports, not fewer.
- In multiple-choice questions, identify the most direct and certain economic consequence.
Common Mistakes
- Misreading "increases the import quota" as "increases restrictions" — a quota increase means allowing more imports, not fewer.
- Confusing a quota with a tariff: a tariff raises price directly via a tax; a quota raises price by restricting quantity. An increase in the quota lowers price.
- Choosing D (retaliation) because it sounds plausible, but it is not a guaranteed economic effect and is less direct than the price change.
Things to Be Careful About
- Pay close attention to the direction of the policy change: increase vs. decrease, expansion vs. contraction.
- Distinguish between the effect on domestic producers (more competition, possible job losses) and on consumers (lower prices, more choice).
- In multiple-choice, eliminate clearly wrong options first, then choose the most direct and certain effect.
The table gives the terms of trade index for a country over three years.
| year 1 | year 2 | year 3 | |
|---|---|---|---|
| terms of trade | 100 | 105 | 112 |
What is the most likely impact of this change?
Options
A there will be a decrease in cost-push inflation
B there will be a decrease in living standards
C there will be an increase in the budget surplus
D there will be an increase in the volume of exports
Reasoning
The terms of trade index rises from 100 to 105 to 112. This means the price of exports relative to the price of imports is increasing. Equivalently, the price of imports relative to exports is falling. A fall in import prices reduces the cost of imported raw materials and components, which lowers firms' costs of production. Lower costs reduce cost-push inflationary pressure. Therefore the most likely impact is a decrease in cost-push inflation.
Answer
A
A
Background Concept
The terms of trade measure the ratio of export prices to import prices. An index is used: a base year is set at 100, and subsequent years show the percentage change relative to that base. A rise in the index (e.g. from 100 to 112) means export prices have risen relative to import prices, or import prices have fallen relative to export prices. This is an improvement in the terms of trade. The impact on the economy depends on which side of the ratio is changing.
Understanding the Question
The table shows a country's terms of trade index rising over three years. The question asks for the most likely impact of this change. Four options are given: a decrease in cost-push inflation, a decrease in living standards, an increase in the budget surplus, and an increase in the volume of exports. We need to identify which one is most directly and plausibly linked to a rising terms of trade.
Approach
First, interpret what a rising terms of trade index means: export prices have risen relative to import prices, or import prices have fallen relative to export prices. Then consider each option in turn, tracing the causal chain from the change in relative prices to the claimed outcome. The correct answer will be the one that follows logically from the change.
Step-by-Step Reasoning
-
Interpret the index: The terms of trade index = (export price index / import price index) x 100. A rise from 100 to 112 means the ratio has increased by 12%. This could be because export prices rose, import prices fell, or a combination.
-
Link to cost-push inflation (Option A): Cost-push inflation arises when firms' costs of production increase. A key source of cost increases is a rise in the price of imported raw materials, components, and energy. If the terms of trade are rising because import prices are falling (or rising more slowly than export prices), then imported inputs become cheaper. This reduces firms' costs, which reduces cost-push inflationary pressure. Therefore a decrease in cost-push inflation is a plausible and direct consequence.
-
Evaluate Option B (decrease in living standards): A rising terms of trade could improve living standards if it means the country can buy more imports with the same export revenue (i.e. import prices have fallen). This would tend to raise living standards, not lower them. If the rise is due to export prices rising, that might boost export revenue and national income, also potentially raising living standards. So a decrease in living standards is unlikely.
-
Evaluate Option C (increase in the budget surplus): The budget surplus depends on government revenue and spending. A change in the terms of trade might affect tax revenue (e.g. through changes in corporate profits or import duties), but the link is indirect and uncertain. There is no direct mechanism from a rising terms of trade to a larger budget surplus. This is not the most likely impact.
-
Evaluate Option D (increase in the volume of exports): A rising terms of trade means export prices have risen relative to import prices. If the rise is due to higher export prices, the volume of exports might fall (if demand is price elastic) or stay the same (if demand is price inelastic). If the rise is due to lower import prices, there is no direct effect on export volume. So an increase in export volume is not the most likely outcome.
-
Conclusion: The most direct and likely impact is a reduction in cost-push inflation, because cheaper imports reduce firms' costs.
Key Takeaways
- The terms of trade index measures the ratio of export to import prices.
- A rising index can mean export prices rising or import prices falling.
- Falling import prices reduce cost-push inflation by lowering firms' input costs.
- Always trace the causal chain from the change to the claimed outcome.
Common Mistakes
- Confusing a rising terms of trade with a trade surplus or deficit. The terms of trade are about relative prices, not the balance of trade.
- Assuming a rising terms of trade always benefits the economy. It can be a sign of export price rises that reduce competitiveness.
- Selecting an option that is plausible but not directly linked, such as the budget surplus.
Things to Be Careful About
- The terms of trade index is a ratio; a rise does not tell you which component changed. You must consider both possibilities.
- Cost-push inflation is specifically about costs of production, not general price rises. Cheaper imports directly reduce costs.
- The question asks for the "most likely" impact, so you need the strongest causal link, not just a possible one.
Country X and country Y use the same amount of resources to produce mobile phones and televisions. The table shows how much of each product can be produced if all resources are used to produce that product.
| mobile phones | televisions | |
|---|---|---|
| country X | 500 | 400 |
| country Y | 100 | 200 |
What can be deduced about absolute advantage and comparative advantage?
Options
A Country X has an absolute advantage in producing mobile phones and a comparative advantage in producing televisions.
B Country X has an absolute advantage in producing televisions and a comparative advantage in producing mobile phones.
C Country Y has an absolute advantage in producing mobile phones and a comparative advantage in producing televisions.
D Country Y has an absolute advantage in producing televisions and a comparative advantage in producing mobile phones.
Working
Absolute advantage
Country X can produce 500 mobile phones and 400 televisions. Country Y can produce 100 mobile phones and 200 televisions. Country X produces more of both goods, so it has an absolute advantage in both mobile phones and televisions.
Comparative advantage
Country X: opportunity cost of 1 mobile phone = 400/500 = 0.8 televisions.
Country Y: opportunity cost of 1 mobile phone = 200/100 = 2 televisions.
Country X has a lower opportunity cost in mobile phones, so it has a comparative advantage in mobile phones.
Country Y: opportunity cost of 1 television = 100/200 = 0.5 mobile phones.
Country X: opportunity cost of 1 television = 500/400 = 1.25 mobile phones.
Country Y has a lower opportunity cost in televisions, so it has a comparative advantage in televisions.
Answer
B
B
Background Concept
Absolute advantage refers to the ability of a country to produce a good using fewer resources (or more output from the same resources) than another country. Comparative advantage refers to the ability to produce a good at a lower opportunity cost than another country. Opportunity cost is the value of the next best alternative forgone when a choice is made. In trade theory, even if one country has an absolute advantage in both goods, both countries can still gain from trade if they specialise according to their comparative advantage.
Understanding the Question
The table gives the maximum output of mobile phones and televisions for each country if all resources are devoted to that product. The question asks what can be deduced about absolute and comparative advantage. The correct answer must correctly identify which country has the absolute advantage in each good and which has the comparative advantage in each good.
Approach
First, compare the output numbers directly to determine absolute advantage: whichever country can produce more of a good from the same resources has the absolute advantage. Second, calculate the opportunity cost of producing one unit of each good in each country. The country with the lower opportunity cost for a good has the comparative advantage in that good.
Step-by-Step Reasoning
Step 1: Absolute advantage
- Country X can produce 500 mobile phones; Country Y can produce 100. Country X produces more, so it has the absolute advantage in mobile phones.
- Country X can produce 400 televisions; Country Y can produce 200. Country X produces more, so it has the absolute advantage in televisions.
- Therefore, Country X has an absolute advantage in both goods. Options C and D claim Country Y has an absolute advantage in one or both goods, so they are incorrect.
Step 2: Comparative advantage
- For Country X: to produce 1 mobile phone, it gives up 400/500 = 0.8 televisions. To produce 1 television, it gives up 500/400 = 1.25 mobile phones.
- For Country Y: to produce 1 mobile phone, it gives up 200/100 = 2 televisions. To produce 1 television, it gives up 100/200 = 0.5 mobile phones.
- Compare opportunity costs:
- Mobile phones: Country X's opportunity cost (0.8 TVs) < Country Y's (2 TVs). So Country X has the comparative advantage in mobile phones.
- Televisions: Country Y's opportunity cost (0.5 phones) < Country X's (1.25 phones). So Country Y has the comparative advantage in televisions.
- This matches option B: Country X has an absolute advantage in producing mobile phones (and televisions) and a comparative advantage in producing mobile phones.
Step 3: Verify option A
Option A says Country X has a comparative advantage in televisions. This is false because Country Y has the lower opportunity cost for televisions.
Key Takeaways
- Absolute advantage is determined by comparing output per unit of resources.
- Comparative advantage is determined by comparing opportunity cost ratios.
- A country can have an absolute advantage in both goods but still have a comparative advantage in only one.
- The country with the lower opportunity cost for a good should specialise in that good.
Common Mistakes
- Confusing absolute advantage with comparative advantage: many students think the country that produces more of a good must also have the comparative advantage in it.
- Miscalculating opportunity cost: for example, calculating the opportunity cost of mobile phones as 500/400 instead of 400/500.
- Forgetting to compare both goods: a correct answer must identify comparative advantage for both goods, not just one.
Things to Be Careful About
- Always express opportunity cost as the amount of the other good forgone per unit of the good in question.
- Double-check which country has the lower opportunity cost for each good.
- Read the options carefully: option B correctly states Country X has absolute advantage in mobile phones (and by implication televisions) and comparative advantage in mobile phones.
Your score so far
Answer a question to start scoring
Your marks add up here as you work through the paper.