Economics 9708/12 — May/June 2025
Cambridge AS Level · AS Level Multiple Choice · answer key with instant marking and worked solutions
Topics Market Equilibrium and the Price Mechanism · Fiscal Policy · Classification of Goods and Services · Elasticities of Demand · Aggregate Demand and Aggregate Supply · Balance of Payments · +19 more
Tap an option under each question to check it — your score builds as you go.
What is the best definition of a positive economic statement?
Options
A A statement that is based on fact and can be tested.
B A statement that attempts to influence economic decisions.
C A statement that is subjective and cannot be confirmed.
D An encouraging economic update in the opinion of the central bank.
Reasoning
A positive economic statement is one that is based on fact and can be tested against evidence. It describes what is, was, or will be, without expressing a value judgement.
Answer
A
A
Background Concept
In economics, statements are classified into two types: positive and normative. A positive statement is objective and can be tested using data. For example, "The unemployment rate is 5%" is positive because it can be verified. A normative statement is subjective and expresses an opinion or value judgement, such as "The unemployment rate should be lower." This distinction is fundamental to economic methodology because it separates analysis from policy advocacy.
Understanding the Question
The question asks for the best definition of a positive economic statement. The four options present different characteristics: fact-based and testable (A), attempting to influence decisions (B), subjective and unconfirmable (C), and an encouraging opinion from the central bank (D). Only option A correctly captures the essence of a positive statement.
Approach
Recall the standard definition of a positive statement: it is factual and testable. Then evaluate each option against that definition. Option A matches exactly. Options B, C, and D describe normative statements or other concepts.
Step-by-Step Reasoning
- Identify the core feature of a positive statement: It is based on objective facts and can be tested using evidence. This is the defining characteristic taught in the syllabus.
- Evaluate option A: "A statement that is based on fact and can be tested." This directly matches the definition. It is correct.
- Evaluate option B: "A statement that attempts to influence economic decisions." This describes a normative statement, which expresses a value judgement or prescribes what should be done. It is not positive.
- Evaluate option C: "A statement that is subjective and cannot be confirmed." This is the opposite of a positive statement. Subjective, unconfirmable statements are normative.
- Evaluate option D: "An encouraging economic update in the opinion of the central bank." This is a specific example of a normative statement (an opinion), not a general definition of a positive statement.
- Conclusion: Only option A is correct.
Key Takeaways
- Positive statements are objective and testable; normative statements are subjective and value-laden.
- The ability to distinguish between the two is essential for understanding economic analysis versus policy prescription.
- In multiple-choice questions, look for the key words "fact" and "tested" to identify a positive statement.
Common Mistakes
- Confusing positive with "optimistic" or "encouraging" (as in option D). Positive does not mean good news; it means factual.
- Thinking that a statement that "attempts to influence" is positive (option B). Influencing decisions is a normative goal.
- Selecting option C because it sounds like a definition of "normative" but misreading the question.
Things to Be Careful About
- Read the question carefully: it asks for the "best definition," not an example.
- Remember that positive statements can be false — they are still positive as long as they are testable. For example, "The moon is made of cheese" is positive (it can be tested and proven false).
- Do not let the word "positive" in everyday language (meaning good or optimistic) influence your choice.
The diagram is from a chapter on ‘The Fundamental Economic Problem’ in an Economics textbook. It should contain the terms opportunity cost, scarcity and choice in the order that identifies the fundamental economic problem.

What is the correct order for the terms to appear in the diagram?
Options
A choice → opportunity cost → scarcity
B choice → scarcity → opportunity cost
C scarcity → choice → opportunity cost
D scarcity → opportunity cost → choice
Answer
Scarcity — the condition of limited resources relative to unlimited wants — is the root cause of the fundamental economic problem. Because resources are scarce, individuals, firms and governments must make choices about how to allocate them. Every choice involves sacrificing the next best alternative, which is the opportunity cost. The correct causal sequence is therefore scarcity → choice → opportunity cost.
C
C
Background Concept
Economics begins with the fundamental economic problem of scarcity: resources are finite, but human wants are infinite. This mismatch means that no society can produce everything that everyone desires. Because of scarcity, economic agents — individuals, firms and governments — must constantly make choices about which wants to satisfy and which to defer. When a choice is made, the next best alternative that is given up is called the opportunity cost. The three concepts are therefore linked in a strict logical chain: scarcity creates the need for choice, and choice inherently generates opportunity cost.
Understanding the Question
The question presents a flow diagram with three empty boxes connected by arrows labelled 'leads to'. It asks the candidate to place the terms scarcity, choice and opportunity cost in the order that correctly identifies the fundamental economic problem. The arrows indicate a causal or sequential relationship: the concept in the first box causes or necessitates the concept in the second, which in turn causes or necessitates the concept in the third. The task is to apply knowledge of the definitions to determine this sequence.
Approach
To solve this, first define each term and identify the dependency between them:
- Scarcity is the starting condition (limited resources, unlimited wants).
- Choice is the response to scarcity (deciding what to produce/consume).
- Opportunity cost is the consequence of choice (the value of the next best alternative foregone).
Test each option against this logic. The correct sequence must begin with scarcity, have choice in the middle, and end with opportunity cost.
Step-by-Step Reasoning
- Scarcity comes first. Without scarcity — without limited resources and unlimited wants — there would be no need for economics. Scarcity is the root problem that drives all economic activity.
- Choice comes second. Because resources are scarce, we cannot have everything we want. Therefore, we must choose which wants to satisfy and which to leave unsatisfied. Choice is the direct response to scarcity.
- Opportunity cost comes third. When we make a choice, we inevitably give up the next best alternative. This sacrificed alternative is the opportunity cost. Opportunity cost cannot exist before a choice is made; it is the result of choosing.
- Evaluating the options:
- Option A (choice → opportunity cost → scarcity) is wrong because choice does not precede scarcity; scarcity causes choice.
- Option B (choice → scarcity → opportunity cost) is wrong for the same reason; scarcity is the starting point, not the middle term.
- Option C (scarcity → choice → opportunity cost) matches the logical chain exactly.
- Option D (scarcity → opportunity cost → choice) is wrong because opportunity cost is the result of choice, not a precursor to it.
- Therefore, option C is correct.
Key Takeaways
The fundamental economic problem follows an unbroken logical sequence: scarcity forces choice, and choice creates opportunity cost. This chain underpins all microeconomic and macroeconomic analysis. Whenever you encounter a decision-making scenario, ask first whether scarcity exists, then what choices are being made, and finally what opportunity cost those choices impose.
Common Mistakes
- Reversing the order by placing choice before scarcity. Choice is a response to scarcity, not its cause. Without scarcity, there would be no need to choose.
- Placing opportunity cost before choice. Opportunity cost is defined as the value of the next best alternative foregone when a choice is made. It cannot exist before the choice itself.
- Thinking the three concepts are independent. They are causally linked; understanding the direction of the arrows is essential.
Things to Be Careful About
- Respect the direction of the arrows in the diagram: 'leads to' means the first concept causes or necessitates the second.
- Remember that scarcity is always the root cause in the fundamental economic problem; it is never the result of choice or opportunity cost.
- Opportunity cost refers specifically to the next best alternative, not all alternatives. This precision matters when applying the concept to real-world decisions.
What is a statement of the non-rivalrous nature of public goods?
Options
A It is not possible to stop a non-payer from using the product.
B One person consuming the product does not reduce the amount of it available to others.
C People consume too little of the product because they are unaware of its true benefits.
D There is an unlimited supply of the product.
The question asks for the statement that describes the non-rivalrous nature of public goods. Non-rivalry means that consumption of the good by one person does not diminish the quantity available for others. Option B states exactly this: 'One person consuming the product does not reduce the amount of it available to others.' Option A describes non-excludability, option C describes under-consumption of a merit good, and option D describes a free good. Therefore, the correct answer is B.
Answer
B
B
Background Concept
Public goods have two key characteristics: non-rivalry and non-excludability. Non-rivalry means that one person's consumption of the good does not reduce the amount available for others. For example, street lighting: when one person benefits from the light, it does not diminish the light available to others. Non-excludability means that it is impossible to prevent someone from using the good even if they do not pay for it. This leads to the free-rider problem, where individuals have no incentive to pay, so the market fails to provide the good efficiently. Private goods are both rival and excludable, while merit goods (like education) are under-consumed due to imperfect information, and free goods (like air) have an unlimited supply.
Understanding the Question
This is a multiple-choice question testing the definition of non-rivalry. The candidate must identify which of the four statements correctly describes the non-rivalrous nature of public goods. The other options are plausible distractors: A describes non-excludability, C describes a merit good problem, and D describes a free good. The command word is implicit: 'What is a statement of' – essentially, identify the correct definition.
Approach
Recall the exact definition of non-rivalry. Compare each option against that definition. Eliminate options that describe other concepts. Option B is the only one that matches the definition of non-rivalry.
Step-by-Step Reasoning
- Read the question: 'What is a statement of the non-rivalrous nature of public goods?'
- Recall the definition: non-rivalry means that one person's consumption of the good does not reduce the amount available for others.
- Option A: 'It is not possible to stop a non-payer from using the product.' This is non-excludability, not non-rivalry. So A is incorrect.
- Option B: 'One person consuming the product does not reduce the amount of it available to others.' This perfectly matches the definition of non-rivalry. So B is correct.
- Option C: 'People consume too little of the product because they are unaware of its true benefits.' This describes the under-consumption of a merit good due to imperfect information. It is not a characteristic of public goods. So C is incorrect.
- Option D: 'There is an unlimited supply of the product.' This describes a free good (like air or sunlight). Public goods are not necessarily unlimited in supply; they are non-rival but can still be scarce (e.g., a lighthouse can be congested in theory). So D is incorrect.
- Therefore, the correct answer is B.
Key Takeaways
- Public goods are defined by non-rivalry and non-excludability.
- Non-rivalry: consumption by one does not reduce availability for others.
- Non-excludability: impossible to prevent non-payers from using the good.
- Merit goods: under-consumed due to imperfect information.
- Free goods: unlimited supply, zero opportunity cost.
- This question tests the ability to distinguish between these related concepts.
Common Mistakes
- Confusing non-rivalry with non-excludability: Option A is a common mistake because students often mix up the two characteristics.
- Thinking that public goods are free goods: Option D is tempting because some public goods (like air) are free, but non-rivalry does not imply unlimited supply.
- Thinking that under-consumption is a feature of public goods: Option C is a typical description of merit goods, but students may incorrectly associate it with public goods.
Things to Be Careful About
- Read each option carefully and compare it to the exact definition.
- Remember that non-rivalry is about quantity not being reduced, not about price or exclusion.
- Do not assume that 'public good' means 'good provided by the government' – it is a specific economic concept with these two characteristics.
- The question specifically asks for the 'non-rivalrous nature', so focus on that characteristic.
A country increases its spending on education and training. It pays for this by reducing unemployment benefit payments and increasing taxes on imports of machinery.
What is the likely effect of these changes?
Options
| human capital | physical capital | |
|---|---|---|
| A | decreases | decreases |
| B | decreases | increases |
| C | increases | decreases |
| D | increases | increases |
Reasoning
Spending on education and training directly improves the skills, knowledge and abilities of the workforce, which increases the stock of human capital. Therefore, human capital rises.
Increasing taxes on imports of machinery makes imported capital goods more expensive. Firms will respond by reducing their purchases of machinery, so the stock of physical capital falls.
Human capital increases; physical capital decreases. This corresponds to option C.
Answer
C
C
Background Concept
Human capital refers to the stock of knowledge, skills, and health that people accumulate through education, training, and experience. It is one of the factors of production, alongside physical capital (machinery, equipment, buildings). Both types of capital are essential for production, but they are distinct: human capital is embodied in labour, while physical capital is a produced means of production.
Government policies can affect human capital through spending on education and training, and can affect physical capital through taxes or subsidies on capital goods.
Understanding the Question
The question describes two simultaneous policy changes: (1) increased spending on education and training, and (2) a cut in unemployment benefit payments and an increase in taxes on imports of machinery. The question asks for the likely effect on human capital and physical capital. The cut in unemployment benefits is a red herring – it does not directly affect either type of capital (it may affect labour supply or incentives, but the question's focus is on capital). The effective change is: more spending on education/training → increases human capital; higher taxes on machinery imports → increases cost of physical capital → reduces investment in physical capital → physical capital decreases. The combination yields option C.
Approach
- Identify the effect of increased education and training spending on human capital.
- Identify the effect of the tax on imports of machinery on physical capital.
- Combine the two effects to find the correct option.
- Ignore the reduction in unemployment benefits as it is irrelevant to the capital types.
Step-by-Step Reasoning
-
Effect on human capital: Education and training directly enhance the skills, knowledge, and productivity of the labour force. This is a classic example of investment in human capital. Therefore, human capital unambiguously increases.
-
Effect on physical capital: A tax on imported machinery raises the price of this capital good. Firms face higher costs for acquiring machinery. Assuming demand for machinery is sensitive to price (elastic at least to some degree), firms will reduce the quantity of machinery they purchase. This leads to a lower stock of physical capital over time (or at least reduces the rate of capital accumulation). Thus, physical capital decreases.
-
The cut in unemployment benefits does not directly affect either form of capital; it might affect labour supply, but the question is about capital, not labour supply. It is a distractor.
-
Combining: human capital up, physical capital down → option C.
Key Takeaways
- Understand the distinction between human capital and physical capital.
- Recognise that government spending on education and training is a direct way to increase human capital.
- Recognise that taxes on imported capital goods act as a disincentive to investment in physical capital.
- In multiple-choice questions, isolate the key policy changes and ignore irrelevant information.
Common Mistakes
- Confusing human capital with labour supply or with physical capital.
- Thinking that the cut in unemployment benefits will affect human capital (it might affect labour supply but not the stock of skills).
- Assuming that the tax on imports will reduce the price of machinery (it raises it) or that it will increase physical capital (it reduces it).
- Overcomplicating by considering the fiscal balance (spending increase vs. tax revenue and benefit cut) – the question is about the direct effects on capital, not about the budget.
Things to Be Careful About
- Read the question carefully: it asks for the effect on human capital and physical capital, not on other variables.
- The tax is on imports of machinery; this is a tariff, which increases the domestic price of machinery, so it reduces investment in physical capital.
- The increase in spending on education and training is an increase in government expenditure on a merit good, which directly boosts human capital.
- Do not confuse the reduction in unemployment benefit payments with an effect on the stock of capital – it is irrelevant to the answer.
- The correct option is C: human capital increases, physical capital decreases.
The diagram shows an outward shift of the production possibility curve from PPC1 to PPC2.
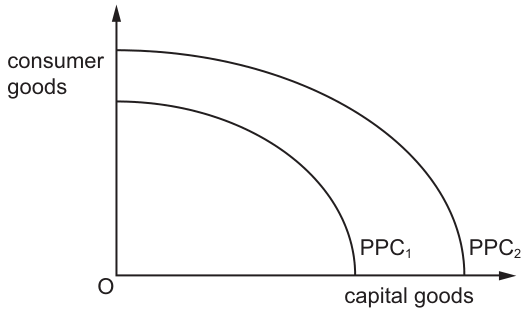
What could have caused this shift?
Options
A a decrease in mineral resources
B a decrease in prices of consumer goods
C an increase in employment
D an increase in technology
Answer
An outward shift of the production possibility curve (PPC) from PPC1 to PPC2 represents an increase in the economy's productive capacity, enabling it to produce more of both consumer goods and capital goods. Such a shift is caused by an increase in the quantity or quality of the factors of production, or by technological advancement.
- Option A is incorrect because a decrease in mineral resources would reduce the economy's resource base and shift the PPC inward, not outward.
- Option B is incorrect because a decrease in the prices of consumer goods is a change in market price; it affects the demand and supply in the goods market but does not alter the economy's productive capacity or shift the PPC.
- Option C is incorrect because an increase in employment means existing unemployed labour is being utilised. This moves the economy from a point inside the PPC to a point on the existing curve, but does not shift the curve itself.
- Option D is correct because an increase in technology raises the productivity of resources and expands the economy's productive capacity, causing the PPC to shift outward.
D
D
Background Concept
A production possibility curve (PPC) is a graphical representation that shows the maximum possible output combinations of two goods an economy can produce when all resources are fully and efficiently employed, given the current state of technology. The curve is typically concave to the origin due to increasing opportunity costs.
An outward (or rightward) shift of the PPC indicates economic growth — the economy's productive capacity has increased. This means the economy can now produce more of both goods than before. Such shifts are caused by:
- An increase in the quantity of resources (e.g., growth in the labour force, discovery of new mineral reserves)
- An improvement in the quality of resources (e.g., better education and training, improved health)
- Technological advancement, which makes existing resources more productive
It is crucial to distinguish between a shift of the PPC and a movement along or towards the PPC. A movement along the curve occurs when the economy reallocates resources between the two goods. A movement from a point inside the curve to a point on the curve occurs when previously unemployed or underemployed resources are put to use. Neither of these movements shifts the curve itself; only changes in the quantity/quality of resources or technology shift the curve.
Understanding the Question
The question presents a diagram showing the PPC shifting outward from PPC1 to PPC2. The vertical axis represents consumer goods and the horizontal axis represents capital goods. The question asks what could have caused this outward shift.
The command word is implicit (identification/cause). The task is to select the one option that represents a change in productive capacity capable of shifting the PPC outward. The distractors represent either changes that would shift the PPC inward, changes that affect prices rather than capacity, or changes that affect the utilisation of resources rather than the capacity itself.
Approach
To answer this, evaluate each option against the theory of what causes PPC shifts:
- Recall that outward shifts require an increase in resources or technology.
- Eliminate options that describe a reduction in resources (inward shift).
- Eliminate options that describe price changes (these affect demand/supply, not the PPC).
- Eliminate options that describe increased utilisation of existing resources (movement towards the curve, not a shift).
- Select the option that describes an increase in technology or resources.
Step-by-Step Reasoning
Option A: A decrease in mineral resources
Mineral resources are a factor of production (land). A decrease in the quantity of this resource reduces the economy's ability to produce goods. This would cause the PPC to shift inward (to the left), not outward. Therefore, A is incorrect.
Option B: A decrease in prices of consumer goods
A change in the market price of consumer goods affects the demand and supply in that particular market. It does not change the fundamental productive capacity of the economy. The PPC represents potential output based on resources and technology, not price levels. Therefore, B is incorrect.
Option C: An increase in employment
Employment refers to the utilisation of labour. If there was previously unemployment, an increase in employment means more labour is being used. This moves the economy from a point inside the PPC (representing underutilisation of resources) to a point on the existing PPC. It does not change the maximum possible output of the economy, so the curve itself does not shift. Therefore, C is incorrect.
Option D: An increase in technology
Technological progress makes production more efficient. It allows the economy to produce more output from the same amount of resources, or the same output with fewer resources. This increases the economy's productive capacity and causes the PPC to shift outward from PPC1 to PPC2. Therefore, D is correct.
Key Takeaways
- An outward shift of the PPC signifies economic growth and increased productive capacity.
- Causes of outward shifts: more resources, better quality resources (human capital), or better technology.
- A movement from inside the PPC to the curve (e.g., due to higher employment) is not a shift of the curve.
- Price changes do not shift the PPC; they affect market outcomes along the curve.
Common Mistakes
- Confusing a movement towards the PPC with a shift of the PPC: Students often think that increasing employment or reducing unemployment shifts the PPC outward. It does not; it moves the economy from a point inside the curve to a point on the curve. Only an increase in the size of the labour force (quantity) or its quality (education) shifts the curve.
- Confusing price changes with resource changes: A decrease in prices is a market signal, not a change in the economy's capacity to produce.
- Misreading the direction of the shift: A decrease in resources shifts the PPC inward, not outward.
Things to Be Careful About
- The PPC illustrates potential output when resources are fully and efficiently employed. Actual output can be inside the curve (recession/ unemployment) or on the curve (full employment).
- The question asks what could have caused the shift. Technology is a standard cause of outward shifts.
- In multiple-choice questions, eliminate the clearly wrong options first. Options A, B, and C each represent common misconceptions, making D the only viable answer.
D1 and S1 are the initial demand and supply curves in the market for new cars with an equilibrium at X.
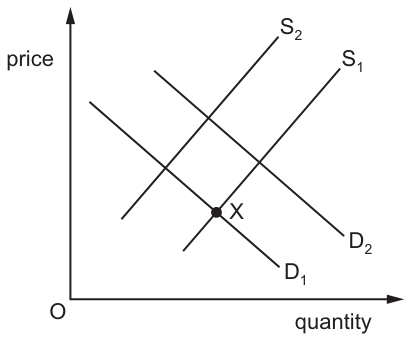
What will cause the demand curve to shift to D2 and the supply curve to shift to S2?
Options
A a decrease in real incomes and a rise in the costs of new car production
B a decrease in the price of petrol and a subsidy on new car production
C an increase in the availability of loans for new car purchases and a specific tax on new cars
D an increase in the price of train travel and an increase in the number of car producers
Reasoning
The diagram shows demand shifting right from D1 to D2 (an increase in demand) and supply shifting left from S1 to S2 (a decrease in supply). We evaluate each option against these shift directions:
- Option A: A decrease in real incomes reduces demand for normal goods like new cars (D shifts left, not right), so this is incorrect.
- Option B: A subsidy on new car production reduces firms' costs, increasing supply (S shifts right, not left), so this is incorrect.
- Option C: Increased availability of loans makes car purchases more affordable, increasing demand (D shifts right). A specific tax on new cars raises production costs, decreasing supply (S shifts left). This matches the diagram.
- Option D: An increase in the number of car producers raises market supply (S shifts right, not left), so this is incorrect.
Answer
C
C
Background Concept
In a market economy, the position of the demand and supply curves is determined by their respective determinants. The demand curve for a good shifts when there is a change in any non-price determinant of demand, such as consumer incomes, prices of related goods (substitutes and complements), availability of credit, tastes and preferences, or population. A rightward shift (from D1 to D2) represents an increase in demand: at every price level, consumers are willing and able to buy a larger quantity of the good. A leftward shift represents a decrease in demand.
The supply curve shifts when there is a change in any non-price determinant of supply, such as input costs, technology, the number of sellers, taxes and subsidies, or expectations. A rightward shift (from S1 to S2) represents an increase in supply: at every price level, producers are willing and able to sell a larger quantity of the good. A leftward shift represents a decrease in supply.
It is critical to distinguish between a shift of the entire curve (caused by non-price factors) and a movement along a fixed curve (caused only by a change in the good's own price).
Understanding the Question
This multiple-choice question presents a demand and supply diagram for the new car market. The initial equilibrium is at point X, where D1 intersects S1. The diagram shows two changes: demand has shifted right to D2 (so demand has increased) and supply has shifted left to S2 (so supply has decreased). The question asks which combination of events would cause both of these shifts to occur simultaneously. Each option pairs a change that affects demand with a change that affects supply, so we need to evaluate whether each pair produces the exact shift directions shown in the diagram.
Approach
To solve this, we will:
- First, confirm the required shift directions from the diagram: demand increases (D1 → D2, rightward shift) and supply decreases (S1 → S2, leftward shift).
- For each option, analyse the effect of the demand-side change on the demand curve, and the effect of the supply-side change on the supply curve.
- Eliminate any option where either shift is in the wrong direction.
- Select the option where both shifts match the diagram.
Step-by-Step Reasoning
Let's evaluate each option in turn:
-
Option A: A decrease in real incomes and a rise in the costs of new car production.
- New cars are a normal good for most consumers, meaning demand rises when real incomes rise and falls when real incomes fall. A decrease in real incomes will reduce consumer demand for new cars, shifting the demand curve left (from D1 towards the left, not right to D2). This does not match the required demand shift.
- A rise in production costs (e.g., higher wages for car factory workers, more expensive steel) makes it less profitable for firms to produce cars at every price level, so supply decreases, shifting the supply curve left (S1 → S2). While this supply shift is correct, the demand shift is wrong, so Option A is eliminated.
-
Option B: A decrease in the price of petrol and a subsidy on new car production.
- Petrol is a complementary good to cars: consumers need petrol to use a car, so a fall in the price of petrol makes car ownership cheaper overall, increasing demand for cars. This would shift demand right (D1 → D2), which matches the required demand shift.
- A subsidy on new car production is a payment from the government to car manufacturers, which lowers their production costs. Lower costs make it more profitable to produce cars at every price level, so supply increases, shifting the supply curve right (from S1 to the right, not left to S2). This supply shift is the opposite of what is required, so Option B is eliminated.
-
Option C: An increase in the availability of loans for new car purchases and a specific tax on new cars.
- Most consumers borrow money to buy new cars, as they are a high-value durable good. An increase in the availability of loans (e.g., lower interest rates, easier credit approval) reduces the cost of borrowing, making car purchases more affordable for more consumers. This increases demand for new cars, shifting the demand curve right (D1 → D2), which matches the required demand shift.
- A specific tax on new cars is a fixed amount of tax charged per car sold. This raises the marginal cost of production for car manufacturers, as they have to pay the tax for each unit they produce. Higher costs make production less profitable at every price level, so supply decreases, shifting the supply curve left (S1 → S2). This matches the required supply shift. Both shifts are correct, so Option C is the right answer.
-
Option D: An increase in the price of train travel and an increase in the number of car producers.
- Train travel is a substitute for car travel for many commuters. If the price of train travel rises, some consumers will switch from trains to cars, increasing demand for cars. This shifts demand right (D1 → D2), which matches the required demand shift.
- An increase in the number of car producers raises the total number of sellers in the market, so total market supply increases. This shifts the supply curve right (from S1 to the right, not left to S2). This supply shift is the opposite of what is required, so Option D is eliminated.
Key Takeaways
- A rightward shift in demand is caused by an increase in a non-price determinant of demand (higher incomes, lower prices of complements, higher prices of substitutes, easier credit, positive changes in tastes, etc.).
- A leftward shift in supply is caused by a decrease in a non-price determinant of supply (higher input costs, taxes, fewer sellers, negative supply shocks, etc.).
- When evaluating multiple-choice questions on curve shifts, always check the direction of each shift first, then match each option's events to those directions.
- Always distinguish between shifts of the entire curve (non-price factors) and movements along the curve (changes in the good's own price).
Common Mistakes
- Confusing complements and substitutes: for example, thinking a fall in petrol price would decrease demand for cars, when in fact petrol is a complement so lower petrol prices increase car demand.
- Confusing the effect of taxes and subsidies on supply: a tax raises production costs and shifts supply left, while a subsidy lowers costs and shifts supply right. Students often mix these up.
- Forgetting that new cars are a normal good: a fall in real incomes reduces demand, not increases it.
- Confusing a shift in supply with a movement along supply: an increase in the number of sellers shifts the entire supply curve, it does not cause a movement along the existing curve.
Things to Be Careful About
- Always check the direction of the shifts in the diagram first before evaluating options: in this case, D shifts right, S shifts left.
- For goods that are inferior (not normal), a fall in real incomes would increase demand, but new cars are almost universally a normal good, so the standard assumption applies unless stated otherwise.
- A specific tax is a per-unit tax, which shifts supply left by the amount of the tax; an ad valorem tax (a percentage of price) also shifts supply left, but the effect is different at different price levels. For this question, any tax on production will shift supply left.
- Credit availability is a key determinant of demand for high-value durable goods like cars, as most consumers cannot pay the full price upfront.
When can a product be said to have a negative income elasticity of demand?
Options
A When it is a luxury good.
B When it is a necessity good.
C When it is a normal good.
D When it is an inferior good.
Reasoning
Income elasticity of demand (YED) measures the responsiveness of quantity demanded to a change in income. A negative YED means that as income rises, demand falls — the good is an inferior good.
Answer
D
D
Background Concept
Income elasticity of demand (YED) is defined as:
YED = (% change in quantity demanded) / (% change in income)
The sign of YED tells us how a good responds to changes in income:
- Positive YED: demand rises when income rises — these are normal goods.
- Negative YED: demand falls when income rises — these are inferior goods.
Within normal goods, a YED between 0 and 1 indicates a necessity (demand rises less than proportionately), while a YED greater than 1 indicates a luxury (demand rises more than proportionately).
Understanding the Question
The question asks: "When can a product be said to have a negative income elasticity of demand?" This is a pure recall question — you need to know which category of good is defined by a negative YED. The four options are: luxury, necessity, normal, and inferior. Only one of these has a negative YED.
Approach
Recall the classification of goods by YED sign:
- Inferior good: YED < 0
- Normal good: YED > 0
- Necessity: 0 < YED < 1
- Luxury: YED > 1
Match the correct category to the question.
Step-by-Step Reasoning
- Income elasticity of demand (YED) is defined as the percentage change in quantity demanded divided by the percentage change in income.
- A negative YED means that when income increases, quantity demanded decreases (and vice versa).
- This describes an inferior good — a good for which demand falls as consumers' incomes rise, because they switch to higher-quality substitutes.
- The other options are incorrect:
- A (luxury good): YED > 1 (positive, and elastic with respect to income).
- B (necessity good): 0 < YED < 1 (positive, but inelastic with respect to income).
- C (normal good): YED > 0 (positive; includes both necessities and luxuries).
- Therefore, the correct answer is D.
Key Takeaways
- The sign of YED is the primary way to distinguish inferior goods (negative YED) from normal goods (positive YED).
- Within normal goods, the magnitude of YED distinguishes necessities (0 < YED < 1) from luxuries (YED > 1).
- This is a fundamental classification tested frequently in multiple-choice questions.
Common Mistakes
- Confusing inferior goods with necessities: a necessity is a type of normal good (positive YED), not an inferior good.
- Thinking that "inferior" means low quality — it means demand falls when income rises, regardless of quality.
- Forgetting that luxury goods have a positive YED greater than 1, not a negative one.
Things to Be Careful About
- The question asks specifically about a negative YED — do not confuse this with a YED between 0 and 1 (necessity) or greater than 1 (luxury).
- Remember that "normal good" is the umbrella term for all goods with positive YED; it is not a separate category from necessities and luxuries in this context.
The diagram shows the short-run supply curve (SSR) and long-run supply curve (SLR) for a bakery.
The price of a loaf of bread increases from $2.00 to $2.20.
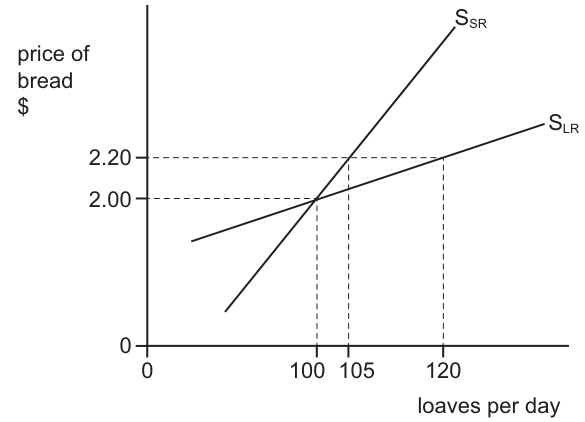
What is the bakery’s price elasticity of supply (PES) in the short run and in the long run when the price of a loaf of bread increases?
Options
| short run | long run | |
|---|---|---|
| A | 0.5 | 2.0 |
| B | 0.5 | 1.4 |
| C | 2.0 | 0.7 |
| D | 2.0 | 0.5 |
Working
Price elasticity of supply (PES) is calculated as:
PES = % change in quantity supplied / % change in price
Short run:
% change in quantity = (105 - 100) / 100 = 5%
% change in price = ($2.20 - $2.00) / $2.00 = 10%
PES = 5% / 10% = 0.5
Long run:
% change in quantity = (120 - 100) / 100 = 20%
% change in price = 10%
PES = 20% / 10% = 2.0
Answer
A
A
Background Concept
Price elasticity of supply (PES) measures the responsiveness of the quantity supplied of a good to a change in its price. It is calculated as the percentage change in quantity supplied divided by the percentage change in price:
PES = (% change in quantity supplied) / (% change in price)
PES values are always positive because the supply curve slopes upward. A PES greater than 1 is described as price elastic, meaning suppliers can respond quickly and substantially to price changes. A PES less than 1 is price inelastic, meaning supply is relatively unresponsive. A PES equal to 1 is unit elastic.
Supply is generally more elastic in the long run than in the short run because firms have more time to adjust their production. In the short run, firms face fixed factors of production (such as factory size or the number of machines) and cannot easily change output. In the long run, all factors are variable: firms can build new factories, hire more workers, or new firms can enter the market, making supply more responsive to price changes.
Understanding the Question
The question presents a diagram showing two supply curves for a bakery: the short-run supply curve (SSR) and the long-run supply curve (SLR). Both curves start at an equilibrium price of $2.00 and quantity of 100 loaves per day. The price then rises to $2.20. The question asks for the price elasticity of supply in the short run and in the long run given this price change.
From the diagram:
- Short run: quantity moves from 100 to 105 loaves
- Long run: quantity moves from 100 to 120 loaves
- Price change: from $2.00 to $2.20
The command word is implicit (calculation), and the task is to apply the PES formula to both time periods and select the correct pair of values from the options provided.
Approach
To solve this, apply the PES formula to both the short-run and long-run data points. Calculate the percentage change in quantity supplied and the percentage change in price for each curve. Since the price change is the same in both cases, the denominator will be identical, and the difference in PES will come entirely from the different percentage changes in quantity. Compare the calculated values to the options provided.
Step-by-Step Reasoning
-
Calculate the percentage change in price:
% change in price = (New price - Old price) / Old price × 100
= ($2.20 - $2.00) / $2.00 × 100
= $0.20 / $2.00 × 100
= 0.10 × 100 = 10% -
Short-run PES:
% change in quantity = (105 - 100) / 100 × 100 = 5%
PES = 5% / 10% = 0.5
This indicates short-run supply is price inelastic, which makes sense because bakeries cannot easily expand output immediately in the short run due to fixed capacity constraints. -
Long-run PES:
% change in quantity = (120 - 100) / 100 × 100 = 20%
PES = 20% / 10% = 2.0
This indicates long-run supply is price elastic, reflecting that over time the bakery can adjust all factors of production and increase output significantly in response to the higher price. -
Match to options: Short run = 0.5, Long run = 2.0 corresponds to option A.
Key Takeaways
- PES is always positive and calculated as %ΔQs / %ΔP.
- Supply is generally more elastic in the long run than the short run because all factors become variable and firms have time to enter or exit the industry.
- A PES of 0.5 is inelastic; a PES of 2.0 is elastic.
- When calculating percentage changes, always use the original value as the denominator.
Common Mistakes
- Using the wrong base for percentage change (e.g., using the new quantity instead of the original quantity).
- Confusing PES with price elasticity of demand (PED), which can be negative.
- Mixing up the short-run and long-run values when reading the diagram.
- Forgetting that PES is always positive and therefore ignoring the sign.
Things to Be Careful About
- Ensure you read the correct quantities from the diagram for each supply curve at the new price.
- The percentage change formula requires the original value in the denominator, not the average of old and new values (though the midpoint method is sometimes used, the standard A Level approach uses the original value unless specified otherwise).
- Check that the units are consistent (both quantities are in loaves per day, price in dollars).
- Verify that the calculated values match one of the options exactly before selecting.
An increase in which variable will always lead to an increase in the consumer surplus?
Options
A cost of production
B maximum price
C minimum price
D subsidy
Reasoning
Consumer surplus is the difference between what consumers are willing to pay (the demand curve) and the price they actually pay.
Option A: cost of production - An increase in cost of production shifts the supply curve leftwards, raising the equilibrium price and reducing the quantity sold. This reduces consumer surplus.
Option B: maximum price - A maximum price (price ceiling) set below the equilibrium price lowers the price for consumers who can purchase, but it reduces the quantity supplied, creating a shortage. While some consumers gain from the lower price, others are unable to buy at all, so overall consumer surplus may not increase; it could even fall. Hence, a maximum price does not always increase consumer surplus.
Option C: minimum price - A minimum price (price floor) set above the equilibrium price raises the market price and reduces the quantity demanded. This unambiguously reduces consumer surplus.
Option D: subsidy - A subsidy to producers shifts the supply curve downwards (to the right), lowering the equilibrium price and increasing the equilibrium quantity. This increases consumer surplus because consumers pay a lower price and can purchase more units. As long as the demand curve slopes downward (the usual case), the reduction in price and the expansion of quantity both contribute to a larger consumer surplus. Therefore, a subsidy always leads to an increase in consumer surplus.
Answer
D
D
Background Concept
Consumer surplus is the extra benefit consumers receive when they pay less than the maximum price they are willing to pay. Graphically, it is the area between the demand curve and the equilibrium price line, up to the quantity traded. Anything that reduces the market price or increases the quantity traded (while price does not rise) tends to increase consumer surplus.
Understanding the Question
The question asks: 'An increase in which variable will always lead to an increase in the consumer surplus?' The word 'always' is crucial - we must find the variable whose increase cannot reduce consumer surplus under any standard circumstances. The four options are: cost of production, maximum price, minimum price, and subsidy. Each affects either supply (cost, subsidy) or imposes a price control (max, min).
Approach
Consider each option in turn:
- Cost of production increases shift supply left, raising price and lowering quantity - these both reduce consumer surplus.
- A maximum price (price ceiling) below equilibrium creates a shortage; some consumers benefit from a lower price, but others are excluded. The net effect on total consumer surplus is ambiguous and can be negative, so it is not 'always' an increase.
- A minimum price (price floor) above equilibrium raises price and reduces quantity - both reduce consumer surplus.
- A subsidy shifts supply down/right, lowering equilibrium price and raising quantity. Both changes increase consumer surplus, given a normal downward-sloping demand curve. Even in extreme cases such as perfectly inelastic supply, the price to consumers falls and consumer surplus rises. Only in the theoretical case of perfectly elastic demand (horizontal demand curve) does consumer surplus stay constant (zero), but this is a limiting case and a subsidy would not change the price; however, consumer surplus does not fall. In practice, the subsidy always either increases or leaves unchanged consumer surplus, making it the only option that never reduces consumer surplus. Hence, it is the correct answer.
Step-by-Step Reasoning
- Consumer surplus = area between demand curve and market price.
- Cost of production (A): An increase in costs shifts the supply curve leftwards. This results in a higher equilibrium price and a lower equilibrium quantity. Higher price reduces the surplus of existing buyers; lower quantity eliminates surplus from units no longer traded. Both effects reduce consumer surplus. So A is wrong.
- Maximum price (B): A binding maximum price is set below the free-market equilibrium. The price falls, which by itself increases the surplus of those who buy. However, the lower price reduces the quantity supplied, causing a shortage. Consumers who are unable to buy lose the surplus they would have enjoyed. The net change in total consumer surplus depends on the elasticities of demand and supply; it could be positive or negative. Therefore, a maximum price does not always increase consumer surplus. B is wrong.
- Minimum price (C): A binding minimum price is set above the free-market equilibrium. The price rises, reducing consumer surplus for existing buyers. The quantity demanded falls, further reducing consumer surplus. The combined effect is a clear reduction. C is wrong.
- Subsidy (D): A per-unit subsidy reduces the marginal cost of production, shifting the supply curve downwards by the amount of the subsidy. The new equilibrium has a lower price and a larger quantity. The fall in price increases consumer surplus for all units previously bought (the area above the new price and below the original price). The increase in quantity adds more consumer surplus from the new units (the area between the demand curve and the new price over the additional quantity). This extra surplus exists as long as the demand curve slopes downward. Even if supply is perfectly inelastic, the price falls by the full subsidy and consumer surplus rises. The only scenario where consumer surplus does not increase is if demand is perfectly elastic (the price is fixed by world markets), but even then the subsidy does not reduce consumer surplus. Hence, a subsidy always leads to either an increase or no change in consumer surplus - and, in the usual case, an unambiguous increase. Therefore D is correct.
Key Takeaways
- An increase in consumer surplus can come from a lower price or a greater quantity or both.
- Price controls (maximum and minimum prices) have ambiguous or negative effects on consumer surplus because they also affect the quantity traded.
- A subsidy consistently lowers the price to consumers and expands the market, so it is a reliable way to increase consumer surplus.
- The word 'always' demands checking for edge cases; the only option that never reduces consumer surplus is the subsidy.
Common Mistakes
- Assuming a maximum price always benefits consumers: it benefits some but hurts others through shortages, so total consumer surplus may fall.
- Confusing producer surplus with consumer surplus: a minimum price may increase producer surplus but reduces consumer surplus.
- Overlooking the quantity effect: changes in consumer surplus depend on both price and quantity changes, not only price.
- Thinking that a subsidy only affects producers: the incidence falls partly on consumers, making them better off.
Things to Be Careful About
- The term 'always': even if a variable usually increases consumer surplus, it must do so in all reasonable cases. The subsidy is the only option that meets this standard.
- When analysing a maximum price, remember that the shortage reduces the number of transactions, and the lost surplus from those missing trades can outweigh the gain from the lower price.
- When comparing subsidy with cost of production, note that both shift the supply curve but in opposite directions; a cost increase reduces consumer surplus, a subsidy increases it.
- Diagrams can help: drawing supply and demand for each case clarifies the consumer surplus areas. (This is not required for the MCQ, but it is a useful revision technique.)
Farmers want to extract wild honey from beehives. They find the beehives by following birds known as honeyguide birds who want the beeswax that is also found in the beehives.
What does this suggest?
Options
A Farmers and honeyguide birds are rival consumers.
B Wild honey and beeswax are free goods.
C Wild honey and beeswax are in joint supply.
D Wild honey is the opportunity cost of beeswax.
Answer
The scenario describes two goods, wild honey and beeswax, that are obtained together from the same beehive. This is a classic example of joint supply, where an increase in the production of one good leads to an increase in the supply of the other. Therefore, option C is correct.
Answer
C
C
Background Concept
Joint supply occurs when two or more goods are produced together from a single production process. For example, when a farmer raises cattle, both beef and leather are produced jointly. Similarly, harvesting a beehive yields both honey and beeswax. The supply of the two goods is linked: a change in the demand for one will affect the supply of the other.
Understanding the Question
The question presents a real-world scenario: farmers use honeyguide birds to locate beehives. The farmers want the honey; the birds want the beeswax. The key is to identify the economic relationship between honey and beeswax. The correct answer is that they are in joint supply because they come from the same source (the beehive).
Approach
To answer, we must recognise the definition of joint supply and compare it to the other options. Option A (rival consumers) is about two agents wanting the same good, but here they want different products. Option B (free goods) is incorrect because both honey and beeswax are scarce and require effort to obtain. Option D (opportunity cost) is a concept of choice, not production relationship.
Step-by-Step Reasoning
- Identify the source: The beehive contains both honey and beeswax. To obtain honey, you must also extract beeswax (and vice versa). They are produced together, not separately.
- This matches the definition of joint supply: two goods produced from the same process.
- Eliminate other options:
- A: Rival consumers compete for the same good. Here, farmers and birds want different goods, so they are not rivals.
- B: Free goods are abundant and have zero opportunity cost. Both honey and beeswax are economic goods because they are scarce (limited supply) and require effort to collect.
- D: Opportunity cost is the value of the next best alternative forgone when a choice is made. The question asks about the relationship between the two goods, not a choice between them.
Thus, only option C fits.
Key Takeaways
- Joint supply explains how goods produced together are linked on the supply side.
- Recognising joint supply helps predict how changes in demand for one product affect the supply and price of the other.
- Be careful not to confuse joint supply with joint demand (goods consumed together, like cars and petrol) or derived demand (demand for a factor of production derived from demand for the final good).
Common Mistakes
- Confusing joint supply with joint demand: students might think honey and beeswax are consumed together, but they are not; they are produced together.
- Thinking that the birds and farmers are rival consumers because they both want something from the beehive, but they want different products, so they are not rivals.
- Assuming that because honey and beeswax are natural products, they are free goods, ignoring the scarcity and effort involved in extraction.
Things to Be Careful About
- The question asks what the scenario suggests about the goods, not about the agents. Focus on the economic relationship between honey and beeswax.
- Joint supply is a supply-side concept; think about production, not consumption.
- Always refer to the definitions of each term to eliminate wrong answers.
An indirect tax is imposed on good X.
Which situation is most likely to result in producers bearing a higher burden of the tax?
Options
A price elasticity of demand is elastic
B price elasticity of demand is inelastic
C price elasticity of supply is elastic
D price elasticity of supply is inelastic
Reasoning
When an indirect tax is imposed, the burden on producers depends on the relative elasticities of demand and supply. The more inelastic side bears a larger share of the tax. If price elasticity of demand (PED) is elastic, consumers are highly responsive to price increases, so they reduce quantity demanded significantly. This forces producers to absorb a larger portion of the tax to avoid losing too many sales. Therefore, producers bear a higher burden when PED is elastic.
Option A is correct. Options B, C, and D are incorrect: B (inelastic demand) would shift the burden to consumers; C (elastic supply) would allow producers to shift the burden to consumers; D (inelastic supply) would also increase producer burden, but the question asks for the situation most likely to result in producers bearing a higher burden, and elastic demand is a more direct and common scenario for higher producer burden.
Answer
A
A
Background Concept
Tax incidence refers to the distribution of the burden of a tax between buyers and sellers. When an indirect tax (e.g., a specific tax per unit) is imposed on a good, the immediate effect is that the supply curve shifts vertically upward by the amount of the tax. The new equilibrium price and quantity depend on the elasticities of demand and supply. The key principle is: the side of the market (consumers or producers) that is more inelastic bears a larger share of the tax. This is because the more inelastic side is less able to adjust its behaviour in response to the price change, so it absorbs more of the tax.
Price elasticity of demand (PED) measures the responsiveness of quantity demanded to a change in price. If demand is elastic (|PED| > 1), consumers are sensitive to price changes and will reduce quantity demanded significantly if price rises. If demand is inelastic (|PED| < 1), consumers are less sensitive and will reduce quantity demanded only slightly.
Price elasticity of supply (PES) measures the responsiveness of quantity supplied to a change in price. If supply is elastic (PES > 1), producers can easily adjust output in response to price changes. If supply is inelastic (PES < 1), producers cannot easily adjust output.
Understanding the Question
The question asks: "An indirect tax is imposed on good X. Which situation is most likely to result in producers bearing a higher burden of the tax?" The options are four different elasticity conditions: (A) PED elastic, (B) PED inelastic, (C) PES elastic, (D) PES inelastic. The correct answer is (A). The question is testing the understanding that when demand is elastic, producers bear a larger share of the tax because consumers are responsive and will reduce purchases, forcing producers to absorb the tax to maintain sales. The other options either shift the burden to consumers (B, C) or are less likely to lead to a higher producer burden compared to elastic demand (D is also a situation where producers bear more, but the question specifies "most likely", and A is the standard answer).
Approach
To determine the correct answer, recall the rule: the more inelastic side bears more of the tax. Evaluate each option:
- Option A (PED elastic): Demand is elastic, so consumers are responsive. The tax causes a relatively large decrease in quantity demanded, so producers cannot pass the tax on to consumers. Producers bear a larger share.
- Option B (PED inelastic): Demand is inelastic, so consumers are less responsive. They will pay a higher price, so consumers bear a larger share, and producers bear less.
- Option C (PES elastic): Supply is elastic, so producers can easily adjust output. They can shift the tax burden to consumers by reducing supply, so consumers bear more.
- Option D (PES inelastic): Supply is inelastic, so producers cannot easily adjust output. They are forced to absorb the tax, so producers bear more. However, the question asks for the situation "most likely" to result in a higher burden for producers. Between A and D, which is more likely? The standard textbook answer is that when demand is elastic, the producer burden is highest. This is a common MCQ question from CIE, and the correct answer is A. The reasoning is that if demand is elastic, the consumer response is strong, so the producer must bear almost the entire tax. If supply is inelastic but demand is also something, the burden could be shared. Since the question does not specify the other elasticity, the most direct answer is A.
Step-by-Step Reasoning
- Identify the rule: The burden of a tax falls more heavily on the side of the market that is less elastic.
- Evaluate each option:
- Option A (PED elastic): Demand is elastic → consumers are very responsive. When the tax is imposed, the supply curve shifts up. The new equilibrium price rises only slightly (because consumers cut back sharply), so the price consumers pay is close to the original price, meaning producers receive a much lower after-tax price. Thus, producers bear most of the tax. This is a high producer burden.
- Option B (PED inelastic): Demand is inelastic → consumers are not very responsive. The tax leads to a large rise in price, so consumers pay most of the tax. Producers bear a small share.
- Option C (PES elastic): Supply is elastic → producers can easily reduce output. They will cut back production, forcing the price up, so consumers bear most of the tax. Producers bear little.
- Option D (PES inelastic): Supply is inelastic → producers cannot easily reduce output. They must absorb the tax, so they bear a larger share. However, the question asks for the situation "most likely" to result in a higher burden. In many contexts, when demand is elastic, the producer burden is extreme. This is a standard result in economics: the more elastic demand is, the greater the producer burden. The question likely expects A as the answer because it is the condition that unambiguously gives a high producer burden, whereas D can also give a high producer burden but may depend on the elasticity of demand. Given the typical multiple-choice question, A is the correct answer.
Key Takeaways
- Tax incidence is determined by the relative elasticities of demand and supply.
- The more inelastic side bears a larger share of the tax.
- When demand is elastic, the burden falls heavily on producers.
- When demand is inelastic, the burden falls heavily on consumers.
- When supply is elastic, the burden falls heavily on consumers.
- When supply is inelastic, the burden falls heavily on producers.
- This principle is crucial for understanding the impact of taxes on market outcomes.
Common Mistakes
- Confusing the direction: some students think that if demand is elastic, consumers bear more because they are responsive. Actually, responsiveness means they can avoid the tax, so producers bear more.
- Thinking that if supply is inelastic, producers bear more, but forgetting that the question asks for the situation most likely to result in a higher burden. In this question, the correct answer is A, not D, because A is the condition that clearly gives a high producer burden in the standard analysis.
- Not considering the relative elasticities: the burden depends on both sides, but the question only gives one elasticity; the other side is assumed to be typical. The standard answer is A.
Things to Be Careful About
- Always remember the rule: the more inelastic side bears more of the tax.
- In multiple-choice questions, read the options carefully and apply the rule directly.
- Do not overthink: the question is testing the basic principle. The correct answer is A.
- If the question had both PED and PES conditions, the analysis would be more complex. Here, each option is a single condition, so the simplest application of the rule suffices.
What would not be included in the calculation of an individual’s wealth?
Options
A the house owned by the individual
B the savings in the individual’s bank account
C the stocks and shares owned by the individual
D the wages earned by the individual
Answer
Wealth is a stock of assets owned at a point in time. Wages are a flow of income earned over a period, not a stock of assets. Therefore, wages would not be included in the calculation of an individual's wealth.
Answer
D
D
Background Concept
In economics, wealth is a stock concept — it measures the value of all assets owned by an individual, firm, or country at a single point in time. Assets include physical items (houses, land, cars) and financial assets (cash, bank deposits, stocks, bonds, pension funds). Income, by contrast, is a flow concept — it measures the earnings received over a period of time (wages, rent, interest, profit). The distinction is like the difference between the water in a bathtub (stock) and the water flowing from the tap (flow).
Understanding the Question
The question asks which of the four options would not be included in calculating an individual's wealth. It tests whether you can separate assets (stock) from income (flow). Options A, B, and C are all assets that an individual owns at a given moment. Option D is wages — a payment for labour services received over a period, not an asset owned at a point in time.
Approach
Identify each option as either a stock (asset) or a flow (income). The one that is a flow is the correct answer.
Step-by-Step Reasoning
- Option A: the house owned by the individual — A house is a physical asset. It has a market value and is owned at a point in time. This is part of wealth. (Exclude.)
- Option B: the savings in the individual’s bank account — A bank deposit is a financial asset. It is a stock of money owned at a point in time. This is part of wealth. (Exclude.)
- Option C: the stocks and shares owned by the individual — Stocks and shares are financial assets representing ownership in companies. They have a market value at a point in time. This is part of wealth. (Exclude.)
- Option D: the wages earned by the individual — Wages are a payment for labour. They are earned over a period (e.g., per week or per month). They are a flow of income, not a stock of assets. Therefore, wages are not included in the calculation of wealth. (Correct answer.)
Key Takeaways
- Wealth is a stock; income is a flow.
- To decide whether something is part of wealth, ask: “Is this an asset owned at a point in time?” If yes, it is wealth. If it is a payment received over time, it is income.
- This distinction is fundamental in economics and appears in many contexts (national income vs. national wealth, balance sheets vs. income statements).
Common Mistakes
- Confusing income with wealth: thinking that a high salary automatically means high wealth. A person can have high income but low wealth if they spend all they earn and own few assets.
- Including wages in wealth: wages are not an asset; they are a flow. The money from wages, once saved in a bank account, becomes part of wealth, but the wage itself is not.
Things to Be Careful About
- The question asks what would not be included. Read carefully — it is easy to pick the first asset you see if you misread the question.
- Remember that wealth includes both physical and financial assets. Savings accounts and stocks are financial assets, so they count as wealth.
Why might governments provide free education for children aged 4 to 16 years old?
Options
A Consumers are not fully aware of the benefits of education.
B Education in a free market system would be over consumed.
C Education is a public good and there would be many free riders.
D The private costs of education exceed the private benefits in a free market.
Reasoning
Education is a merit good — a good that is under-consumed in a free market because consumers have imperfect information about the full private benefits it provides. The government intervenes by making education free (compulsory up to a certain age) to correct this under-consumption and ensure a socially optimal level is reached. Option A correctly identifies this: consumers are not fully aware of the benefits.
Answer
A
A
Background Concept
Education is a classic example of a merit good. Merit goods are goods or services that society deems desirable for everyone to have, but which tend to be under-consumed if left to the free market. The primary reason for this under-consumption is imperfect information: consumers may not fully understand the long-term private benefits of the good (for example, the higher lifetime earnings, better health outcomes, and personal development that result from education). Because individuals may underestimate these benefits, they demand less education than is socially optimal, creating a market failure. Governments therefore intervene – often by providing education free of charge and making it compulsory – to raise consumption to the socially desired level.
Understanding the Question
The question asks why governments provide free education for children aged 4 to 16. This is a multiple-choice question based on economic theory. You need to identify which option correctly describes the underlying market failure that the government policy aims to correct. Read each option carefully – they all sound plausible but only one correctly matches the economic definition of a merit good.
Approach
Start by recalling the standard classification of goods. Education is a merit good, not a public good. Next, recall the central market failure associated with merit goods: under-consumption caused by imperfect information. The government provides it free precisely to correct this under-consumption. Then test each option against this framework, eliminating those that describe the wrong good type (public good) or the wrong market failure (over-consumption, wrong cost comparison).
Step-by-Step Reasoning
- Option A: "Consumers are not fully aware of the benefits of education." This is the textbook definition of the merit good market failure. Because parents and children may not appreciate the full long-term value of education (higher future income, better life chances, personal fulfilment), they would under-consume it if it were priced. Providing it free removes the price barrier and, combined with compulsory attendance, forces consumption up to the socially optimal level. This option is correct.
- Option B: "Education in a free market system would be over consumed." This describes a demerit good (like cigarettes or alcohol), where imperfect information leads to over-consumption. Education is a merit good; it is under-consumed. Therefore, option B is incorrect.
- Option C: "Education is a public good and there would be many free riders." A public good has two key characteristics: non-rivalry (one person's consumption does not reduce availability for others) and non-excludability (it is impossible to prevent people who haven't paid from consuming it). Education is rivalrous (a full classroom limits places) and excludable (a school can refuse entry to non-paying students). Therefore, education is a private good (or a quasi-public good, but not a pure public good) and the free-rider problem is not the primary rationale for government provision. Option C is incorrect.
- Option D: "The private costs of education exceed the private benefits in a free market." This statement is generally false for the individual. For most people, the private benefits of education (e.g., higher lifetime earnings, improved personal skills) exceed the private costs (e.g., fees, time, forgone earnings). The market failure is that consumers underestimate these private benefits, not that the actual benefits are lower than the costs. Option D is therefore incorrect.
Key Takeaways
- Understand the difference between a merit good (under-consumed due to imperfect information) and a public good (non-rival and non-excludable, leading to a free-rider problem).
- For merit goods, the government intervenes to correct under-consumption; for demerit goods, the government intervenes to correct over-consumption.
- Imperfect information is the core reason why consumers under-consume merit goods.
- Free provision (often combined with compulsion) is a policy tool to address this specific market failure.
Common Mistakes
- Confusing merit goods with public goods. Public goods are non-rival and non-excludable; merit goods are rival and excludable but under-consumed due to imperfect information.
- Reversing the direction of consumption: thinking education would be over-consumed rather than under-consumed without government intervention. This is the demerit good error.
- Thinking that education is provided free because the social costs exceed the private costs. The motivation is to increase consumption to the socially optimal level, not to reduce it.
Things to Be Careful About
- In multiple-choice questions on market failure, identify the exact type of good first (private, public, merit, demerit) and then match the correct market failure (under-consumption/over-consumption/free-rider) to the options.
- Read each option precisely. Option A says "not fully aware of the benefits" – this is the specific language of imperfect information for a merit good.
- Remember that government intervention for merit goods is about increasing consumption to the socially optimal level, not reducing it or correcting a public good problem.
The diagram shows the demand and supply for rice.
The market for rice is initially in equilibrium at a price of P1. The government introduces a maximum price of Pmax. At the same time the supply of rice increases.
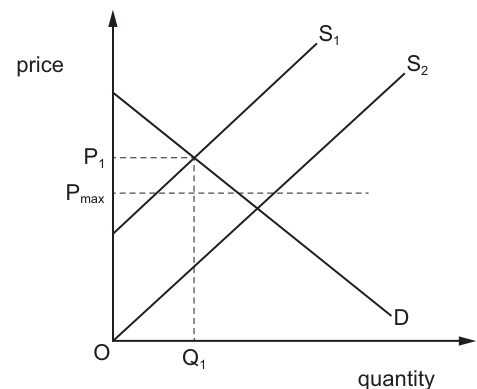
What is the impact of these changes on the market for rice?
Options
A A new market equilibrium will be established.
B An illegal market for rice will develop.
C There will be a shortage of rice.
D There will be a surplus of rice.
Reasoning
A maximum price (price ceiling) set below the initial equilibrium price P1 is binding, creating a shortage at P1 as quantity demanded exceeds quantity supplied. The increase in rice supply shifts the supply curve right from S1 to S2. The diagram shows that the new supply curve S2 intersects the demand curve D exactly at the maximum price Pmax, meaning quantity supplied now equals quantity demanded at Pmax. The market therefore clears at Pmax, with no excess demand or supply, so a new market equilibrium is established at this price and the higher quantity corresponding to the S2-D intersection.
Answer
A
A
Background Concept
Market equilibrium occurs where the quantity of a good demanded by consumers equals the quantity supplied by producers, so there is no tendency for the market price to change. A maximum price (price ceiling) is a government-imposed legal upper limit on the price of a good. If the maximum price is set below the free-market equilibrium price, it is binding: the market cannot reach its original equilibrium, and at the maximum price, quantity demanded exceeds quantity supplied, creating a shortage. An increase in the supply of a good is represented by a rightward shift of the supply curve, caused by factors such as lower production costs, improved technology, or an increase in the number of sellers. This shift raises the equilibrium quantity and lowers the equilibrium price, ceteris paribus.
Understanding the Question
The question provides a demand and supply diagram for rice, with an initial equilibrium at price P1 and quantity Q1 (where supply curve S1 meets demand curve D). Two changes occur simultaneously: the government introduces a maximum price Pmax, which is below P1, making it a binding price ceiling; and the supply of rice increases, shifting the supply curve right to S2. The question asks for the overall impact of these two changes on the rice market. The key detail in the diagram is that the new supply curve S2 intersects the demand curve D exactly at the price level Pmax. You must apply knowledge of price controls and supply shifts to this specific diagram to select the correct outcome from the four options.
Approach
First, recall the effect of a binding maximum price in isolation: it creates a shortage because quantity demanded is higher than quantity supplied at the controlled price. Second, recall the effect of an increase in supply in isolation: it shifts the supply curve right, lowering the equilibrium price and raising the equilibrium quantity. Third, combine these two effects using the diagram: check where the new supply curve S2 meets the demand curve, and compare that price to Pmax. If the intersection is at Pmax, the market clears at that price, meaning the price ceiling is no longer binding, and a new equilibrium is established. Evaluate each option against this combined outcome:
- Option A claims a new equilibrium is established: this is correct if the market clears at Pmax.
- Option B claims an illegal market develops: this would only be true if a persistent shortage existed, meaning buyers could not access enough rice at the legal price.
- Option C claims there is a shortage: this would only be true if quantity demanded exceeded quantity supplied at Pmax.
- Option D claims there is a surplus: this would only be true if quantity supplied exceeded quantity demanded at Pmax, which would require the price to be above the equilibrium price.
Step-by-Step Reasoning
- Initial market equilibrium: The original equilibrium is at the intersection of demand curve D and supply curve S1, at price P1 and quantity Q1. At this point, the quantity of rice consumers want to buy exactly equals the quantity producers want to sell, so the market clears with no tendency for price to change.
- Effect of the maximum price Pmax: Pmax is set below P1, so it is a binding price ceiling. At Pmax, the quantity of rice producers are willing to supply (given by S1) is less than the quantity consumers want to buy (given by D). This gap between quantity demanded and quantity supplied is a shortage. Without any other changes, this shortage would persist, and some buyers would be willing to pay more than Pmax to get rice, potentially creating an illegal market.
- Effect of the increase in supply: The supply of rice increases, so the supply curve shifts right from S1 to S2. This means that at every price, producers are now willing to supply more rice than before. The new supply curve S2 intersects the demand curve D at exactly the price Pmax.
- Combined outcome: At Pmax, the quantity of rice supplied (given by S2) now exactly equals the quantity demanded (given by D). There is no excess demand or supply, so the market clears at Pmax. The equilibrium quantity is now higher than Q1, equal to the quantity at the S2-D intersection. Since quantity demanded equals quantity supplied, a new market equilibrium is established at Pmax and this higher quantity. The price ceiling is no longer binding, because the market would naturally settle at Pmax even without government intervention.
- Evaluating the options:
- Option A: Correct. The market now clears at Pmax, so a new equilibrium is established.
- Option B: Incorrect. An illegal market only arises if there is a persistent shortage, which does not exist here because supply has increased enough to meet demand at Pmax.
- Option C: Incorrect. A shortage would require quantity demanded to exceed quantity supplied at Pmax, but the diagram shows they are equal at Pmax, so no shortage exists.
- Option D: Incorrect. A surplus would require quantity supplied to exceed quantity demanded, which would only happen if the price was above the equilibrium price. Pmax is equal to the new equilibrium price, so no surplus exists.
Key Takeaways
- A binding price ceiling (set below equilibrium) creates a shortage by making quantity demanded exceed quantity supplied.
- A rightward shift in the supply curve (increase in supply) lowers the equilibrium price and raises the equilibrium quantity.
- When multiple changes occur simultaneously, you must combine their effects: in this case, the supply increase was large enough to eliminate the shortage caused by the price ceiling, leading to a new equilibrium.
- Always use the specific details of the given diagram (e.g., the exact intersection of S2 and D at Pmax) to confirm your analysis, rather than relying on generic expectations of how price controls work.
Common Mistakes
- Assuming a maximum price always creates a shortage, even when supply changes. The shortage only persists if supply does not increase enough to meet demand at the controlled price.
- Ignoring the supply shift and only considering the effect of the price ceiling, which leads to incorrectly selecting option C (shortage).
- Misinterpreting the diagram: failing to notice that S2 intersects D exactly at Pmax, which is the critical detail showing the market clears.
- Selecting option B (illegal market) by assuming a price ceiling always leads to black markets, without checking if a shortage still exists after the supply change.
- Selecting option D (surplus) by confusing price ceilings with price floors: a surplus is associated with a minimum price set above equilibrium, not a maximum price.
Things to Be Careful About
- Always check if a price control is binding: a maximum price is only binding if it is set below the free-market equilibrium price.
- When assessing the impact of multiple simultaneous changes, trace the effect of each change separately first, then combine them to find the final outcome.
- Use the diagram's exact intersections to verify your analysis: here, the intersection of S2 and D at Pmax is definitive proof that the market clears at that price.
- A new equilibrium is established whenever quantity demanded equals quantity supplied, regardless of whether the price is determined by the market or set by the government.
In the diagram, D is the demand curve of an agricultural commodity and S is the initial supply curve.
The government promises to maintain farmers’ incomes at least at this initial level. The harvests in four subsequent years are shown by supply curves S1–S4.
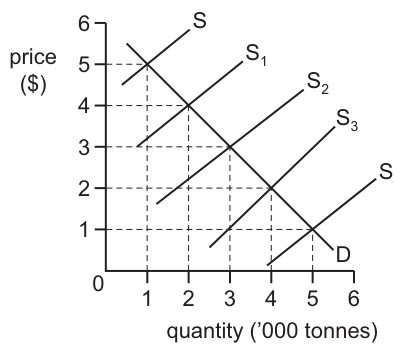
How much in total will the government need to pay to support farmers over the four subsequent years?
Options
A $0
B $3000
C $6000
D $10 000
Working
Initial equilibrium occurs where supply curve S meets demand curve D, at a price of $5 and quantity of 1,000 tonnes. Initial farmer income (total revenue) is 1,000 × $5 = $5,000.
For each subsequent supply curve:
- S1: Equilibrium at Q=2,000 tonnes, P=$4. Total revenue = 2,000 × $4 = $8,000, which is higher than the initial $5,000 → no government payment required.
- S2: Equilibrium at Q=3,000 tonnes, P=$3. Total revenue = 3,000 × $3 = $9,000 ≥ $5,000 → no payment.
- S3: Equilibrium at Q=4,000 tonnes, P=$2. Total revenue = 4,000 × $2 = $8,000 ≥ $5,000 → no payment.
- S4: Equilibrium at Q=5,000 tonnes, P=$1. Total revenue = 5,000 × $1 = $5,000, equal to the initial level → no payment.
Total government payment across the four years = $0 + $0 + $0 + $0 = $0.
Answer
A
A
Background Concept
Market equilibrium is the point where the quantity of a good demanded by consumers equals the quantity supplied by producers, determining the equilibrium market price and quantity. For agricultural goods, supply can shift in the short run due to changes in harvest size: a good harvest increases supply (shifts the supply curve right), while a bad harvest decreases supply (shifts it left). Farmer income is equal to total revenue, calculated as the equilibrium price per unit multiplied by the quantity sold (TR = P × Q). Governments often implement income support policies for farmers to ensure their earnings do not fall below a target level, especially when volatile harvests cause large fluctuations in market revenue.
Understanding the Question
The question provides a demand and supply diagram for an agricultural commodity. The initial supply curve S intersects the demand curve D at the initial equilibrium, which sets the baseline farmer income. Four subsequent supply curves (S1–S4) represent the supply conditions (harvests) in the next four years. The government has promised to keep farmer income at least equal to the initial equilibrium level, so we need to calculate the total government payments required over the four years to top up income where market revenue falls short of the initial level. This is a 1-mark multiple-choice question testing application of equilibrium and revenue concepts.
Approach
To solve this, follow these steps:
- First, locate the initial equilibrium point where the initial supply curve S intersects the demand curve D, and record the equilibrium price (P) and quantity (Q). Calculate initial total revenue as TR_initial = P × Q.
- For each of the four subsequent supply curves (S1 to S4), find the new equilibrium point where the supply curve intersects the demand curve D. Record the new price and quantity for each year.
- Calculate total revenue for each year as TR_year = P_year × Q_year.
- Compare each year's total revenue to TR_initial. If TR_year < TR_initial, the government pays the difference (TR_initial - TR_year); if TR_year ≥ TR_initial, no payment is needed.
- Sum the payments across all four years to get the total government outlay.
Step-by-Step Reasoning
- Initial equilibrium and baseline income: The initial supply curve S intersects the demand curve D at Q = 1 (000 tonnes) and P = $5 per tonne. This is the topmost intersection point on the diagram, marked with a dashed line. Initial total revenue (farmer income) is 1,000 tonnes × $5/tonne = $5,000. This is the target income the government promises to maintain.
- Year 1 (supply S1): S1 is a rightward shift of supply (higher supply, e.g., a better harvest than the initial year). It intersects D at Q = 2 (000 tonnes) and P = $4. Total revenue is 2,000 × $4 = $8,000, which is $3,000 higher than the initial $5,000. Since income is already above the target, no government payment is required.
- Year 2 (supply S2): S2 is a further rightward shift of supply. It intersects D at Q = 3 (000 tonnes) and P = $3. Total revenue is 3,000 × $3 = $9,000, which is $4,000 above the initial level. No payment is needed.
- Year 3 (supply S3): S3 is another rightward shift. It intersects D at Q = 4 (000 tonnes) and P = $2. Total revenue is 4,000 × $2 = $8,000, which is $3,000 above the initial level. No payment is required.
- Year 4 (supply S4): S4 is the furthest rightward shift (the largest harvest). It intersects D at Q = 5 (000 tonnes) and P = $1. Total revenue is 5,000 × $1 = $5,000, which is exactly equal to the initial target income. Since the government only pays to bring income up to the initial level, no payment is needed here.
- Total payment: Adding up the payments for all four years gives $0 + $0 + $0 + $0 = $0. This matches option A.
A key point to note is that for this demand curve, total revenue stays at or above the initial level as supply increases. This is because demand is elastic at higher prices (so when supply falls, price rises and TR falls) and while demand becomes inelastic at lower prices, the lowest TR in the four years is still equal to the initial TR.
Key Takeaways
- Equilibrium price and quantity are always found at the intersection of the demand and supply curves in question.
- Producer income (total revenue) is the product of equilibrium price and quantity, not just the price level. A lower price does not automatically mean lower income if the quantity sold rises sufficiently.
- The effect of a supply shift on total revenue depends on the price elasticity of demand: if demand is elastic, a rightward supply shift (higher supply) raises total revenue; if demand is inelastic, it lowers total revenue.
- Government income support payments are only required when market total revenue falls below the target level; no payment is needed if revenue is at or above the target.
Common Mistakes
- Misidentifying the initial equilibrium: students may incorrectly use the vertical intercept of the supply curve as the initial quantity, rather than finding the intersection of S and D.
- Confusing shifts in supply with movements along the supply curve: each new supply curve creates a new equilibrium, with movement along the fixed demand curve, not a shift in demand.
- Calculating only the price change and ignoring the quantity change: a lower price does not always mean lower farmer income, as the higher quantity sold may offset the price fall.
- Assuming government payments are required for all years without calculating total revenue for each year individually.
Things to Be Careful About
- Always read equilibrium values directly from the intersection of the relevant curves, not from the axes or curve labels alone.
- Check the units on the axes: quantity is measured in 000 tonnes, so multiply by 1,000 for actual tonnes, but since all calculations use consistent units, the comparison of total revenue remains valid.
- The government only pays the difference when market revenue is strictly below the initial target; if revenue is equal to or higher than the target, no payment is required.
- In this specific case, all four years have total revenue at or above the initial level, so the total government outlay is zero, even though the price falls in later years, because the quantity increase compensates for the price drop.
Price stability can be said to occur if the measured value of the consumer prices index (CPI) is unchanged during the year.
Which statement is correct?
Options
A For price stability to occur, there must be no changes in prices of any products.
B For price stability to occur, the number of products whose prices rise must exactly match the number whose prices fall.
C If some prices rise and others fall, there cannot be price stability.
D Different weightings of items used in the calculation of CPI mean that price stability can occur in many ways.
Answer
Price stability means the general price level, as measured by the CPI, is unchanged. The CPI is a weighted average of the prices of a representative basket of goods and services. Different items have different weights reflecting their importance in average household spending. It is possible for some prices to rise and others to fall, and for the weighted average to remain unchanged, achieving price stability. This is exactly what option D describes.
Option A is incorrect because price stability does not require every single price to be unchanged; only the average matters.
Option B is incorrect because the number of products whose prices rise does not need to match the number whose prices fall; what matters is the weighted effect.
Option C is incorrect because, as explained, some prices rising and others falling is consistent with a stable average.
Answer
D
D
Background Concept
Price stability is a macroeconomic objective. It does not mean that no individual price ever changes — that would be impossible in a dynamic market economy. Instead, it means that the general or average price level is not changing significantly over time. The most common measure of the price level is the Consumer Prices Index (CPI). The CPI is constructed by taking a representative basket of goods and services that a typical household buys, recording their prices each month, and calculating a weighted average. The weight of each item reflects its share of total household expenditure. Items with a larger share (e.g., housing, food) have a bigger influence on the index than items with a smaller share (e.g., cinema tickets).
Understanding the Question
The question asks which statement about price stability is correct. The stem defines price stability as occurring when the measured value of the CPI is unchanged during the year. The four options test whether the candidate understands that this is an average condition, not a condition on every individual price. The correct answer must recognise the role of weighting in the CPI.
Approach
Read each option carefully and evaluate it against the definition of the CPI as a weighted average. The key insight is that the CPI can be unchanged even when many individual prices change, as long as the weighted sum of price changes is zero. The weighting is the crucial mechanism that makes this possible.
Step-by-Step Reasoning
-
Option A says: "For price stability to occur, there must be no changes in prices of any products." This is false. The CPI is an average; individual prices can and do change constantly. Price stability only requires the average to be stable.
-
Option B says: "For price stability to occur, the number of products whose prices rise must exactly match the number whose prices fall." This is also false. The CPI is a weighted average, not a simple count. A large price rise in a heavily weighted item (e.g., petrol) could offset many small price falls in lightly weighted items (e.g., pencils), or vice versa. The number of items changing is irrelevant; what matters is the size of the change multiplied by the weight.
-
Option C says: "If some prices rise and others fall, there cannot be price stability." This is false for the same reason. A rise in some prices and a fall in others is exactly how the average can remain unchanged.
-
Option D says: "Different weightings of items used in the calculation of CPI mean that price stability can occur in many ways." This is correct. Because items have different weights, there are infinitely many combinations of individual price changes that would leave the weighted average unchanged. For example, a 10% rise in a 20%-weighted item (+2% contribution) could be exactly offset by a 5% fall in a 40%-weighted item (-2% contribution), with all other prices unchanged. The weighted average is unchanged, so price stability occurs.
Key Takeaways
- Price stability is about the average price level, not individual prices.
- The CPI is a weighted average; weights reflect expenditure shares.
- A stable CPI is consistent with many individual prices rising and falling.
- The number of items changing is not relevant; the weighted magnitude of changes is what matters.
Common Mistakes
- Mistaking price stability for zero inflation of every single price. This is a very common error.
- Thinking that a simple majority of price rises or falls determines the direction of the index, ignoring weights.
- Assuming that any price change at all means there cannot be stability.
Things to Be Careful About
- Always remember that the CPI is a weighted index. The weight of each item is crucial.
- The question is about the measured value of the CPI being unchanged. This is the definition of price stability in this context.
- Do not confuse price stability (zero inflation) with low inflation. The question specifically says "unchanged".
Based on the circular flow of income, which condition is necessary for an open economy to be in equilibrium?
Options
A Government investment is equal to private investment.
B Planned injections are equal to planned withdrawals.
C Spending by households is equal to taxes collected by government.
D Value of export earnings is equal to expenditure on imports.
Answer
In the circular flow of income, equilibrium occurs when total planned injections into the circular flow equal total planned withdrawals (leakages) from it. In an open economy, injections are investment (I), government spending (G), and exports (X); withdrawals are saving (S), taxes (T), and imports (M). The equilibrium condition is I + G + X = S + T + M, which is equivalent to planned injections = planned withdrawals.
Answer
B
B
Background Concept
The circular flow of income is a model that shows the flows of money, goods, and services between the main sectors of an economy: households, firms, the government, and the foreign sector. In a simple two-sector closed economy (households and firms), equilibrium occurs when planned saving (a withdrawal) equals planned investment (an injection). For an open economy with government and international trade, the model expands to include additional injections and withdrawals.
Injections are spending that enters the circular flow from outside the household-firm loop:
- Investment (I) by firms
- Government spending (G)
- Exports (X) – spending by foreigners on domestic goods and services
Withdrawals (leakages) are spending that leaves the circular flow:
- Saving (S) by households
- Taxes (T) paid to the government
- Imports (M) – spending by domestic residents on foreign goods and services
Equilibrium in the circular flow means that the total value of injections equals the total value of withdrawals, so that the level of national income is stable (not rising or falling). If injections exceed withdrawals, national income rises; if withdrawals exceed injections, national income falls.
Understanding the Question
This is a multiple-choice question testing knowledge of the equilibrium condition in the circular flow of income for an open economy (one that trades with other countries). The question asks: "Based on the circular flow of income, which condition is necessary for an open economy to be in equilibrium?" You must select the correct statement from four options.
Key points:
- The economy is "open" – it includes international trade (exports and imports).
- The circular flow model includes government and the foreign sector.
- Equilibrium is a state where there is no tendency for national income to change.
Approach
Recall the fundamental equilibrium condition for the circular flow: planned injections = planned withdrawals. Then check each option against this condition, considering which flows are injections and which are withdrawals in an open economy.
Step-by-Step Reasoning
-
Identify the equilibrium condition: In the circular flow of income, equilibrium occurs when the total value of planned injections equals the total value of planned withdrawals. This ensures that the flow of income is constant.
-
List injections and withdrawals for an open economy:
- Injections: Investment (I), Government spending (G), Exports (X)
- Withdrawals: Saving (S), Taxes (T), Imports (M)
- Equilibrium condition: I + G + X = S + T + M
-
Evaluate each option:
-
Option A: "Government investment is equal to private investment." This is not a condition for circular flow equilibrium. Government investment is part of G, and private investment is part of I. There is no requirement that these two be equal; equilibrium depends on the totals of all injections and withdrawals.
-
Option B: "Planned injections are equal to planned withdrawals." This is exactly the equilibrium condition described above. It is correct for any economy (closed or open) because it captures the balance of all injections and withdrawals.
-
Option C: "Spending by households is equal to taxes collected by government." This is not a general equilibrium condition. Household spending (consumption) is part of the circular flow, but equilibrium does not require it to equal taxes. Taxes are one withdrawal, but there are others (saving, imports), and injections also include investment and exports.
-
Option D: "Value of export earnings is equal to expenditure on imports." This would mean X = M, which is a condition for trade balance, not for overall circular flow equilibrium. Even if X = M, the economy could be out of equilibrium if, for example, I + G ≠ S + T.
-
-
Select the correct answer: Only option B correctly states the necessary condition for equilibrium in the circular flow of income for an open economy.
Key Takeaways
- The circular flow equilibrium condition is always: planned injections = planned withdrawals.
- In an open economy, injections = I + G + X; withdrawals = S + T + M.
- This condition ensures that national income is stable.
- Do not confuse specific balances (e.g., trade balance, government budget balance) with the overall circular flow equilibrium.
Common Mistakes
- Choosing option D (X = M) because it seems relevant to an open economy, but forgetting that other injections and withdrawals also matter.
- Thinking that equilibrium requires equality of any particular pair of flows (e.g., saving = investment, or taxes = spending) without considering all injections and withdrawals.
- Confusing the circular flow equilibrium with other macroeconomic equilibrium concepts (e.g., AD = AS).
Things to Be Careful About
- The question specifies "open economy" – remember to include exports and imports in the list of injections and withdrawals.
- The term "planned" is important: equilibrium refers to planned (ex ante) flows, not actual (ex post) flows, which are always equal by accounting identity.
- Read each option carefully; option B is the only one that captures the full set of injections and withdrawals.
The aggregate demand curve is typically downward sloping.
What is one possible explanation for this?
Options
A A fall in the price level will lead to a rise in demand for imports.
B As the price level falls, improved productivity will reduce unit costs.
C If the price level is high, any interest rate changes will encourage consumption.
D The real value of assets increases as the price level falls.
Reasoning
The aggregate demand (AD) curve slopes downward because a fall in the price level increases the real value of money-fixed assets (the real balance effect). Households feel wealthier and increase their consumption spending, so the quantity of real GDP demanded rises. This is the only option that correctly identifies a direct causal channel from a lower price level to higher aggregate demand.
- Option A is incorrect: a fall in the price level makes domestic goods relatively cheaper, so demand for imports falls, not rises.
- Option B is incorrect: improved productivity is a supply-side factor that shifts the aggregate supply curve, not a reason for the slope of AD.
- Option C is incorrect: a high price level does not automatically trigger interest rate changes that encourage consumption; the direction is unclear and the statement is vague.
Answer
D
D
Background Concept
The Aggregate Demand (AD) curve shows the total planned spending on domestically produced goods and services at each average price level. It is drawn with the price level on the vertical axis and real GDP (or real national output) on the horizontal axis. The AD curve slopes downwards from left to right, meaning that as the price level falls, the quantity of real GDP demanded rises. This is not the same as the microeconomic demand curve for a single good, which slopes down because of the substitution and income effects relative to other goods. For the whole economy, the downward slope is explained by three main effects:
-
The Real Balance Effect (Wealth Effect): When the price level falls, the real value of money-fixed assets (such as cash, bank deposits, and bonds with fixed nominal values) increases. Households feel wealthier and therefore increase their consumption spending. This is the most fundamental explanation.
-
The Interest Rate Effect: A lower price level reduces the demand for money to make transactions. With a given money supply, this pushes interest rates down. Lower interest rates stimulate consumption (especially on durable goods) and investment, raising aggregate demand.
-
The International Trade Effect (or Exchange Rate Effect): A lower domestic price level makes a country's exports cheaper relative to foreign goods, and imports more expensive. This leads to a rise in net exports (X - M), increasing aggregate demand.
Understanding the Question
This is a multiple-choice question asking for one possible explanation for the downward slope of the aggregate demand curve. The question provides four options (A, B, C, D). The task is to select the option that correctly describes a causal mechanism linking a fall in the price level to a rise in the quantity of real GDP demanded. The distractors are designed to test whether the student can distinguish between the effects of a change in the price level on aggregate demand (movement along the AD curve) and factors that shift the AD curve or affect aggregate supply.
Approach
- Recall the three main explanations for the downward slope of the AD curve: real balance effect, interest rate effect, and international trade effect.
- Evaluate each option against these explanations.
- Eliminate options that describe a shift of the AD curve, a change in aggregate supply, or a logically incorrect relationship.
- Select the option that correctly describes a direct, causal link from a lower price level to higher aggregate demand.
Step-by-Step Reasoning
-
Option A: "A fall in the price level will lead to a rise in demand for imports."
- This is the opposite of the international trade effect. A fall in the domestic price level makes domestic goods relatively cheaper compared to foreign goods. This should reduce the demand for imports (as domestic substitutes become more attractive) and increase the demand for exports. A rise in import demand would reduce net exports and lower aggregate demand, which is the opposite of what the downward-sloping AD curve shows. Therefore, Option A is incorrect.
-
Option B: "As the price level falls, improved productivity will reduce unit costs."
- This describes a supply-side change. Improved productivity shifts the short-run aggregate supply (SRAS) curve to the right, meaning firms can produce more output at any given price level. This is a factor that affects the position of the aggregate supply curve, not a reason why the AD curve itself slopes downwards. The question asks for an explanation of the slope of the AD curve, not the AS curve. Therefore, Option B is incorrect.
-
Option C: "If the price level is high, any interest rate changes will encourage consumption."
- This statement is vague and logically flawed. The interest rate effect works in the opposite direction: a lower price level reduces money demand, which lowers interest rates, which encourages consumption and investment. A high price level would increase money demand, pushing interest rates up and discouraging consumption and investment. The option also says "any interest rate changes will encourage consumption," which is not true; an interest rate rise discourages consumption. Therefore, Option C is incorrect.
-
Option D: "The real value of assets increases as the price level falls."
- This is a correct statement of the real balance effect (also known as the wealth effect). When the price level falls, the purchasing power of money-fixed assets (like cash and bonds) increases. Households feel wealthier, and this increase in real wealth leads to an increase in consumption spending. This is a direct, causal explanation for why the AD curve slopes downwards. Therefore, Option D is correct.
Key Takeaways
- The downward slope of the AD curve is explained by three key effects: the real balance (wealth) effect, the interest rate effect, and the international trade effect.
- It is crucial to distinguish between factors that cause a movement along the AD curve (changes in the price level) and factors that cause a shift of the AD curve (changes in any other determinant of aggregate demand, such as consumer confidence, fiscal policy, or monetary policy).
- Similarly, it is important not to confuse explanations for the slope of the AD curve with explanations for the slope or position of the aggregate supply (AS) curve.
Common Mistakes
- Confusing the AD curve with a microeconomic demand curve: Students sometimes think the AD curve slopes down because people buy more when things are cheaper (the substitution effect). While this is true for a single good, it does not apply to the whole economy because the overall price level does not create a substitution effect between domestic goods and a "different" good.
- Selecting Option B: This is a common mistake where students confuse a supply-side improvement (which shifts AS) with a reason for the slope of AD.
- Misapplying the interest rate effect: Students may remember that interest rates are involved but get the direction of causality wrong (e.g., thinking a high price level leads to low interest rates).
Things to Be Careful About
- Read the question carefully: it asks for an explanation of the downward slope of the AD curve, not a factor that shifts it.
- Pay attention to the direction of causality in each option. A correct explanation must show how a fall in the price level leads to a rise in the quantity of real GDP demanded.
- The real balance effect is the most direct and fundamental explanation, and it is the one tested here.
What is most likely to cause an unemployed worker to be classified as frictionally unemployed?
Options
A lack of relevant skills for vacant jobs
B lack of up-to-date job vacancy information
C greater use of technology in the production process
D an increase in regional pay inequality
Answer
Frictional unemployment occurs when workers are between jobs or are searching for new jobs. It is caused by imperfect information in the labour market, specifically a lack of up-to-date job vacancy information, which prevents workers from immediately finding suitable vacancies. Therefore, the correct answer is B.
B
Background Concept
Unemployment refers to the situation where individuals who are willing and able to work at the prevailing wage rate cannot find a job. Economists classify unemployment into several types based on its cause. Frictional unemployment is a natural and usually short-term form of unemployment that arises from the normal turnover in the labour market. It occurs because it takes time for workers to search for and find jobs that match their skills and preferences, and for employers to find suitable workers. This search process is prolonged by imperfect information — neither workers nor employers have complete, instant knowledge of all available jobs or candidates.
Understanding the Question
The question asks which factor is most likely to cause an unemployed worker to be classified as frictionally unemployed. It presents four options, each describing a different labour market condition. The task is to identify the one that directly aligns with the core cause of frictional unemployment: the time and information gap in the job search process.
Approach
- Recall the precise definition of frictional unemployment: it is unemployment due to the time it takes to match workers with jobs, primarily caused by imperfect information.
- Evaluate each option against this definition:
- Does it describe a mismatch due to information, or a mismatch due to other factors (skills, technology, location)?
- Select the option that best fits the information-based search friction.
Step-by-Step Reasoning
- Option A: Lack of relevant skills for vacant jobs. This describes a skills mismatch. Workers do not have the qualifications or training required for the available jobs. This is the defining characteristic of structural unemployment, not frictional unemployment. Structural unemployment is a more persistent form caused by changes in the structure of the economy.
- Option B: Lack of up-to-date job vacancy information. This is the classic cause of frictional unemployment. A worker may have the right skills and be willing to work, but does not know where the suitable vacancies are. The time spent searching for this information, or the fact that the worker is unaware of a vacancy, keeps them unemployed in the short term. This directly matches the definition.
- Option C: Greater use of technology in the production process. This is a cause of technological unemployment, which is a form of structural unemployment. Workers are displaced because their jobs are automated or because new technology changes the required skill set. It is not a temporary search friction.
- Option D: An increase in regional pay inequality. This could cause workers to move from low-pay to high-pay regions. While this movement might involve a period of frictional unemployment (the time spent moving and searching), the cause of the unemployment in this scenario is the geographical mismatch, which is more closely associated with structural or geographical immobility. The primary factor described is the pay differential, not the lack of information. The lack of information (Option B) is a more direct and fundamental cause of frictional unemployment.
Therefore, the factor most likely to cause an unemployed worker to be classified as frictionally unemployed is a lack of up-to-date job vacancy information.
Key Takeaways
- Frictional unemployment is caused by imperfect information and the time it takes for workers and employers to find each other.
- It is distinct from structural unemployment (caused by a mismatch of skills or location) and cyclical unemployment (caused by a downturn in aggregate demand).
- The key to answering such questions is to match the cause described in the option to the precise definition of the type of unemployment.
Common Mistakes
- Confusing frictional and structural unemployment. A common error is to think any mismatch (skills, location) is frictional. The key distinction is that frictional unemployment is a temporary search problem, while structural unemployment is a persistent mismatch.
- Choosing Option A (lack of skills) because it sounds like a 'mismatch', without distinguishing between an information gap and a skills gap.
- Overthinking Option D (regional pay inequality). While it could lead to frictional unemployment during a move, the question asks for the most likely cause, and the lack of information is the core, defining cause.
Things to Be Careful About
- Read the question carefully: it asks for what is most likely to cause the classification as frictionally unemployed. This requires a precise understanding of the definition, not just a general association.
- Distinguish between the cause of the unemployment and the process of finding a new job. The lack of information is the cause of the friction; the pay inequality might be a reason to search, but the friction itself is the information gap.
The table shows figures estimated at the end of a train drivers’ strike.
| $ (000s) | |
|---|---|
| loss of ticket revenue for train companies | 600 |
| value placed on extra leisure time by strikers | 20 |
| loss of government tax revenue | 40 |
| overtime payments to police | 30 |
What was the reduction in the recorded level of national income resulting from the strike?
Options
A $570 000
B $610 000
C $640 000
D $690 000
Working
National income (GDP) measures the value of final goods and services produced in an economy. The strike reduced output, so the relevant loss is the fall in market transactions.
- Loss of ticket revenue: $600 000 — this is a direct loss of output (a service not provided), so it reduces national income.
- Value placed on extra leisure time by strikers: $20 000 — leisure is not a market transaction and is not included in GDP. This is not counted.
- Loss of government tax revenue: $40 000 — tax revenue is a transfer payment, not a payment for a final good or service. This is not part of GDP and is not counted.
- Overtime payments to police: $30 000 — this is a payment for a service (policing) that was provided. However, this is a new payment for additional output, so it adds to national income. The net effect is that this offsets some of the loss.
Reduction in national income = Loss of ticket revenue - Overtime payments to police
= $600 000 - $30 000 = $570 000
Answer
A
A
Background Concept
National income, specifically Gross Domestic Product (GDP), measures the total value of all final goods and services produced within a country's borders over a period of time. It is calculated using market prices of transactions. Crucially, GDP only counts transactions that involve the production of goods and services for the market. Non-market activities (like unpaid housework or leisure) are not included. Transfer payments (like taxes, welfare benefits, or gifts) are also excluded because they do not represent new production; they simply redistribute income from one person to another.
Understanding the Question
The question presents a table of estimated financial effects from a train drivers' strike. It asks for the reduction in the recorded level of national income. The key is to identify which of the listed items are included in the standard measure of national income (GDP) and which are not. The figures are in thousands of dollars ($000s).
Approach
- Identify the core principle: National income records market-based production. The strike reduced production (fewer train services), so the loss of ticket revenue is a direct reduction. Other items are either non-market (leisure) or transfer payments (taxes) and are not counted. The overtime payment to police is a new market transaction that adds to GDP, partially offsetting the loss.
- Classify each item:
- Loss of ticket revenue: Included (reduction in output).
- Value of extra leisure: Excluded (non-market).
- Loss of tax revenue: Excluded (transfer payment).
- Overtime payments to police: Included (new output).
- Calculate the net change: The reduction in national income is the loss of ticket revenue minus the new output created (police overtime).
Step-by-Step Reasoning
- Loss of ticket revenue ($600 000): This is the clearest item. Train tickets are a final service sold to consumers. The strike meant these services were not produced and sold. This is a direct reduction in the value of output, so it reduces national income by $600 000.
- Value of extra leisure ($20 000): This is a tricky item. The strikers valued their extra time off. However, leisure is not a good or service sold in a market. National income accounts do not include the imputed value of leisure. Therefore, this figure is irrelevant to the calculation of recorded national income. It is ignored.
- Loss of government tax revenue ($40 000): Tax revenue is a transfer from households and firms to the government. It is not a payment for a new good or service. It is a redistribution of existing income. A loss of tax revenue does not represent a loss of production. It is ignored.
- Overtime payments to police ($30 000): The police provided a service (maintaining order, managing picket lines) that they would not have provided otherwise. The government paid for this service. This is a new market transaction representing new output. Therefore, this payment adds $30 000 to national income.
- Net Calculation:
- Reduction in national income = Loss of output - Gain in output
- Reduction = $600 000 (lost train services) - $30 000 (new police services)
- Reduction = $570 000
Key Takeaways
- National income (GDP) measures market-based production.
- Transfer payments (taxes, benefits, gifts) are not part of GDP.
- Non-market activities (leisure, unpaid work) are not part of GDP.
- When calculating the impact of an event on national income, only include changes in the value of final goods and services traded in markets.
Common Mistakes
- Including the loss of tax revenue: This is the most common error. Students often think that because the government loses money, the economy loses money. But tax is a transfer, not a measure of production. The loss of tax revenue is a consequence of the loss of output, not a separate component of the loss.
- Including the value of leisure: Students may think that because the strikers gained something of value, it should offset the loss. However, national income accounts do not record non-market welfare gains or losses. The question specifically asks for the recorded level of national income.
- Forgetting to add the police overtime: The police overtime is new production. It offsets some of the loss. Ignoring it overstates the reduction in national income.
- Adding all the numbers together: This would give $600 + $20 + $40 + $30 = $690 000 (option D), which is incorrect because it treats all items as losses to national income.
Things to Be Careful About
- Read the question carefully: It asks for the reduction in national income. The final answer is a positive number representing the net loss.
- Units: The table is in $000s. The answer options are also in $000s. The calculation is straightforward: 600 - 30 = 570.
- Distinguish between a loss of output and a transfer: The core skill tested is the ability to apply the definition of national income to a real-world scenario. Always ask: "Does this represent a payment for a final good or service produced?"
What is likely to be an expansionary monetary policy?
Options
A a decrease in the availability of credit
B a decrease in the exchange rate
C an increase in government spending
D an increase in subsidies for training
Reasoning
Expansionary monetary policy involves increasing the money supply or lowering interest rates, which typically leads to a depreciation of the exchange rate. This depreciation makes exports cheaper and imports more expensive, increasing aggregate demand. Options A (decrease in credit availability) is contractionary, C (increase in government spending) is fiscal policy, D (increase in subsidies for training) is supply-side policy. Therefore, the correct answer is B.
Answer
B
B
Background Concept
Monetary policy refers to actions by a central bank to manage the money supply and interest rates to achieve macroeconomic objectives such as price stability, low unemployment, and economic growth. Expansionary monetary policy aims to stimulate aggregate demand by increasing the money supply, lowering interest rates, or making credit more available. One of the channels through which this works is the exchange rate channel: lower interest rates make domestic currency less attractive to foreign investors, causing depreciation. A weaker currency then boosts net exports, increasing aggregate demand.
Understanding the Question
This question asks which of the four options is likely to be an expansionary monetary policy. It tests the ability to distinguish monetary policy from other types of government policy (fiscal and supply-side) and to understand what counts as expansionary (stimulating demand) versus contractionary (restraining demand). The correct answer is a decrease in the exchange rate, which is an effect of expansionary monetary policy and itself expansionary.
Approach
Consider each option in turn. Identify whether it is a monetary policy action or an effect, and whether it is expansionary or contractionary. A is clearly a contractionary monetary policy measure (reducing credit). C is an example of fiscal policy (government spending). D is a supply-side policy (training subsidies). B is the only one that can be associated with expansionary monetary policy, even though it is an outcome rather than a direct tool.
Step-by-Step Reasoning
- Option A: a decrease in the availability of credit. This is a contractionary monetary policy (tightening credit) because it reduces borrowing and spending. So it is not expansionary.
- Option B: a decrease in the exchange rate (depreciation). This is not a direct policy tool, but it is a likely result of expansionary monetary policy (lower interest rates cause depreciation). Depreciation makes exports cheaper and imports more expensive, increasing net exports and thus aggregate demand. Therefore, it is expansionary in effect.
- Option C: an increase in government spending. This is fiscal policy, not monetary policy. Even though it is expansionary, it is not a monetary policy.
- Option D: an increase in subsidies for training. This is a supply-side policy aimed at improving labour productivity. It is not monetary policy and may have expansionary effects in the long run, but it is not a monetary policy tool.
Thus, only B is correctly identified as something that is likely to be an expansionary monetary policy (or a consequence of it).
Key Takeaways
- Expansionary monetary policy includes lowering interest rates, increasing money supply, and easing credit conditions.
- One of the transmission mechanisms is through the exchange rate: lower interest rates lead to depreciation, which stimulates exports and aggregate demand.
- It is important to distinguish between monetary, fiscal, and supply-side policies.
Common Mistakes
- Confusing the effects of policy with the policy itself. The question asks what is likely to be an expansionary monetary policy; a decrease in the exchange rate is an effect, but it is a valid indicator of expansionary policy.
- Thinking that a decrease in the exchange rate is contractionary (because it makes imports more expensive). However, in the context of monetary policy, depreciation is expansionary because it boosts net exports.
- Selecting a fiscal or supply-side policy (C or D) because they are expansionary, but ignoring that they are not monetary policy.
Things to Be Careful About
- Read the question carefully: it asks for 'expansionary monetary policy', not just 'expansionary policy'.
- Understand that monetary policy is conducted by the central bank, not the government's budget or spending decisions.
- Remember that a decrease in the exchange rate (depreciation) can be caused by expansionary monetary policy and itself has an expansionary effect on the economy.
A government increases direct taxation to reduce its budget deficit.
How is this likely to affect the government’s ability to achieve its macroeconomic objectives?
Options
| economic growth | low inflation | low unemployment | |
|---|---|---|---|
| A | less likely | less likely | less likely |
| B | more likely | less likely | more likely |
| C | less likely | more likely | less likely |
| D | more likely | more likely | less likely |
Answer
Higher direct taxation reduces households' disposable income, leading to a fall in consumption (C), a component of aggregate demand (AD = C + I + G + (X-M)). A fall in AD shifts the AD curve leftwards. This reduces real output (economic growth less likely) and reduces the price level (low inflation more likely). Lower output means lower employment (unemployment rises, so low unemployment less likely).
Therefore the correct option is C.
C
Background Concept
This question tests the impact of contractionary fiscal policy on the three main macroeconomic objectives: economic growth, low inflation, and low unemployment. Contractionary fiscal policy involves reducing aggregate demand (AD) through higher taxes or lower government spending. The AD/AS model is the standard framework for analysing these effects.
Aggregate Demand (AD) is the total planned spending on goods and services in an economy, given by AD = C + I + G + (X-M). A rise in direct taxes reduces households' disposable income, which reduces consumption (C). This is a negative shock to AD.
Economic growth is measured by the increase in real GDP. A fall in AD reduces real output (Y), making growth less likely.
Inflation is a sustained rise in the general price level. A fall in AD reduces demand-pull inflationary pressure, making low inflation more likely.
Unemployment is the number of people willing and able to work but not in paid employment. A fall in AD reduces output, so firms need fewer workers, raising unemployment. Thus low unemployment becomes less likely.
Understanding the Question
The question presents a scenario: the government increases direct taxation to reduce its budget deficit. Direct taxes are taxes on income and wealth (e.g., income tax, corporation tax). The question asks how this policy affects the government's ability to achieve its three macroeconomic objectives: economic growth, low inflation, and low unemployment. The answer is a single row from a table of options (A–D).
This is a multiple-choice question requiring the candidate to trace the causal chain from the policy change to each objective. No calculation or diagram is needed; the reasoning is purely theoretical.
Approach
- Identify the policy: higher direct taxes = contractionary fiscal policy.
- Trace the effect on AD: higher taxes -> lower disposable income -> lower consumption -> lower AD.
- Use the AD/AS model: a leftward shift of AD reduces real output (Y) and the price level (P).
- Map these changes to the three objectives:
- Lower Y -> economic growth less likely.
- Lower P -> low inflation more likely.
- Lower Y -> firms produce less -> lower employment -> low unemployment less likely.
- Match the pattern to the options: less likely, more likely, less likely = option C.
Step-by-Step Reasoning
-
Policy identification: The government increases direct taxation. This is a contractionary fiscal policy measure because it withdraws spending power from the circular flow.
-
Effect on disposable income: Higher direct taxes mean households keep less of their income. Disposable income falls.
-
Effect on consumption: Consumption (C) is the largest component of AD and depends positively on disposable income. A fall in disposable income reduces consumption.
-
Effect on AD: AD = C + I + G + (X-M). A fall in C reduces AD. The AD curve shifts leftwards.
-
Effect on real output and price level: In the AD/AS model, a leftward shift of AD reduces both the equilibrium real output (Y) and the price level (P). This is because at every price level, the quantity of goods and services demanded is lower.
-
Effect on economic growth: Real output falls. Since economic growth is the increase in real GDP over time, a fall in output makes growth less likely (or negative growth).
-
Effect on inflation: The price level falls (or rises more slowly). Demand-pull inflation is reduced. Therefore low inflation becomes more likely.
-
Effect on unemployment: Lower output means firms need fewer workers. They may reduce hiring or lay off workers. Unemployment rises. Therefore low unemployment becomes less likely.
-
Matching to options:
- Economic growth: less likely
- Low inflation: more likely
- Low unemployment: less likely
This matches option C.
Key Takeaways
- Contractionary fiscal policy (higher taxes or lower government spending) reduces AD.
- A fall in AD reduces real output and the price level.
- This makes economic growth and low unemployment less likely, but low inflation more likely.
- The AD/AS model is the essential tool for analysing macroeconomic policy effects.
- Always trace the chain: policy -> component of AD -> shift of AD -> change in Y and P -> effect on each objective.
Common Mistakes
- Confusing direct and indirect taxes: Direct taxes affect disposable income and consumption; indirect taxes affect the price level directly and may shift SRAS. This question specifies direct taxes, so the effect is on AD, not AS.
- Thinking higher taxes always reduce inflation: While higher direct taxes reduce demand-pull inflation, they do not affect cost-push inflation. The question assumes a standard AD/AS framework.
- Ignoring the effect on unemployment: Some candidates focus only on growth and inflation and forget that lower output means higher unemployment.
- Reversing the direction: A common error is to think higher taxes reduce inflation but also reduce unemployment (e.g., option B). This is incorrect because lower output raises unemployment.
Things to Be Careful About
- Read the question carefully: it asks about the government's ability to achieve each objective, not the absolute outcome. "Less likely" means the policy makes it harder to achieve.
- Distinguish between direct and indirect taxes. Direct taxes affect AD via consumption; indirect taxes affect the price level and may shift SRAS.
- Remember that the AD/AS model is a short-run framework. In the long run, the economy may return to potential output, but the question does not specify a time horizon.
- The budget deficit is reduced because higher tax revenue reduces the deficit (or increases the surplus). This is a secondary effect; the primary effect on objectives is via AD.
An income tax has a tax-free allowance of $10 000 and a single rate of 25%.
What type of tax is this?
Options
A indirect
B progressive
C proportional
D regressive
Reasoning
An income tax is a direct tax, not indirect, so option A is incorrect. The tax has a $10,000 tax-free allowance and a single rate of 25% on taxable income above that. This means the average tax rate rises as income increases. For example, on an income of $20,000, the tax is ($20,000 - $10,000) × 0.25 = $2,500, giving an average rate of 12.5%. On $40,000, the tax is ($40,000 - $10,000) × 0.25 = $7,500, an average rate of 18.75%. Since the average rate increases with income, the tax is progressive. Options C (proportional) and D (regressive) are therefore incorrect. The correct answer is B.
Answer
B
B
Background Concept
Taxes are classified by how the average tax rate (tax paid / income) changes as income changes. A progressive tax takes a larger percentage of income from higher earners (the average rate rises with income). A regressive tax takes a smaller percentage as income rises (the average rate falls). A proportional tax takes the same percentage at all income levels (the average rate is constant). A direct tax is levied on income or wealth (e.g., income tax), while an indirect tax is on spending (e.g., VAT). The question asks for the type, not the method of collection, so the direct/indirect distinction is not the main focus.
Understanding the Question
The question describes a specific income tax structure: a tax-free allowance of $10,000 and a single marginal rate of 25% on all income above that. We need to determine whether this makes the tax progressive, regressive, or proportional. The presence of a tax-free allowance is key: it means that the first $10,000 of income is not taxed, so the average tax rate starts at zero and rises as income increases, because the proportion of income that is tax-free falls.
Approach
To decide, we compute the average tax rate at two different income levels (e.g., $20,000 and $40,000) and see how it changes. If the average rate rises, it is progressive. If it falls, regressive. If it stays the same, proportional. Also, note that an income tax is direct, but the answer choices include "indirect" as a distractor; we can eliminate that immediately.
Step-by-Step Reasoning
- Eliminate option A (indirect): The tax is an income tax, which is a direct tax on earnings, not a tax on spending. So A is incorrect.
- Compute the tax paid at $20,000 income:
- Taxable income = $20,000 - $10,000 = $10,000
- Tax = 25% of $10,000 = $2,500
- Average tax rate = $2,500 / $20,000 = 0.125 = 12.5%
- Compute the tax paid at $40,000 income:
- Taxable income = $40,000 - $10,000 = $30,000
- Tax = 25% of $30,000 = $7,500
- Average tax rate = $7,500 / $40,000 = 0.1875 = 18.75%
- Since 18.75% > 12.5%, the average rate rises with income. This is the definition of a progressive tax.
- Option C (proportional) would require a constant average rate, which is not the case. Option D (regressive) would require a falling average rate, which is the opposite. Therefore, the correct answer is B.
Key Takeaways
- A tax with a single marginal rate but a tax-free allowance is progressive because the average rate increases as income rises.
- The average rate, not the marginal rate, determines the classification.
- To test whether a tax is progressive, regressive, or proportional, compute the average rate at two different income levels.
Common Mistakes
- Confusing marginal and average rates: Some students think a single marginal rate means proportional, but the allowance makes the average rate rise. Always check the average rate.
- Thinking all direct taxes are progressive: They can be regressive (e.g., a flat tax without allowance, or a poll tax). The structure matters.
- Selecting 'indirect' because it's a tax: Income tax is direct, not indirect.
Things to Be Careful About
- The tax-free allowance is the key feature that creates progressivity. Without it, a single 25% rate on all income would be proportional (average rate = 25% everywhere).
- When calculating average rates, ensure you use total income (including the allowance) as the denominator.
- Be precise about the definition: progressive means the average rate rises, not the marginal rate.
Which supply-side policy will encourage new entrepreneurs?
Options
A an increase in government subsidy to small firms
B an increase in the national minimum wage
C an increase in the power of trade unions
D an increase in the tax on business profits
A subsidy to small firms lowers start-up costs and reduces financial risk, making it more attractive for entrepreneurs to enter the market. The other options either increase costs (minimum wage, trade union power) or reduce after-tax returns (higher business profit tax), which deter new entrepreneurs. Therefore, the correct answer is A.
Answer
A
A
Background Concept
Supply-side policies aim to increase the economy's productive capacity by improving the efficiency and quantity of factors of production. One key objective is to encourage entrepreneurship, as new firms create jobs, innovation, and competition. Common tools include subsidies, tax incentives, deregulation, and infrastructure investment. A subsidy to small firms directly reduces the cost of starting and operating a business, thereby lowering barriers to entry and increasing the expected reward.
Understanding the Question
This multiple-choice question tests knowledge of supply-side policies and their specific impact on entrepreneurial activity. The question asks which of the four options is a supply-side policy that will encourage new entrepreneurs. It requires distinguishing policies that reduce costs or risks for start-ups from those that raise costs or reduce incentives.
Approach
Evaluate each option by asking whether it reduces or increases the barriers and incentives for a new entrepreneur:
- Does it lower start-up costs or risks? (A)
- Does it raise labour costs or reduce flexibility? (B, C)
- Does it reduce the after-tax profit reward? (D)
The option that directly improves the net benefit of starting a business is the correct answer.
Step-by-Step Reasoning
Option A – Increase in government subsidy to small firms:
A subsidy provides financial support, lowering the initial investment required and reducing the risk of failure. This directly encourages individuals to become entrepreneurs, as the expected profit increases and the downside is cushioned. It is a classic supply-side tool to boost enterprise.
Option B – Increase in the national minimum wage:
Raising the minimum wage increases labour costs for all firms, including new start-ups. Higher costs reduce profitability and may deter entrepreneurs from hiring, especially in labour-intensive sectors. This discourages new businesses, particularly those with low margins.
Option C – Increase in the power of trade unions:
Stronger trade unions can push for higher wages, better benefits, and stricter working conditions, again raising labour costs. They may also reduce flexibility in hiring and firing, which increases risk for a new firm. This makes entrepreneurship less attractive.
Option D – Increase in the tax on business profits:
Higher profit taxes reduce the after-tax return from successful entrepreneurship. Since the potential reward is a key motivator, a higher tax rate diminishes the incentive to start a business, especially for risky ventures.
Thus, only Option A encourages new entrepreneurs.
Key Takeaways
- Supply-side policies can target entrepreneurship through subsidies, tax relief, or deregulation.
- Policies that raise costs or reduce rewards for firms generally discourage new business formation.
- Understanding the incentive effects of government policies is crucial for evaluating their impact on economic activity.
Common Mistakes
- Confusing a minimum wage increase with a policy that helps workers; it raises costs for employers and can deter entrepreneurship.
- Thinking that any tax cut is supply-side; here the tax on profits is increased, so it discourages enterprise.
- Believing trade union power only helps workers; it can raise labour costs and reduce flexibility, harming new businesses.
Things to Be Careful About
- Read the question carefully: it asks for a policy that encourages new entrepreneurs, not just any supply-side policy.
- Ensure the policy directly affects the decision of an individual to start a firm, not just the overall economy.
- Distinguish between policies that support existing firms and those that specifically lower entry barriers for new entrepreneurs.
The diagram shows aggregate demand (AD) and aggregate supply (AS) curves. The initial equilibrium is at X. A government decides to invest in an increase in infrastructure.
What will be the short-term effect of this policy on the equilibrium?
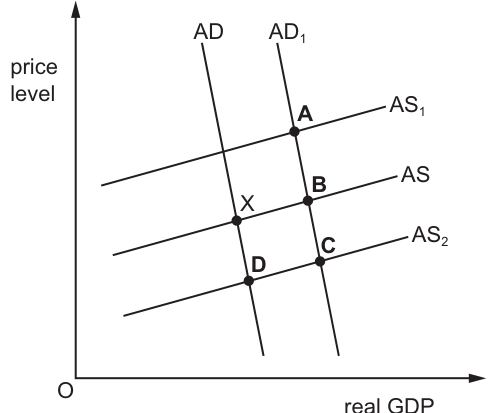
Options
A point A on Fig. 25.1
B point B on Fig. 25.1
C point C on Fig. 25.1
D point D on Fig. 25.1
Reasoning
Government infrastructure spending is a component of aggregate demand, calculated as AD = C + I + G + (X - M). An increase in government spending (G) causes the aggregate demand curve to shift rightward from AD to AD1. In the short run, aggregate supply (AS) does not shift, as the supply-side effects of infrastructure investment (increased productive capacity) take time to materialise. The new short-run equilibrium is therefore at the intersection of the shifted AD curve (AD1) and the original AS curve, which corresponds to point B on Fig. 25.1.
Answer
B
B
Background Concept
The aggregate demand and aggregate supply (AD/AS) model is used to analyse the relationship between total demand for goods and services in an economy, total supply of goods and services, the price level, and real GDP. Aggregate demand (AD) represents the total value of output demanded at different price levels, and is composed of four components: consumer spending (C), investment spending (I), government spending (G), and net exports (X - M). The AD curve is downward sloping because a higher price level reduces the real value of wealth, raises interest rates (reducing investment and consumption), and makes domestic goods more expensive relative to foreign goods (reducing exports and increasing imports). Aggregate supply (AS) represents the total value of output firms are willing to produce at different price levels. The short-run AS curve is upward sloping because as the price level rises, firms' profits increase, incentivising them to produce more output. Short-run equilibrium occurs where AD equals AS, determining the equilibrium price level and real GDP. It is important to distinguish between short-run and long-run effects of economic policies: supply-side policies such as infrastructure investment improve the economy's productive capacity and shift the long-run AS curve rightward, but these effects take time to materialise and do not affect short-run AS.
Understanding the Question
This multiple-choice question asks for the short-term effect of a government decision to increase infrastructure investment on the AD/AS equilibrium shown in Fig. 25.1. The initial equilibrium is at point X, the intersection of the original AD and AS curves. The four options represent different equilibrium points after the policy is implemented. The key constraint is the "short-term" time frame: we only consider the immediate impact of the policy, not its long-run supply-side effects. The policy in question is an increase in government spending on infrastructure, which is a fiscal policy tool.
Approach
To solve this question, follow three steps:
- Identify which component of AD is affected by the policy: government infrastructure spending is a form of government expenditure (G), a direct component of AD.
- Determine the direction of the AD shift: an increase in G increases total AD, so the AD curve shifts rightward from AD to AD1.
- Determine the relevant AS curve for the short run: infrastructure investment is a supply-side policy, but its impact on AS (increasing productive capacity) is a long-run effect, so the short-run AS curve remains unchanged at its original position (the AS curve in the diagram, which intersects AD at the initial equilibrium X).
- Find the new equilibrium as the intersection of the shifted AD (AD1) and the unchanged short-run AS curve, and match it to the options provided.
Step-by-Step Reasoning
- First, recall the formula for aggregate demand: AD = C + I + G + (X - M). Government spending on infrastructure is counted as part of G, so an increase in this spending directly increases the total value of AD in the economy.
- An increase in any component of AD causes the entire AD curve to shift rightward (outward), because at every possible price level, the total quantity of goods and services demanded is now higher. In the diagram, this shift is from the original AD curve to the AD1 curve, which lies to the right of AD.
- Next, consider the impact on aggregate supply in the short run. Infrastructure investment (e.g. building roads, ports, broadband) increases the economy's productive capacity, which would shift the long-run AS curve rightward in the future. However, in the short run, these projects take time to complete, and firms cannot immediately adjust their production processes to use the new infrastructure. Input prices, wage rates, and existing productive capacity also do not change immediately in response to the policy announcement. As a result, the short-run AS curve does not shift — it remains at the original AS position shown in the diagram.
- The new short-run equilibrium is the point where the new AD curve (AD1) intersects the unchanged short-run AS curve (AS). Looking at Fig. 25.1, this intersection is point B.
- We can eliminate the other options:
- Point A is the intersection of AD1 and AS1. AS1 is a higher AS curve, representing a leftward shift of AS (decreased productive capacity), which is not caused by infrastructure investment.
- Point C is the intersection of AD1 and AS2. AS2 is a lower AS curve, representing a rightward shift of AS (increased productive capacity), which is a long-run effect of the policy, not a short-run effect.
- Point D is the intersection of AD and AS2, which would result from a fall in AS with no change in AD, which is unrelated to the policy described.
- Therefore, the correct answer is option B.
Key Takeaways
- Government spending is a direct component of aggregate demand, so changes in government spending shift the AD curve.
- In the short run, aggregate supply is unaffected by supply-side policies such as infrastructure investment, as these policies take time to affect productive capacity.
- Short-run AD/AS equilibrium is always found at the intersection of the AD curve and the short-run AS curve. When analysing policy impacts, always first identify which curves shift, and in which direction, before finding the new equilibrium.
Common Mistakes
- Confusing short-run and long-run effects: A common error is to assume that infrastructure investment immediately shifts the AS curve rightward, leading students to select point C. However, supply-side policies only affect AS in the long run, once the investment has been completed and firms have adjusted their production.
- Misidentifying the direction of the AD shift: Some students may incorrectly think that government investment reduces AD (e.g. if it is funded by higher taxes, which reduce consumption), but the question does not mention tax increases, so the direct effect of higher government spending is a rightward shift of AD.
- Misreading the diagram: Students may mix up the AS curves, forgetting that the initial equilibrium X is at the intersection of AD and the middle AS curve, so that is the original short-run AS curve.
Things to Be Careful About
- Always pay attention to the time period specified in the question: "short-term" explicitly rules out long-run supply-side effects.
- When identifying equilibrium points, always match the shifted curve (in this case, AD1) with the unchanged curve for the relevant time period (short-run AS, which is the original AS curve).
- Remember that fiscal policy tools such as changes in government spending directly affect AD in the short run, while supply-side policies affect AS only in the long run.
Which statement is not a valid reason why a country may impose protectionist measures?
Options
A to allow a newly developed domestic industry to grow to a viable size
B to enable a country to retain control of an industry it regards as being of strategic importance
C to give consumers a wider choice of goods and services
D to give time for workers in a declining domestic industry to find alternative employment
Answer
Protectionism restricts trade, so it cannot be used to give consumers a wider choice of goods and services — that is a benefit of free trade, not protection. The other three options are all standard arguments for protection: the infant industry argument (A), the strategic industry argument (B), and the protection of declining industries to allow a managed transition for workers (D).
Answer
C
C
Background Concept
Protectionism refers to government policies that restrict international trade to protect domestic industries from foreign competition. Common protectionist measures include tariffs (taxes on imports), import quotas (limits on the quantity of imports), export subsidies, and non-tariff barriers such as excessive administrative requirements. The standard arguments FOR protectionism include:
- Infant industry argument: protecting a newly developing domestic industry until it achieves economies of scale and becomes competitive internationally.
- Strategic industry argument: protecting industries vital for national security (e.g., defence, energy, food production).
- Declining industry / sunset industry argument: giving workers in a shrinking industry time to retrain and find alternative employment, avoiding sudden unemployment.
- Anti-dumping: preventing foreign firms from selling below cost to drive domestic competitors out of business.
- Protection of domestic employment: shielding jobs from cheap foreign labour.
- Improving the balance of payments: reducing imports to reduce a current account deficit.
In contrast, the benefits of FREE TRADE include a wider variety of goods and services for consumers, lower prices, and greater efficiency through specialisation according to comparative advantage. Protectionism reduces consumer choice and raises prices.
Understanding the Question
This is a multiple-choice question asking which statement is NOT a valid reason for imposing protectionist measures. Three of the four options are standard arguments used by governments to justify protectionism. One option describes a benefit of free trade, not protection. The task is to identify the odd one out.
Approach
Recall the standard arguments for protectionism listed above. Check each option against that list. The option that describes a benefit of free trade — wider consumer choice — is the invalid reason.
Step-by-Step Reasoning
-
Option A: "to allow a newly developed domestic industry to grow to a viable size" — This is the classic infant industry argument. A new industry may initially have high costs because it lacks economies of scale. Temporary protection allows it to expand, reduce costs, and eventually compete without protection. This is a valid argument.
-
Option B: "to enable a country to retain control of an industry it regards as being of strategic importance" — This is the strategic industry argument. A country may want to ensure it can produce essential goods (e.g., military equipment, energy, food) domestically, even if imports are cheaper, to avoid dependence on foreign suppliers during a crisis. This is a valid argument.
-
Option C: "to give consumers a wider choice of goods and services" — Protectionism reduces the number of foreign goods available, restricts variety, and often raises prices. A wider choice is a benefit of free trade, not protection. This is NOT a valid reason for protectionism.
-
Option D: "to give time for workers in a declining domestic industry to find alternative employment" — This is the declining industry / sunset industry argument. If a domestic industry is being outcompeted by imports, temporary protection can slow the decline, giving workers time to retrain and move to growing sectors, reducing the social costs of sudden unemployment. This is a valid argument.
Therefore, the statement that is NOT a valid reason is C.
Key Takeaways
- Protectionism restricts trade; its arguments focus on protecting domestic producers, workers, or national security.
- Free trade benefits consumers through wider choice and lower prices.
- When asked to identify an invalid argument, look for the option that describes a benefit of the opposite policy.
Common Mistakes
- Confusing the effects of protectionism with the effects of free trade. Option C is a classic distractor because it sounds positive, but it describes a free-trade outcome.
- Thinking that "protecting consumers" is a reason for protectionism — in fact, protectionism usually harms consumers through higher prices and less choice.
Things to Be Careful About
- Read the question carefully: it asks for the statement that is NOT a valid reason.
- Do not overthink — the standard arguments are well-known and three of the four are textbook examples.
What is most likely to lead to a persistent surplus in a country’s current account of its balance of payments?
Options
A a low domestic savings rate
B an undervalued exchange rate
C highly protectionist policies by other countries
D low investment income from abroad
Reasoning
A current account surplus means exports of goods and services plus primary and secondary income receipts exceed imports and income payments. An undervalued exchange rate makes a country's exports cheaper in foreign currency and imports more expensive in domestic currency, which tends to increase export revenues and reduce import expenditure, leading to a surplus.
- A low domestic savings rate (A) typically reduces the funds available for investment and may increase imports, worsening the current account.
- Highly protectionist policies by other countries (C) would reduce demand for the country's exports, likely worsening its current account.
- Low investment income from abroad (D) would reduce the primary income surplus, worsening the current account.
Therefore, an undervalued exchange rate is the most likely to produce a persistent surplus.
Answer
B
B
Background Concept
The current account of the balance of payments records transactions in goods, services, primary income (investment income, compensation of employees) and secondary income (transfers). A surplus means more foreign exchange flows in from these items than flows out. One key determinant is the exchange rate: a lower (undervalued) exchange rate relative to its equilibrium or long-run value makes exports cheaper and imports dearer, boosting the trade balance.
Understanding the Question
The question asks which factor is most likely to lead to a persistent surplus. The word 'persistent' implies a sustained rather than temporary effect. Each option is a candidate. The correct answer, B, is an undervalued exchange rate. The others either cause deficits or are not likely to produce a surplus.
Approach
We evaluate each option against economic theory:
- A: Low domestic savings rate. In national income accounting, savings = investment + current account surplus. Low savings means either low investment or a current account deficit. So it is more likely to lead to a deficit.
- B: Undervalued exchange rate. This makes exports competitive, leading to higher net exports and a surplus.
- C: Protectionist policies by other countries. These restrict the country's exports, worsening the trade balance.
- D: Low investment income from abroad. This reduces the primary income surplus, worsening the current account.
Only B is consistent with a persistent surplus.
Step-by-Step Reasoning
- Define current account surplus: (X - M) + net primary income + net secondary income > 0. Assume secondary income is small or balanced.
- Exchange rate mechanism: If a country's currency is undervalued (below its market-clearing level), its exports are cheaper for foreigners, so demand for exports rises. Imports become more expensive domestically, so demand for imports falls. Both effects improve net exports (X - M). If the price elasticities of demand for exports and imports are sufficiently high (Marshall-Lerner condition), the trade balance improves in the long run. Thus an undervalued exchange rate can produce a persistent surplus.
- Low domestic savings: The national income identity: S - I = (X - M) + net income flows. If savings are low, the right-hand side must be low (or negative) to balance, implying a current account deficit.
- Protectionist policies by other countries: They impose tariffs or quotas on the country's exports, reducing export revenue. That worsens the current account.
- Low investment income: If the country earns less from foreign investments, the primary income balance is lower, worsening the current account.
Thus only B is a plausible cause of a surplus.
Key Takeaways
- The current account is influenced by the exchange rate, savings, protectionism, and income flows.
- An undervalued exchange rate is a classic cause of a persistent trade surplus.
- Understanding national income identities helps link savings and the current account.
Common Mistakes
- Confusing 'undervalued' with 'overvalued': an overvalued exchange rate causes a deficit.
- Thinking protectionism by other countries helps the current account: it actually hurts exports.
- Assuming low savings leads to surplus: it typically leads to a deficit (or lower surplus).
Things to Be Careful About
- The question asks for the most likely cause. More than one could cause a surplus temporarily, but persistent surplus is best explained by an undervalued exchange rate.
- Avoid generalising: a low savings rate could be associated with high investment, not necessarily a deficit, but the identity holds.
- The Marshall-Lerner condition is implicit; candidates should know that elasticity conditions matter for the effect of exchange rate changes.
Which formula is used to calculate the terms of trade?
Options
A the average price of exports divided by the average price of imports
B the average price of imports divided by the average price of exports
C the value of exports divided by the value of imports
D the value of imports divided by the value of exports
Answer
The terms of trade are measured as the ratio of the average price of exports to the average price of imports, typically expressed as an index. Therefore, the correct formula is the average price of exports divided by the average price of imports.
Answer
A
A
Background Concept
The terms of trade (ToT) measure the relative price of a country's exports compared to its imports. It is calculated as:
(Index of average export prices / Index of average import prices) x 100
A rise in the ToT means export prices have risen relative to import prices, allowing a country to buy more imports for the same quantity of exports. A fall means the opposite. The formula uses prices, not values, because values combine price and quantity changes and would not isolate the price advantage.
Understanding the Question
The question asks for the correct formula to compute the terms of trade. The four options present two key distinctions: price ratio vs. value ratio, and whether exports are in the numerator or denominator. The correct definition is a price ratio with exports on top.
Approach
Recall the definition of terms of trade from the syllabus: a comparison of export prices to import prices. Eliminate options that refer to the value of exports/imports, because those would be distorted by changes in quantities traded.
Step-by-Step Reasoning
- Option A: average price of exports divided by average price of imports. This matches the standard definition.
- Option B: average price of imports divided by average price of exports. This would give the reciprocal of the terms of trade (i.e., the relative price of imports in terms of exports).
- Option C: value of exports divided by value of imports. This is the trade balance in goods and services, not the terms of trade.
- Option D: value of imports divided by value of exports. Again a trade balance ratio, not the terms of trade.
Only option A gives the correct price-based ratio.
Key Takeaways
- The terms of trade are a price ratio, not a value ratio.
- They show how many imports can be obtained per unit of exports.
- The formula is crucial for understanding gains from trade over time.
Common Mistakes
- Confusing the terms of trade with the balance of trade (value of exports minus value of imports).
- Inverting the ratio (import prices divided by export prices).
- Forgetting that the formula uses price indices, not absolute prices.
Things to Be Careful About
- In the AS syllabus, the terms of trade are defined as the ratio of average export prices to average import prices (multiplied by 100 to form an index).
- Be careful not to confuse with the terms of trade effect in the J-curve analysis (covered at A Level).
- Always check the numerator and denominator when applying the formula in calculations.
A country is experiencing a deficit on the current account of its balance of payments.
Which policy decision could reduce the deficit?
Options
A decrease in income tax rates
B increase in exchange rates
C increase in government spending
D increase in import tariffs
Working
A current account deficit occurs when the value of imports exceeds the value of exports. To reduce the deficit, a policy must either reduce imports, increase exports, or both.
- Option A: A decrease in income tax rates raises disposable income, increasing consumption and likely imports, worsening the deficit.
- Option B: An increase in the exchange rate (appreciation) makes exports more expensive and imports cheaper, reducing exports and increasing imports, worsening the deficit.
- Option C: An increase in government spending raises aggregate demand, which tends to increase imports, worsening the deficit.
- Option D: An increase in import tariffs raises the price of imported goods, reducing the quantity of imports demanded (assuming price elastic demand), which directly reduces the trade deficit.
Therefore, only Option D could reduce the deficit.
Answer
D
D
Background Concept
The current account of the balance of payments records a country's trade in goods, services, primary income, and secondary income with the rest of the world. A deficit means that outflows (imports plus income transfers abroad) exceed inflows (exports plus income from abroad). The trade balance (exports minus imports of goods and services) is the largest component. Policies can influence the trade balance by changing relative prices (expenditure-switching) or total spending (expenditure-reducing).
Understanding the Question
The question presents a country already running a current account deficit. It asks which of four policy decisions 'could reduce' the deficit. The word 'could' allows for some conditions (e.g., price elasticities), but the expected answer is the policy that would normally improve the trade balance. The options include two expansionary fiscal policies (lower income tax, higher government spending), an exchange rate appreciation, and an import tariff.
Approach
For each option, determine its likely effect on imports and exports and therefore on the current account. Use standard macroeconomic reasoning:
- Expansionary fiscal policy raises aggregate demand and typically increases imports.
- Exchange rate appreciation makes exports relatively expensive and imports relatively cheap, worsening the trade balance.
- Import tariffs raise the price of imports, reducing import volume (if demand is price elastic) and improving the trade balance.
Because this is a multiple-choice question, the reasoning must be quick and focused on distinguishing the only policy that reduces the deficit.
Step-by-Step Reasoning
Option A: Decrease in income tax rates
Lower income tax increases households' disposable income. With a positive marginal propensity to consume, consumption spending rises. Some of this extra spending falls on imported goods and services, so imports increase. Unless exports rise simultaneously (unlikely without a change in foreign income or relative prices), the current account worsens.
Option B: Increase in exchange rates
An increase in the exchange rate (appreciation) means the domestic currency is stronger. Imported goods become cheaper in domestic currency, so import volumes likely rise. Exports become more expensive in foreign currency, so export volumes likely fall. The combined effect is a deterioration of the trade balance, assuming the Marshall-Lerner condition holds (which it typically does in the long run). So the deficit widens.
Option C: Increase in government spending
Higher government purchases (e.g., on infrastructure or public services) directly increase aggregate demand. Part of this new spending is on imports (e.g., foreign machinery, raw materials). The multiplier process further raises income and consumption, again increasing imports. The trade deficit increases.
Option D: Increase in import tariffs
A tariff is a tax on imported goods. It raises the domestic price of imports, making them less competitive relative to domestically produced substitutes. Assuming price elastic demand for imports (a reasonable assumption for many goods), the quantity of imports falls. Since the tariff also generates government revenue, the value of imports may fall or rise depending on elasticities, but the conventional expectation is a reduction in the quantity and value of imports, improving the trade balance. This is the only option that directly reduces imports without boosting them.
Thus, D is the correct answer.
Key Takeaways
- Expansionary fiscal policies (tax cuts or spending increases) tend to increase imports and worsen the current account.
- Exchange rate appreciation also worsens the trade balance by making exports dearer and imports cheaper.
- Tariffs are an expenditure-switching policy: they divert spending from foreign to domestic goods, improving the trade balance (subject to price elasticities).
- In multiple-choice questions, eliminate options that have the opposite effect and identify the one consistent with the policy goal.
Common Mistakes
- Confusing 'increase in exchange rates' with a depreciation: an increase is an appreciation, which makes exports less competitive, not more.
- Thinking that fiscal expansion directly reduces the deficit because it increases GDP; the link to imports is often missed.
- Assuming that tariffs always reduce the deficit without considering elasticity; the question uses 'could', so the standard effect is sufficient.
Things to Be Careful About
- When reading options, check the direction of change: 'increase in exchange rates' means appreciation, not depreciation.
- Distinguish between expenditure-reducing (fiscal contraction) and expenditure-switching (tariffs, depreciation) policies. Only one option in the list is expenditure-switching and contractionary for imports.
- For a multiple-choice question, the correct answer is the one that is most clearly correct under typical economic conditions.
The Euro (€) is the main currency of the European Union. The diagram shows the exchange rate between the Euro and the US dollar.
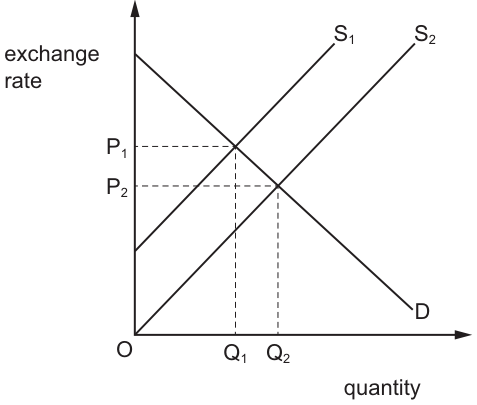
What is likely to have caused this change in the value of the Euro?
Options
A a decrease in European Union inflation
B a decrease in US interest rates
C an increase in European Union imports
D an increase in European Union unemployment
Working
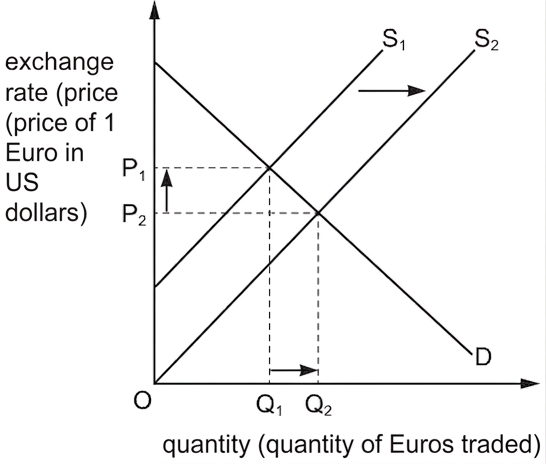
The diagram shows the exchange rate of the Euro (measured in US dollars) falling from P1 to P2, with the equilibrium quantity of Euros traded rising from Q1 to Q2. This is caused by a rightward shift in the supply curve of Euros (from S1 to S2), meaning more Euros are being supplied to the foreign exchange market.
- Option A: A decrease in EU inflation would make EU goods relatively cheaper, increasing demand for EU exports and thus demand for Euros. This would shift the demand curve for Euros right, raising the exchange rate, not lowering it. Incorrect.
- Option B: A decrease in US interest rates would make US financial assets less attractive, reducing demand for USD and increasing demand for Euros. This would shift the demand curve for Euros right, raising the Euro's exchange rate. Incorrect.
- Option C: An increase in EU imports means EU residents need to buy more US goods and services, so they must sell more Euros to obtain US dollars. This increases the supply of Euros in the foreign exchange market, shifting the supply curve right and lowering the Euro's exchange rate, matching the diagram. Correct.
- Option D: An increase in EU unemployment would reduce EU household incomes, lowering demand for imports and thus reducing the supply of Euros. This would shift the supply curve left, raising the Euro's exchange rate. Incorrect.
Answer
C
C
Background Concept
Exchange rates are the price of one currency expressed in terms of another. In a floating exchange rate system, the value of a currency is determined by the interaction of demand and supply for that currency in the foreign exchange (forex) market.
- Demand for a currency comes from foreigners who want to purchase the domestic country's exports (goods, services, or financial assets), as they need to exchange their own currency for the domestic currency to complete these transactions.
- Supply of a currency comes from domestic residents who want to buy foreign goods, services, or assets, as they need to exchange their domestic currency for the foreign currency to complete these purchases.
A rightward shift in the supply curve of a currency (as seen in the diagram for the Euro) means that more of the currency is being supplied to the forex market at every given exchange rate, which puts downward pressure on the currency's value (depreciation). A leftward shift in supply, or a rightward shift in demand, would cause the currency to appreciate (rise in value).
Understanding the Question
The question presents a diagram showing the exchange rate between the Euro (€) and the US dollar ($). The vertical axis is the exchange rate (the price of 1 Euro in US dollars), and the horizontal axis is the quantity of Euros traded. The diagram shows the supply of Euros shifting right from S1 to S2, leading to a fall in the equilibrium exchange rate from P1 to P2 (the Euro depreciates against the US dollar) and a rise in the quantity of Euros traded from Q1 to Q2.
The question asks which of the four options is the most likely cause of this change (Euro depreciation driven by increased supply of Euros). This is a 1-mark multiple-choice question testing understanding of the factors that shift the supply curve of a currency in the forex market.
Approach
To answer this, we first identify what the diagram shows: a rightward shift in the supply of Euros, causing Euro depreciation. We then evaluate each option to see which one would increase the supply of Euros, or eliminate options that cause a different shift that does not match the diagram. We can also rule out options that affect the demand for Euros instead of supply, or that would cause the Euro to appreciate rather than depreciate, as these are inconsistent with the diagram.
Step-by-Step Reasoning
- Interpret the diagram first:
The initial equilibrium is at the intersection of demand (D) and initial supply (S1), with exchange rate P1 and quantity Q1. When supply shifts right to S2, the new equilibrium is at the intersection of D and S2, with a lower exchange rate P2 (the Euro is worth fewer US dollars) and higher quantity Q2. This shift is only caused by an increase in the supply of Euros: more Euros are being sold in the forex market at every exchange rate. - Evaluate each option against this outcome:
- Option A: Decrease in European Union inflation: If EU inflation falls relative to US inflation, EU goods and services become relatively cheaper for foreign buyers. This increases demand for EU exports, so foreigners need to buy more Euros to pay for these exports. This shifts the demand curve for Euros to the right, raising the exchange rate (Euro appreciation), which is the opposite of what the diagram shows. This option is incorrect.
- Option B: Decrease in US interest rates: Lower US interest rates reduce the return on US financial assets (such as bonds or savings accounts). This makes US assets less attractive to global investors, including EU residents. EU investors will sell US assets, convert the USD they receive back to Euros, which reduces demand for USD and increases demand for Euros. This shifts the demand curve for Euros right, causing Euro appreciation, which does not match the diagram. This option is incorrect.
- Option C: Increase in European Union imports: If EU residents buy more imports from the US, they need to pay for these imports in US dollars. To get USD, they must sell Euros in the forex market, increasing the supply of Euros. This shifts the supply curve of Euros to the right, lowering the Euro's exchange rate (depreciation) and raising the quantity traded, exactly matching the diagram. This option is correct.
- Option D: Increase in European Union unemployment: Higher EU unemployment means lower household incomes in the EU, so EU residents have less money to spend on imports. This reduces the supply of Euros (as fewer Euros are sold to buy foreign goods), shifting the supply curve left. This would cause the Euro to appreciate (exchange rate rises), which is the opposite of the diagram. This option is incorrect.
Key Takeaways
- The value of a currency in a floating exchange rate system is determined by the demand and supply for that currency in the forex market.
- A rightward shift in the supply of a currency causes the currency to depreciate (fall in value), while a rightward shift in demand causes appreciation.
- Factors that increase the supply of a domestic currency include rises in domestic imports, or domestic residents wanting to invest more abroad.
- Factors that increase demand for a domestic currency include rises in foreign demand for domestic exports, or foreign investors wanting to buy domestic assets.
Common Mistakes
- Confusing shifts in demand vs supply of a currency: students often mix up whether an event affects demand (from foreigners) or supply (from domestic residents) for the currency, leading to incorrect curve shifts.
- Mixing up depreciation and appreciation: a fall in the exchange rate (as in the diagram) is depreciation of the domestic currency (the Euro here), not appreciation.
- Forgetting the direction of the shift: the diagram shows supply shifting right, so the correct cause must increase the supply of Euros, not affect demand or shift supply left.
Things to Be Careful About
- Always identify which currency the exchange rate is quoted in: here, the vertical axis is the price of 1 Euro in USD, so a fall in P means the Euro is weaker (depreciates) against the dollar.
- Link each option to the correct curve shift: for example, a change in imports affects the supply of the domestic currency, while a change in exports affects demand.
- Eliminate options that cause the opposite effect (appreciation instead of depreciation) first, as this is a quick way to narrow down the correct answer in a multiple-choice context.
Your score so far
Answer a question to start scoring
Your marks add up here as you work through the paper.