Economics 9708/11 — May/June 2025
Cambridge AS Level · AS Level Multiple Choice · answer key with instant marking and worked solutions
Topics Methods of Government Intervention in Markets · Classification of Goods and Services · International Trade and Comparative Advantage · Market Equilibrium and the Price Mechanism · Income and Wealth Inequality · Price Stability · +16 more
Tap an option under each question to check it — your score builds as you go.
Which statement about a free vaccination programme is normative?
Options
A It will help raise life expectancy.
B It is likely to improve the welfare of society.
C It will result in lower spending on other medical services.
D Tax revenues generated through improved economic activity will exceed the spending on vaccination.
Reasoning
A normative statement expresses a value judgement about what ought to be, rather than a testable fact. Option B states that vaccination 'is likely to improve the welfare of society', which is a judgement about desirability. The other options are positive statements that can be tested against evidence.
Answer
B
B
Background Concept
In economics, statements are classified as positive or normative. A positive statement is factual and can be tested against evidence – it describes what is, was, or will be. A normative statement expresses a value judgement about what ought to be – it cannot be proven true or false because it depends on personal or societal values. The distinction is fundamental to understanding economics as a social science.
Understanding the Question
The question asks which statement about a free vaccination programme is normative. It presents four options (A–D) and requires you to pick the one that contains a value judgement rather than a testable claim. Note that all options are predictions or evaluations of the programme, but only one is overtly normative.
Approach
First recall the definition of a normative statement: it includes words or phrases that imply a judgement of good/bad, desirable/undesirable, or should/should not. Then examine each option in turn, looking for such value-laden language, and reject those that make purely factual or testable claims.
Step-by-Step Reasoning
- Option A: 'It will help raise life expectancy.' This is a factual claim: we can collect data after the programme to see whether life expectancy increased. It is positive.
- Option B: 'It is likely to improve the welfare of society.' The phrase 'improve the welfare of society' is a value judgement – it asserts that the programme makes society better off, which depends on a definition of 'better' that cannot be objectively verified. This is normative.
- Option C: 'It will result in lower spending on other medical services.' This is a testable prediction: we can measure spending before and after. Positive.
- Option D: 'Tax revenues generated through improved economic activity will exceed the spending on vaccination.' This is also a factual claim about the fiscal outcome, testable with data. Positive.
Only Option B contains a value judgement, so it is the normative statement.
Key Takeaways
- Normative statements often contain words like 'should', 'ought', 'better', 'worse', 'improve', 'fair', 'just'.
- A statement can be a prediction and still be positive if it is testable, even if it includes words like 'likely'.
- Being able to distinguish positive from normative is essential for understanding the scope of economic analysis and for evaluating policy arguments.
Common Mistakes
- Mistaking a statement that evaluates an outcome as automatically normative. If the evaluation can be tested (e.g., 'raises life expectancy' can be measured), it is positive.
- Thinking that 'likely' makes a statement normative – it does not; probability is part of a testable prediction.
- Assuming that any statement about 'welfare' is positive – in economics, welfare is a normative concept when used to express a desired outcome.
Things to Be Careful About
- Read each option carefully for value-laden language. Option B uses 'improve', which signals a normative judgement in this context.
- Do not overthink – the distinction is straightforward once you identify the presence or absence of a value judgement.
- In multiple-choice questions, eliminating the three positive statements leaves the normative one.
The diagram shows the production possibility curves of two countries, X and Y.
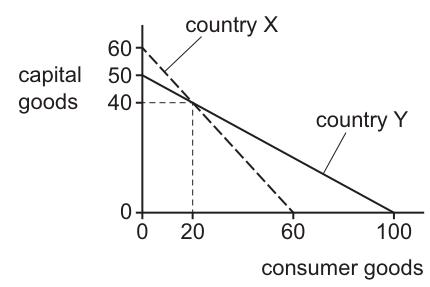
What can be concluded from the diagram?
Options
A Both countries have decreasing opportunity cost in the production of consumer goods.
B Both countries should produce 40 units of capital goods and 20 units of consumer goods.
C Country Y has constant opportunity cost in the production of consumer goods.
D Country Y is producing more consumer goods than country X.
Reasoning
- A straight-line production possibility curve (PPC) indicates constant opportunity cost, as each additional unit of one good requires the same sacrifice of the other good. Both country X and country Y have straight-line PPCs, so both have constant, not decreasing, opportunity cost. Option A is incorrect.
- The intersection of the two PPCs shows a combination of goods that both countries can produce, but it does not indicate what they "should" produce, as that depends on societal preferences and policy goals. The PPC only shows what is possible, not what is optimal. Option B is incorrect.
- Country Y's PPC is a straight line, which means it has constant opportunity cost in the production of consumer goods. This is consistent with PPC theory. Option C is correct.
- The PPC shows the maximum possible production of each good, not the actual level of production. The diagram provides no information about current production levels, so it cannot be concluded that Y is producing more consumer goods than X. Option D is incorrect.
Answer
C
C
Background Concept
A Production Possibility Curve (PPC) is a fundamental economic model that illustrates the maximum possible output combinations of two goods an economy can produce with its existing resources and technology, assuming all resources are fully and efficiently employed, and there is no increase in the quantity or quality of resources over time. The shape of the PPC reveals the nature of opportunity cost, which is the value of the next best alternative forgone when a choice is made to produce more of one good.
A straight-line (linear) PPC indicates constant opportunity cost. This occurs when resources are perfectly substitutable between the production of the two goods, meaning each additional unit of one good requires giving up exactly the same amount of the other good. A concave (bowed out from the origin) PPC, the most common real-world shape, indicates increasing opportunity cost: as more of one good is produced, increasingly larger amounts of the other good must be sacrificed, because resources are not equally well-suited to producing both goods. A convex (bowed in towards the origin) PPC would indicate decreasing opportunity cost, which is rare in practice.
It is also important to distinguish between the PPC, which shows the maximum possible production combinations, and actual production, which may occur at any point inside the curve (indicating inefficient use of resources, such as unemployment) or on the curve (indicating efficient use of all resources).
Understanding the Question
The question presents a PPC diagram for two countries, X and Y, with capital goods plotted on the vertical axis and consumer goods on the horizontal axis. Both countries have straight-line PPCs that intersect at the point representing 20 units of consumer goods and 40 units of capital goods. The question asks which conclusion can be validly drawn from this diagram. The four options test understanding of PPC shape and opportunity cost, the meaning of points on the PPC, and the distinction between maximum possible and actual production. The correct answer must be fully consistent with PPC theory and the information provided in the diagram.
Approach
To solve this multiple-choice question, we will evaluate each option against core PPC concepts, eliminating incorrect options one by one:
- First, recall what the shape of a PPC tells us about the type of opportunity cost.
- Assess each option for consistency with the diagram and established economic theory.
- Select the option that is fully supported by the evidence and theory.
Step-by-Step Reasoning
We evaluate each option in turn:
- Option A: Both countries have decreasing opportunity cost in the production of consumer goods.
Decreasing opportunity cost would be represented by a convex (bowed in) PPC. Both country X and country Y have straight-line PPCs, which indicate constant, not decreasing, opportunity cost. Therefore, option A is incorrect. - Option B: Both countries should produce 40 units of capital goods and 20 units of consumer goods.
The intersection point of the two PPCs is a combination of goods that both countries are capable of producing (it lies on both PPCs). However, the PPC is a positive model that shows what is possible, not a normative prescription for what a country should produce. The optimal production point depends on societal preferences, policy priorities, and other factors not shown in the diagram. Therefore, option B is incorrect. - Option C: Country Y has constant opportunity cost in the production of consumer goods.
Country Y's PPC is a straight line. By definition, a straight-line PPC indicates constant opportunity cost: each additional unit of consumer goods produced requires giving up the same fixed amount of capital goods. For country Y, the maximum production is 100 units of consumer goods or 50 units of capital goods, so the opportunity cost of 1 unit of consumer goods is 50/100 = 0.5 units of capital goods, which is constant at all points along the PPC. This is fully consistent with PPC theory, so option C is correct. - Option D: Country Y is producing more consumer goods than country X.
The PPC shows the maximum possible output of each good, not the actual level of production. The diagram provides no information about where either country is currently producing relative to its PPC. It is possible that country X is producing more consumer goods than Y, even though Y's maximum possible consumer goods production is higher. Therefore, option D is incorrect.
Key Takeaways
- The shape of a PPC directly reveals the type of opportunity cost: straight line = constant, concave = increasing, convex = decreasing.
- The PPC shows the maximum possible production combinations, not what a country should produce or what it is actually producing.
- Points on the PPC represent efficient production, points inside represent inefficient production, and points outside are unattainable with current resources and technology.
Common Mistakes
- Confusing PPC shapes with opportunity cost types: students often mix up concave (increasing opportunity cost) and convex (decreasing opportunity cost) shapes, or incorrectly assume all PPCs are bowed out.
- Treating the PPC as a normative tool: the PPC only shows what is possible, not what a country should do. Options that use normative language like "should" are almost always incorrect in PPC questions unless paired with explicit information about preferences.
- Confusing maximum possible production with actual production: the PPC does not indicate current output levels, so any claim about actual production cannot be supported by the diagram alone.
Things to Be Careful About
- Always start by identifying the shape of the PPC when answering questions about opportunity cost, as this is the key determinant of the opportunity cost type.
- Distinguish between positive statements (what is true) and normative statements (what ought to be). The PPC only provides positive information about production possibilities.
- Never assume that a higher maximum production of a good means the country is actually producing more of that good — actual production can be at any point inside or on the PPC.
Which goods are least likely to be allocated by market forces in a mixed economy?
Options
A hospitals
B railways
C street lighting
D television programmes
Answer
Street lighting is a pure public good because it is both non-excludable (once provided, no one can be prevented from benefiting) and non-rivalrous (one person's use does not reduce the amount available for others). These characteristics create a free-rider problem, meaning the market would fail to provide street lighting at a socially optimal level. In a mixed economy, the government typically provides such goods. Hospitals, railways, and television programmes can all be provided through market forces to varying degrees because they are excludable and rivalrous, so they are more likely to be allocated by the market.
C
C
Background Concept
This question tests the classification of goods and services, specifically the distinction between private goods, public goods, merit goods, and demerit goods. A pure public good has two key characteristics:
- Non-excludability: Once the good is provided, it is impossible or very costly to prevent anyone from consuming it, even if they have not paid.
- Non-rivalry (non-diminishability): One person's consumption of the good does not reduce the amount available for others.
Because of these features, private firms cannot charge a price for the good and earn a profit, leading to under-provision or zero provision by the market. This is the free-rider problem: individuals can benefit without paying, so they have no incentive to pay, and the market fails to produce the efficient quantity.
Understanding the Question
The question asks: "Which goods are least likely to be allocated by market forces in a mixed economy?" A mixed economy has both private sector (market) and public sector (government) provision. The answer is the good that is most difficult for the market to provide efficiently. The options are all goods that are commonly provided by both sectors, but one stands out as a classic public good that is almost always provided by the government.
Approach
Evaluate each option against the characteristics of excludability and rivalry. The good that is clearly non-excludable and non-rivalrous is the least likely to be allocated by market forces. The others have varying degrees of excludability and rivalry, so they can be (and often are) provided by the market.
Step-by-Step Reasoning
- Hospitals: These are rivalrous (a bed used by one patient cannot be used by another) and excludable (hospitals can refuse treatment to those who cannot pay). In many countries, private hospitals exist alongside public ones. So hospitals are often allocated by market forces.
- Railways: While railways have high fixed costs, they are excludable (ticket barriers) and rivalrous (a seat is occupied by one person). Private railway companies operate in many mixed economies, so market forces play a role.
- Street lighting: This is the classic example of a public good. Once a street light is installed, it is impossible to exclude anyone from benefiting (non-excludable). Also, one person's use of the light does not diminish its availability for others (non-rivalrous). Therefore, private firms cannot charge a price for the service, so the market will not provide street lighting. The government must provide it.
- Television programmes: These can be either public or private. Free-to-air broadcasts are non-excludable and non-rivalrous, but subscription or pay-per-view TV is excludable (through encryption). The market can and does provide television programmes through advertising or subscription models. So they are not the least likely to be allocated by market forces.
Thus, street lighting is the correct answer.
Key Takeaways
- Understand the definitions of public goods: non-excludability and non-rivalry.
- Recognise the free-rider problem and why the market fails to provide public goods.
- Be able to classify goods based on these characteristics to determine whether they are likely to be provided by the market or the government.
Common Mistakes
- Confusing merit goods (e.g., healthcare) with public goods. Healthcare is rivalrous and excludable, so it is a private good that may be under-consumed due to imperfect information, but it is not a pure public good.
- Thinking that any good provided by the government must be a public good. The government may also provide merit goods or private goods for equity reasons, but those goods could still be allocated by market forces.
- Assuming that if a good is non-excludable, it is automatically a public good. Both non-excludability and non-rivalry are required for a pure public good.
Things to Be Careful About
- Read the question carefully: it asks for the good "least likely" to be allocated by market forces. You need to identify the one that is most clearly a public good.
- Remember that in a mixed economy, the government may provide goods that are not public goods (e.g., public hospitals), but the market also provides them. The question is about the likelihood of market allocation, not about actual provision.
- Do not overcomplicate: street lighting is the textbook example of a public good.
In 2020, there was a worldwide pandemic. High-income countries quickly developed a vaccine. Low-income countries built high-tech factories to manufacture large quantities of the vaccine for export.
What explains this international division of labour?
Options
| high-income countries | low-income countries | |
|---|---|---|
| A | availability of specialists in research and development | lower costs of production |
| B | scarce human resources | over-supply of unskilled labour |
| C | many people tended to avoid the disease | many people tended to catch the disease |
| D | no government control over resource allocation | strict government control over resource allocation |
Reasoning
The international division of labour described is explained by comparative advantage. High-income countries have a comparative advantage in research and development due to their abundance of skilled labour and capital, enabling them to develop the vaccine. Low-income countries have a comparative advantage in manufacturing due to lower labour costs, making it cheaper to produce the vaccine in large quantities. Option A correctly identifies these underlying factor endowments: high-income countries have the availability of specialists in R&D, while low-income countries have lower costs of production.
Answer
A
A
Background Concept
The international division of labour refers to the specialisation of countries in producing particular goods or services for export. The theory of comparative advantage, developed by David Ricardo, explains that countries benefit from specialising in the production of goods where they have a lower opportunity cost, even if one country is more efficient at producing everything. This specialisation is driven by differences in factor endowments: the quantity and quality of land, labour, capital, and enterprise available in each country. High-income countries typically have abundant skilled labour, advanced technology, and capital, giving them a comparative advantage in high-tech, knowledge-intensive activities like research and development. Low-income countries often have abundant unskilled labour and lower wage costs, giving them a comparative advantage in labour-intensive manufacturing.
Understanding the Question
The question presents a scenario: during a pandemic, high-income countries developed a vaccine, while low-income countries built factories to manufacture it for export. The question asks for the economic explanation of this division of labour. The four options present different pairs of reasons for each country group. The correct answer must be consistent with the theory of comparative advantage and the factor endowments implied by the scenario. Option A states that high-income countries have 'availability of specialists in research and development' and low-income countries have 'lower costs of production'. This matches the comparative advantage explanation: high-income countries specialise in R&D because they have the skilled labour, while low-income countries specialise in manufacturing because they have lower labour costs.
Approach
- Identify the key economic concept: the international division of labour is explained by comparative advantage, which is based on differences in factor endowments.
- Analyse each option to see if it correctly identifies the factor endowments that would lead to the specialisation described.
- Eliminate options that are factually incorrect, irrelevant, or inconsistent with the theory.
Step-by-Step Reasoning
- Identify the specialisation pattern: High-income countries developed the vaccine (R&D). Low-income countries manufactured it (production).
- Apply comparative advantage: This pattern suggests that high-income countries have a comparative advantage in R&D, while low-income countries have a comparative advantage in manufacturing.
- Determine the underlying factor endowments:
- R&D requires highly skilled labour (scientists, researchers) and capital (laboratories, equipment). High-income countries have more of these resources.
- Manufacturing, especially of a standardised product like a vaccine, can be done with less skilled labour. Low-income countries have lower wage costs, giving them a cost advantage in production.
- Evaluate each option:
- A: 'Availability of specialists in research and development' (high-income) and 'lower costs of production' (low-income). This correctly identifies the factor endowments. High-income countries have the specialists; low-income countries have lower costs. This is the correct answer.
- B: 'Scarce human resources' (high-income) and 'over-supply of unskilled labour' (low-income). High-income countries do not typically have scarce human resources; they have abundant skilled labour. 'Over-supply of unskilled labour' is a possible description of low-income countries, but 'scarce human resources' is not accurate for high-income countries. This option is incorrect.
- C: 'Many people tended to avoid the disease' (high-income) and 'many people tended to catch the disease' (low-income). This describes the impact of the disease, not the reason for the division of labour. It is irrelevant to the economic explanation. This option is incorrect.
- D: 'No government control over resource allocation' (high-income) and 'strict government control over resource allocation' (low-income). This describes economic systems, not the reason for specialisation. The scenario does not provide information about government control. This option is incorrect.
Key Takeaways
- The international division of labour is explained by comparative advantage, which is based on differences in factor endowments.
- High-income countries tend to specialise in knowledge-intensive activities (R&D) due to their abundance of skilled labour and capital.
- Low-income countries tend to specialise in labour-intensive manufacturing due to their lower labour costs.
- When answering multiple-choice questions, apply the relevant economic theory to the scenario and evaluate each option against the theory.
Common Mistakes
- Choosing option B: A student might think that 'scarce human resources' in high-income countries leads them to focus on R&D, but this is incorrect. High-income countries have abundant skilled labour, not scarce human resources. The term 'scarce' is misleading in this context.
- Choosing option C: A student might focus on the descriptive aspect of the scenario (who got sick) rather than the economic reason for specialisation. This is a common error: answering the 'story' rather than the economic question.
- Choosing option D: A student might associate low-income countries with more government control, but this is a stereotype and not necessarily true. The scenario does not provide information about government control, so this option is not supported.
Things to Be Careful About
- Read the question carefully: it asks for the explanation of the international division of labour, not a description of the events.
- Apply the correct economic theory: comparative advantage, not absolute advantage or other concepts.
- Focus on the factor endowments that lead to specialisation, not on the outcomes or other irrelevant details.
- Evaluate each option systematically, eliminating those that are factually incorrect or irrelevant.
How can a public good become a private good?
Options
A Consumers are dissatisfied with the performance of state-run services.
B New technological developments make the good excludable.
C The government privatises the industry producing the good.
D The price of the good increases so it becomes more profitable.
Answer
A public good is defined by non-excludability and non-rivalry. For a public good to become a private good, it must become excludable. New technological developments can make a good excludable, for example, by enabling encryption or subscription access. This transforms the good into one that can be provided by the market as a private good, allowing producers to charge a price and exclude non-payers. Therefore, option B is correct.
B
Background Concept
A public good is a good that is both non-rival and non-excludable. Non-rival means that one person's consumption does not reduce the amount available for others. Non-excludable means that it is impossible or very costly to prevent anyone from consuming the good, even if they have not paid. This leads to the free-rider problem, where individuals have an incentive to consume without paying, making it unprofitable for private firms to provide the good. Private goods, in contrast, are both rival and excludable. Excludability is the key condition for a good to be provided by the market, as firms can charge a price and exclude non-payers.
Understanding the Question
This question asks: 'How can a public good become a private good?' It is testing your understanding of the defining characteristics of public and private goods. The correct answer must identify a change that makes the good excludable (and possibly rival, but rivalry is less relevant). The options are:
- A: Consumers are dissatisfied with the performance of state-run services. (Dissatisfaction does not change the nature of the good.)
- B: New technological developments make the good excludable. (This directly addresses the non-excludability condition.)
- C: The government privatises the industry producing the good. (Privatisation changes the provider but not the inherent characteristics of the good.)
- D: The price of the good increases so it becomes more profitable. (Price increase does not change the nature; if the good is still non-excludable, people can free-ride.)
Approach
To answer this, recall the definition of a public good: non-excludable and non-rival. To become a private good, the good must become excludable. Therefore, look for the option that leads to excludability. Option B is the only one that directly provides a means to make the good excludable. Technological developments such as encryption, toll booths, or subscription systems can make previously non-excludable goods excludable.
Step-by-Step Reasoning
- Define a public good: non-excludable and non-rival.
- Define a private good: excludable and rival.
- The transformation from public to private requires the good to become excludable. Rivalry is often inherent, but excludability is the key change.
- Option B states that new technological developments make the good excludable. This is a valid way: e.g., over-the-air television broadcasts were public goods, but encryption technology (cable, satellite) made them excludable. Roads are public goods, but electronic tolling makes them excludable.
- Option A: Consumer dissatisfaction does not change the good's characteristics; it may lead to privatisation, but that alone does not make the good excludable.
- Option C: Privatisation changes ownership but not the nature. If the good remains non-excludable (e.g., clean air), the private firm cannot charge consumers.
- Option D: Price increase assumes the good can be sold, but if it is non-excludable, consumers will still free-ride, so the firm cannot charge a price.
- Therefore, only option B correctly identifies a mechanism that can turn a public good into a private good.
Key Takeaways
- The defining characteristics of a public good are non-excludability and non-rivalry.
- To become a private good, the good must become excludable.
- Technology can solve the non-excludability problem, allowing market provision.
- Privatisation or price changes alone cannot overcome the non-excludability issue.
Common Mistakes
- Choosing option C (privatisation) because of confusion between ownership and the nature of the good. Even if the government privatises the industry, if the good remains non-excludable, it cannot be profitably provided by the private sector.
- Thinking that a price increase (option D) makes a good private because it becomes profitable. But without excludability, the firm cannot enforce payment.
- Not understanding that the free-rider problem is caused by non-excludability, not by government provision.
Things to Be Careful About
- Remember that public goods are defined by their characteristics, not by who provides them. A good provided by the government is not necessarily a public good (e.g., education is a merit good, not a pure public good).
- Excludability is the crucial condition for market provision. Consider whether the good can be withheld from non-payers.
- Technological change can alter the excludability of a good, but it does not change rivalry. However, the question specifically asks about becoming a private good, which requires both excludability and rivalry. But the key is excludability.
- In the context of this question, the answer is clear: technology can make a good excludable.
What is not a function of the price mechanism?
Options
A to act as a signal to firms when allocating resources
B to maximise consumer surplus
C to provide an incentive to firms to produce goods
D to ration scarce resources
Reasoning
The three functions of the price mechanism are the signalling function, the incentive function, and the rationing function. Maximising consumer surplus is not a function of the price mechanism; it is a possible outcome of a competitive market, but not a purpose or function of the price mechanism itself.
Answer
B
B
Background Concept
The price mechanism is the system through which the forces of demand and supply determine prices in a market economy. It performs three core functions in allocating scarce resources:
- Signalling function – Prices signal to producers what consumers want. A rise in price signals that demand has increased relative to supply, encouraging producers to allocate more resources to that good.
- Incentive function – Higher prices provide an incentive for firms to increase production (to earn more profit), and for consumers to reduce consumption or switch to substitutes.
- Rationing function – When a good is scarce, a higher price rations the limited supply to those consumers who are willing and able to pay the most, thereby allocating the good to its most valued uses.
Consumer surplus is the difference between what consumers are willing to pay and what they actually pay. It is a measure of consumer welfare, not a function of the price mechanism. While the price mechanism can affect the size of consumer surplus, maximising it is not one of its purposes.
Understanding the Question
This is a multiple-choice question asking which of the four options is not a function of the price mechanism. Three of the options are the standard functions taught in the syllabus; one is a possible outcome or benefit of markets but not a function itself. The question tests recall of the three functions and the ability to distinguish a function from a consequence.
Approach
Recall the three functions of the price mechanism: signalling, incentive, and rationing. Check each option against this list. Option B, "to maximise consumer surplus," is not on the list and is therefore the correct answer.
Step-by-Step Reasoning
- Option A: "to act as a signal to firms when allocating resources" – This is the signalling function. Correct.
- Option C: "to provide an incentive to firms to produce goods" – This is the incentive function. Correct.
- Option D: "to ration scarce resources" – This is the rationing function. Correct.
- Option B: "to maximise consumer surplus" – Consumer surplus is a measure of benefit to consumers. The price mechanism does not aim to maximise it; in fact, a monopolist might use the price mechanism to reduce consumer surplus. This is not a function of the price mechanism.
Therefore, B is the correct answer.
Key Takeaways
- The three functions of the price mechanism are signalling, incentive, and rationing.
- Consumer surplus is an outcome or measure of welfare, not a function of the price mechanism.
- Be careful to distinguish between what a mechanism does (its functions) and what may happen as a result (its effects).
Common Mistakes
- Confusing a possible benefit of markets (like maximising consumer surplus) with a function of the price mechanism. The price mechanism can lead to consumer surplus, but that is not its purpose.
- Forgetting one of the three functions and guessing incorrectly.
Things to Be Careful About
- The question asks for what is not a function. Read carefully to avoid selecting a function by mistake.
- The three functions are standard and should be memorised for multiple-choice questions.
Cars and petrol (gasoline) are in joint demand.
What is the effect of an increase in the price of cars on the demand for petrol?
Options
Answer
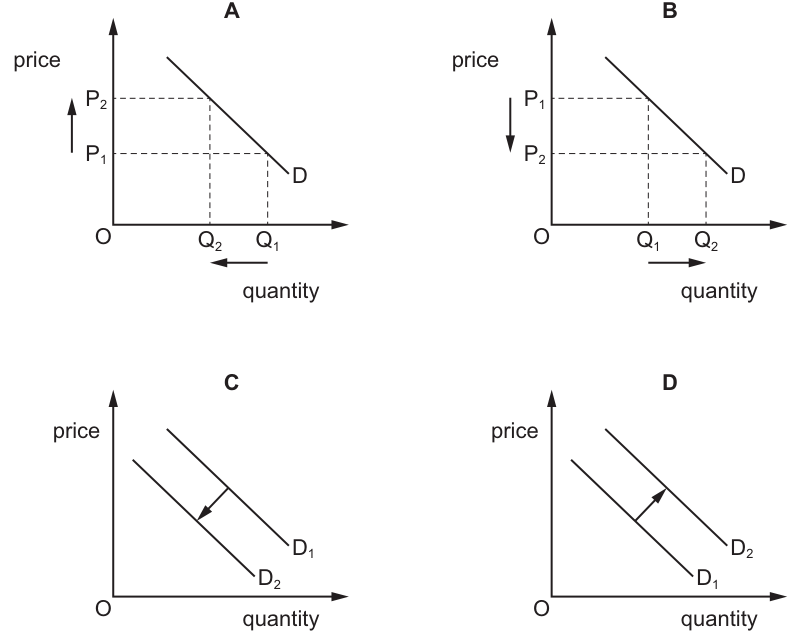
Cars and petrol are in joint demand, meaning they are complementary goods consumed together. When the price of cars increases, the quantity demanded of cars falls. Because petrol is used with cars, the demand for petrol decreases. This is represented by a leftward shift of the demand curve from D1 to D2, which is shown in Diagram C.
C
Background Concept
Joint demand describes the relationship between two goods that are consumed together, known as complements (for example, cars and petrol, or printers and ink cartridges). The demand for a complement is inversely related to the price of the other good: if the price of one rises, the demand for the other falls. It is essential to distinguish between a movement along a demand curve, which is caused by a change in the price of the good itself, and a shift of the demand curve, which is caused by a change in a non-price determinant of demand—such as the price of a related good, income, or tastes.
Understanding the Question
The question states that cars and petrol are in joint demand and asks what happens to the demand for petrol when the price of cars increases. This requires applying the theory of complementary goods to determine the direction of the shift in the demand curve for petrol, and then selecting the diagram that correctly illustrates this shift.
Approach
- Identify the market relationship: joint demand means the goods are complements.
- Determine the effect of the price increase: a higher price for cars reduces the quantity of cars demanded.
- Trace the knock-on effect: fewer cars on the road reduces the need for petrol, so the demand for petrol falls.
- Translate to diagram form: a fall in demand is shown by a leftward shift of the demand curve.
- Match to the options: select the diagram showing a leftward shift from D1 to D2.
Step-by-Step Reasoning
- Joint demand: Cars and petrol are complements. They are jointly demanded because petrol is necessary to operate a car.
- Effect of the car price rise: When the price of cars increases, consumers buy fewer cars. This is a movement up along the demand curve for cars (from a lower price and higher quantity to a higher price and lower quantity).
- Effect on petrol demand: Because the two goods are used together, the reduction in car purchases reduces the need for petrol. At any given price of petrol, consumers now wish to purchase less petrol than before. This constitutes a decrease in the demand for petrol.
- Diagrammatic representation: A decrease in demand is shown by a leftward shift of the demand curve. The original demand curve is D1; the new demand curve is D2, positioned to the left of D1.
- Evaluating the options:
- Diagram A shows a movement up along the demand curve (price rises, quantity falls). This would illustrate the effect on the quantity demanded of cars, not the demand for petrol.
- Diagram B shows a movement down along the demand curve (price falls, quantity rises). This is incorrect for both markets in this scenario.
- Diagram C shows a leftward shift of the demand curve from D1 to D2. This correctly represents a decrease in demand for petrol.
- Diagram D shows a rightward shift from D1 to D2. This would represent an increase in demand, which would occur if cars and petrol were substitutes or if the price of cars had fallen.
- Conclusion: Diagram C is the correct answer.
Key Takeaways
- Joint demand identifies complementary goods.
- A change in the price of one complement causes a shift in the demand curve for the other, not a movement along the demand curve for the first good.
- An increase in the price of a complement reduces demand for the related good (leftward shift).
- Always distinguish between a change in quantity demanded (movement along the curve) and a change in demand (shift of the curve).
Common Mistakes
- Confusing joint demand with substitute goods. For substitutes, a price increase in one good raises demand for the other (rightward shift).
- Selecting Diagram A or B, which show movements along the demand curve. These would be relevant if the question asked about the effect of a petrol price change on the quantity demanded of petrol, but not for the effect of a car price change on the demand for petrol.
- Selecting Diagram D, which shows an increase in demand. This would be correct if cars and petrol were substitutes, or if car prices had fallen rather than risen.
Things to Be Careful About
- The question asks about the effect on the demand for petrol, not the quantity demanded of cars. This signals that we are looking for a shift in the demand curve for petrol, not a movement along the demand curve for cars.
- Ensure the direction of the shift is correct: higher car price -> fewer cars purchased -> less petrol needed -> lower demand for petrol -> leftward shift.
- In Diagram C, the arrow points from D1 to D2 (leftward/downward), indicating a decrease in demand.
What would best explain why the price elasticity of supply (PES) is likely to be lower for fresh vegetables grown within a country compared to the PES of goods manufactured in that country?
Options
A Alternative supplies can be flown in from foreign producers.
B A positive price change encourages a positive output change along the supply curve.
C Fresh vegetables has a horizontal supply curve.
D There is a seasonal time lag involved in planting and harvesting more fresh vegetables.
The price elasticity of supply (PES) measures the responsiveness of quantity supplied to a change in price. A lower PES means supply is less responsive. Fresh vegetables take time to grow and cannot be quickly increased in response to a price rise due to seasonal planting and harvesting cycles. This time lag makes PES lower. In contrast, manufactured goods can often be produced more quickly by adjusting production processes. Therefore, option D is correct.
Answer
D
D
Background Concept
Price elasticity of supply (PES) measures the responsiveness of quantity supplied to a change in price, calculated as the percentage change in quantity supplied divided by the percentage change in price. A low PES means supply is relatively inelastic: producers cannot or will not change output much when price changes. Factors affecting PES include the time period considered (short run vs long run), the availability of raw materials and spare capacity, the complexity of production, the ability to store goods, and the length of the production process. For agricultural goods, biological time lags (planting, growing, harvesting) often make supply inelastic in the short run.
Understanding the Question
The question asks why fresh vegetables grown within a country are likely to have a lower PES compared to manufactured goods. The key is to identify a factor that specifically reduces the responsiveness of supply for fresh vegetables but not for manufactured goods. The four options present possible explanations: A points to alternative supplies from abroad, B is a general statement about supply, C claims vegetables have a horizontal supply curve, and D mentions a seasonal time lag. The correct answer must be the one that best explains the lower PES.
Approach
First, recall the factors that make supply inelastic: long production time, limited storage, fixed inputs. Fresh vegetables are seasonal, so they cannot be grown instantly; there is a natural time lag. This reduces PES. Manufactured goods can often be produced more quickly by using overtime, additional shifts, or already available inputs. Option D directly states this time lag. Options A, B, and C do not provide a valid explanation: A would actually increase PES (alternative supplies make supply more elastic), B is a true statement but does not explain why vegetables are less elastic, and C is factually incorrect (vegetables do not have a horizontal supply curve; a horizontal supply curve implies perfectly elastic supply, which is the opposite of lower PES).
Step-by-Step Reasoning
-
Define PES and its determinants: PES = % change in Qs / % change in P. A low PES means supply is unresponsive. Key determinant: time period. Longer time to adjust supply -> lower PES.
-
Apply to fresh vegetables: Fresh vegetables grow in specific seasons. If price rises, farmers cannot immediately increase supply because they must wait for the next planting and harvest cycle. This time lag makes short-run supply inelastic. Even if they plant more now, the supply will only increase after several months. So PES is low.
-
Apply to manufactured goods: For many manufactured goods, firms can increase production in the short run by using more variable inputs (e.g., hiring more workers, running extra shifts, using existing machinery). This flexibility makes PES higher.
-
Evaluate each option:
- A: Alternative supplies from foreign producers would increase the overall supply elasticity for the domestic market (because there is a substitute source). This would make the combined supply more elastic, not less. So this does not explain why the domestic supply of fresh vegetables is less elastic.
- B: This is a general property of supply: higher price leads to higher quantity supplied. It does not differentiate between vegetables and manufactured goods, and does not explain why one is less elastic than the other.
- C: A horizontal supply curve implies PES = infinity (perfectly elastic). This is the opposite of low PES. Vegetables do not have a horizontal supply curve; they have a typical upward-sloping supply curve, but with a steeper slope in the short run due to inelasticity.
- D: The seasonal time lag is a specific reason why fresh vegetables cannot be supplied quickly in response to price changes. This directly explains the lower PES.
-
Conclusion: Option D is the best explanation.
Key Takeaways
- Time period is a crucial determinant of PES: the longer the time allowed, the more elastic supply becomes.
- Agricultural products often have low PES in the short run because of biological production lags.
- When evaluating multiple-choice options, always check whether the option actually explains the phenomenon in the direction asked (lower, not higher, elasticity).
- Distinguish between factors that increase elasticity (e.g., alternative supplies, good storage) and those that decrease it (e.g., long production time, limited capacity).
Common Mistakes
- Choosing option A because it sounds plausible: alternative supplies make supply more elastic, not less. Students may confuse the idea of "alternative" with "limited" options.
- Confusing a horizontal supply curve (perfectly elastic) with an inelastic supply curve (vertical or steep). Option C is a common distractor for those who misremember the shapes.
- Selecting option B because it is a true statement about supply, but failing to see that it does not address the comparative question.
- Not considering the specific context of "fresh vegetables grown within a country" – the domestic focus means that imported alternatives are not part of the domestic supply, so option A is irrelevant.
Things to Be Careful About
- Read the question exactly: it asks why PES is "likely to be lower" for fresh vegetables. The explanation must be a factor that reduces PES.
- Remember that the law of supply (positive relationship between price and quantity supplied) is always true, but it does not explain differences in elasticity.
- Be precise about the shape of supply curves: a horizontal supply curve means perfectly elastic, not inelastic.
- When comparing two goods, the explanation must be specific to one good relative to the other. "Time lag" is specific to vegetables, not to all goods.
- In an MCQ, eliminate options that are false or irrelevant, then choose the one that directly and correctly addresses the question.
The diagram shows the demand for and supply of a product.
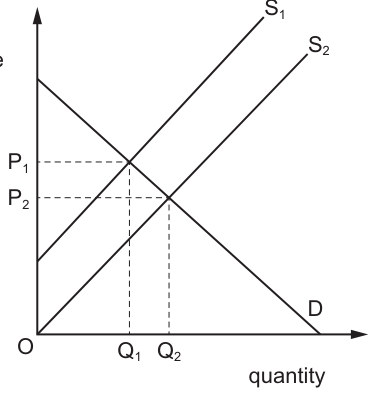
What could cause supply to shift from S1 to S2?
Options
A a fall in the price of the product
B a fall in labour costs
C a rise in the price of the product
D a rise in labour costs
Answer
The diagram shows the supply curve shifting to the right from S1 to S2, which is an increase in supply. This is caused by a change in a non-price determinant of supply, not by a change in the price of the product itself.
- A fall in the price of the product (Option A) would cause a movement down along the supply curve, not a shift.
- A rise in the price of the product (Option C) would cause a movement up along the supply curve, not a shift.
- A rise in labour costs (Option D) would increase production costs and shift supply to the left.
- A fall in labour costs (Option B) reduces firms' costs of production. At every price, firms are willing and able to supply more, so supply increases and the curve shifts right from S1 to S2.
B
B
Background Concept
In market analysis, the supply curve shows the relationship between the price of a product and the quantity that firms are willing and able to supply, ceteris paribus. It is crucial to distinguish between a movement along the supply curve and a shift of the supply curve. A movement along the curve is caused solely by a change in the price of the product itself. By contrast, a shift of the entire curve is caused by a change in any other determinant of supply — such as changes in the costs of production (including wages, raw materials, and energy), advances in technology, taxes, subsidies, or the number of firms in the market. When production costs fall, firms can profitably supply more at any given price, so supply increases and the curve shifts to the right. When production costs rise, supply decreases and the curve shifts to the left.
Understanding the Question
The question presents a standard demand and supply diagram. The supply curve has shifted from S1 to S2, which is a shift to the right. This represents an increase in supply — at every price level, a greater quantity is supplied. The question asks which of the four options could have caused this specific shift. The options include two changes in the price of the product itself (A and C) and two changes in labour costs (B and D).
Approach
The correct approach is to apply the distinction between movements along and shifts of the supply curve:
- Eliminate any option that describes a change in the price of the product itself, because such a change causes a movement along the existing supply curve, not a shift.
- For the remaining options involving labour costs, determine the direction of the effect. Labour is a factor of production; a change in its cost affects firms' overall production costs.
- Match the direction of the effect to the diagram: a rightward shift (S1 to S2) requires an increase in supply, which is caused by a fall in production costs.
Step-by-Step Reasoning
Option A: A fall in the price of the product
If the market price falls, firms move down along their existing supply curve, reducing the quantity supplied. This is a contraction of supply (a movement), not a shift of the curve. Therefore, this cannot explain the shift from S1 to S2.
Option C: A rise in the price of the product
If the market price rises, firms move up along their existing supply curve, increasing the quantity supplied. This is an extension of supply (a movement), not a shift. Therefore, this cannot explain the shift from S1 to S2.
Option D: A rise in labour costs
Labour is a key factor of production. If wages or other labour costs rise, the cost of producing each unit increases. Firms will supply less at every price, so supply decreases and the curve shifts to the left (from S2 toward S1). This is the opposite of what the diagram shows.
Option B: A fall in labour costs
If labour costs fall, the cost of production decreases. Firms can now afford to supply more output at any given price, or equivalently, they can supply the same quantity at a lower price. This represents an increase in supply, shifting the supply curve to the right from S1 to S2. This matches the diagram exactly.
Key Takeaways
- A change in the price of the good causes a movement along the supply curve.
- A change in a non-price determinant (such as input costs, technology, or the number of sellers) causes a shift of the entire supply curve.
- Lower production costs shift supply to the right (increase); higher costs shift supply to the left (decrease).
- Always check the direction of the shift in the diagram before selecting the cause.
Common Mistakes
- Confusing movements with shifts: Many students incorrectly select options A or C, forgetting that the price of the product itself never shifts the supply curve.
- Reversing the direction: Some students know that labour costs affect supply but get the direction wrong, selecting D (rise in costs) instead of B (fall in costs).
- Ignoring the diagram: The diagram clearly shows a rightward shift (increase in supply). Any option that would decrease supply must be rejected.
Things to Be Careful About
- Ensure you read the diagram carefully: S1 to S2 is a rightward shift, meaning supply has increased.
- Labour costs are a component of firms' variable costs; treat them as a determinant of supply, not demand.
- In multiple-choice questions, eliminate the two options that refer to the product's own price first, as these are definitely incorrect. Then evaluate the remaining two based on the direction of the shift.
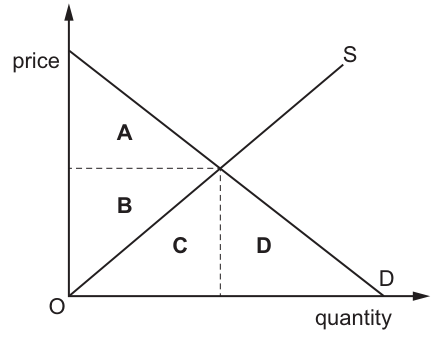
The diagram shows the demand for and supply of a product.
Which area shows producer surplus?
Options
A area A on Fig. 10.1
B area B on Fig. 10.1
C area C on Fig. 10.1
D area D on Fig. 10.1
Producer surplus is the difference between the market price received by producers and the minimum price they are willing to accept, as shown by the supply curve. It is represented by the area above the supply curve and below the equilibrium price.
On the diagram, area B is the only area that lies above the supply curve (S) and below the equilibrium price line.
Answer
B
B
Background Concept
Producer surplus is a measure of producer welfare in a market. It represents the difference between the price that producers actually receive for a good and the minimum price they would be willing to accept. The supply curve reflects the marginal cost of production, which indicates the minimum price necessary to induce producers to supply each unit. Therefore, for every unit sold, the vertical distance between the market price and the supply curve represents the surplus enjoyed by the producer of that unit. Summed over all units sold, this forms a triangular area.
Consumer surplus, by contrast, is the difference between the price consumers are willing to pay (shown by the demand curve) and the price they actually pay. It is the area below the demand curve and above the equilibrium price.
Market equilibrium occurs where the demand and supply curves intersect, determining the equilibrium price and quantity traded.
Understanding the Question
The question presents a standard demand and supply diagram with price on the vertical axis and quantity on the horizontal axis. The upward-sloping supply curve (S) and downward-sloping demand curve (D) intersect to determine equilibrium. Four areas are labelled: A, B, C and D. The task is to identify which area represents producer surplus.
This requires applying the definition of producer surplus to the geometry of the diagram: locating the region bounded above by the equilibrium price, below by the supply curve, and on the right by the equilibrium quantity.
Approach
Recall the precise definition: producer surplus is the area above the supply curve and below the market price, up to the quantity sold. Then examine each labelled area:
- Area A is below the demand curve and above the price line. This is consumer surplus.
- Area B is above the supply curve and below the price line. This matches the definition of producer surplus.
- Area C is below the supply curve. This represents the total variable cost of producing the equilibrium quantity, not surplus.
- Area D is to the right of the equilibrium quantity, below the demand curve. This area is not part of the actual market transaction at equilibrium.
Step-by-Step Reasoning
-
Identify the supply curve: The line labelled S slopes upward from the origin, reflecting increasing marginal cost as output rises.
-
Identify the equilibrium price: The horizontal dashed line at the intersection of D and S represents the market price that clears the market.
-
Apply the definition of producer surplus: For each unit from 0 to the equilibrium quantity, producers receive the equilibrium price but were willing to supply at a lower cost (the height of the supply curve). The difference accumulates as the triangular area between the price line and the supply curve.
-
Locate area B: This triangle is bounded above by the equilibrium price, below by the supply curve S, and on the right by the equilibrium quantity. This is exactly the region described.
-
Confirm by elimination: Area A belongs to consumers; area C belongs to producers as cost, not surplus; area D is outside the traded quantity. Only B fits the definition.
Key Takeaways
- Producer surplus is always the area above the supply curve and below the market price.
- Consumer surplus is always the area below the demand curve and above the market price.
- The supply curve represents marginal cost; the gap between price and marginal cost is the per-unit surplus.
- Total economic welfare is the sum of consumer surplus and producer surplus.
Common Mistakes
- Confusing the two surpluses: Students frequently mix up consumer and producer surplus. A useful mnemonic is that consumer surplus relates to the demand curve (what consumers are willing to pay), while producer surplus relates to the supply curve (what producers are willing to accept).
- Selecting area C: Some students incorrectly identify the area below the supply curve as producer surplus. This area actually represents the total variable cost of production. Producer surplus is the area above the supply curve.
- Ignoring the equilibrium boundary: Producer surplus only exists for units actually bought and sold at the equilibrium price, so the relevant area is bounded on the right by the equilibrium quantity, not extending indefinitely.
Things to Be Careful About
- Always verify the direction of the curves: demand slopes downward, supply slopes upward.
- Check the boundaries carefully: producer surplus requires the supply curve as the lower boundary and the price line as the upper boundary.
- In diagrams with multiple labelled areas, trace the edges of each region to ensure you select the triangle that precisely matches the economic definition.
What is an example of wealth?
Options
A interest received
B profits
C property
D incomes
Reasoning
Wealth is a stock of assets held at a point in time. Property is an asset and therefore an example of wealth. Interest received, profits, and incomes are all flows of money over a period of time, making them examples of income, not wealth.
Answer
C
C
Background Concept
In economics, a fundamental distinction is made between stocks and flows. A stock is a quantity measured at a specific point in time. Wealth is a stock concept. It represents the total value of all assets owned by an individual, firm, or nation at a given moment. Assets include property, shares, bonds, savings accounts, and physical capital. A flow is a quantity measured over a period of time. Income is a flow concept. It represents the earnings received over a period, such as wages, salaries, rent, interest, and profits. The relationship between them is that a stock of wealth can generate a flow of income (e.g., a rental property generates rent), and a flow of income can be saved to build a stock of wealth.
Understanding the Question
This is a straightforward multiple-choice question testing the candidate's grasp of the core definition of wealth. The command word is 'What is an example of...', which requires the identification of a correct instance of the concept. The question is designed to distinguish between stock and flow concepts. The options are carefully chosen: three are flows (income, profits, interest) and one is a stock (property).
Approach
The most efficient way to answer is to recall the definition of wealth (a stock of assets) and then evaluate each option against this definition. Any option that represents a flow of money over time can be immediately eliminated.
Step-by-Step Reasoning
-
Define Wealth. Wealth is a stock of valuable assets or the net worth of an individual or household at a specific point in time. It includes physical assets (property, land) and financial assets (shares, bonds, bank deposits).
-
Evaluate Option A (interest received). Interest is a payment received for lending capital. It is earned over a period of time. Therefore, it is a flow of income, not a stock of wealth.
-
Evaluate Option B (profits). Profit is the surplus of revenue over costs for a firm over a period of time. It is a flow concept. While retained profits can add to a firm's wealth, the profit itself is a flow.
-
Evaluate Option C (property). Property (land, buildings) is a tangible asset that holds value at a point in time. It is a classic example of a wealth asset. It is a stock.
-
Evaluate Option D (incomes). Income is the classic flow concept. It is money received over a period (weekly, monthly, annually). It is the opposite of a stock.
Conclusion: Only property fits the definition of a stock of wealth. The correct answer is C.
Key Takeaways
The stock-flow distinction is a cornerstone of macroeconomic analysis. Understanding it is crucial for topics like national income (a flow), wealth inequality (a stock), investment (a flow that adds to the capital stock), and the circular flow of income. A student should be able to instantly classify any economic variable as a stock or a flow.
Common Mistakes
- Confusing income with wealth: A common error is to assume that a high income automatically means high wealth. A person with a high income who spends it all has low wealth. A person with a modest income who saves diligently can accumulate significant wealth.
- Misclassifying flows: Students might see 'interest received' or 'profits' and think of the underlying asset (the savings account or the business) which is wealth, rather than the payment itself, which is a flow.
Things to Be Careful About
- Precise wording: The question asks for an 'example of wealth'. Ensure the chosen option is the asset itself, not the return on the asset.
- Time dimension: Always ask yourself: 'Is this measured at a point in time (stock) or over a period of time (flow)?' This simple test will reliably distinguish wealth from income.
Too much sugar causes an increase in a consumer’s weight. A government has introduced a ‘sugar tax’ on the consumption of soft drinks that have a high sugar content.
How might this policy help to reduce the number of overweight people?
Options
A Consumers switch to cheaper brands of soft drink with a high sugar content.
B Consumers switch to other high-sugar substitute goods, such as alcohol or sweets.
C The price elasticity of demand for soft drinks is inelastic.
D The tax revenue is spent on education about the dangers of soft drink consumption.
Answer
A sugar tax raises the price of high-sugar soft drinks. If the tax revenue is spent on education about the dangers of soft drink consumption, this addresses the imperfect information that leads to over-consumption of a demerit good. The education campaign shifts consumers' preferences away from high-sugar drinks, reducing the quantity demanded at any given price and helping to lower the number of overweight people. The other options either do not reduce total sugar intake (A, B) or describe a situation where the tax is ineffective (C).
Answer
D
D
Background Concept
This question tests the economics of demerit goods and government intervention. A demerit good is one whose consumption creates negative externalities or harms the consumer, and which tends to be over-consumed because consumers have imperfect information about the true costs. Soft drinks with high sugar content are a classic example: consumers may not fully understand the link between sugar consumption and weight gain, or may underestimate the long-term health consequences. Government intervention can take several forms: a tax (to raise the price and reduce quantity demanded), direct provision of information (to correct the information failure), or a combination of both.
Understanding the Question
The question asks: "How might this policy help to reduce the number of overweight people?" The policy is a 'sugar tax' on high-sugar soft drinks. The key word is "help" — we need to identify which of the four options describes a mechanism that actually reduces the number of overweight people, not just changes what people drink or how much they spend.
Approach
Read each option carefully and ask: does this mechanism reduce total sugar consumption (and therefore weight) or not?
- A: Switching to cheaper brands of high-sugar soft drinks means the consumer still consumes the same amount of sugar — no reduction in weight.
- B: Switching to other high-sugar substitutes (alcohol, sweets) means total sugar intake may stay the same or even rise — no reduction in weight.
- C: If demand is inelastic, the tax raises price but quantity demanded falls only a little — little reduction in sugar consumption, so little help in reducing overweight people.
- D: The tax revenue is spent on education about the dangers of soft drink consumption. This addresses the information failure directly: consumers learn the true cost, their preferences shift, and they voluntarily reduce consumption. This is a genuine mechanism that can reduce the number of overweight people.
Step-by-Step Reasoning
-
Identify the problem: Over-consumption of high-sugar soft drinks is a demerit good problem caused by imperfect information. Consumers do not fully appreciate the health risks.
-
Evaluate each option:
- A: Cheaper brands still contain high sugar. The consumer's total sugar intake from soft drinks is unchanged. No reduction in weight. Incorrect.
- B: Substituting one high-sugar product for another (alcohol, sweets) does not reduce total sugar/calorie intake. In fact, alcohol and sweets may be even more calorie-dense. No reduction in weight. Incorrect.
- C: Inelastic demand means the tax is ineffective at reducing quantity consumed. The tax raises government revenue but does little to reduce sugar intake. Therefore it does not help reduce overweight people. Incorrect.
- D: The tax raises revenue that can be used to fund an education campaign. Education corrects the information failure: consumers now understand the link between sugar and weight gain, and they reduce their consumption voluntarily. This is a direct mechanism that can reduce the number of overweight people. Correct.
-
Conclusion: Option D is the only one that describes a mechanism that actually reduces total sugar consumption and therefore can help reduce the number of overweight people.
Key Takeaways
- A tax on a demerit good can reduce consumption, but its effectiveness depends on the price elasticity of demand. If demand is inelastic, the tax raises revenue but does little to reduce quantity.
- The revenue from a tax can be used to fund complementary policies (like education) that address the root cause of over-consumption (imperfect information).
- When evaluating a policy, always ask: does this mechanism actually change the outcome (here, reduce the number of overweight people) or does it just change the pattern of consumption?
Common Mistakes
- Choosing A or B because they describe a change in consumption behaviour, without checking whether total sugar intake actually falls.
- Choosing C because it mentions elasticity, but failing to realise that inelastic demand means the tax is ineffective at reducing consumption.
- Not reading the question carefully: "How might this policy help to reduce the number of overweight people?" — the policy is the sugar tax, but the question asks about the policy as a whole, including how the revenue is used.
Things to Be Careful About
- Distinguish between a change in the pattern of consumption (switching brands or substitutes) and a reduction in total consumption of the harmful good.
- Remember that a tax on a demerit good can be effective if demand is elastic, but if demand is inelastic, the tax alone does little to reduce consumption — complementary policies are needed.
- The question is about "helping to reduce the number of overweight people", not just about reducing soft drink consumption. Any option that does not reduce total sugar/calorie intake is incorrect.
A ......1...... price set below the market equilibrium will cause a ......2...... of the product, and a ......3...... price set above the market equilibrium will cause a ......4...... of the product.
Which words complete gaps 1, 2, 3 and 4?
Options
| 1 | 2 | 3 | 4 | |
|---|---|---|---|---|
| A | maximum | shortage | minimum | surplus |
| B | maximum | surplus | minimum | shortage |
| C | minimum | shortage | maximum | surplus |
| D | minimum | surplus | maximum | shortage |
Reasoning
A maximum price (price ceiling) set below the market equilibrium creates excess demand because the price is artificially low, leading to a shortage. A minimum price (price floor) set above the market equilibrium creates excess supply because the price is artificially high, leading to a surplus. Therefore, gap 1 = maximum, gap 2 = shortage, gap 3 = minimum, gap 4 = surplus. This matches option A.
Answer
A
A
Background Concept
In a free market, equilibrium price and quantity are determined by demand and supply. Governments sometimes intervene by setting a maximum price (price ceiling) below equilibrium to make goods affordable, or a minimum price (price floor) above equilibrium to support producers. A maximum price below equilibrium leads to excess demand (shortage) because quantity demanded exceeds quantity supplied. A minimum price above equilibrium leads to excess supply (surplus) because quantity supplied exceeds quantity demanded.
Understanding the Question
The question presents a sentence with four gaps and four options for each gap. The task is to select the correct combination of words that accurately describes the effects of price controls. The sentence structure: "A ......1...... price set below the market equilibrium will cause a ......2...... of the product, and a ......3...... price set above the market equilibrium will cause a ......4...... of the product." We need to fill 1 and 3 with either "maximum" or "minimum", and 2 and 4 with either "shortage" or "surplus".
Approach
Recall the standard analysis: a maximum price (ceiling) below equilibrium creates a shortage; a minimum price (floor) above equilibrium creates a surplus. Then match to the options.
Step-by-Step Reasoning
- Gap 1: "A ...... price set below the market equilibrium". A price set below equilibrium is a maximum price (ceiling). So 1 = maximum.
- Gap 2: Such a price causes a shortage (excess demand). So 2 = shortage.
- Gap 3: "a ...... price set above the market equilibrium". A price set above equilibrium is a minimum price (floor). So 3 = minimum.
- Gap 4: Such a price causes a surplus (excess supply). So 4 = surplus.
Now check options:
- A: 1=maximum, 2=shortage, 3=minimum, 4=surplus → matches.
- B: 1=maximum, 2=surplus → incorrect.
- C: 1=minimum → incorrect.
- D: 1=minimum → incorrect.
Thus A is correct.
Key Takeaways
Price controls have predictable effects: maximum price below equilibrium → shortage; minimum price above equilibrium → surplus. Understanding these helps in analysing government intervention.
Common Mistakes
- Confusing maximum and minimum: a maximum price is a ceiling, a minimum price is a floor.
- Thinking a maximum price causes a surplus (it's the opposite).
- Not considering the price relative to equilibrium: a maximum price above equilibrium has no effect; a minimum price below equilibrium has no effect. The question specifies "below" and "above" equilibrium, so the effects are clear.
Things to Be Careful About
- Read the sentence carefully: the first part is about a price below equilibrium, the second about a price above equilibrium.
- Ensure you know the terminology: "maximum price" = price ceiling, "minimum price" = price floor.
- The question is straightforward but requires precise recall.
The diagram shows the demand for and supply of eye tests provided by opticians.
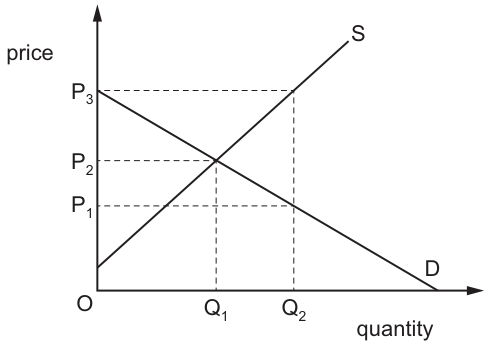
Which policy would enable the government to increase the number of eye tests from OQ1 to OQ2?
Options
A a maximum price of OP3 per test
B a minimum price of OP2 per test
C a subsidy paid to opticians of P3 - P2 per test
D a subsidy paid to opticians of P3 - P1 per test
Reasoning
The initial market equilibrium is at price P2 and quantity Q1, where demand (D) equals supply (S). To increase the quantity of eye tests to OQ2, the supply curve must shift rightwards (downwards) by a per-unit subsidy such that the new equilibrium occurs at Q2.
At quantity Q2:
- Consumers are willing to pay P1 (the price on the demand curve at Q2)
- Producers require a price of P3 to supply Q2 (the price on the original supply curve at Q2)
A per-unit subsidy covers the difference between the price producers receive and the price consumers pay, so the required subsidy is P3 - P1 per test.
Other options are incorrect: a maximum price of OP3 (above equilibrium) is non-binding and has no effect; a minimum price of OP2 (equal to equilibrium) is also non-binding; a subsidy of P3 - P2 would not cover the full gap between P1 and P3, so quantity would not reach Q2.
Answer
D
D
Background Concept
This question tests understanding of government intervention in markets via subsidies, and how such interventions affect market equilibrium. A subsidy is a payment made by the government to producers (or consumers) to lower the cost of producing or purchasing a good or service. For a per-unit subsidy paid to producers, the supply curve shifts downwards (or to the right) by the exact amount of the subsidy, because producers are willing to supply any given quantity at a price that is lower by the subsidy amount. Market equilibrium occurs where the demand curve (representing consumers' willingness to pay) intersects the supply curve (representing producers' marginal cost of supply). The equilibrium quantity is the quantity traded at this intersection price.
Understanding the Question
The question provides a demand and supply diagram for eye tests, with initial equilibrium at price P2 and quantity Q1. The government wants to increase the quantity of eye tests to OQ2, and we need to identify which of the four policy options will achieve this. The options include two price controls (maximum and minimum price) and two per-unit subsidies to opticians. The question tests applied demand and supply analysis of government intervention, specifically the impact of subsidies on equilibrium.
Approach
To solve this, first identify the initial equilibrium from the diagram, then determine what is required to raise quantity to Q2:
- First, eliminate the price control options: a price control only affects the market if it is binding (i.e., set above or below the equilibrium price). A non-binding price control has no impact on equilibrium price or quantity.
- For the subsidy options, recall that a per-unit subsidy to producers reduces their effective marginal cost, shifting the supply curve down by the subsidy amount. The new equilibrium quantity is where the shifted supply curve meets the demand curve. At the target quantity Q2, we can read the consumer price (from the demand curve) and the original producer supply price (from the original supply curve). The difference between these two values is the required per-unit subsidy, as it is the amount needed to make producers willing to supply Q2 when consumers only pay the lower demand price at that quantity.
Step-by-Step Reasoning
- Initial equilibrium: The diagram shows demand curve D (downward-sloping) and supply curve S (upward-sloping) intersecting at price P2 and quantity Q1. This is the free market equilibrium, so without intervention, quantity traded is OQ1.
- Evaluate Option A (maximum price of OP3): A maximum price (price ceiling) is a legal maximum price sellers can charge. OP3 is above the equilibrium price P2, so this price ceiling is non-binding: sellers can already charge the lower equilibrium price P2, so the ceiling has no effect. Quantity remains at OQ1. Option A is incorrect.
- Evaluate Option B (minimum price of OP2): A minimum price (price floor) is a legal minimum price sellers can charge. OP2 is exactly equal to the equilibrium price P2, so this price floor is non-binding: the market already clears at P2, so the floor has no impact. Quantity remains at OQ1. Option B is incorrect.
- Analyse the subsidy options: A per-unit subsidy paid to producers lowers their cost of supplying each unit, so the supply curve shifts downwards (to the right) by the amount of the subsidy. The new equilibrium is where the shifted supply curve meets the demand curve. We need this new equilibrium quantity to be OQ2.
- At quantity OQ2, the demand curve shows consumers are only willing to pay P1 per test.
- The original supply curve shows that producers need a price of P3 per test to be willing to supply OQ2 tests.
- To achieve OQ2, producers must receive P3 (to cover their costs) while consumers pay P1. The government must cover the difference between these two prices as a per-unit subsidy: P3 - P1 per test.
- Evaluate Option C (subsidy of P3 - P2): This subsidy amount is smaller than the required P3 - P1. If the subsidy is P3 - P2, producers would receive P2 + (P3 - P2) = P3 when consumers pay P2, but at price P2, the quantity demanded is only Q1 (since P2 is the equilibrium price). Alternatively, at quantity Q2, producers would receive P1 + (P3 - P2) = P1 + P3 - P2, which is less than P3 (since P1 < P2), so they would not be willing to supply Q2. Quantity would not reach OQ2, so Option C is incorrect.
- Evaluate Option D (subsidy of P3 - P1): This subsidy exactly covers the gap between the price producers need (P3) and the price consumers pay (P1) at quantity Q2. With this subsidy, producers receive P1 + (P3 - P1) = P3 when consumers pay P1, which is exactly the point on the original supply curve at Q2. The new equilibrium quantity is therefore OQ2, which is the government's target. Option D is correct.
Key Takeaways
- A price control (maximum or minimum price) only affects the market if it is set away from the equilibrium price (binding). A price control set at the equilibrium price has no effect.
- A per-unit subsidy to producers shifts the supply curve downwards by the amount of the subsidy. The new equilibrium quantity is determined by the intersection of the demand curve and the shifted supply curve.
- To find the required per-unit subsidy to reach a target quantity, calculate the difference between the price producers need to supply that quantity (from the original supply curve) and the price consumers are willing to pay for that quantity (from the demand curve).
Common Mistakes
- Confusing the direction of a subsidy's effect on the supply curve: a subsidy to producers shifts supply right/down, not left/up.
- Misidentifying the required subsidy amount: some students might incorrectly calculate the difference between P3 and P2 (the equilibrium price) instead of the difference between the producer supply price at Q2 (P3) and the consumer demand price at Q2 (P1).
- Assuming any price control will affect the market: if a price ceiling is set above equilibrium or a price floor set below equilibrium, it is non-binding and has no impact on price or quantity.
- Forgetting that the subsidy is the gap between what producers receive and what consumers pay at the target quantity, not the difference between the target price and the original equilibrium price.
Things to Be Careful About
- Always check if a price control is binding (set away from equilibrium) before assuming it has an effect.
- When calculating the required subsidy, use the prices from the original supply and demand curves at the target quantity, not the original equilibrium price.
- Remember that a per-unit subsidy is paid per unit of output, so the total subsidy cost to the government is the subsidy per unit multiplied by the new equilibrium quantity.
What is an example of a transfer payment?
Options
A a household moving savings from one bank account to another
B a monthly repayment on a loan used to buy a new cooker
C the amount paid to transport goods from one city to another
D grants paid to students by the government
Reasoning
A transfer payment is a payment made by the government for which no good or service is provided in return. Grants paid to students by the government (Option D) are exactly this: the government transfers money to students without receiving a good or service back.
- Option A is merely a movement of savings between accounts, not a payment for which no return is given.
- Option B is a repayment for a loan used to purchase a good, so it is a financial transaction with a quid pro quo.
- Option C is a payment for a transport service, which is a market transaction.
Therefore, only Option D meets the definition of a transfer payment.
Answer
D
D
Background Concept
A transfer payment is a payment made by the government (or sometimes by private bodies) to individuals, households, or other levels of government for which no current good or service is provided in return. In macroeconomics, transfer payments are excluded from the calculation of Gross Domestic Product (GDP) because they do not represent payment for final goods or services produced in the economy. They are a tool for income redistribution, often funded by taxation, and are a key component of the government's fiscal policy. Common examples include social security benefits, unemployment benefits, pensions, and student grants.
Transfer payments are a form of current government spending (as opposed to capital spending) and are considered an injection into the circular flow of income, as they increase households' disposable income without a direct contribution to production.
Understanding the Question
The question asks you to identify which of the four options is an example of a transfer payment. This is a straightforward application of the definition. You need to recall what makes a payment a transfer (no good or service provided in return) and apply it to each scenario.
Approach
- Recall the precise definition of a transfer payment.
- For each option, ask: Is this a payment for which no good or service is received in return? And is it a government transfer (or at least a transfer in the economic sense)?
- Eliminate options that involve a transaction where a good or service is received, or where the payment is simply a movement of funds between accounts.
- Confirm the option that fits.
Step-by-Step Reasoning
- Option A: A household moving savings from one bank account to another. This is a personal financial rearrangement, not a payment from the government or any entity that transfers income without a return. No good or service is involved, but it is not a transfer payment in the macroeconomic sense; it is just a shift of funds.
- Option B: A monthly repayment on a loan used to buy a new cooker. This is a repayment of borrowed money. The borrower received the cooker (a good) and is now repaying the loan. The payment is for the loan, which financed the purchase. It is not a transfer because the payment is for the use of funds and indirectly for the good purchased.
- Option C: The amount paid to transport goods from one city to another. This is a payment for a service (transport). The payer receives the service of moving goods. Therefore, it is a market transaction, not a transfer.
- Option D: Grants paid to students by the government. This is a payment made by the government to students (often based on financial need or merit) without requiring any good or service in return. The students do not provide a current service to the government; the grant is a financial award. This matches the definition of a transfer payment exactly.
Thus, Option D is the correct example.
Key Takeaways
- Transfer payments involve no exchange of goods or services; they are pure transfers of income.
- They are typically made by governments to redistribute income and provide social welfare.
- Common examples: welfare benefits, unemployment pay, pensions, student grants, subsidies to households (not production subsidies).
- Transfer payments are not counted in GDP because they do not represent production.
- In the circular flow, they are injections (increase disposable income) but are not part of government spending on goods and services.
Common Mistakes
- Thinking that any government payment is a transfer payment: In fact, government purchases of goods and services (e.g., building roads, buying office supplies) are not transfers because the government receives something in return.
- Confusing transfer payments with subsidies to producers: Producer subsidies are payments for production or to lower costs, and they are often linked to output, so they are not pure transfers (they are subsidies on production). But the question is about transfer payments in the context of income redistribution, not production subsidies.
- Overlooking that grants to students are transfers: Some may think of it as a payment for future services (educated workforce), but in the current period, no good or service is provided, so it qualifies as a transfer.
- Selecting Option A: It is a transfer of funds between accounts, but not a transfer payment in the economic sense; the term 'transfer payment' is specific to government redistributive payments.
Things to Be Careful About
- The definition of a transfer payment in macroeconomics is precise: a payment for which no good or service is provided in return in the current period. Always apply this strict definition.
- Distinguish between transfer payments (current transfers) and capital transfers (e.g., investment grants) – both are transfers, but the concept tested is the general one.
- In the options, be careful not to choose a payment that is a financial transaction (loan repayment) or a payment for a service (transport).
- Remember that transfer payments are a component of government spending but are treated separately in national accounts (they are not included in GDP).
Which statement correctly describes an increase in real GDP?
Options
A Nominal GDP rising faster than nominal income.
B Nominal GDP rising faster than the rate of inflation.
C The rate of inflation rising faster than aggregate demand.
D The rate of inflation rising faster than nominal income.
Reasoning
Real GDP is nominal GDP adjusted for changes in the price level (inflation). An increase in real GDP occurs when the growth of nominal GDP exceeds the rate of inflation. Option B correctly states this: nominal GDP rising faster than the rate of inflation.
Answer
B
B
Background Concept
Gross Domestic Product (GDP) measures the total value of goods and services produced in an economy. Nominal GDP is measured at current prices, so it can rise either because more output is produced or because prices have risen. Real GDP is nominal GDP adjusted for inflation, using a price index to remove the effect of price changes. A rise in real GDP indicates that the volume of output has increased, which is a measure of economic growth.
Understanding the Question
The question asks which statement correctly describes an increase in real GDP. It provides four options that relate nominal GDP, inflation, and aggregate demand. The key is to recognise that real GDP growth occurs when the percentage increase in nominal GDP is greater than the percentage increase in the price level (inflation).
Approach
Identify the definition of real GDP: nominal GDP divided by the price level (or adjusted for inflation). Therefore, for real GDP to increase, the growth rate of nominal GDP must exceed the inflation rate. Examine each option against this criterion.
Step-by-Step Reasoning
- Option A: Nominal GDP rising faster than nominal income. This is not directly related to real GDP; nominal income and nominal GDP are both in current prices, so this comparison does not account for inflation.
- Option B: Nominal GDP rising faster than the rate of inflation. If nominal GDP grows by 5% and inflation is 3%, then real GDP grows by approximately 2% (5% - 3%). This matches the definition of real GDP increase.
- Option C: The rate of inflation rising faster than aggregate demand. This does not involve nominal GDP or real GDP; it compares inflation and aggregate demand, which is not the correct relationship.
- Option D: The rate of inflation rising faster than nominal income. Again, this does not directly address real GDP; it compares inflation and nominal income, not nominal GDP.
Thus, only option B correctly describes an increase in real GDP.
Key Takeaways
- Real GDP is nominal GDP adjusted for inflation.
- An increase in real GDP requires nominal GDP growth to outpace inflation.
- This distinction is fundamental to measuring economic growth accurately.
Common Mistakes
- Confusing real GDP with nominal GDP: a rise in nominal GDP does not necessarily mean more output if prices have risen.
- Thinking that a fall in inflation automatically raises real GDP; it is the growth rate of nominal GDP relative to inflation that matters.
- Misinterpreting the direction of the relationship: real GDP growth is not simply inflation falling, but nominal GDP growth exceeding inflation.
Things to Be Careful About
- Remember that the formula for real GDP is (Nominal GDP / Price Index) × 100. So the growth rate of real GDP is approximately the growth rate of nominal GDP minus the inflation rate.
- In multiple-choice questions, watch for distractors that mention absolute levels or other comparisons not involving nominal GDP and inflation.
- The term 'real GDP' always refers to output after accounting for price changes.
An open economy with a government sector is in equilibrium. Households in this economy save $100 million and firms spend $150 million on investment.
Which combination of the budget balance and the current account balance would lead to an equilibrium position on the circular flow of income?
Options
| budget balance | current account balance | |
|---|---|---|
| A | $100m deficit | $50m deficit |
| B | $100m deficit | $50m surplus |
| C | $100m surplus | $50m deficit |
| D | $100m surplus | $50m surplus |
Working
In equilibrium, total planned leakages equal total planned injections:
S + T + M = I + G + X
Rearrange to isolate the budget and current account terms:
(T - G) + (M - X) = I - S
Given: savings S = $100 million, investment I = $150 million, so I - S = $50 million.
Thus (T - G) + (M - X) = 50.
Note that (T - G) is the budget surplus (positive) or deficit (negative).
(M - X) is the current account deficit (positive) or surplus (negative).
Check each option using this condition:
- A: Budget deficit $100m? T-G = -100; current account deficit $50m? M-X = 50; sum = -50 ? 50.
- B: Budget deficit $100m? -100; current account surplus $50m means X-M=50 so M-X=-50; sum = -150 ? 50.
- C: Budget surplus $100m? T-G = 100; current account deficit $50m? M-X = 50; sum = 150 ? 50.
- D: Budget surplus $100m? 100; current account surplus $50m means X-M=50 so M-X=-50; sum = 100 + (-50) = 50. Matches.
Alternatively, from S+T+M = I+G+X we can write T - G = (I - S) + (X - M). With I - S = 50, for D: X - M = 50 gives T - G = 100, which matches the given budget surplus.
Answer
D
D
Background Concept
The circular flow of income models the flows of money between different sectors of the economy. In an open economy with a government sector, the main flows are:
- Injections (J): Investment (I), government spending (G), and exports (X).
- Leakages (L): Savings (S), taxation (T), and imports (M).
The economy is in equilibrium when total planned injections equal total planned leakages: J = L, i.e., I + G + X = S + T + M. This condition ensures that the total income generated equals the total spending, so there is no unplanned change in inventories.
Rearranging this identity allows us to relate the government's budget balance (T - G) and the current account balance (X - M). A common form is:
(T - G) + (M - X) = I - S
Here (M - X) is the current account deficit (positive if imports exceed exports), while (T - G) is the budget surplus.
Understanding the Question
The question gives S = 100 and I = 150, so there is a net private domestic injection of 50 (I > S). To achieve equilibrium, the net leakages from the government and foreign sectors must exactly offset this injection. We are asked to pick the combination of budget balance (either deficit or surplus) and current account balance (deficit or surplus) that satisfies the equilibrium condition.
The options present four combinations, expressed in terms of surpluses or deficits. It is important to interpret these correctly: a surplus means a positive balance (T > G for budget, X > M for current account), while a deficit means a negative balance.
Approach
- Write down the equilibrium condition for an open economy with government.
- Substitute the given S and I to find the required sum of (T - G) and (M - X).
- For each option, compute (T - G) + (M - X) using the correct signs for surplus/deficit.
- Identify which option gives the required sum of 50.
Step-by-Step Reasoning
Start with the condition:
S + T + M = I + G + X
Subtract I + G + X from both sides:
(S - I) + (T - G) + (M - X) = 0
Rearranging gives:
(T - G) + (M - X) = I - S
Now plug in the numbers: I - S = 150 - 100 = 50.
Thus we need:
(T - G) + (M - X) = 50.
Now interpret the options:
-
Option A: "Budget $100m deficit" means G - T = 100, so T - G = -100. "Current account $50m deficit" means M - X = 50. Sum = -100 + 50 = -50 ? 50. Not correct.
-
Option B: Budget deficit? T - G = -100. Current account surplus means X - M = 50, so M - X = -50. Sum = -100 + (-50) = -150 ? 50. Not correct.
-
Option C: Budget surplus means T - G = 100. Current account deficit means M - X = 50. Sum = 100 + 50 = 150 ? 50. Not correct.
-
Option D: Budget surplus? T - G = 100. Current account surplus means X - M = 50, so M - X = -50. Sum = 100 + (-50) = 50. Correct.
Alternatively, use the form T - G = (I - S) + (X - M). With I - S = 50:
T - G = 50 + (X - M).
For D, X - M = 50, so T - G = 100, which matches the given surplus. No other option satisfies this.
Thus D is the correct choice.
Key Takeaways
- The circular flow equilibrium condition in an open economy with government is S + T + M = I + G + X.
- The condition can be rearranged to show that the sum of the government budget surplus and the current account deficit (or equivalently the government surplus minus the current account surplus) must equal the excess of investment over savings.
- Understanding signs: surplus adds to leakages, deficit subtracts from leakages.
- This question tests the ability to algebraically manipulate the identity and correctly interpret economic terms.
Common Mistakes
- Mistaking the direction of signs: a budget deficit means T - G is negative; a current account deficit means M - X is positive. Confusing these leads to wrong arithmetic.
- Using the wrong equilibrium formula (e.g., S = I only, ignoring government and foreign sectors).
- Forgetting to include M as a leakage and X as an injection.
- Failing to rearrange correctly, e.g., writing (T - G) + (X - M) = I - S, which is wrong because that gives (T-G) - (M-X) = I-S, not the correct relationship.
Things to Be Careful About
- Always start from the basic equality S + T + M = I + G + X and derive the required relation from there.
- Keep track of which variable is a leakage (S, T, M) and which is an injection (I, G, X).
- Pay attention to the wording: "surplus" and "deficit" and their impact on the algebraic sign.
- Double-check that the sum condition matches the derived value exactly; a slight sign error can lead to a wrong selection.
An economy’s manufacturing share of real GDP fell from 30% in 1990 to 12% in 2023.
Which type of unemployment would have resulted from this?
Options
A cyclical
B frictional
C structural
D voluntary
Answer
A long-term decline in a specific sector (manufacturing) indicates a change in the structure of the economy. Workers in that sector may lack the skills needed for growing sectors, leading to structural unemployment. Cyclical unemployment is due to a downturn in the business cycle, not a permanent shift. Frictional unemployment is short-term and voluntary. Voluntary unemployment is when individuals choose not to work. Therefore, the correct option is C.
Answer
C
C
Background Concept
Unemployment is classified into different types based on its cause. The main types are:
- Frictional unemployment: short-term unemployment that occurs when workers are between jobs or entering the labour force for the first time.
- Structural unemployment: long-term unemployment caused by a mismatch between the skills of workers and the skills demanded by available jobs, often due to changes in the structure of the economy (e.g., decline of an industry, technological change, or globalisation).
- Cyclical unemployment: unemployment that rises during recessions and falls during expansions, caused by a lack of aggregate demand.
- Voluntary unemployment: when individuals choose not to work at the prevailing wage rate, often because they prefer leisure or can rely on benefits.
A key feature of structural unemployment is that it persists even when the economy is at full capacity, because the workers are not in the right place or do not have the right skills for the jobs that exist.
Understanding the Question
The question states that the manufacturing share of real GDP fell from 30% in 1990 to 12% in 2023. This is a long-term, structural change: the manufacturing sector has become a much smaller part of the economy. The question asks which type of unemployment would result from this change. The scenario describes a permanent decline in a sector, not a temporary downturn. Therefore, the unemployment that arises is due to the mismatch between the skills of workers formerly in manufacturing and the jobs available in other (growing) sectors of the economy.
Approach
To answer, we need to recall the definition of each type of unemployment and match it to the scenario. The key is to recognise that the decline in manufacturing is a structural change, not a cyclical fluctuation. The answer is structural unemployment.
Step-by-Step Reasoning
-
Identify the nature of the change: The manufacturing share of GDP fell from 30% to 12% over 33 years. This is a long-term trend, not a short-term business cycle fluctuation. It suggests that the economy has shifted away from manufacturing towards other sectors (e.g., services).
-
Consider cyclical unemployment: Cyclical unemployment is caused by a fall in aggregate demand during a recession. It is temporary and rises and falls with the business cycle. The scenario does not mention a recession or a general downturn; it is a secular decline in one sector. Therefore, cyclical unemployment is not the primary type.
-
Consider frictional unemployment: Frictional unemployment is short-term and occurs when workers are between jobs (e.g., moving from one job to another, or graduates searching for their first job). It is usually voluntary and lasts only a few weeks. The scenario describes a long-term loss of jobs in manufacturing, which is more permanent than frictional unemployment.
-
Consider voluntary unemployment: Voluntary unemployment refers to individuals who choose not to work because they prefer not to at the current wage. While some manufacturing workers might choose to leave the labour force, the question implies that the loss of jobs in manufacturing leads to unemployment, suggesting that workers are unable to find jobs (involuntary).
-
Consider structural unemployment: Structural unemployment arises when there is a mismatch between the skills of workers and the requirements of available jobs. The decline of a major industry like manufacturing means that many workers lose their jobs and may not have the skills required for jobs in growing sectors (e.g., technology, services). This type of unemployment can persist for years. This matches the scenario perfectly.
-
Conclusion: The correct answer is structural unemployment.
Key Takeaways
- Structural unemployment results from long-term changes in the economy, such as the decline of an industry, technological change, or globalisation.
- It is important to distinguish between temporary (cyclical, frictional) and permanent (structural) causes of unemployment.
- When a specific sector shrinks over a long period, the resulting unemployment is most likely structural.
Common Mistakes
- Confusing structural unemployment with cyclical unemployment: students may think that any loss of jobs is due to a recession. However, cyclical unemployment is tied to the business cycle, whereas structural unemployment is a permanent mismatch.
- Thinking that any job loss is frictional: frictional unemployment is short-term and voluntary; the scenario is about a long-term decline, not a brief transition.
- Overlooking the word 'voluntary': voluntary unemployment is a choice; the scenario implies involuntary job loss.
Things to Be Careful About
- Read the time frame: a decline from 30% to 12% over 33 years is a structural change, not a short-term fluctuation.
- Understand that structural unemployment can exist even when the economy is at full employment; it is a mismatch, not a lack of demand.
- In multiple-choice questions, eliminate options that are clearly inconsistent with the description before selecting the best fit.
Which statement is not correct?
Options
A The long-run aggregate supply curve can be downward sloping.
B The long-run aggregate supply curve can be horizontal.
C The long-run aggregate supply curve can be upward sloping.
D The long-run aggregate supply curve can be vertical.
Reasoning
The long-run aggregate supply (LRAS) curve represents the economy's potential output when all factors are fully employed. In the Classical model, the LRAS is vertical at the full-employment level of output, independent of the price level (Option D is correct). In the Keynesian model, the LRAS is horizontal at low levels of output (when there is spare capacity) and upward sloping as output approaches potential (Options B and C are correct). A downward-sloping LRAS (Option A) would imply that a higher price level reduces potential output, which is not consistent with either the Classical or Keynesian view. Therefore, Option A is the incorrect statement.
Answer
A
A
Background Concept
The long-run aggregate supply (LRAS) curve shows the relationship between the economy's real output and the price level when all factors of production are fully utilised. Two main models are taught:
- Classical LRAS: Vertical at the full-employment output level (Yf). The economy's potential output depends on resources, technology, and institutions, not on the price level. Any change in AD only affects the price level in the long run.
- Keynesian LRAS: Horizontal at very low output (depression, where there is massive spare capacity), then upward sloping as output rises (because bottlenecks and rising costs cause prices to rise), and finally vertical at full capacity.
Shapes that are theoretically possible: vertical (Classical), horizontal (Keynesian depression range), upward sloping (Keynesian intermediate range). A downward-sloping LRAS is not part of either model—that shape belongs to the AD curve or possibly a SRAS with a perverse slope (unlikely in standard theory).
Understanding the Question
The question is a multiple-choice item asking: "Which statement is not correct?" Four possible shapes of the LRAS are listed. The task is to identify the shape that cannot be the LRAS according to accepted economic theory for Cambridge A-Level Economics (9708). You must recall the theoretical shapes and eliminate those that are correct.
Approach
- Recall the two main models: Classical and Keynesian.
- List the shapes each model permits for LRAS.
- Check each option against this list.
- If the shape appears in at least one model, it is correct.
- If it does not appear in either model, it is not correct.
- Select the option that is not correct.
Step-by-Step Reasoning
- Option D: vertical. The Classical LRAS is vertical. So this is a correct statement.
- Option B: horizontal. The Keynesian LRAS is horizontal at low output (the 'depression' range). So this is a correct statement.
- Option C: upward sloping. The Keynesian LRAS is upward sloping in its intermediate range. So this is a correct statement.
- Option A: downward sloping. No standard model of LRAS has a downward slope. A downward-sloping aggregate supply curve would mean that a higher price level reduces real output supplied in the long run—this contradicts the idea that potential output is independent of prices. Therefore, this statement is not correct.
The only incorrect statement is Option A.
Key Takeaways
- The LRAS can take three shapes across the two main models: vertical (Classical), horizontal (Keynesian depression), upward sloping (Keynesian intermediate).
- The shape of the LRAS depends on whether the economy is at full employment, has spare capacity, or is in between.
- Do not confuse the LRAS with the aggregate demand (AD) curve, which is downward sloping.
Common Mistakes
- Choosing 'vertical' as incorrect because they only recall the Keynesian model. Remember that the Classical model is also part of the syllabus and its vertical LRAS is correct.
- Thinking LRAS can be downward sloping because they confuse it with AD or a short-run AS curve that might slope downward in some special interpretations (not in 9708).
- Forgetting the Keynesian ranges and assuming only vertical is correct, thereby marking B or C as incorrect. But horizontal and upward sloping are accepted in the Keynesian framework.
Things to Be Careful About
- The question asks for the statement that is not correct. Carefully read each option—some questions may ask for the correct one.
- For MCQ, eliminate obviously wrong options first. Option A is the only one not supported by any standard model.
- Know both Classical and Keynesian models; the syllabus covers both.
The price of a pack of six eggs rises from $1.00 to $1.32 over a year. Consumer prices, as measured by the consumer price index, rise by 10% over the same period.
What is the real price of a pack of six eggs at the end of the year?
Options
A $1.00
B $1.10
C $1.20
D $1.32
Working
The nominal price at the end of the year is $1.32. The CPI rose by 10%, meaning the general price level increased by a factor of 1.10. The real price is the nominal price adjusted for inflation:
Real price = Nominal price / (1 + inflation rate) = $1.32 / 1.10 = $1.20.
Answer
C
C
Background Concept
Real values are adjusted for changes in the price level, so they reflect purchasing power. The Consumer Price Index (CPI) measures the average price level. To find the real price of a good, divide the nominal price by the price index (or 1 plus the inflation rate). This gives the price in terms of the purchasing power of money at the base period.
Understanding the Question
The question gives the nominal price of eggs at the start ($1.00) and end ($1.32) of a year, and the overall inflation rate (10%). It asks for the real price at the end of the year, i.e., the price adjusted for inflation so that it is comparable to the start-of-year price. The base year is implicitly the start of the year (CPI = 100). After 10% inflation, the CPI is 110. The real price is the nominal price divided by the CPI (multiplied by 100) or simply divided by 1.10.
Approach
Use the formula: Real price = Nominal price / (1 + inflation rate). Substitute the given values: $1.32 / 1.10 = $1.20. This corresponds to option C.
Step-by-Step Reasoning
- Nominal price at end of year = $1.32.
- Inflation rate = 10% = 0.10.
- Price index at end of year = 110 (if base = 100).
- Real price = $1.32 / 1.10 = $1.20.
- Therefore, the real price is $1.20, which is option C.
Check the other options:
- A $1.00: This is the original nominal price, not adjusted.
- B $1.10: This is the original price plus 10% of the original, but that is not the correct adjustment; it would be the nominal price if inflation were applied to the original price, but the actual nominal price is $1.32.
- D $1.32: This is the nominal price without any adjustment for inflation.
Key Takeaways
- Real values are nominal values adjusted for inflation.
- Formula: Real value = Nominal value / (1 + inflation rate) or (Nominal value / Price index) × 100.
- This adjustment is essential for comparing economic data over time.
Common Mistakes
- Forgetting to divide by the inflation factor; instead adding or subtracting the percentage.
- Confusing real and nominal: thinking the real price is the nominal price minus inflation (which is only approximate for small inflation rates).
- Using the original price as the real price.
Things to Be Careful About
- Ensure the inflation rate is expressed as a decimal or fraction correctly.
- The base year CPI is 100, so the end-year CPI is 110.
- The calculation is division, not multiplication.
- Always check that the answer makes sense: a real price should be lower than the nominal price when there is inflation.
What is not an example of monetary policy?
Options
A a rise in import tariffs on manufactured goods
B a rise in interest rates by the central bank
C a rise in credit regulations
D a rise in the money supply
Answer
Monetary policy involves the use of interest rates, the money supply, and credit regulations by the central bank to influence aggregate demand and the macroeconomy. A rise in import tariffs is a form of protectionist trade policy, not monetary policy. Therefore, the option that is not an example of monetary policy is A.
Answer
A
A
Background Concept
Monetary policy refers to actions taken by a central bank to control the money supply, interest rates, and credit conditions in order to influence aggregate demand, inflation, and economic growth. The main tools of monetary policy include:
- Changing the policy interest rate (e.g., the central bank's base rate)
- Open market operations to adjust the money supply
- Changing reserve requirements or credit regulations
In contrast, trade policy (or protectionism) involves measures to restrict or regulate international trade, such as tariffs, quotas, and subsidies. Tariffs are taxes on imported goods, used to protect domestic industries or raise revenue. They are not part of monetary policy.
Understanding the Question
The question asks which of the four options is NOT an example of monetary policy. The student must recognise that three of the options are standard monetary policy tools, while one is a trade policy instrument.
Approach
Review each option and classify it as either monetary policy or not:
- Option A: a rise in import tariffs – this is a trade policy, not monetary.
- Option B: a rise in interest rates – this is a classic monetary policy tool.
- Option C: a rise in credit regulations – this is a monetary policy tool (e.g., tightening lending standards).
- Option D: a rise in the money supply – this is a monetary policy action (expansionary).
Thus, the correct answer is A.
Step-by-Step Reasoning
-
Option A: a rise in import tariffs on manufactured goods – Tariffs are taxes on imports, imposed by the government (often the finance or trade ministry). They are used to protect domestic industries, influence trade balances, or raise revenue. This is a fiscal/trade policy, not monetary policy. Therefore, it is not an example of monetary policy.
-
Option B: a rise in interest rates by the central bank – Central banks use interest rates as a key monetary policy tool. Raising rates makes borrowing more expensive, reducing consumption and investment, and helps control inflation. This is clearly monetary policy.
-
Option C: a rise in credit regulations – Credit regulations, such as higher down payment requirements or stricter lending criteria, are tools used by central banks to control the amount of credit in the economy. This is a form of monetary policy (sometimes called 'credit policy').
-
Option D: a rise in the money supply – Increasing the money supply (e.g., through open market purchases) is an expansionary monetary policy action. It lowers interest rates and stimulates aggregate demand.
Since only option A is not a monetary policy tool, the correct answer is A.
Key Takeaways
- Monetary policy tools include interest rates, money supply, and credit regulations.
- Trade policy tools include tariffs, quotas, and subsidies.
- It is important to distinguish between different types of government intervention: fiscal, monetary, supply-side, and trade policies.
Common Mistakes
- Confusing tariffs with monetary policy because both can affect the economy. However, tariffs are a trade policy, not a monetary policy.
- Thinking that any government action that influences the economy is monetary policy. In fact, monetary policy is specifically conducted by the central bank using its tools.
Things to Be Careful About
- Remember the specific tools of monetary policy: interest rates, money supply, and credit regulations.
- Tariffs are a form of protectionism and are part of trade policy, not monetary policy.
- The question asks for what is NOT an example; be careful to select the exception.
A government decides to raise most of its revenues from indirect taxes.
What would increase the effectiveness of this policy?
Options
A an increasing trend towards bartering of goods
B increasing interest rates on household savings
C increasing occurrence of informal markets in the economy
D placing taxes on goods and services which have a price-inelastic demand
Reasoning
For a government raising revenue from indirect taxes, effectiveness depends on the tax base and the ability to generate revenue without causing a large reduction in consumption. An indirect tax shifts the supply curve upward by the amount of the tax. The resulting tax revenue is the tax per unit multiplied by the quantity sold after the tax. When demand is price-inelastic, the quantity demanded falls only slightly in response to the price increase, so the tax revenue is larger and the reduction in consumer surplus is relatively small. Therefore, placing taxes on goods with price-inelastic demand increases the effectiveness of the policy.
Option A (bartering) reduces the taxable transactions. Option B (interest rates) is unrelated to indirect tax collection. Option C (informal markets) leads to tax evasion. Hence, only D is correct.
Answer
D
D
Background Concept
An indirect tax is a tax levied on expenditure on goods and services, such as a sales tax or value-added tax (VAT). It is imposed on producers or sellers, who then pass some or all of the tax on to consumers through higher prices. The incidence of the tax—how the burden is shared between consumers and producers—depends on the price elasticity of demand (PED) and price elasticity of supply (PES).
Tax revenue from an indirect tax is calculated as the tax per unit multiplied by the equilibrium quantity traded after the tax is imposed. The government's objective in raising revenue from indirect taxes is typically to maximise revenue while minimising distortions (such as large reductions in consumption or creation of deadweight loss).
Price elasticity of demand measures the responsiveness of quantity demanded to a change in price. When demand is price-inelastic (PED < 1 in absolute value), a given percentage increase in price leads to a smaller percentage decrease in quantity demanded. Consequently, the post-tax quantity remains relatively high, generating larger tax revenue. In contrast, when demand is elastic, the quantity falls substantially, and tax revenue may be lower.
Understanding the Question
The question presents a scenario where a government decides to raise most of its revenues from indirect taxes. It asks: "What would increase the effectiveness of this policy?" The term "effectiveness" in this context refers to the ability of the indirect tax system to generate stable and sufficient revenue with minimal negative side effects (such as evasion, substitution, or large welfare losses). The four options are factors that could influence this effectiveness.
We need to identify which option would most likely enhance the government's ability to collect revenue from indirect taxes. The options are:
A. An increasing trend towards bartering of goods
B. Increasing interest rates on household savings
C. Increasing occurrence of informal markets in the economy
D. Placing taxes on goods and services which have a price-inelastic demand
Option D is correct because it directly addresses the economic principle that goods with inelastic demand yield higher tax revenue per unit of tax.
Approach
To evaluate each option, we consider how each factor affects the tax base, the ease of collection, and the economic response to the tax. The key is to recognise that the government wants to maximise revenue from indirect taxes, which depends on the post-tax quantity transacted. The post-tax quantity is determined by the price elasticity of demand. Therefore, selecting goods with inelastic demand is a strategy to increase revenue. The other options either reduce the tax base (bartering, informal markets) or are unrelated (interest rates).
Step-by-Step Reasoning
-
Option A: An increasing trend towards bartering of goods. Barter is the direct exchange of goods or services without using money. If bartering becomes more common, transactions that would otherwise be subject to indirect taxes are now outside the monetary economy. This reduces the tax base because fewer taxable transactions occur in formal markets. Moreover, bartering is difficult for the tax authority to monitor and tax. Therefore, bartering reduces the effectiveness of indirect taxes. This is not the correct answer.
-
Option B: Increasing interest rates on household savings. Interest rates are a monetary policy tool that affects saving and borrowing decisions. They are not directly related to the collection or effectiveness of indirect taxes. Higher interest rates might reduce consumption (by encouraging saving) and thus reduce the tax base, but this is not a direct enhancement of effectiveness. Interest rates are not a factor that the government can use to improve the performance of its indirect tax system. This option is irrelevant.
-
Option C: Increasing occurrence of informal markets in the economy. Informal markets (also called shadow or black markets) are economic activities that are not regulated or taxed by the government. If informal markets grow, more transactions occur outside the official economy, escaping indirect taxes. This reduces the tax base and makes it harder to collect revenue. Thus, informal markets undermine the effectiveness of indirect taxes. This is not the correct answer.
-
Option D: Placing taxes on goods and services which have a price-inelastic demand. When demand for a good is price-inelastic, consumers are relatively unresponsive to price changes. If the government imposes an indirect tax on such a good, the price rises, but the quantity demanded falls only slightly. Consequently, the government collects a large amount of tax revenue (tax per unit multiplied by the still-high quantity). Additionally, the deadweight loss (welfare loss) is smaller compared to a good with elastic demand. Therefore, focusing taxes on inelastic goods increases the effectiveness of the policy in terms of revenue generation and efficiency. This is the correct answer.
Key Takeaways
- The effectiveness of indirect taxes in raising revenue depends critically on the price elasticity of demand for the taxed goods.
- Goods with inelastic demand are better targets for indirect taxes because they generate more revenue and cause less distortion.
- Factors that reduce the tax base (bartering, informal markets) decrease the effectiveness of indirect taxes.
- This question illustrates the application of elasticity concepts to real-world government policy decisions.
Common Mistakes
- Confusing the concept of "effectiveness" with equity or fairness. The question is about revenue generation, not about who bears the burden.
- Thinking that goods with elastic demand generate more revenue because the price rises more. In reality, the quantity falls significantly, reducing revenue.
- Assuming that informal markets or bartering are neutral or positive because they avoid taxes. They actually erode the tax base.
- Misinterpreting interest rates as a tax policy tool. Interest rates are part of monetary policy, not fiscal policy.
Things to Be Careful About
- The question asks for what would increase effectiveness, not just describe it. Option D is the only one that directly enhances the government's ability to collect revenue.
- Remember that for an indirect tax, the revenue is tax per unit times quantity after tax. Inelastic demand keeps quantity high.
- The term "effectiveness" could also be interpreted as minimising evasion or administrative costs, but the standard economic interpretation for this type of question is maximising revenue with minimal distortion.
- Be precise: price-inelastic demand means PED < 1 in absolute value (not necessarily zero).
A government uses expansionary monetary policy over a three-year period.
Which combination identifies the likely impact of such a policy?
Options
| real GDP | price level | unemployment | |
|---|---|---|---|
| A | falling | rising | falling |
| B | rising | rising | rising |
| C | rising | rising | falling |
| D | rising | falling | rising |
Reasoning
Expansionary monetary policy involves lowering interest rates or increasing the money supply. This stimulates investment and consumption, shifting the aggregate demand (AD) curve to the right. In the short run, with an upward-sloping short-run aggregate supply (SRAS) curve, this leads to:
- a rise in real GDP
- a rise in the price level
- a fall in unemployment (as firms employ more workers to meet higher output)
This matches row C in the table.
Answer
C
C
Background Concept
Expansionary monetary policy is a policy tool used by a central bank to stimulate economic activity. It typically involves reducing the central bank's policy interest rate, which lowers the cost of borrowing for commercial banks, which in turn reduces interest rates for households and firms. Alternatively, the central bank may increase the money supply through open market operations (buying government bonds). Lower interest rates encourage higher consumption and investment, and a larger money supply can also boost spending. These effects increase aggregate demand (AD). The AD/AS model shows the impact on real GDP, the price level, and employment. In the short run, the SRAS curve is upward-sloping, so an increase in AD raises both real GDP and the price level, and the rise in output reduces unemployment (Okun's law). In the long run, the LRAS is vertical at potential output, so expansionary monetary policy would only raise the price level and have no effect on real GDP or unemployment, but the question likely assumes a short-run perspective (the policy is over a three-year period, which is short to medium run).
Understanding the Question
This multiple-choice question asks: "A government uses expansionary monetary policy over a three-year period. Which combination identifies the likely impact of such a policy?" The table gives four combinations of changes in real GDP, price level, and unemployment (falling or rising). The task is to pick the row that correctly describes the typical short-run effects. The government is the entity (though in practice it's the central bank, but the term 'government' is used loosely). The question tests knowledge of the standard macroeconomic effects of monetary policy.
Approach
Recall the chain of causation: expansionary monetary policy → lower interest rates → higher investment and consumption → AD increases → rightward shift of AD curve → in the short run, real GDP rises, price level rises, unemployment falls. This directly matches option C. The other options are incorrect because they either mix up the direction of one or more variables (e.g., falling real GDP with rising price level is stagflation, not caused by expansionary monetary policy; rising unemployment with rising real GDP is contradictory).
Step-by-Step Reasoning
- Expansionary monetary policy: the central bank reduces the policy interest rate (e.g., from 5% to 3%). This makes borrowing cheaper for banks, so they lower the interest rates they charge households and firms.
- Lower interest rates reduce the cost of financing consumption (e.g., mortgages, car loans) and investment (e.g., business loans for capital). Thus, consumption (C) and investment (I) rise.
- The increase in C and I raises aggregate demand: AD = C + I + G + (X-M). The AD curve shifts right.
- In the short run, the economy is on an upward-sloping SRAS curve (because wages and some input prices are sticky). The rightward shift of AD moves the equilibrium up along the SRAS curve, so real GDP (Y) increases and the price level (P) increases.
- Higher real GDP means firms need more workers, so employment rises and unemployment falls (the unemployment rate is negatively related to output growth).
- Therefore, the likely impact is: real GDP rising, price level rising, unemployment falling. This is exactly row C.
- Check other rows: A has falling real GDP – that would be contractionary policy, not expansionary. B has rising unemployment – wrong direction. D has falling price level – expansionary policy raises price level, not lowers it. So only C is correct.
Key Takeaways
- Expansionary monetary policy shifts AD right, raising real GDP and price level in the short run.
- Unemployment falls as output rises.
- The AD/AS model is the key framework for analysing macroeconomic policy impacts.
- In a multiple-choice question, it's often enough to identify the correct combination by eliminating inconsistent options.
Common Mistakes
- Confusing expansionary and contractionary policy: expansionary raises AD, contractionary lowers AD.
- Thinking that expansionary monetary policy reduces the price level (that would be deflation, not typical).
- Assuming that unemployment always moves in the same direction as GDP (it moves opposite: GDP up → unemployment down).
- Overlooking the short-run assumption: the question says 'over a three-year period', which is still short run in macro terms, so the long-run neutrality of money does not apply fully.
Things to Be Careful About
- The question uses 'government', but monetary policy is usually conducted by the central bank; however, the term is used broadly in some contexts.
- The three-year time horizon: monetary policy works with lags, but the effects are still expected to be in the short-run direction.
- In the long run, expansionary monetary policy only causes inflation, with no effect on real GDP or unemployment, but the question's likely impact is the short-run effect.
- Always consider the direction of each variable carefully: rising real GDP, rising price level, falling unemployment is the standard combination.
What is not an example of an expansionary supply-side policy?
Options
A a reduction in government spending on training
B an increase in support for technological improvement
C a reduction in payments to the unemployed
D an increase in privatisation of industry
Reasoning
Expansionary supply-side policies aim to increase the economy's productive capacity by shifting the LRAS curve to the right. They include measures such as improving training, supporting technological improvement, reducing unemployment benefits to increase labour market flexibility, and privatisation to increase efficiency.
Option A — a reduction in government spending on training — reduces the quality of the labour force and would likely decrease productive capacity, making it a contractionary supply-side policy, not an expansionary one.
Answer
A
A
Background Concept
Supply-side policy refers to government measures designed to increase the productive capacity of the economy — that is, to shift the long-run aggregate supply (LRAS) curve to the right. Expansionary supply-side policies aim to boost potential output, while contractionary ones reduce it. Common tools include spending on training and education, support for technological innovation, labour market reforms (e.g., reducing unemployment benefits to incentivise work), and privatisation (transferring state-owned enterprises to private ownership to improve efficiency).
Understanding the Question
This question asks which of the four options is NOT an example of an expansionary supply-side policy. The key is to identify which measure would reduce, rather than increase, the economy's productive capacity. Each option must be evaluated against the definition of expansionary supply-side policy.
Approach
- Recall the definition and typical tools of expansionary supply-side policy.
- Evaluate each option in turn:
- Option A: reduction in government spending on training — this reduces investment in human capital, likely lowering productivity and LRAS.
- Option B: increase in support for technological improvement — this boosts innovation and productivity, expanding LRAS.
- Option C: reduction in payments to the unemployed — this increases the incentive to work, raising labour supply and potential output.
- Option D: increase in privatisation — this often improves efficiency and productivity, expanding LRAS.
- Identify the option that is contractionary (reduces LRAS) — that is the correct answer.
Step-by-Step Reasoning
- Option A: Government spending on training improves the skills of the labour force, increasing human capital and productivity. A reduction in such spending would lower the quality of labour, reducing the economy's ability to produce goods and services. This is a contractionary supply-side policy, not expansionary.
- Option B: Support for technological improvement (e.g., R&D tax credits, grants) encourages innovation, leading to better production methods and higher productivity. This shifts LRAS right — expansionary.
- Option C: Reducing payments to the unemployed (e.g., lowering unemployment benefits) increases the opportunity cost of not working, encouraging people to seek employment. This raises the labour supply and can increase potential output — expansionary.
- Option D: Privatisation transfers industries from state to private ownership, often leading to greater efficiency, lower costs, and higher output — expansionary.
Thus, only Option A is not expansionary; it is contractionary.
Key Takeaways
- Expansionary supply-side policies increase the economy's productive capacity (shift LRAS right).
- Contractionary supply-side policies reduce productive capacity (shift LRAS left).
- Common expansionary tools include training, technology support, labour market reforms, and privatisation.
- A reduction in training spending is contractionary because it reduces human capital.
Common Mistakes
- Confusing 'reduction in government spending on training' with 'reduction in unemployment benefits' — both involve 'reduction' but have opposite effects on LRAS.
- Thinking that any reduction in government spending is contractionary fiscal policy (which affects AD) rather than supply-side policy (which affects LRAS).
- Not recognising that privatisation is generally considered expansionary because it improves efficiency.
Things to Be Careful About
- Read the question carefully: it asks for what is NOT an example of expansionary supply-side policy.
- Distinguish between supply-side policy (affects LRAS) and fiscal policy (affects AD).
- Understand that 'reduction in payments to the unemployed' is a labour market reform aimed at increasing labour supply, not a fiscal contraction.
The table shows the amount of tax paid on three different levels of income.
Which combination shows a proportional income tax system?
Options
| tax paid on annual income of $10 000 | tax paid on annual income of $20 000 | tax paid on annual income of $40 000 | |
|---|---|---|---|
| A | 1000 | 1000 | 1000 |
| B | 1000 | 1500 | 2000 |
| C | 1000 | 2000 | 4000 |
| D | 1000 | 2500 | 8000 |
Working
A proportional income tax is one where the average tax rate (tax paid / income) is constant at all income levels.
Calculate the average tax rate for each option:
Option A:
- $10 000: 1000 / 10 000 = 10%
- $20 000: 1000 / 20 000 = 5%
- $40 000: 1000 / 40 000 = 2.5%
Rates differ → not proportional.
Option B:
- $10 000: 1000 / 10 000 = 10%
- $20 000: 1500 / 20 000 = 7.5%
- $40 000: 2000 / 40 000 = 5%
Rates differ → not proportional.
Option C:
- $10 000: 1000 / 10 000 = 10%
- $20 000: 2000 / 20 000 = 10%
- $40 000: 4000 / 40 000 = 10%
Rate is constant at 10% → proportional.
Option D:
- $10 000: 1000 / 10 000 = 10%
- $20 000: 2500 / 20 000 = 12.5%
- $40 000: 8000 / 40 000 = 20%
Rates differ → not proportional.
Answer
C
C
Background Concept
A tax system can be classified by how the average tax rate (tax paid as a percentage of income) changes as income rises. There are three types:
- Proportional tax: The average tax rate is constant at all income levels. Everyone pays the same percentage of their income in tax.
- Progressive tax: The average tax rate rises as income rises. Higher-income earners pay a larger percentage of their income in tax.
- Regressive tax: The average tax rate falls as income rises. Lower-income earners pay a larger percentage of their income in tax.
The key is to focus on the average tax rate, not the total tax paid. A proportional system does not mean everyone pays the same amount; it means everyone pays the same proportion.
Understanding the Question
The question provides a table showing the total tax paid at three different income levels ($10 000, $20 000, and $40 000) for four hypothetical tax systems (A, B, C, D). The task is to identify which system is proportional. This is a direct application of the definition: calculate the average tax rate for each income level in each option and see which one yields a constant percentage.
Approach
For each option, compute the average tax rate (tax paid / income) for all three income levels. If the rate is the same for all three, the system is proportional. If the rate increases with income, it is progressive. If it decreases, it is regressive.
Step-by-Step Reasoning
-
Option A: Tax paid is $1000 at all income levels.
- At $10 000: 1000 / 10 000 = 0.10 = 10%
- At $20 000: 1000 / 20 000 = 0.05 = 5%
- At $40 000: 1000 / 40 000 = 0.025 = 2.5%
The average rate falls as income rises. This is a regressive tax system, not proportional.
-
Option B: Tax paid rises from $1000 to $1500 to $2000.
- At $10 000: 1000 / 10 000 = 10%
- At $20 000: 1500 / 20 000 = 7.5%
- At $40 000: 2000 / 40 000 = 5%
The average rate falls as income rises. This is also regressive.
-
Option C: Tax paid rises from $1000 to $2000 to $4000.
- At $10 000: 1000 / 10 000 = 10%
- At $20 000: 2000 / 20 000 = 10%
- At $40 000: 4000 / 40 000 = 10%
The average rate is constant at 10%. This is proportional.
-
Option D: Tax paid rises from $1000 to $2500 to $8000.
- At $10 000: 1000 / 10 000 = 10%
- At $20 000: 2500 / 20 000 = 12.5%
- At $40 000: 8000 / 40 000 = 20%
The average rate rises as income rises. This is progressive.
Only Option C shows a constant average tax rate, so it is the proportional system.
Key Takeaways
- The defining feature of a proportional tax is a constant average tax rate, not a constant amount of tax paid.
- To classify a tax system, always calculate the average tax rate (tax / income) at different income levels.
- A common mistake is to confuse a proportional tax with a flat amount of tax (Option A). A flat amount is regressive because it takes a larger percentage from lower incomes.
Common Mistakes
- Choosing Option A: A common error is to think that a proportional tax means everyone pays the same amount. In fact, a proportional tax means everyone pays the same percentage. Option A is regressive.
- Not calculating the rate: Some students might try to guess based on the pattern of the tax amounts without doing the division. The pattern in Option C (tax doubles when income doubles) is a clue, but the only reliable method is to calculate the percentage.
Things to Be Careful About
- Always divide the tax paid by the income to get the average tax rate.
- Remember the definitions: proportional (constant rate), progressive (rising rate), regressive (falling rate).
- Pay attention to the units: the rates are percentages, not dollar amounts.
Why does the value of a country’s terms of trade have no monetary units?
Options
A It cannot be calculated accurately enough.
B It includes more than one currency.
C It is a ratio of two index numbers.
D It measures change over time.
Reasoning
The terms of trade are defined as (Index of export prices / Index of import prices) × 100. Both numerator and denominator are index numbers, which are unitless comparisons relative to a base year. Therefore, the ratio — the terms of trade — is also an index number and has no monetary units.
Answer
C
C
Background Concept
The terms of trade measure the relative price of a country's exports compared to its imports. It is calculated as: Terms of trade = (Index of average export prices / Index of average import prices) × 100. Both indices are set to 100 in a base year, and then show how export and import prices change relative to that base. Because both are index numbers (pure numbers, not monetary amounts), their ratio is also a pure number, an index number, with no units such as dollars or euros. The terms of trade therefore indicate whether export prices have risen relative to import prices (an improvement) or fallen (a deterioration), but do not express the value in money.
Understanding the Question
The question asks for the reason why the terms of trade have no monetary units. The correct answer must be based on the economic definition of the terms of trade as a ratio of index numbers. The distractors are plausible but incorrect: Option A suggests inaccuracy of calculation, but accuracy is not the reason; Option B says it involves multiple currencies, which is true but not the fundamental reason — many economic indicators involve multiple currencies but still have units; Option D states that it measures change over time, which is a characteristic of index numbers but not the reason for being unitless.
Approach
Recall the precise definition and formula of the terms of trade. Recognise that both export and import prices are expressed as index numbers. An index number is a normalised measure relative to a base year, and as a ratio of two such numbers, the result is also a unitless index number. Evaluate each option against this definition.
Step-by-Step Reasoning
Option A: "It cannot be calculated accurately enough." — This is false. The terms of trade can be calculated precisely using published price indices. Inaccuracy does not explain the absence of monetary units.
Option B: "It includes more than one currency." — While it is true that a country's exports and imports are priced in various currencies, this does not inherently strip the value of monetary units. For example, the balance of trade is also affected by multiple currencies but is expressed in a single monetary unit (e.g., US dollars). So this is not the correct reason.
Option C: "It is a ratio of two index numbers." — This is the correct reason. Both export price index and import price index are index numbers, which are dimensionless. Their ratio is therefore also dimensionless. The terms of trade are a pure number that shows the relative price movement.
Option D: "It measures change over time." — Many economic measures that are expressed in monetary units also measure change over time (e.g., GDP growth in dollars). This is a property, not an explanation for lack of monetary units.
Thus, only option C is economically correct.
Key Takeaways
- The terms of trade are an index number, not a monetary value.
- Index numbers are ratios expressed relative to a base, and have no units.
- Understanding the definition and formula of the terms of trade is essential.
- When answering multiple-choice questions, always check the precise economic definition before evaluating options.
Common Mistakes
- Confusing the terms of trade with the balance of trade (which is a monetary value).
- Thinking that the terms of trade express the value of a country's exports or imports.
- Believing that because multiple currencies are involved, the value cannot have a single monetary unit (which is incorrect, as trade balances are converted to a common currency).
Things to Be Careful About
- The terms of trade are always expressed as an index, never in currency units.
- Remember that price indices are unitless; ratios of indices are also unitless.
- Distinguish between the terms of trade (relative price index) and the value of exports or imports (monetary values).
Which statement correctly describes a tariff?
Options
A It is a complete ban on imports.
B It is a minimum price for domestic producers.
C It is a payment to exporters.
D It is a tax imposed on imports.
A tariff is a tax imposed on imported goods, making them more expensive relative to domestic products. Option A describes a complete ban (an embargo). Option B describes a minimum price (a price floor) for domestic producers, not a tariff. Option C describes an export subsidy. Option D correctly identifies a tariff as a tax on imports.
Answer
D
D
Background Concept
A tariff is a form of protectionism — a government policy to restrict international trade. It is a tax levied on imported goods when they cross the border. The purpose is usually to raise the price of imports, making domestic goods more competitive, and to generate government revenue. Tariffs are distinct from other trade barriers such as quotas (quantity limits), embargoes (complete bans), subsidies (payments to domestic producers or exporters), and administrative barriers.
Understanding the Question
The question asks which of four statements correctly describes a tariff. It tests the basic definition and the ability to distinguish a tariff from other common trade policy tools. The options present a ban (embargo), a minimum price (price floor), a payment to exporters (export subsidy), and a tax on imports. Only the last matches the definition of a tariff.
Approach
Recall the precise definition of a tariff. Then evaluate each option against that definition. Eliminate options that describe other policies.
Step-by-Step Reasoning
- Option A: "It is a complete ban on imports." This describes an embargo or a prohibition, not a tariff. A tariff does not ban imports; it taxes them. Incorrect.
- Option B: "It is a minimum price for domestic producers." A minimum price (price floor) is a domestic market intervention, not a trade policy. It sets a legal lowest price for a good sold domestically. Tariffs apply to imports, not to domestic prices. Incorrect.
- Option C: "It is a payment to exporters." This describes an export subsidy — a payment to encourage exports. A tariff is a tax on imports, not a payment. Incorrect.
- Option D: "It is a tax imposed on imports." This is the standard definition of a tariff. Correct.
Thus, D is the correct answer.
Key Takeaways
- A tariff is a tax on imports, used to protect domestic industries and raise revenue.
- It is important to distinguish tariffs from other trade barriers: quotas (quantity limits), embargoes (bans), subsidies (payments), and administrative barriers.
- Multiple-choice questions on definitions require precise recall of key terms.
Common Mistakes
- Confusing a tariff with a quota (a limit on quantity) or an embargo (a complete ban).
- Thinking a tariff is a payment to exporters (that is a subsidy).
- Misinterpreting a tariff as a minimum price (which is a domestic price control).
Things to Be Careful About
- Read each option carefully; the wording is precise.
- Remember that a tariff is specifically a tax, not a quantity restriction or a payment.
- In economics, definitions matter — one word can change the meaning entirely.
A country has a persistent deficit on the current account of its balance of payments.
What is most likely to improve the situation in the long run?
Options
A a lowering of the level of import duties
B a reduction in the level of income tax
C the introduction of expansionary monetary policy
D the use of grants to encourage new investment by firms
Reasoning
A persistent current account deficit indicates that the country's export sector is not competitive enough in the long run. Demand-side policies (lowering import duties, reducing income tax, expansionary monetary policy) can only provide temporary relief and may worsen the deficit by raising imports. The only option that addresses the underlying competitiveness of the economy is D: grants to encourage new investment by firms. This is a supply-side policy that can increase productivity, lower costs, and improve the quality of exports, thereby strengthening the current account sustainably.
Answer
D
D
Background Concept
A persistent current account deficit means the country is consistently spending more on imports of goods, services, and income flows than it earns from exports. In the long run, this is unsustainable because it requires continuous borrowing from abroad. The fundamental cause is often a lack of international competitiveness: domestic firms produce goods that are too expensive, of poor quality, or not what the world wants. Policies to correct the deficit can be divided into demand-side (affecting aggregate demand and the exchange rate) and supply-side (affecting the economy's productive capacity and competitiveness). Only supply-side policies can address the root cause in the long run.
Understanding the Question
The question asks which policy is most likely to improve a persistent current account deficit in the long run. The key words are "persistent" (not a temporary blip) and "long run" (not a short-term fix). The four options are all possible government policies, but only one tackles the structural competitiveness problem. The others are demand-side measures that might temporarily reduce the deficit but are unlikely to sustain an improvement.
Approach
Evaluate each option against the criterion: does it address the long-run competitiveness of the export sector?
- A (lower import duties): This makes imports cheaper, likely increasing the deficit. It does nothing for exports.
- B (reduce income tax): This raises disposable income, increasing demand for imports. It may also stimulate domestic demand, pulling resources away from exports. No long-run competitiveness gain.
- C (expansionary monetary policy): Lower interest rates may depreciate the currency (helping exports in the short run) but also stimulate demand and imports. The effect is temporary and may be offset by inflation. Not a long-run solution.
- D (grants for new investment): This is a supply-side policy. It can increase productivity, lower costs, improve product quality, and develop new export markets. This directly addresses the competitiveness gap and can lead to a sustained improvement in the current account.
Step-by-Step Reasoning
-
Identify the problem: A persistent current account deficit means the country's exports are not competitive enough relative to imports. This is a structural issue, not a cyclical one.
-
Evaluate Option A: Lowering import duties reduces the price of imported goods. This will likely increase the volume of imports, worsening the trade balance. It does nothing to boost exports. Therefore, it is unlikely to improve the deficit.
-
Evaluate Option B: A reduction in income tax increases households' disposable income. This raises consumption, including consumption of imported goods. The resulting increase in imports will likely widen the deficit. There is no direct effect on export competitiveness.
-
Evaluate Option C: Expansionary monetary policy (e.g., lower interest rates) can lead to a depreciation of the exchange rate (if the currency is floating). A weaker currency makes exports cheaper abroad and imports more expensive, which could improve the current account in the short run. However, the effect is temporary and may be offset by higher inflation. Moreover, lower interest rates also stimulate domestic demand, increasing imports. The net effect is uncertain and not a long-run solution.
-
Evaluate Option D: Grants to encourage new investment by firms are a supply-side policy. New investment can:
- Increase productivity (more output per unit of input), lowering unit costs.
- Improve the quality and variety of goods produced, making exports more attractive.
- Develop new products and technologies, opening up new export markets.
- Shift the LRAS curve to the right, allowing non-inflationary growth.
All of these directly improve the international competitiveness of the export sector, leading to a sustained improvement in the current account. This is the only option that addresses the root cause.
-
Conclusion: Option D is the most likely to improve the persistent current account deficit in the long run.
Key Takeaways
- A persistent current account deficit is a structural problem requiring supply-side solutions.
- Demand-side policies (fiscal, monetary, trade barriers) can only provide temporary relief and may worsen the deficit.
- Supply-side policies that boost productivity and competitiveness are the key to a long-run improvement.
- Always consider the time horizon (short run vs. long run) when evaluating policy effectiveness.
Common Mistakes
- Choosing A (lower import duties) because it sounds like "free trade" – but it directly worsens the deficit.
- Choosing B or C because they are expansionary and might boost GDP – but they also boost imports, and do not address competitiveness.
- Not recognising that a persistent deficit requires a structural, not a cyclical, solution.
- Confusing a short-run depreciation (from monetary policy) with a long-run improvement.
Things to Be Careful About
- The phrase "in the long run" is crucial – it rules out temporary demand-side fixes.
- "Persistent" means the deficit is not due to a one-off shock but is a recurring feature.
- Grants for investment are a supply-side tool, not a demand-side one. They affect the economy's productive capacity, not aggregate demand directly.
Primary income and secondary income are components of the current account of the balance of payments.
Which option correctly identifies an example of primary income and secondary income?
Options
| primary income | secondary income | |
|---|---|---|
| A | government transfers | income from profits earned abroad |
| B | income from profits earned abroad | dividends earned on foreign shares |
| C | income from profits earned abroad | government transfers |
| D | workers' remittances | income from profits earned abroad |
Reasoning
Primary income consists of income from factors of production (e.g., profits, dividends, interest) earned abroad. Secondary income consists of transfers (e.g., government transfers, workers' remittances) where no good or service is exchanged.
Option A incorrectly lists government transfers as primary income. Option B incorrectly lists dividends as secondary income. Option D incorrectly lists workers' remittances as primary income and profits as secondary income. Only option C correctly identifies income from profits earned abroad as primary income and government transfers as secondary income.
Answer
C
C
Background Concept
The current account of the balance of payments records all transactions between residents of one country and the rest of the world that involve the exchange of goods, services, income, and transfers. It is divided into four main components:
- Trade in goods (visible trade)
- Trade in services (invisible trade)
- Primary income: income from the ownership of factors of production abroad, such as profits from foreign investments, dividends, interest, and earnings of residents working abroad (compensation of employees).
- Secondary income: transfers of money that do not involve a quid pro quo, such as government grants, foreign aid, remittances from workers abroad, and gifts.
The key distinction is that primary income is earned from providing factors of production (capital, labour), while secondary income is a transfer without any productive service in return.
Understanding the Question
This multiple-choice question asks you to correctly pair examples of primary income and secondary income. The table lists two columns: primary income and secondary income. You must select the row where both entries are correct according to the definitions above.
Approach
Recall the definitions: primary income = factor income (profits, dividends, interest, compensation of employees); secondary income = transfers (government transfers, remittances, gifts). Then evaluate each option by checking both entries.
Step-by-Step Reasoning
- Option A: primary income = government transfers (incorrect, because transfers are secondary income); secondary income = income from profits earned abroad (incorrect, because profits are primary income). Both wrong.
- Option B: primary income = income from profits earned abroad (correct); secondary income = dividends earned on foreign shares (incorrect, because dividends are a form of profit income, hence primary income). So secondary income entry is wrong.
- Option C: primary income = income from profits earned abroad (correct); secondary income = government transfers (correct). Both correct.
- Option D: primary income = workers' remittances (incorrect, because remittances are transfers, hence secondary income); secondary income = income from profits earned abroad (incorrect, because profits are primary income). Both wrong.
Thus only option C is correct.
Key Takeaways
- Primary income is factor income (earned from providing capital or labour abroad).
- Secondary income is transfer payments (no productive service in return).
- Common examples: profits, dividends, interest → primary income; government transfers, remittances, foreign aid → secondary income.
Common Mistakes
- Confusing workers' remittances with primary income: remittances are transfers from workers to their home country, so they are secondary income, not primary. (The worker's earnings abroad are primary income for the host country, but the remittance itself is a transfer.)
- Thinking dividends are secondary income: dividends are a return on equity investment, so they are primary income.
- Assuming government transfers are primary income: government transfers are unilateral transfers with no exchange, so they are secondary income.
Things to Be Careful About
- The distinction is based on whether the transaction is a factor payment (primary) or a transfer (secondary).
- In the balance of payments, compensation of employees (wages earned abroad) is included in primary income, not secondary.
- Always check both entries in the table; one correct entry does not make the option correct.
The table shows the change in the value of UK sterling over a three-month period.
| June | Sept |
|---|---|
| £1 = $1.38 | £1 = $1.32 |
What is likely to be the short-term impact of the change in the value of UK sterling on the UK economy?
Options
A increased disinflation
B increase in cost-push inflation
C more purchasing power of money
D reduced demand-pull inflation
Reasoning
The depreciation of the pound from £1 = $1.38 to £1 = $1.32 means that UK imports become more expensive. This increases the cost of imported raw materials and components, raising firms' costs of production. This is a supply-side shock that leads to cost-push inflation. Therefore, the likely short-term impact is an increase in cost-push inflation.
Answer
B
B
Background Concept
Exchange rates determine the price of one currency in terms of another. A depreciation means the currency loses value, so it buys less foreign currency. This affects the economy through import and export prices. In the short run, a depreciation makes imports more expensive, which can cause cost-push inflation as firms face higher input costs. Cost-push inflation occurs when the aggregate supply curve shifts left due to rising costs, leading to a higher price level and lower real output. Demand-pull inflation occurs when aggregate demand increases, pulling up prices.
Understanding the Question
The table shows that the pound depreciated against the US dollar over three months. The question asks for the likely short-term impact on the UK economy. The options are all about inflation: disinflation, cost-push inflation, purchasing power, demand-pull inflation. We need to identify which one is most directly caused by a depreciation in the short term.
Approach
First, recognize that a depreciation makes imports more expensive. This increases costs for firms that use imported inputs. In the short run, this is a supply-side cost shock, leading to cost-push inflation. We can also consider the effect on aggregate demand: exports become cheaper, which may increase net exports and aggregate demand, potentially causing demand-pull inflation. However, the question asks for the short-term impact, and the cost-push effect is more immediate and direct. Also, the depreciation reduces the purchasing power of money because the same amount of pounds buys fewer foreign goods, so option C is wrong. Disinflation is a reduction in inflation, not an increase. Demand-pull inflation would be reduced if aggregate demand falls, but depreciation tends to increase net exports, so demand-pull inflation would likely increase, not decrease. So B is correct.
Step-by-Step Reasoning
- The exchange rate change: £1 = $1.38 in June, £1 = $1.32 in September. This is a depreciation of the pound against the dollar (it takes fewer dollars to buy a pound, so the pound is weaker).
- Impact on import prices: UK imports from the US now cost more in pounds. For example, a US good priced at $1.38 would have cost £1 in June, but in September it costs £1.045 (since $1.32 = £1, so $1.38 = £1.045). So import prices rise.
- Impact on firms: Many UK firms import raw materials, components, and finished goods. Higher import prices increase their costs of production.
- Impact on aggregate supply: The increase in production costs shifts the short-run aggregate supply (SRAS) curve to the left. This means at any given price level, firms are willing to supply less output.
- Impact on price level and output: The leftward shift of SRAS leads to a higher price level (inflation) and lower real output (if the economy is not at full capacity). This is cost-push inflation.
- Short-term vs long-term: In the short term, the cost-push effect dominates. In the long term, firms may adjust, and the depreciation could also boost net exports and aggregate demand, potentially causing demand-pull inflation. But the question specifies short-term impact.
- Evaluate other options:
- A: Disinflation is a decrease in the rate of inflation. The depreciation increases inflation, so disinflation is unlikely.
- C: Purchasing power of money: The depreciation reduces the purchasing power of the pound because it buys fewer foreign goods, and domestic prices rise, so purchasing power falls, not increases.
- D: Reduced demand-pull inflation: Depreciation makes exports cheaper, which may increase export demand and aggregate demand, potentially increasing demand-pull inflation, not reducing it. So D is incorrect.
- Therefore, the correct answer is B: increase in cost-push inflation.
Key Takeaways
- A currency depreciation makes imports more expensive, leading to cost-push inflation in the short run.
- Cost-push inflation is caused by a leftward shift of the SRAS curve due to rising input costs.
- Depreciation can also affect aggregate demand through net exports, but the short-term impact is often cost-push.
- Understanding the distinction between cost-push and demand-pull inflation is crucial for analyzing exchange rate effects.
Common Mistakes
- Confusing depreciation with appreciation: Some might think the pound strengthened because it buys fewer dollars? Actually, £1 = $1.32 means it buys fewer dollars, so it's weaker. Mistaking the direction.
- Thinking that depreciation always leads to demand-pull inflation because exports become cheaper. While that is true, the short-term cost-push effect is more immediate and direct. The question asks for short-term impact.
- Choosing "more purchasing power of money" because they think the pound is stronger? Actually, depreciation reduces purchasing power.
- Not recognizing that cost-push inflation is the direct result of higher import costs.
Things to Be Careful About
- Read the exchange rate table carefully: a fall in the dollar value of the pound means depreciation.
- Distinguish between short-run and long-run effects. The question explicitly says "short-term impact".
- Remember that cost-push inflation is associated with supply-side shocks, while demand-pull is associated with demand-side shocks.
- In multiple-choice questions, eliminate obviously wrong options first.
Your score so far
Answer a question to start scoring
Your marks add up here as you work through the paper.