Economics 9708/22 — February/March 2025
Cambridge AS Level · AS Level Data Response and Essays · worked solutions for every part, with the mark scheme
Topics Demand and Supply · Elasticities of Demand · Consumer and Producer Surplus · Market Equilibrium and the Price Mechanism · Exchange Rates · Production Possibility Curves · +8 more
A global olive oil shortage
Almost every kitchen in the United States (US) will pay the price for the intense heat and drought in Europe in the summer of 2023. Olive harvests in key countries were so poor that some analysts were concerned that there would be a shortage of olives to produce enough olive oil to meet the demand around the world. The dramatic reduction in output of this typical household cooking oil has resulted in the consumer price of olive oil rising between 30% and 50% across the US. At the same time, the US dollar has fallen in value against Europe's main currency (the euro), further adding to the price increase of olive oil.
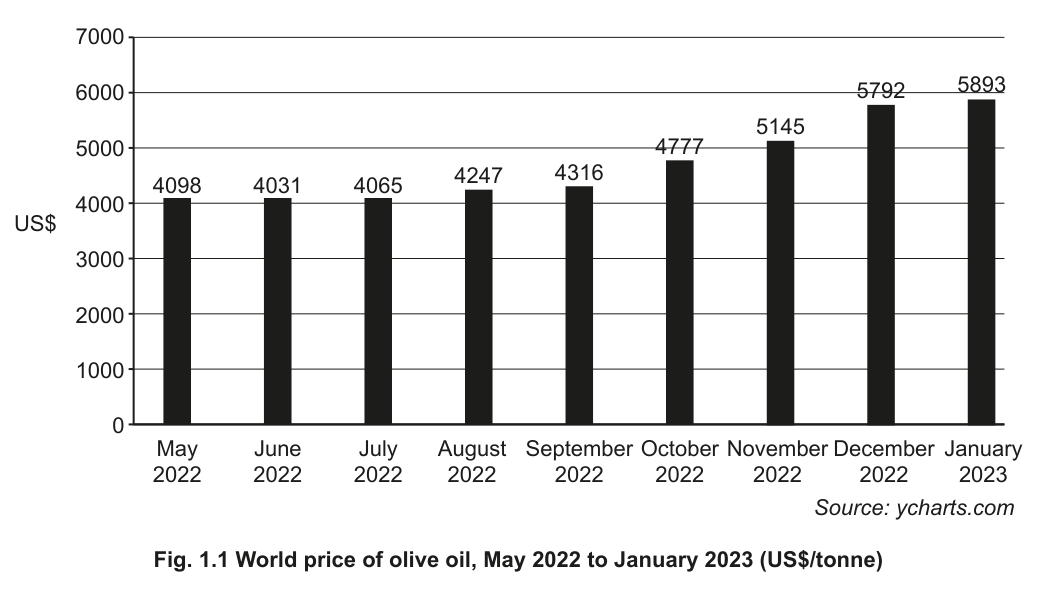
Fig. 1.1 World price of olive oil, May 2022 to January 2023 (US$/tonne)
Source: ycharts.com
In Spain, olive production was forecast to be down by about 50% in 2023, which would make it the lowest since 2008. The wide-scale drought conditions across Southern European and other Mediterranean countries significantly impacted on the global supply of olives, since about 80% of global output comes from these regions.
[Content removed due to copyright restrictions.]
Fig. 1.2 European Union (EU) production of olive oil, 2017 to 2023
Source: DG Agri olive oil dashboard
Restaurants and commercial kitchens are desperately trying to find a solution to the olive oil shortage, but alternatives are scarce too. Sunflower oil is a top choice for an olive oil replacement, but the conflict in Ukraine, which is the biggest producer of sunflower oil, has made this substitute increasingly difficult to access.
Previously, the US would look to other countries for olive oil, but supply chains have been severely disrupted. Olive oil does not store very well as its quality deteriorates over time, so increasing stocks does not solve the problem. It is perhaps unsurprising that analysts are recommending investment into new methods of storage that will preserve the quality of the olive oil. This would allow stocks to increase after good harvests to help stabilise prices during future periods of poor harvests.
Source: Adapted from: Olive oil prices climbing after heat, drought in Europe leads to poor harvest, Foxweather, 21 February 2023
Using Fig. 1.1, calculate the percentage change in the world price of olive oil between May 2022 and January 2023.
Working
Percentage change = ((Price in January 2023 - Price in May 2022) / Price in May 2022) × 100
= ((5893 - 4098) / 4098) × 100
≈ 43.8%
Answer
An increase of approximately 43.8% (any value between 43% and 44% is acceptable)
Approximately 43.8% increase
Background Concept
Percentage change is a basic quantitative measure used in economics to show the relative change in a variable over time. It is calculated as the difference between the new value and the original value, divided by the original value, multiplied by 100 to express it as a percentage. This measure is widely used for prices, quantities, income and other economic variables to compare changes across different time periods or different markets, as it accounts for the size of the original value.
Understanding the Question
This question provides a bar chart (Fig. 1.1) showing the world price of olive oil in US$ per tonne from May 2022 to January 2023. It asks you to calculate the percentage change in this price between the first month (May 2022, price = $4098/tonne) and the last month (January 2023, price = $5893/tonne) shown on the chart. The question is worth 2 marks, with 1 mark for identifying the direction of the change (increase) and 1 mark for the correct percentage value.
Approach
To calculate the percentage change, use the standard percentage change formula: ((New Value - Original Value) / Original Value) × 100. Substitute the two price values from the chart into the formula, then compute the result. Round to a reasonable number of decimal places (the mark scheme accepts any value between 43% and 44%).
Step-by-Step Reasoning
- Identify the original value: the world price of olive oil in May 2022 is $4098 per tonne, as shown on Fig. 1.1.
- Identify the new value: the world price in January 2023 is $5893 per tonne.
- Calculate the absolute change: 5893 - 4098 = 1795 US$/tonne.
- Divide the absolute change by the original value: 1795 / 4098 ≈ 0.438.
- Multiply by 100 to convert to a percentage: 0.438 × 100 ≈ 43.8%.
- Note that the value is positive, so the change is an increase.
Key Takeaways
- Percentage change is a standard measure of relative change, calculated as ((New - Old)/Old) × 100.
- When reading chart data, always double-check the axis labels and the values for the exact time periods requested.
- The mark scheme accepts a range of values (43-44%) for this calculation, as small differences in rounding are expected.
Common Mistakes
- Forgetting to multiply by 100, leading to an answer of 0.438 instead of 43.8%.
- Reversing the original and new values, leading to a negative percentage change (which would be incorrect, as the price rose).
- Quoting the absolute change ($1795) instead of the percentage change, which would not earn full marks.
Things to Be Careful About
- Always check the units of the chart (US$/tonne) to ensure you are using the correct values, though the units cancel out in the percentage change calculation.
- The question asks for percentage change, so the % sign is required (the mark scheme notes it can be inferred if missing, but it is better to include it).
Some restaurants and commercial kitchens are using sunflower oil as an alternative to olive oil.
Explain how economists could measure the impact of rising olive oil prices on the demand for sunflower oil.
Answer
Economists would use cross elasticity of demand (XED) to measure this impact. XED calculates the responsiveness of the quantity demanded of sunflower oil (the substitute) to a change in the price of olive oil. Since olive oil and sunflower oil are substitute goods, the XED coefficient will be positive, so a rise in olive oil prices will lead to an increase in the demand for sunflower oil. The size of the XED value will indicate how responsive this demand is to the price change.
Use cross elasticity of demand (XED); as the goods are substitutes, the XED coefficient will be positive, showing the positive relationship between olive oil prices and sunflower oil demand.
Background Concept
Cross elasticity of demand (XED) is an elasticity measure that calculates the responsiveness of the quantity demanded of one good (Good A) to a change in the price of another related good (Good B). The formula for XED is: % change in quantity demanded of Good A / % change in price of Good B. The sign of the XED coefficient tells us the relationship between the two goods: a positive XED means the goods are substitutes (a rise in the price of Good B leads to a rise in demand for Good A), a negative XED means they are complements (a rise in the price of Good B leads to a fall in demand for Good A), and an XED of zero means they are unrelated.
Understanding the Question
The question states that some restaurants are using sunflower oil as an alternative to olive oil, meaning the two goods are substitutes. It asks how economists could measure the impact of rising olive oil prices on the demand for sunflower oil. This is a 2-mark question, requiring you to identify the correct elasticity measure and explain its expected value for substitute goods.
Approach
First, identify that the two goods (olive oil and sunflower oil) are related, so an elasticity measure is needed. Cross elasticity of demand is the appropriate measure, as it looks at the relationship between the price of one good and the demand for another. Then, recall that for substitute goods, the XED coefficient is positive, so a rise in olive oil prices will lead to a rise in sunflower oil demand, and the size of the coefficient shows how strong this relationship is.
Step-by-Step Reasoning
- The question asks for the impact of a change in the price of olive oil (Good B) on the demand for sunflower oil (Good A), which are two different but related goods. The appropriate elasticity measure for this is cross elasticity of demand (XED).
- XED is calculated as the percentage change in the quantity demanded of sunflower oil divided by the percentage change in the price of olive oil.
- Olive oil and sunflower oil are substitutes, as they can be used in place of each other in cooking. For substitute goods, the XED coefficient is positive: when the price of olive oil rises, consumers switch to the cheaper substitute (sunflower oil), so the quantity demanded of sunflower oil rises.
- The magnitude of the positive XED value tells us how responsive sunflower oil demand is to changes in olive oil prices: a larger positive value means demand is very responsive, a smaller positive value means it is less responsive.
Key Takeaways
- Cross elasticity of demand (XED) is used to measure the relationship between the price of one good and the demand for another related good.
- The sign of XED reveals the relationship between goods: positive for substitutes, negative for complements, zero for unrelated goods.
- When answering questions about the impact of a price change of one good on another, first identify the relationship between the goods to select the correct elasticity measure.
Common Mistakes
- Confusing XED with price elasticity of demand (PED), which measures the responsiveness of demand for a good to its own price change, not the price of another good.
- Stating that the XED will be negative for substitutes, which is incorrect: substitutes have positive XED, complements have negative XED.
- Forgetting to explain why the coefficient is positive, which is required to earn the second mark.
Things to Be Careful About
- Always link the sign of XED to the relationship between the two goods: substitutes have positive XED because a price rise in one leads to higher demand for the other.
- The question asks how economists could measure the impact, so you must name the measure (XED) and explain its application to the two goods in question.
With reference to Fig. 1.2 and the help of a demand and supply diagram, consider the possible impact of increased olive oil prices in 2023 on consumer surplus.
Fig. 1.2 shows that EU olive oil production fell sharply in 2023, reducing global olive oil supply.
Diagram
Explanation
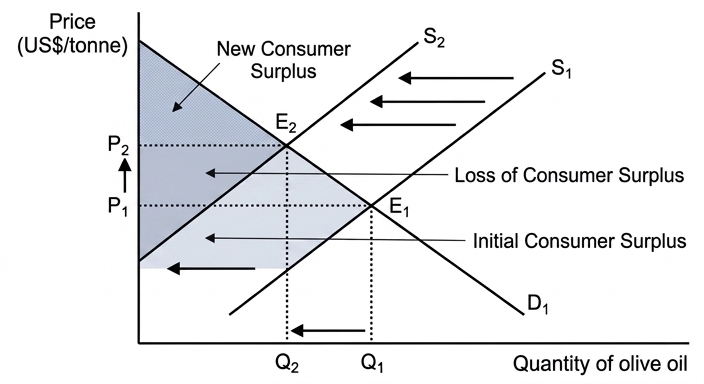
The poor 2023 olive harvest (shown in Fig. 1.2) reduces global supply, shifting the supply curve left from S1 to S2. This raises the equilibrium price from P1 to P2 and reduces the equilibrium quantity from Q1 to Q2. Consumer surplus is the area below the demand curve and above the market price. Initially, this is the large area above P1 and below D1. After the supply shift, the higher price P2 reduces this area to the smaller region above P2 and below D1, so consumer surplus falls.
Evaluation
The extent of the fall in consumer surplus depends on the price elasticity of demand (PED) for olive oil. If demand is price inelastic (likely for a staple cooking oil with few substitutes), the price rise will be larger, leading to a bigger reduction in consumer surplus. If demand were price elastic, the price rise would be smaller and the fall in consumer surplus would be less severe.
Consumer surplus will fall due to the higher equilibrium price from the supply reduction shown in Fig. 1.2; the extent of the fall depends on the price elasticity of demand for olive oil.
Background Concept
Consumer surplus is the difference between the price a consumer is willing and able to pay for a good and the actual market price they pay. It represents the net benefit that consumers gain from purchasing a good at the market price, and is shown graphically as the triangular area below the demand curve and above the equilibrium price line. When market conditions change (e.g., a shift in supply or demand), the equilibrium price and quantity change, which alters the size of consumer surplus. A rise in market price reduces consumer surplus, as the gap between consumers' willingness to pay and the market price narrows; a fall in price increases consumer surplus.
Understanding the Question
This question refers to Fig. 1.2, which shows EU olive oil production fell sharply in 2023 (the text notes a 50% fall in Spanish production, and 80% of global olive output comes from Mediterranean regions, so this is a large negative supply shock). It asks you to consider the impact of the resulting rise in olive oil prices on consumer surplus, using a demand and supply diagram. The question is worth 4 marks: 1 for a correctly labelled diagram showing initial consumer surplus, 1 for a leftward supply shift, 1 for explaining the fall in consumer surplus, and 1 for evaluative comment (e.g., role of price elasticity of demand).
Approach
First, reference the evidence from Fig. 1.2 and the text: the poor 2023 harvest reduces global olive oil supply. Then, draw a standard demand and supply diagram for the olive oil market, showing initial equilibrium and initial consumer surplus. Show the leftward shift in supply caused by the harvest failure, and the new higher equilibrium price and lower quantity. Explain that the higher price reduces the area of consumer surplus. Finally, add a short evaluative point: the size of the change in consumer surplus depends on the price elasticity of demand for olive oil.
Step-by-Step Reasoning
- Diagram setup: Draw the demand and supply diagram with price on the y-axis and quantity on the x-axis. Plot a downward-sloping demand curve (D1) and upward-sloping initial supply curve (S1), intersecting at initial equilibrium E1, with price P1 and quantity Q1. Label the initial consumer surplus as the triangular area above P1 and below D1.
- Supply shift: The poor olive harvest in the EU (shown by the fall in production in Fig. 1.2) reduces the total global supply of olive oil, so the supply curve shifts left (inward) from S1 to S2.
- New equilibrium: The new supply curve S2 intersects the demand curve D1 at a new equilibrium E2, with a higher price P2 and lower quantity Q2.
- Change in consumer surplus: Consumer surplus is now the smaller triangular area above P2 and below D1. This is because the higher market price means consumers now pay more for each unit, so the difference between what they are willing to pay and what they actually pay is smaller. Total consumer surplus falls.
- Evaluative point: The extent of the fall in consumer surplus depends on the price elasticity of demand (PED) for olive oil. If demand is price inelastic (as is likely for a staple cooking oil with few close substitutes, especially given the sunflower oil supply disruption from Ukraine), the price rise will be large, leading to a large fall in consumer surplus. If demand were price elastic, the price rise would be smaller and the fall in consumer surplus would be less severe.
Key Takeaways
- Consumer surplus is the net benefit to consumers from paying a market price lower than their willingness to pay, shown as the area below the demand curve and above the price.
- A leftward shift in supply (caused by a negative supply shock like a poor harvest) raises the equilibrium price and reduces equilibrium quantity, which reduces consumer surplus.
- The size of the change in consumer surplus depends on the price elasticity of demand: inelastic demand leads to a larger price rise and bigger fall in consumer surplus.
Common Mistakes
- Drawing the supply shift in the wrong direction (rightward instead of leftward), which would incorrectly show a price fall and rise in consumer surplus.
- Forgetting to label the initial consumer surplus on the diagram, which would lose a mark.
- Explaining the change in consumer surplus incorrectly, e.g., saying it rises because demand is high, rather than linking it to the higher market price reducing the gap between willingness to pay and actual price.
- Omitting the evaluative point, which would lose the final 1 mark.
Things to Be Careful About
- The question explicitly asks you to reference Fig. 1.2, so you must mention the fall in EU olive oil production shown in the chart as the cause of the supply shift.
- The diagram must be clearly labelled: you need to label the demand curve, supply curves (initial and new), equilibrium points, prices, and the initial consumer surplus area to earn full marks for the diagram.
- The evaluative point must be linked to the question: do not just state "it depends on PED", but explain how PED affects the size of the change in consumer surplus.
Assess the likely impact of increasing stocks of olive oil on the price and quantity of olive oil traded in the future.
Analysis 1: Positive impact on price and quantity
Increasing olive oil stocks after good harvests allows supply to be increased when future harvests are poor, shifting the supply curve right. This reduces the equilibrium price of olive oil and increases the equilibrium quantity traded, stabilising prices for consumers and incomes for producers.
Analysis 2: Limited or negative impact on price and quantity
If storage costs are high, producers may need to charge higher prices to cover these costs, offsetting the price-reducing effect of increased stocks. Additionally, olive oil quality deteriorates over time, so consumers may demand less stored olive oil or switch to alternatives, reducing the quantity traded.
Conclusion
The impact of increasing stocks on price and quantity depends on the size of the stocks held relative to supply shortfalls, and the cost and effectiveness of storage. If sufficient high-quality stocks can be stored at low cost, prices will fall and quantity traded will rise, stabilising the market. If storage is costly or quality deteriorates significantly, the impact on price and quantity will be limited.
Increasing olive oil stocks will reduce price volatility and lower prices during poor harvests, increasing quantity traded, but the magnitude of this effect depends on storage costs and the ability to preserve olive oil quality; if storage is ineffective, the impact on price and quantity will be limited.
Background Concept
A buffer stock scheme is a policy where a government or authority buys and stores a good when supply is high (and prices are low) and releases the stock when supply is low (and prices are high) to stabilise prices and quantities in the market. When supply increases (e.g., after a good harvest), storing excess output reduces the immediate supply in the market, preventing prices from falling too low. When supply falls (e.g., during a poor harvest), releasing stored stock increases supply, preventing prices from rising too high. This stabilises the equilibrium price and quantity traded over time, protecting both consumers from price spikes and producers from price crashes.
Understanding the Question
This question asks you to assess the likely impact of increasing olive oil stocks on the future price and quantity of olive oil traded. The context is that olive oil does not store well, so current storage is limited, but analysts recommend investing in better storage to allow stockpiling after good harvests. The question is worth 6 marks, with up to 4 marks for analysis (both sides of the impact) and 2 marks for evaluation, including a justified conclusion.
Approach
You need to develop two sides of analysis: first, the case that increasing stocks will lower prices and raise quantity traded (by increasing supply during poor harvests), and second, the case that increasing stocks will have limited or no impact (due to storage costs, quality deterioration, or other factors). Then, weigh these two sides against each other to reach a justified conclusion on the likely overall impact.
Step-by-Step Reasoning
Analysis 1: Increasing stocks will lower price and raise quantity traded
- After a good olive harvest, supply is high, so prices are low. Storing excess olive oil in buffer stocks reduces the immediate supply in the market, preventing prices from falling too low and stabilising producer incomes.
- When a future poor harvest occurs (like the 2023 drought), the stored olive oil can be released into the market, increasing the total supply available.
- The increase in supply shifts the supply curve right, leading to a lower equilibrium price and higher equilibrium quantity traded than would occur without the stocks. This prevents the large price spikes and quantity shortages seen during the 2023 shortage, stabilising the market for both consumers and producers.
Analysis 2: Increasing stocks will have limited or no impact on price and quantity
- Storing olive oil is costly: facilities, refrigeration, security, and insurance all add to the cost of holding stocks. If these costs are high, producers may need to charge higher prices when releasing stored stock to cover these costs, offsetting the price-reducing effect of the increased supply.
- Olive oil quality deteriorates over time, as noted in the text. If stored olive oil is perceived as lower quality by consumers, demand for it will be lower than for fresh olive oil. This would reduce the quantity of stored oil that can be sold, and may lead to a smaller increase in supply than expected, limiting the fall in price and rise in quantity traded.
- If the size of the buffer stocks is too small relative to the scale of the supply shortfall during a poor harvest, the additional supply from stocks will not be enough to significantly lower prices or raise quantity traded.
Evaluation and Conclusion
The impact of increasing stocks depends on two key factors: the size of the stocks held relative to typical supply shortfalls, and the cost and effectiveness of storage technology. If investments in storage reduce deterioration and keep costs low, and stocks are large enough to cover most shortfalls, increasing stocks will significantly lower prices and raise quantity traded during poor harvests, stabilising the market. If storage remains costly or quality cannot be preserved, the impact will be limited, and prices may still rise sharply during severe shortages. Given the text notes analysts are recommending investment in new storage methods, it is likely that improved storage will have a positive impact, but the magnitude depends on the success of these investments.
Key Takeaways
- Buffer stock schemes work by increasing supply during periods of low supply (poor harvests) to stabilise prices and quantities.
- The effectiveness of buffer stocks depends on the size of the stocks relative to supply shocks, and the cost of storing the good.
- Quality deterioration of stored goods can reduce the effectiveness of buffer stocks, as demand for lower-quality stored goods may be lower.
Common Mistakes
- Only developing one side of the analysis (either only the positive impact or only the negative impact), which would lose marks for evaluation, as the question asks to "assess" the impact.
- Forgetting to link the analysis to the specific context of olive oil (e.g., mentioning that olive oil deteriorates over time, as stated in the text).
- Ending with a summary of both sides instead of a justified conclusion, which would lose evaluation marks.
- Confusing the effect of stocks on supply: releasing stocks increases supply, while holding stocks reduces current supply; mixing these up would lead to incorrect analysis.
Things to Be Careful About
- The question asks about the impact on future price and quantity, so you must focus on the effect during future poor harvests, not the current market.
- Ensure you address both price and quantity in your analysis, as the question explicitly asks for both.
- The conclusion must be justified: do not just say "it depends", but explain what it depends on and which outcome is more likely under different conditions.
Assess the extent to which a fall in the value of the US dollar against the euro is likely to affect US imports of olive oil from the EU.
Analysis 1: Negative impact on US imports of EU olive oil
A fall in the value of the US dollar (depreciation against the euro) increases the dollar price of EU olive oil, as US buyers need more dollars to purchase the same amount of euro-priced olive oil. This reduces US demand for EU olive oil, lowering imports from the EU. US buyers may also switch to olive oil from non-EU countries or to substitutes like sunflower oil, further reducing EU imports.
Analysis 2: Limited impact on US imports of EU olive oil
The effect may be limited if the price elasticity of demand for olive oil is inelastic, as consumers may continue to buy EU olive oil despite the higher price, especially given the limited availability of substitutes (due to the Ukraine conflict disrupting sunflower oil supply). The impact may also be reduced in the short run if the US holds existing olive oil stocks, or if the exchange rate fall is temporary.
Conclusion
The fall in the US dollar is likely to reduce US imports of olive oil from the EU, but the extent of the reduction is constrained by the inelastic demand for olive oil and the lack of available substitutes due to the Ukraine conflict; the reduction will be significant but not drastic.
A fall in the US dollar against the euro will likely reduce US imports of EU olive oil, but the extent of the reduction is limited by the inelastic demand for olive oil and the lack of available substitutes due to the Ukraine conflict.
Background Concept
An exchange rate is the price of one currency expressed in terms of another currency. When a currency depreciates, its value falls relative to another currency, meaning it buys less of the foreign currency. For an importer, a depreciation of the domestic currency makes imports more expensive, as more domestic currency is needed to buy the same amount of foreign currency to pay for the imports. This reduces the demand for imports, as the higher price makes them less affordable for domestic buyers. The extent of this reduction depends on the price elasticity of demand for the imported good, and the availability of substitutes.
Understanding the Question
This question asks you to assess the extent to which a fall in the value of the US dollar against the euro will affect US imports of olive oil from the EU. The context is that the US dollar has fallen against the euro, and the US already faces a shortage of olive oil and limited substitute availability due to the Ukraine conflict. The question is worth 6 marks, with up to 4 marks for analysis (both sides of the impact) and 2 marks for evaluation, including a justified conclusion on the extent of the effect.
Approach
Develop two sides of analysis: first, the case that the dollar depreciation will significantly reduce US imports of EU olive oil (as it makes EU olive oil more expensive for US buyers), and second, the case that the effect will be limited (due to inelastic demand, lack of substitutes, or short-run stockpiles). Then weigh these sides to reach a justified conclusion on how large the effect will be.
Step-by-Step Reasoning
Analysis 1: The fall in the US dollar will significantly reduce US imports of EU olive oil
- A fall in the value of the US dollar against the euro means that 1 euro now costs more US dollars than before. Since EU olive oil is priced in euros, US buyers need to spend more dollars to purchase the same amount of EU olive oil.
- The higher dollar price of EU olive oil reduces the demand for EU olive oil in the US, as some consumers and businesses switch to cheaper alternatives or reduce their consumption.
- This leads to a fall in the quantity of olive oil imported from the EU. US buyers may also switch to olive oil from non-EU countries (where the currency has not appreciated against the dollar) or to substitutes like sunflower oil, further reducing imports from the EU.
Analysis 2: The fall in the US dollar will have a limited effect on US imports of EU olive oil
- The price elasticity of demand (PED) for olive oil is likely to be price inelastic, as it is a staple cooking oil with few close substitutes. The text notes that sunflower oil (the main substitute) is in short supply due to the Ukraine conflict, so there are few alternatives to olive oil. When demand is inelastic, a rise in price leads to a less than proportional fall in quantity demanded, so the reduction in imports will be relatively small.
- The impact may be limited in the short run if the US holds existing stocks of olive oil, which can be used to smooth out the higher prices without reducing imports immediately.
- If the fall in the US dollar is temporary, US buyers may continue to purchase EU olive oil in the short run, waiting for the exchange rate to recover, so the impact on imports is delayed or reduced.
Evaluation and Conclusion
The fall in the US dollar will reduce US imports of olive oil from the EU, but the extent of the reduction is limited by the inelastic demand for olive oil and the lack of available substitutes due to the Ukraine war. While the higher price will reduce demand, the absence of close alternatives means consumers cannot easily switch away from EU olive oil, so the fall in imports will be moderate rather than drastic. If the dollar continues to fall in the long run, or if substitute supply improves, the reduction in imports could become larger.
Key Takeaways
- A depreciation of the domestic currency makes imports more expensive, reducing demand for imports, ceteris paribus.
- The extent of the change in import demand depends on the price elasticity of demand for the imported good and the availability of substitutes.
- Real-world context (e.g., supply disruptions of substitutes, existing stock levels) can limit the impact of exchange rate changes on trade flows.
Common Mistakes
- Only developing one side of the analysis (either only the negative impact on imports or only the limited impact), which would lose all evaluation marks, as the question asks to "assess the extent".
- Confusing depreciation with appreciation: a fall in the value of the dollar is depreciation, which makes imports more expensive, not cheaper.
- Forgetting to link the analysis to the specific context of the Ukraine conflict reducing sunflower oil supply, which limits substitute availability and makes demand more inelastic.
- Ending with a vague conclusion like "it depends" without explaining what it depends on or which outcome is more likely, which would lose evaluation marks.
Things to Be Careful About
- The question asks about the extent of the impact, so your conclusion must explicitly state how large the effect is likely to be (e.g., moderate reduction, significant but not drastic), not just say it will have an impact.
- Ensure you distinguish between the effect on imports of olive oil from the EU specifically, not just overall olive oil imports: the analysis must focus on EU imports, not imports from all countries.
- Use the context provided in the question (Ukraine conflict, olive oil storage issues) to strengthen your analysis, as this shows you are applying theory to the specific scenario.
With the help of a production possibility curve (PPC) diagram, explain the terms scarcity and choice and consider the extent to which every choice has an equal opportunity cost.
Answer
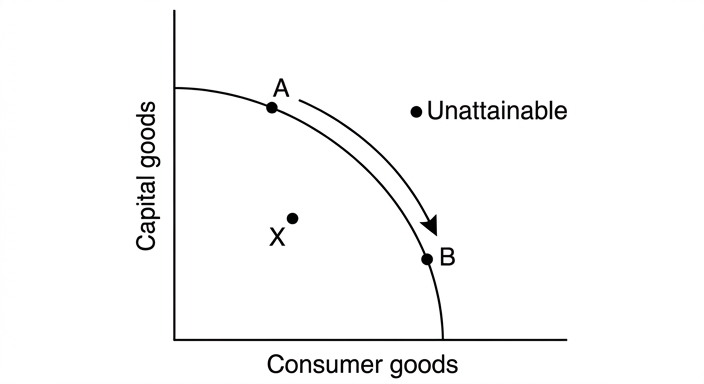
Scarcity is shown by the PPC: the curve represents the maximum combinations of two goods that can be produced given limited resources. Any point on the curve (e.g., point A) uses all resources fully, so to produce more of one good, resources must be reallocated from the other good – this is choice. The opportunity cost of producing an additional unit of consumer goods is the amount of capital goods forgone, shown by the movement along the curve from A to B.
The extent to which every choice has an equal opportunity cost depends on the shape of the PPC. If the PPC is a straight line, the opportunity cost is constant because resources are equally suited to producing both goods. If the PPC is concave (bowed outward), the opportunity cost increases as more of one good is produced because resources are not equally efficient in both uses. Additionally, if the economy is operating inside the PPC (point X), there are unemployed resources, so increasing production of one good does not require sacrificing the other – opportunity cost is zero. Therefore, not every choice has an equal opportunity cost; it varies with the shape of the PPC and the position on or inside it.
The extent to which every choice has an equal opportunity cost depends on the shape of the PPC and whether the economy is operating on the curve. On a straight-line PPC, opportunity cost is constant; on a concave PPC, it increases; inside the curve, opportunity cost is zero.
Background Concept
The production possibility curve (PPC) is a model that shows the maximum combinations of two goods or services that an economy can produce given its limited resources and technology. It illustrates the fundamental economic problem of scarcity: resources are finite, but wants are infinite. The PPC also demonstrates choice: to produce more of one good, the economy must produce less of the other, reflecting opportunity cost. The shape of the PPC can be a straight line (constant opportunity cost) or concave (increasing opportunity cost). A straight-line PPC implies that resources are equally suited to producing both goods, so the trade-off is constant. A concave PPC implies that resources are not equally efficient in all uses, so as more of one good is produced, the opportunity cost increases because less efficient resources are transferred.
Understanding the Question
The question asks you to use a PPC diagram to explain scarcity and choice, and then to consider the extent to which every choice has an equal opportunity cost. The command word 'explain' requires you to define the terms and show how they are represented on the diagram. The phrase 'consider the extent to which' requires evaluation: you must discuss whether opportunity cost is always equal and reach a justified conclusion. The mark scheme allocates up to 3 marks for knowledge (diagram and definitions), up to 3 for analysis (using the diagram to explain), and up to 2 for evaluation (discussing the extent and concluding).
Approach
First, draw a PPC diagram with appropriate axes (e.g., capital goods on the vertical axis, consumer goods on the horizontal axis). Label the curve, and mark points: a point on the curve (e.g., A), another point on the curve (e.g., B), and a point inside the curve (e.g., X). Explain that scarcity is shown by the curve itself – the economy cannot produce beyond it. Choice is shown by the need to select a point on the curve; moving from A to B involves a trade-off. Opportunity cost is the amount of the other good given up. Then evaluate: if the PPC is a straight line, opportunity cost is constant; if concave, it increases; if inside the curve, opportunity cost is zero. Conclude that not every choice has equal opportunity cost.
Step-by-Step Reasoning
- Draw the PPC: a concave curve from the vertical axis to the horizontal axis. Label axes: 'Capital goods' and 'Consumer goods'. Label the curve 'PPC'. Mark point A on the curve (high capital, low consumer), point B on the curve (lower capital, higher consumer), and point X inside the curve.
- Scarcity: The PPC represents the maximum output possible with given resources. Any point beyond the curve is unattainable, showing that resources are scarce. The economy cannot have unlimited amounts of both goods.
- Choice: To move from A to B, the economy must choose to produce more consumer goods and fewer capital goods. This is a choice about resource allocation.
- Opportunity cost: The movement from A to B involves giving up some capital goods (the vertical distance) to gain more consumer goods (the horizontal distance). This is the opportunity cost.
- Evaluation of equal opportunity cost: If the PPC is a straight line, the slope is constant, so the opportunity cost of producing an additional unit of consumer goods is always the same amount of capital goods. If the PPC is concave, the slope becomes steeper as more consumer goods are produced, meaning the opportunity cost increases. This is because resources are not equally productive in both sectors; initially, resources that are better at producing consumer goods are used, but as production expands, less suitable resources are transferred, raising the cost. Additionally, if the economy is at point X inside the PPC, there are unemployed resources. Increasing production of consumer goods can be done without reducing capital goods, so opportunity cost is zero. Therefore, the extent to which every choice has an equal opportunity cost depends on the shape of the PPC and whether the economy is on the curve.
Key Takeaways
- The PPC is a powerful tool to illustrate scarcity, choice, and opportunity cost.
- Opportunity cost is not always constant; it depends on the shape of the PPC and the position on the curve.
- A straight-line PPC implies constant opportunity cost; a concave PPC implies increasing opportunity cost; inside the PPC, opportunity cost is zero.
- Evaluation requires a conclusion that directly answers the question.
Common Mistakes
- Drawing a PPC without labelling axes or points.
- Confusing a shift of the PPC with a movement along it.
- Stating that opportunity cost is always constant without considering the shape.
- Failing to provide a conclusion for the evaluation part.
- Not explaining the diagram in the written answer.
Things to Be Careful About
- Ensure the diagram is clearly labelled: axes, curve, points, and arrows if showing movement.
- In the written answer, refer to the diagram explicitly (e.g., 'as shown by the movement from A to B').
- For the evaluation, give a clear judgement: 'Not every choice has an equal opportunity cost; it depends on...'
- Use correct economic terminology: 'opportunity cost', 'scarcity', 'choice', 'production possibility curve'.
Answer
Introduction
A market economy allocates resources through the price mechanism, where consumer demand and producer supply determine prices and quantities. This essay assesses whether this allocation is always beneficial by examining its advantages and disadvantages.
Advantages of market allocation
The price mechanism provides incentives for efficient resource use. Firms respond to consumer preferences, producing goods that are in demand, which leads to allocative efficiency. Competition drives firms to minimise costs and innovate, resulting in productive efficiency and dynamic efficiency. For example, the technology sector has seen rapid innovation due to competitive pressures. Additionally, the profit motive encourages investment and entrepreneurship, fostering economic growth. Consumers benefit from a wide variety of goods and services at competitive prices.
Disadvantages of market allocation
However, markets can fail to allocate resources beneficially. Public goods, such as national defence, are non-excludable and non-rival, so they are under-provided by the market due to the free-rider problem. Merit goods, like education, may be under-consumed because individuals lack perfect information about their long-term benefits. Demerit goods, such as tobacco, are over-consumed due to imperfect information. Negative externalities, like pollution, are not reflected in market prices, leading to overproduction. Furthermore, markets can lead to income and wealth inequality, as those with more resources can earn higher incomes, while others may be left behind. Monopoly power can also arise, reducing consumer welfare.
Evaluation
The extent to which market allocation is beneficial depends on the specific circumstances. In many cases, the market does achieve efficient outcomes and promotes growth. However, where market failures exist, the allocation is not beneficial without intervention. The severity of these failures varies; for example, the under-provision of public goods is a clear case where the market fails entirely. On the other hand, some market failures can be addressed through regulation, taxation, or provision of information, which can improve outcomes without abandoning the market system. Therefore, the allocation of resources in a market economy is not always beneficial; it requires complementary government intervention to correct failures.
Conclusion
In conclusion, while a market economy has significant strengths in promoting efficiency, innovation, and choice, it is not always beneficial due to market failures and inequality. The allocation of resources is beneficial only when markets are competitive and externalities are internalised. Thus, a mixed economy that combines market forces with government intervention is often more beneficial than a pure market economy.
The allocation of resources in a market economy is not always beneficial. While it promotes efficiency, innovation, and consumer choice, it fails to provide public goods, leads to externalities, and creates inequality. Therefore, government intervention is often necessary to achieve a more beneficial allocation.
Background Concept
A market economy is an economic system where resources are allocated through the price mechanism based on the interaction of demand and supply. The price mechanism performs three functions: signalling (prices indicate where resources are needed), incentivising (higher prices encourage producers to supply more), and rationing (prices allocate scarce goods to those willing to pay). In theory, competitive markets lead to allocative efficiency (where price equals marginal cost) and productive efficiency (where firms produce at minimum average cost). However, markets can fail to achieve these outcomes due to market failures such as externalities, public goods, merit/demerit goods, and inequality. Government intervention may be required to correct these failures.
Understanding the Question
The question asks you to assess whether the allocation of resources in a market economy is always beneficial. 'Assess' requires a balanced discussion of both the benefits and drawbacks, and a justified conclusion. The mark scheme uses level descriptors: top band requires detailed knowledge, developed analysis, and a justified conclusion. The indicative content includes advantages (efficiency, innovation, choice) and disadvantages (market failures, inequality). You must address the word 'always' – this implies that you should consider whether there are exceptions or conditions under which market allocation is not beneficial.
Approach
Structure your essay with an introduction defining the market economy and the price mechanism. Then present the advantages: allocative efficiency, productive efficiency, dynamic efficiency, consumer choice. Use examples. Then present the disadvantages: public goods, externalities, merit/demerit goods, inequality, monopoly power. Then evaluate: weigh the strengths against the weaknesses. Consider that some market failures can be corrected, but others are inherent. Conclude that market allocation is not always beneficial; it depends on the presence of market failures and the need for intervention.
Step-by-Step Reasoning
- Introduction: Define a market economy and state that the essay will assess its benefits and drawbacks.
- Advantages:
- Allocative efficiency: Prices reflect consumer preferences, so resources flow to where they are most valued. Example: the market for smartphones allocates resources to produce models that consumers demand.
- Productive efficiency: Competition forces firms to minimise costs to survive. Example: car manufacturers constantly improve production processes.
- Dynamic efficiency: The profit motive encourages innovation and investment. Example: pharmaceutical companies invest in R&D to develop new drugs.
- Consumer choice: A wide variety of goods and services are available.
- Disadvantages:
- Public goods: Non-excludable and non-rival, so private firms cannot profitably supply them. Example: street lighting. The market under-provides, leading to a loss of welfare.
- Externalities: Negative externalities (e.g., pollution) are not priced, leading to overproduction. Positive externalities (e.g., education) are under-produced.
- Merit and demerit goods: Imperfect information leads to under-consumption of merit goods (e.g., education) and over-consumption of demerit goods (e.g., alcohol).
- Inequality: Markets reward factors of production based on their productivity, which can lead to large disparities in income and wealth. Example: high wages for skilled workers, low wages for unskilled.
- Monopoly power: Without regulation, firms can gain market power and charge higher prices, reducing consumer surplus.
- Evaluation:
- The extent to which market allocation is beneficial depends on the specific market conditions. In competitive markets with no externalities, the market works well. However, where market failures exist, the allocation is not beneficial.
- Some market failures can be corrected through government intervention (e.g., taxes on pollution, provision of public goods), so the market can still be part of a mixed economy.
- The word 'always' is key: there are clear cases where market allocation fails, so it is not always beneficial.
- Conclusion: A market economy has significant advantages, but it is not always beneficial due to market failures. Therefore, a mixed economy with government intervention is often more beneficial.
Key Takeaways
- The market economy has strengths in efficiency and innovation.
- Market failures are important limitations.
- Evaluation requires a balanced discussion and a justified conclusion.
- The word 'always' should be addressed directly.
Common Mistakes
- Writing a one-sided answer (only advantages or only disadvantages) – this loses all evaluation marks.
- Providing a conclusion that is a summary rather than a judgement.
- Not using economic terminology (e.g., 'allocative efficiency', 'externalities').
- Making assertions without explanation or examples.
- Failing to address the word 'always'.
Things to Be Careful About
- Ensure both sides are developed equally.
- Use specific examples to support points.
- Provide a clear, justified conclusion that directly answers the question.
- Avoid vague statements like 'it depends' without explaining what it depends on.
- Structure the essay logically with clear paragraphs.
Explain the difference between a public good and a private good (economic good) and consider the extent to which a beach could be described as a public good.
Answer
A public good is a good that is non-rivalrous (one person's consumption does not reduce availability for others) and non-excludable (it is impossible or very costly to prevent anyone from consuming it). A private good (economic good) is both rivalrous and excludable.
A beach can be non-rivalrous when it is uncrowded, but at peak times it becomes rivalrous because one person's use reduces space for others. It can be excludable if access is controlled (e.g., a private beach with entry fees), but many beaches are open to all and thus non-excludable. Therefore, a beach does not fully satisfy both characteristics of a pure public good; it is best described as a quasi-public good. The extent to which it is a public good depends on the specific circumstances of demand and the ability to exclude.
Conclusion: A beach is not a pure public good but can be considered a quasi-public good.
A beach is not a pure public good; it is a quasi-public good because it can be rivalrous at high demand and excludable if access is controlled.
Background Concept
Public goods are defined by two characteristics: non-rivalry and non-excludability. Non-rivalry means that consumption by one person does not diminish the quantity available for others. Non-excludability means that it is impossible or prohibitively costly to prevent anyone from consuming the good. Private goods are both rivalrous and excludable. Quasi-public goods have some but not all of these characteristics.
Understanding the Question
The question asks to explain the difference between a public good and a private good, and then consider the extent to which a beach could be described as a public good. The command "explain" requires definition and application; "consider the extent to which" requires evaluation. The mark scheme allocates 3 marks for knowledge, 3 for analysis, and 2 for evaluation.
Approach
First, define public good and private good using the two characteristics. Then apply these characteristics to a beach: discuss rivalry (non-rivalrous when uncrowded, rivalrous when crowded) and excludability (can be excludable if access controlled, but often non-excludable). Conclude that a beach is a quasi-public good, not a pure public good.
Step-by-Step Reasoning
- Define public good: non-rivalrous and non-excludable. Example: street lighting.
- Define private good: rivalrous and excludable. Example: a sandwich.
- Apply to beach:
- Rivalry: At low demand, a beach is non-rivalrous; at high demand, it becomes rivalrous (congestion).
- Excludability: Some beaches are private with entry fees (excludable), but many are public and open to all (non-excludable).
- Therefore, a beach does not fully meet both criteria simultaneously. It is a quasi-public good.
- Conclusion: The extent to which a beach is a public good depends on the situation; it is not a pure public good.
Key Takeaways
- Public goods are non-rivalrous and non-excludable.
- Private goods are rivalrous and excludable.
- Many goods are quasi-public, having only one characteristic.
- Evaluation requires considering real-world conditions.
Common Mistakes
- Confusing public good with goods provided by the government.
- Stating that a beach is a pure public good without considering rivalry at high demand.
- Not providing a conclusion.
Things to Be Careful About
- Use precise terminology: non-rivalrous, non-excludable.
- Show application to the specific example.
- Ensure a justified conclusion is given.
Assess the extent to which a subsidy is likely to be the best method to increase the consumption of a merit good.
Introduction
A merit good is a good that is under-consumed in a free market because consumers have imperfect information about its benefits, leading to a positive externality. A subsidy is a payment by the government to producers to reduce their costs, lower price, and increase consumption. This essay assesses whether a subsidy is the best method to increase consumption of a merit good.
How a Subsidy Works
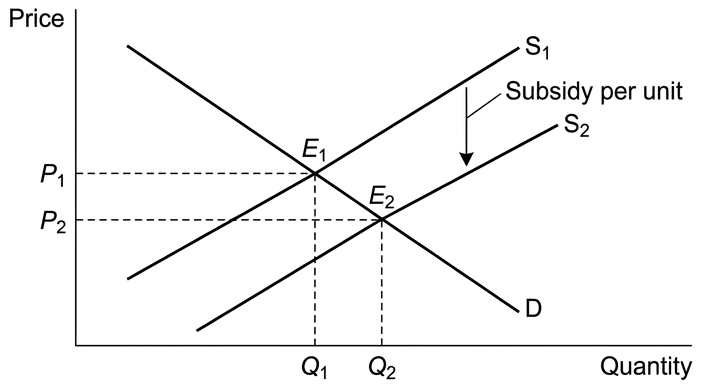
A subsidy shifts the supply curve to the right (from S1 to S2), reducing the market price from P1 to P2 and increasing quantity from Q1 to Q2. This makes the good more affordable and encourages consumption.
Advantages of a Subsidy
- Directly reduces price, making the good more accessible.
- Can be targeted at specific merit goods (e.g., education, healthcare).
- Relatively quick to implement.
Disadvantages of a Subsidy
- Opportunity cost: government spending could be used elsewhere.
- May create dependency; if subsidy is removed, consumption may fall.
- Difficult to set the correct subsidy level; may lead to over-consumption or waste.
- Does not address the root cause of under-consumption: imperfect information.
Alternative Method: Provision of Information
Providing information about the benefits of the merit good can correct the information failure directly. This may increase demand without the cost of a subsidy. However, information campaigns may be less effective if consumers are not receptive or if the benefits are long-term.
Evaluation
The effectiveness of a subsidy depends on the price elasticity of demand (PED). If demand is inelastic, a subsidy will have little effect on quantity. If demand is elastic, the subsidy will be more effective. Information provision may be more cost-effective in the long run as it addresses the market failure at its source. However, information alone may not be sufficient for goods with immediate costs and delayed benefits (e.g., vaccinations). A combination of subsidy and information may be best.
Conclusion
A subsidy can be effective in increasing consumption of a merit good, but it is not necessarily the best method. Its success depends on PED and the nature of the merit good. In many cases, a combination of subsidy and information provision is likely to be most effective.
A subsidy can be effective in increasing consumption of a merit good, but it is not necessarily the best method; its effectiveness depends on price elasticity of demand, and alternative methods such as information provision may be more cost-effective in addressing the information failure directly. On balance, a combination of policies is likely to be most effective.
Background Concept
Merit goods are goods that are under-consumed because individuals do not fully appreciate their benefits, leading to a divergence between private and social benefits. Examples include education, healthcare, and vaccinations. Governments often intervene to increase consumption. A subsidy is a payment to producers that reduces their costs, shifting supply right and lowering price. Alternative methods include direct provision, regulation, and information campaigns.
Understanding the Question
The question asks to assess the extent to which a subsidy is likely to be the best method to increase consumption of a merit good. "Assess" requires evaluation of both sides and a justified conclusion. The mark scheme allocates 8 marks for AO1/AO2 and 4 marks for AO3. Top band requires detailed knowledge, developed analysis, and a justified conclusion.
Approach
First, explain the concept of a merit good and the market failure. Then explain how a subsidy works, using a diagram. Discuss advantages and disadvantages. Then consider an alternative method (information provision). Evaluate using criteria such as PED and cost-effectiveness. Conclude with a justified judgement.
Step-by-Step Reasoning
- Define merit good: under-consumed due to imperfect information, positive externality.
- Explain subsidy: payment to producers, shifts supply right, lowers price, increases quantity.
- Diagram: show supply shift, price fall, quantity rise.
- Advantages: direct, quick, can be targeted.
- Disadvantages: opportunity cost, dependency, difficult to set correct level, does not address information failure.
- Alternative: information provision. Explain how it works: increases demand by correcting information failure. Advantages: addresses root cause, lower cost. Disadvantages: may be less effective if consumers are not receptive.
- Evaluation: Compare effectiveness. Use PED: if demand is inelastic, subsidy has little effect on quantity; if elastic, subsidy is effective. Information may be more effective for long-term behavior change. For goods with immediate costs and delayed benefits, subsidy may be necessary to encourage initial consumption.
- Conclusion: Subsidy is not always best; a combination is often optimal.
Key Takeaways
- Merit goods suffer from under-consumption due to information failure.
- Subsidies can increase consumption but have drawbacks.
- Alternative policies should be considered.
- Evaluation requires considering elasticities and the specific good.
Common Mistakes
- One-sided analysis: only discussing advantages of subsidy.
- Not considering alternative methods.
- No diagram or poorly explained diagram.
- Conclusion that is vague or not justified.
Things to Be Careful About
- Use a diagram and explain it fully.
- Ensure evaluation is developed and not just a list.
- Provide a justified conclusion that answers the question directly.
With the help of a formula, explain two reasons for an improvement in the terms of trade and consider the extent to which an improvement in the terms of trade will benefit an economy.
Answer
The terms of trade measure the relative price of a country's exports compared to its imports. The formula is:
Terms of trade = (Index of export prices / Index of import prices) × 100.
An improvement in the terms of trade occurs when this index rises, meaning export prices have risen relative to import prices.
Two reasons for an improvement:
- An increase in export prices: This could be due to a rise in global demand for a country's exports, e.g., a commodity price boom. Higher export prices mean each unit of export revenue buys more imports.
- A decrease in import prices: This could be due to a fall in the price of key imports, e.g., oil prices falling for an oil-importing country. Lower import prices mean the same export revenue can buy more imports.
An improvement in the terms of trade can benefit an economy. It makes imports cheaper, which can improve living standards as consumers can buy more imported goods with the same income. It may also reduce cost-push inflation if imported raw materials are cheaper. However, there are potential drawbacks. If the improvement is due to rising export prices, the quantity demanded of exports may fall if demand is price elastic (PED > 1), leading to a lower export revenue and a worsening current account deficit. Conversely, if the improvement is due to falling import prices, the domestic import-competing industries may suffer because cheaper imports reduce their sales.
The extent to which an improvement benefits the economy depends on the price elasticity of demand for exports and imports. If demand for exports is inelastic, the increase in export price raises revenue, improving the current account. If demand is elastic, revenue falls. Also, the stage of the economic cycle matters: if the economy is already at full capacity, the cheaper imports might worsen a trade deficit without stimulating growth. Overall, an improvement in the terms of trade can be beneficial, but it is not always positive; the net effect depends on the elasticities and the structure of the economy.
The improvement in the terms of trade can benefit an economy by raising living standards, but it may also worsen the current account if demand is elastic; the net benefit depends on the price elasticities of demand for exports and imports.
Background Concept
The terms of trade (ToT) measure the relative price of a country's exports compared to its imports. The formula is ToT = (Export Price Index / Import Price Index) × 100. An improvement means the index rises, so a unit of exports can buy more imports. This is generally considered favourable because it increases the purchasing power of export earnings. The key determinants are changes in export and import prices, which can be caused by shifts in demand, supply, exchange rates, or commodity prices.
Understanding the Question
The question asks to (1) explain two reasons for an improvement in the terms of trade, using the formula, and (2) consider the extent to which such an improvement benefits an economy. It is a point-based question with marks split: AO1 (3 marks) for definition and formula, AO2 (3 marks) for analysis of reasons and impact, and AO3 (2 marks) for evaluation including a conclusion. The command "consider the extent" requires a balanced judgement, not just a list of benefits.
Approach
Start by defining the terms of trade and giving the formula. Then present two distinct reasons: one focusing on rising export prices, the other on falling import prices. For each, briefly explain the cause and the effect on the ToT. Then analyse the potential benefits (cheaper imports, improved living standards, lower inflation) and the drawbacks (worsening current account, harm to domestic industries). Use the concept of price elasticity of demand (PED) to evaluate the net effect. Conclude that the benefit depends on elasticities and other factors, not a simple yes or no.
Step-by-Step Reasoning
-
Define and formula (AO1): The terms of trade = (Export price index / Import price index) × 100. An improvement means the index rises, so exports buy more imports.
-
Reason 1: Increase in export prices. This can happen if global demand for exports rises (e.g., a commodity boom). Higher export prices raise the ToT. Example: A country exporting oil sees oil prices double; its export price index rises, so ToT improves.
-
Reason 2: Decrease in import prices. This can happen if import prices fall, e.g., due to a fall in global oil prices for an oil-importing country. The import price index falls, so ToT rises.
-
Analysis of benefits (AO2): Cheaper imports directly benefit consumers by increasing their purchasing power. This can raise living standards and reduce cost-push inflation (if imports are raw materials). Firms using imported inputs see lower costs, potentially increasing profitability and investment.
-
Analysis of drawbacks (AO2): If the improvement is due to rising export prices, the quantity of exports demanded may fall if PED > 1. This reduces export revenue, worsening the current account. If the improvement is due to falling import prices, domestic import-competing industries face tougher competition, possibly leading to job losses.
-
Evaluation (AO3): The net benefit depends on PED of exports and imports. If export demand is inelastic, revenue rises; if elastic, revenue falls. The stage of the economic cycle also matters: if the economy is at full capacity, the extra purchasing power may not boost output but instead worsen the trade deficit. Also, the distribution of gains matters: consumers gain, but producers may lose. A conclusion is required: an improvement in the terms of trade can be beneficial, but it is not universally positive; the extent depends on elasticities and the structure of the economy.
Key Takeaways
- The terms of trade formula is essential for defining improvement.
- Two main reasons: rising export prices or falling import prices.
- An improvement can benefit living standards but may harm the current account if demand is elastic.
- Price elasticity of demand is a key evaluative tool.
- A conclusion must be drawn, stating that the net effect depends on circumstances.
Common Mistakes
- Only giving one reason for improvement.
- Discussing only benefits and ignoring drawbacks (this loses AO3 marks).
- Not using the formula or defining the terms of trade.
- Failing to relate the analysis to the specific country context in the question.
- Not providing a clear conclusion, or giving a conclusion that merely restates both sides without a judgement.
Things to Be Careful About
- Ensure the formula is correct: (export price index / import price index) × 100.
- Make the two reasons distinct: one from export price rise, one from import price fall.
- Use PED appropriately: explain that if demand is elastic, a price rise reduces revenue.
- The conclusion must be justified, not just "it depends". State what it depends on (e.g., elasticities, stage of development).
Assess the extent to which the consequences of free trade are always positive for an economy.
Introduction
Free trade refers to the absence of barriers to trade between countries, allowing goods and services to move freely. The classic theory of comparative advantage suggests that free trade benefits all countries by allowing them to specialise in what they produce most efficiently, leading to higher global output and consumption. However, the consequences of free trade are not always positive; there are potential drawbacks that must be assessed.
Benefits of free trade
Free trade allows countries to specialise according to their comparative advantage, increasing total output and enabling higher consumption through trade. It leads to economies of scale, as firms can access larger markets, reducing average costs. Consumers benefit from lower prices and greater choice. Free trade can also promote competition, innovation, and efficiency. Additionally, it can foster economic growth and reduce poverty, as seen in many developing countries that liberalised trade.
Drawbacks of free trade
Free trade can harm domestic industries that are unable to compete with cheaper imports, leading to structural unemployment and deindustrialisation. It may increase income inequality, as workers in import-competing sectors lose jobs while export-oriented sectors gain. Developing countries may become over-reliant on a narrow range of primary exports, exposing them to volatile commodity prices. Free trade can also lead to a current account deficit if imports grow faster than exports. Furthermore, it may enable exploitation of labour and environmental standards, as countries compete to attract investment.
Evaluation
The extent to which free trade's consequences are positive depends on several factors. First, the country's stage of development: developed countries with diversified economies may benefit more, while developing countries may face adjustment costs. Second, the flexibility of the labour market: if workers can retrain and move to expanding sectors, the costs of structural unemployment are lower. Third, the responsiveness of exports and imports to price changes (PED, YED) affects the trade balance. Fourth, the presence of externalities, such as environmental damage, may offset gains. Finally, the distribution of gains matters: if the benefits accrue mainly to the wealthy, the overall welfare effect may be less positive.
Conclusion
While free trade generally increases total output and welfare, its consequences are not always positive for every economy. The net effect depends on the country's specific circumstances, including its comparative advantage, factor endowments, labour market flexibility, and the ability to manage adjustment costs. Therefore, the statement that free trade is always positive is an oversimplification; it can be beneficial but requires complementary policies to address its negative consequences.
Free trade is not always positive; its consequences depend on the country's characteristics, such as stage of development, labour market flexibility, and the distribution of gains.
Background Concept
Free trade is the absence of artificial barriers (tariffs, quotas, etc.) to trade between countries. The principle of comparative advantage, developed by David Ricardo, states that even if one country is absolutely less efficient in producing all goods, it can still benefit from trade by specialising in the good where it has the lowest opportunity cost. This leads to increased total output and consumption possibilities for all trading countries. The trading possibility curve shows that a country can consume beyond its production possibility frontier through trade.
Understanding the Question
The question asks to "assess the extent to which the consequences of free trade are always positive for an economy." This is a 12-mark levels-based essay (AO1+AO2 8 marks, AO3 4 marks). The command "assess" requires a two-sided analysis and a justified conclusion. The word "always" signals that the statement is an absolute, so the response must challenge it by showing that the consequences depend on circumstances. The top band for AO1/AO2 requires detailed knowledge, fully developed explanations, and a balanced analysis. The top band for AO3 requires a justified conclusion with developed evaluative comments.
Approach
Structure the essay with an introduction defining free trade and stating the issue. Develop the benefits side: specialisation, economies of scale, consumer benefits, growth. Then develop the drawbacks side: structural unemployment, inequality, over-reliance, current account deficits, environmental concerns. In the evaluation, weigh these by considering factors such as stage of development, labour market flexibility, elasticity, and distribution. Conclude that free trade is not always positive; its consequences are context-dependent.
Step-by-Step Reasoning
-
Introduction: Define free trade. State that the classic theory suggests gains from trade, but the question challenges whether these gains are always positive. Outline the structure: benefits, drawbacks, evaluation, conclusion.
-
Benefits (AO1/AO2):
- Specialisation according to comparative advantage leads to efficient allocation of resources, increasing global output.
- Economies of scale: larger markets allow firms to produce at lower average cost.
- Consumers: lower prices, greater variety, higher consumer surplus.
- Competition: drives innovation and efficiency.
- Economic growth: trade can be an engine of growth, especially for export-oriented economies.
- Example: China's growth after trade liberalisation.
-
Drawbacks (AO1/AO2):
- Structural unemployment: workers in import-competing industries lose jobs, may lack skills for growing sectors.
- Income inequality: gains concentrated in export sectors, while import-competing workers suffer.
- Over-reliance on primary products: volatility in commodity prices, terms of trade deterioration.
- Current account deficits: if imports grow faster than exports, leading to debt.
- Race to the bottom: countries may lower labour and environmental standards to attract investment.
- Example: Deindustrialisation in developed countries due to competition from low-wage economies.
-
Evaluation (AO3):
- The net effect depends on the country's stage of development: developed countries with diversified economies and flexible labour markets can adjust better; developing countries may need protection for infant industries.
- Labour market flexibility: if workers can retrain, adjustment costs are lower.
- Price and income elasticities of exports and imports: affect the trade balance and terms of trade.
- Externalities: environmental damage may offset gains.
- Distribution of gains: if benefits are not shared widely, welfare may not improve.
- The conclusion: free trade is not always positive; it can be beneficial but requires complementary policies like social safety nets, education, and environmental regulations.
-
Conclusion: Provide a justified judgement. The phrase "always positive" is too strong. The consequences depend on the specific circumstances of the economy. Therefore, free trade should be pursued with caution and accompanied by appropriate policies.
Key Takeaways
- Free trade can bring significant benefits, but it also has costs.
- The net effect depends on a country's characteristics, such as development level, factor endowments, and labour market flexibility.
- A balanced essay must discuss both sides and then evaluate, not just list pros and cons.
- A justified conclusion is essential for high marks.
Common Mistakes
- One-sided response: only discussing benefits or only drawbacks. This loses all evaluation marks.
- No conclusion or a vague conclusion like "it depends" without explaining what it depends on.
- Lack of development: just stating points without explaining the chain of reasoning.
- Not using economic terminology (e.g., comparative advantage, elasticity, structural unemployment).
- Ignoring the word "always" – failing to challenge the absolute statement.
Things to Be Careful About
- Ensure both sides are developed to similar depth; a token paragraph on drawbacks is insufficient.
- Use specific examples to support points (e.g., China, NAFTA, EU).
- The evaluation should be more than just a list of factors; it should weigh them and lead to a conclusion.
- The conclusion must directly answer the question: is free trade always positive? Answer: no, it depends on circumstances.
- Keep the essay focused on the consequences for an economy, not just global welfare.
With the help of an AD/AS diagram, explain what is meant by an expansionary fiscal policy and consider the extent to which an expansionary fiscal policy will always increase the level of aggregate demand.
Answer
Expansionary fiscal policy is a government policy aimed at increasing aggregate demand (AD) through an increase in government spending and/or a reduction in tax rates. Aggregate demand is the total demand for an economy's goods and services at a given price level, comprising consumption (C), investment (I), government spending (G), and net exports (X-M).
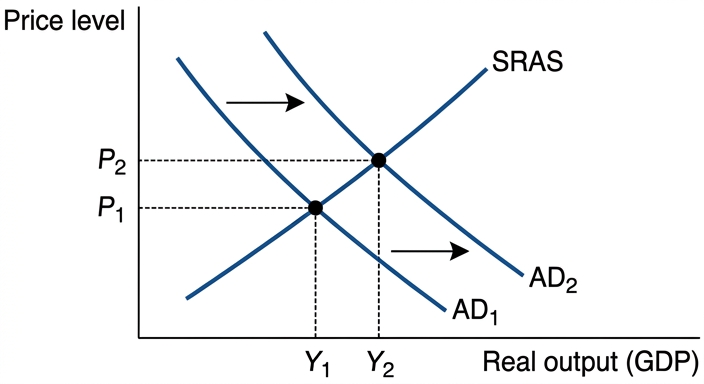
The diagram shows an initial equilibrium at price level P1 and real output Y1, where AD1 and AS intersect. A decrease in income tax, for example, increases households' disposable income, leading to a rise in consumption. Since consumption is a component of AD, the AD curve shifts rightwards from AD1 to AD2. At the new equilibrium, the price level rises to P2 and real output increases to Y2.
However, expansionary fiscal policy will not always increase the level of aggregate demand. Several factors may limit its effectiveness. First, crowding out: increased government borrowing may raise interest rates, reducing private investment and consumption, offsetting the initial increase in AD. Second, time lags: the policy may take time to implement and affect the economy, and by then the economic conditions may have changed. Third, consumer and business confidence: if households expect future tax rises to repay government debt, they may save rather than spend the extra disposable income. Fourth, if the economy is at full capacity, the increase in AD may mainly cause inflation rather than a rise in real output.
In conclusion, while expansionary fiscal policy can increase AD, it does not always do so due to crowding out, time lags, and other factors. The extent to which it increases AD depends on the state of the economy and the specific circumstances.
Expansionary fiscal policy can increase AD, but it does not always do so due to crowding out, time lags, and other factors; the effect depends on economic conditions.
Background Concept
Expansionary fiscal policy involves increasing government spending or cutting taxes to stimulate aggregate demand (AD). AD is the total spending in an economy: C + I + G + (X-M). The AD/AS model shows the relationship between the price level and real output. A rightward shift in AD raises both the price level and real output in the short run, assuming an upward-sloping SRAS curve.
Understanding the Question
The question asks you to 'explain' (AO1/AO2) what expansionary fiscal policy is and how it affects AD, using an AD/AS diagram. Then it asks you to 'consider the extent to which' (AO3) it will always increase AD. This requires evaluation: identify conditions under which the policy may fail to raise AD. The command 'consider' indicates a short evaluative judgement is needed.
Approach
Start by defining expansionary fiscal policy and AD. Draw and explain the diagram showing a rightward shift in AD. Then discuss factors that limit the effectiveness: crowding out, time lags, expectations, and the state of the economy. Conclude with a justified statement on the extent to which it always increases AD.
Step-by-Step Reasoning
- Define expansionary fiscal policy: increase in G or decrease in taxes. (AO1)
- Define AD: total spending. (AO1)
- Draw AD/AS diagram: label axes, initial AD1, SRAS, equilibrium P1, Y1. (AO1)
- Explain the chain: tax cut -> higher disposable income -> higher consumption -> AD shifts right to AD2. (AO2)
- Show new equilibrium: P2, Y2. (AO2)
- Evaluate: crowding out (government borrowing raises interest rates, reduces private spending), time lags (policy takes time), expectations (Ricardian equivalence: consumers save tax cut expecting future taxes), full capacity (AD increase causes inflation only). (AO3)
- Conclusion: not always; depends on circumstances. (AO3)
Key Takeaways
- Expansionary fiscal policy shifts AD right.
- Its effectiveness is limited by crowding out, time lags, and expectations.
- Always consider the state of the economy (recession vs. full capacity).
Common Mistakes
- Forgetting to draw or explain the diagram.
- Not labelling axes or curves.
- Giving a one-sided answer without evaluation.
- Confusing AD shift with movement along AD.
Things to Be Careful About
- Ensure the diagram shows a shift, not a movement.
- Label all curves and equilibria.
- In evaluation, mention specific factors like crowding out and time lags.
- Reach a clear conclusion that answers the 'extent' question.
Assess the extent to which supply-side policy is the best method to reduce the rate of inflation.
Introduction
Supply-side policy refers to measures aimed at increasing the productive capacity of the economy, shifting the long-run aggregate supply (LRAS) curve to the right. Inflation is a sustained increase in the general price level. This essay assesses whether supply-side policy is the best method to reduce the rate of inflation, considering its advantages and disadvantages compared to alternative policies such as monetary and fiscal policy.
The Case for Supply-Side Policy
Supply-side policy can reduce inflation by addressing its root causes. By improving the quality and quantity of factors of production through education, training, infrastructure, and technological innovation, the LRAS curve shifts rightwards. With aggregate demand unchanged, this leads to a lower price level and higher real output. For example, investment in transport infrastructure reduces production costs, shifting SRAS rightwards and lowering prices. Supply-side policy also tackles cost-push inflation by reducing costs of production. Moreover, it can reduce inflationary expectations by demonstrating a commitment to long-term growth without demand-side pressures.
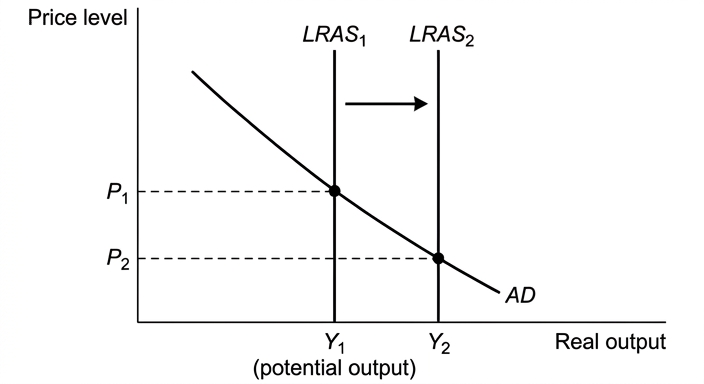
The diagram shows an initial equilibrium at price level P1 and real output Y1 with AD and LRAS1. After supply-side improvements, LRAS shifts to LRAS2, leading to a new equilibrium at a lower price level P2 and higher real output Y2.
The Case Against Supply-Side Policy
Supply-side policy has significant drawbacks. First, time lags: the effects of education and infrastructure projects take years to materialise, so it is ineffective for reducing inflation in the short run. Second, opportunity cost: government spending on supply-side measures may crowd out other spending or require higher taxes, which could dampen aggregate demand. Third, the impact on inflation may be limited if inflation is primarily demand-pull; in that case, reducing aggregate demand through contractionary monetary or fiscal policy may be more direct. Fourth, supply-side policies may increase inequality if benefits accrue mainly to the already skilled.
Comparison with Alternative Policies
Monetary policy, such as raising interest rates, can reduce demand-pull inflation quickly by reducing consumption and investment. However, it may cause unemployment and slow growth. Fiscal policy, such as reducing government spending or increasing taxes, also reduces AD but can be politically unpopular and subject to time lags. Both demand-side policies address symptoms rather than causes and may have adverse side effects. Supply-side policy, by contrast, addresses the underlying productive capacity and can achieve sustainable non-inflationary growth.
Evaluation
The effectiveness of supply-side policy depends on the type of inflation. For cost-push inflation, supply-side policy is particularly effective as it reduces costs. For demand-pull inflation, demand-side policies may be more immediate. Supply-side policy is best in the long run as it improves the economy's potential without sacrificing output, but it is not suitable for short-term inflation control. The 'best' method depends on the economic context: if inflation is high and urgent, monetary policy may be best; if the economy has structural supply constraints, supply-side policy is superior.
Conclusion
Supply-side policy is not always the best method to reduce inflation. While it offers a sustainable solution by increasing productive capacity, its long time lags make it ineffective for immediate inflation control. For short-term demand-pull inflation, contractionary monetary or fiscal policy may be more appropriate. Therefore, the best policy depends on the cause and urgency of inflation. A combination of policies is often most effective.
Supply-side policy is not always the best method; its effectiveness depends on the type and urgency of inflation. For long-term cost-push inflation it is effective, but for short-term demand-pull inflation, monetary or fiscal policy may be more appropriate.
Background Concept
Supply-side policy aims to increase the economy's productive capacity by improving the quantity or quality of factors of production. This shifts the LRAS curve to the right. Inflation can be demand-pull (caused by excess AD) or cost-push (caused by rising costs of production). Supply-side policy is particularly relevant for cost-push inflation as it reduces production costs. The AD/AS model illustrates how a rightward shift in LRAS, with AD constant, lowers the price level.
Understanding the Question
The question asks you to 'assess the extent to which' supply-side policy is the best method to reduce inflation. This is a levels-marked essay requiring balanced analysis and a justified conclusion. You must discuss both the strengths and weaknesses of supply-side policy, compare it with at least one alternative (monetary or fiscal policy), and reach a reasoned judgement on whether it is 'best'.
Approach
Structure the essay with an introduction, two main sides (for and against supply-side policy), a comparison with alternatives, an evaluation weighing the arguments, and a conclusion. Use a diagram to illustrate the effect on LRAS. Ensure the conclusion directly answers the question and is justified.
Step-by-Step Reasoning
- Introduction: Define supply-side policy and inflation, state the essay's aim.
- For supply-side policy: Explain how it shifts LRAS right, reducing price level. Give examples (education, infrastructure). Use diagram to show lower price level.
- Against supply-side policy: Discuss time lags, opportunity cost, limited effectiveness for demand-pull inflation, potential inequality.
- Comparison: Explain how monetary policy (interest rates) and fiscal policy (tax/spending) can reduce demand-pull inflation quickly but may cause unemployment or slow growth. Contrast with supply-side policy's long-term focus.
- Evaluation: Weigh the arguments. Consider the type of inflation (cost-push vs demand-pull), time horizon (short vs long run), and economic context. Conclude that the best method depends on circumstances.
- Conclusion: Supply-side policy is not universally best; it is effective for cost-push inflation in the long run, but demand-side policies are better for short-term demand-pull inflation.
Key Takeaways
- Supply-side policy reduces inflation by increasing productive capacity.
- It is most effective for cost-push inflation and in the long run.
- Demand-side policies are quicker but may have side effects.
- The 'best' policy depends on the cause and urgency of inflation.
Common Mistakes
- One-sided answer: must discuss both advantages and disadvantages.
- No comparison with alternative policies.
- Vague conclusion without justification.
- Omitting diagram when it strengthens analysis.
- Confusing supply-side policy with demand-side policy.
Things to Be Careful About
- Clearly distinguish between short-run and long-run effects.
- Use the AD/AS diagram correctly: show LRAS shift, not AD shift.
- Ensure the conclusion is specific to the question (not a general summary).
- Support arguments with examples where appropriate.