Economics 9708/23 — October/November 2024
Cambridge AS Level · AS Level Data Response and Essays · worked solutions for every part, with the mark scheme
Topics Demand and Supply · Market Equilibrium and the Price Mechanism · Price Elasticity of Supply · Methods of Government Intervention in Markets · Elasticities of Demand · Economic Growth · +8 more
Global coffee bean prices reach a new high
Coffee is big business, especially in the United States (US). The global market was worth nearly US$110bn in 2020, with production around 10m tonnes of coffee beans. 95% of this production came from thousands of small-scale producers in South America, Central America, Asia and Africa. If present trends continue, production is forecast to triple by 2050. The Arabica coffee bean price was at a 10-year high in January 2022, having more than doubled in 2021. Fig. 1.1 shows the world price of coffee in United States dollars (US$) per pound (lb) weight. A pound is 454 grammes.
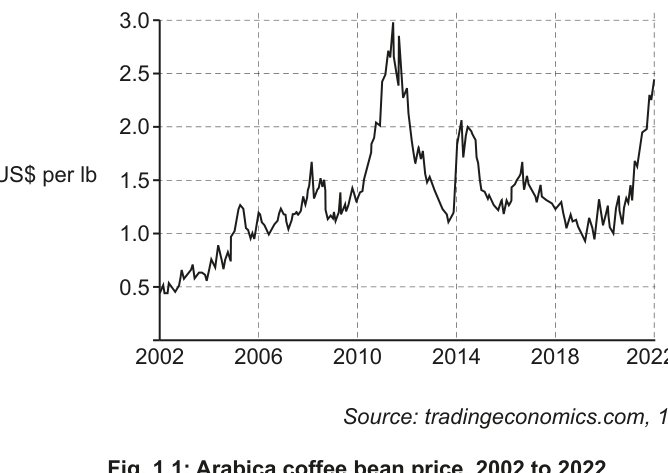
Fig. 1.1: Arabica coffee bean price, 2002 to 2022
Source: tradingeconomics.com, 18 February 2022
So how can this huge price increase be explained? The main cause was a series of weather events affecting Brazil, the world’s largest producer of high quality Arabica coffee beans. Its market share is 35% of total global supply. There was severe drought in early 2021 that reduced the number of ‘cherries’, which contain the beans on coffee bushes. The crop yield was further damaged by frosts that followed the drought. As a result of these weather events, Brazil produced its smallest volume of quality coffee beans for ten years.
In addition, the production of cheaper low-quality Robusta coffee beans in Vietnam was badly affected by storms which stripped the bushes of their ‘cherries’. Overall, there was a very large decrease in the global supply of all coffee beans.
Supply issues affecting major producing countries like Brazil and Vietnam mean that the volume of coffee beans produced regularly fluctuates between ‘high’ years and ‘low’ years. Producers try to reduce their risks through buffer stock schemes in order to maintain a regular income stream. This type of scheme is particularly important for the many small-scale subsistence producers who have no other source of income.
The dramatic weather events of 2021 have been exceptional, although a few large-scale producers in Brazil who survived the immediate impact of drought and frost should gain from the huge rise in the price of coffee beans. But what about the thousands of other producers elsewhere who lack power in the market? The most likely outcome is that they will once again become victims of the unpredictable global market for coffee beans.
Use a demand and supply diagram to show why there was a ‘huge’ increase in the price of Arabica coffee beans in 2021.
Answer
Demand and supply diagram with price on the vertical axis and quantity on the horizontal axis. The supply curve shifts leftward from S1 to S2 due to the decrease in global supply caused by weather events. Demand remains unchanged. The new equilibrium shows a higher price P2 and lower quantity Q2 compared with the original equilibrium P1 and Q1.
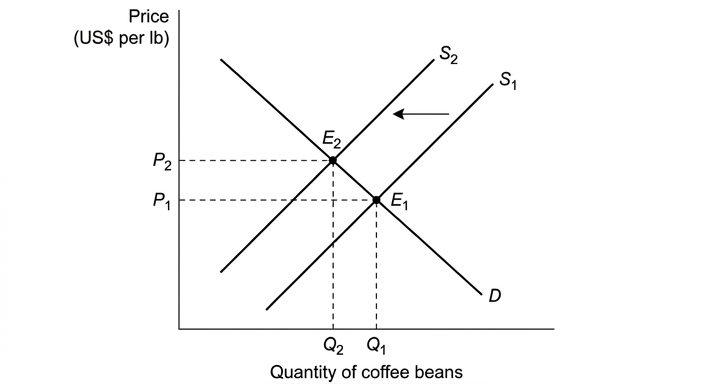
Supply shifts left from S1 to S2, raising equilibrium price from P1 to P2 and lowering equilibrium quantity from Q1 to Q2.
Background Concept
The demand and supply model explains price determination in competitive markets. Market equilibrium occurs where the demand curve (D) intersects the supply curve (S), setting the equilibrium price (P1) and quantity (Q1). A shift in either curve - caused by a change in a determinant other than the good's own price - creates a new equilibrium. A decrease in supply (supply curve shifts left) means that at every price, producers are willing and able to sell less. This could be caused by increased production costs, adverse weather, or a reduction in the number of suppliers.
Understanding the Question
The question asks you to use a demand and supply diagram to explain the huge increase in the price of Arabica coffee beans in 2021. The extract provides the cause: severe drought and frosts in Brazil (the world's largest producer) and storms in Vietnam reduced the global supply of coffee beans significantly. The task is purely diagrammatic - you must draw a correctly labeled diagram showing this supply shock and its effect on equilibrium.
Approach
Draw a standard demand and supply diagram with price on the vertical axis and quantity on the horizontal axis. Label the initial supply curve S1 and the demand curve D. Show the initial equilibrium at E1 (price P1, quantity Q1). Then shift the supply curve leftward to S2 to represent the decrease in global supply caused by the weather events. Mark the new equilibrium E2 at the intersection of D and S2, with a higher price P2 and lower quantity Q2. No written explanation is required for the marks, but you should ensure all labels are clear.
Step-by-Step Reasoning
- Start with the initial market equilibrium where demand equals supply at price P1 and quantity Q1.
- The weather events in Brazil and Vietnam constitute a negative supply shock - they reduce the quantity of coffee beans that producers are willing and able to supply at any given price.
- This is represented by a leftward (or upward) shift of the supply curve from S1 to S2.
- At the original price P1, the quantity supplied is now less than the quantity demanded, creating excess demand (a shortage).
- This shortage puts upward pressure on price. As price rises, the quantity demanded falls (movement up along the demand curve) and the quantity supplied rises (movement up along the new supply curve S2).
- The market settles at a new equilibrium E2 where the new supply curve intersects demand, at a higher price P2 and lower quantity Q2.
- The diagram thus shows that the huge price increase was caused by a large leftward shift in supply.
Key Takeaways
A decrease in supply (leftward shift) always raises equilibrium price and lowers equilibrium quantity, ceteris paribus. The magnitude of the price change depends on the elasticity of demand and supply, but the direction is certain.
Common Mistakes
- Drawing a shift in the demand curve instead of the supply curve.
- Showing a movement along the supply curve rather than a shift.
- Forgetting to label the new equilibrium price and quantity.
- Drawing the supply curve shifting to the right (increase in supply) instead of left.
- Omitting axis labels or curve labels.
Things to Be Careful About
The question specifically asks you to show why there was a huge increase in price. Ensure your diagram clearly shows the supply curve shifting leftward, not rightward. Label the original and new equilibria clearly. Even though no written explanation is required for marks, a clear, well-labeled diagram is essential.
Is the price elasticity of supply of coffee beans likely to be elastic or inelastic in any one year? Justify your answer from the information provided.
Answer
Inelastic (accept perfectly inelastic). Coffee bean supply is likely to be price inelastic in any one year because supply is heavily dependent on weather conditions such as drought, frosts and storms. These climatic factors mean that producers cannot easily or quickly increase output in response to a price rise, making supply unresponsive to price changes.
Inelastic
Background Concept
Price elasticity of supply (PES) measures the responsiveness of the quantity supplied of a good to a change in its price. It is calculated as the percentage change in quantity supplied divided by the percentage change in price. PES can be elastic (>1), inelastic (<1), unit elastic (=1), perfectly inelastic (=0), or perfectly elastic (infinity). Agricultural products typically have inelastic supply in the short run because production is determined by biological factors, weather, and growing seasons that cannot be quickly altered in response to price changes.
Understanding the Question
The question asks whether the price elasticity of supply of coffee beans is likely to be elastic or inelastic in any one year, and requires justification using information from the extract. The extract describes how weather events (drought, frosts, storms) significantly affected coffee production in Brazil and Vietnam.
Approach
State that PES is inelastic (or perfectly inelastic). Then justify this by explaining that coffee production depends on weather conditions that are beyond producers' control. Reference the specific weather events mentioned in the extract (drought and frosts in Brazil, storms in Vietnam) and explain how these limit the ability of producers to respond to price changes within a year.
Step-by-Step Reasoning
- Coffee beans are an agricultural commodity. In any one year (the short run), the quantity supplied is largely determined by the harvest, which depends on weather conditions during the growing season.
- The extract states that severe drought in early 2021 reduced the number of cherries on coffee bushes in Brazil, and subsequent frosts further damaged the crop yield. In Vietnam, storms stripped bushes of their cherries.
- These weather events mean that supply is volatile and unpredictable. Producers cannot simply increase output when the price rises because the production capacity for that year has already been determined by the weather.
- Therefore, the responsiveness of quantity supplied to a change in price is very low. The supply curve is relatively steep, and PES is likely to be less than 1 (inelastic) or even zero (perfectly inelastic) in the very short run.
- Even if prices rise significantly, producers cannot quickly grow more coffee trees or reverse the damage from drought and frost within the same year.
Key Takeaways
Agricultural commodities with long production cycles and high dependence on weather typically have inelastic short-run supply. The inability to store production capacity means supply is unresponsive to price signals within a single year.
Common Mistakes
- Claiming supply is elastic because production can increase over many years (confusing short run with long run).
- Failing to link the justification explicitly to the extract's evidence about weather events.
- Saying supply is elastic because producers want to respond to price rises, without explaining why they cannot.
- Forgetting to explain how the weather events affect the responsiveness of supply.
Things to Be Careful About
The question specifies "in any one year", which is crucial. This restricts the analysis to the short run. Your justification must explicitly connect the weather problems in the extract to the limited responsiveness of supply to price changes.
Consider whether a buffer stock scheme is likely to be successful in reducing the price fluctuations shown in Fig. 1.1.
Answer
A buffer stock scheme involves the government buying and selling stocks of coffee beans to stabilise prices. When coffee yields are low and prices rise, the government would release beans from buffer reserves to increase supply and reduce the price. When yields are high and prices fall, the government would buy excess supply to store, preventing prices from falling too far.
However, the scheme may not be successful. Coffee beans may deteriorate in storage, losing quality so they cannot be sold at the intended price. Additionally, the government may lack the financial resources to finance the purchase and storage of large stocks, especially given the scale of global coffee production.
A buffer stock scheme may reduce price fluctuations, but its success is limited by storage difficulties and financing constraints.
Background Concept
A buffer stock scheme (also called a price stabilisation scheme) is a government intervention designed to stabilise the price of a commodity that experiences volatile supply. The government maintains a reserve stock of the commodity. When supply is high and market prices are falling, the government purchases the surplus and adds it to the buffer stock. When supply is low and market prices are rising, the government releases beans from the buffer stock onto the market to increase supply and dampen the price rise. The aim is to keep prices within a target range, protecting both producers from low prices and consumers from high prices.
Understanding the Question
The question asks you to consider whether a buffer stock scheme is likely to be successful in reducing the price fluctuations shown in Fig. 1.1. The figure shows large swings in coffee prices over two decades, from around $0.50 to nearly $3.00 per pound. You must explain how the scheme would work and then evaluate its likely effectiveness.
Approach
First, explain the mechanism of a buffer stock scheme in the context of coffee. Then evaluate its success by identifying potential problems: storage and quality deterioration, financing costs, and the scale of the global coffee market relative to government capacity.
Step-by-Step Reasoning
How the scheme would work:
- The government would establish a buffer stock of coffee beans.
- In years of poor harvest (like 2021), when supply falls and prices rise, the government would release beans from storage to increase market supply, preventing prices from rising as high as they otherwise would.
- In years of good harvest, when supply rises and prices fall, the government would purchase the excess supply to store, preventing prices from collapsing.
- This would reduce the amplitude of price fluctuations shown in Fig. 1.1.
Evaluation of likely success:
- Storage and quality: Coffee beans may lose quality or deteriorate in storage over time. If the beans cannot be stored in a way that maintains their quality, they may not be saleable at the intended market price when released, undermining the scheme.
- Financing: The scheme requires significant government expenditure to purchase and store beans, and to manage the stocks. Many coffee-producing countries are developing economies with limited government budgets. The cost of financing a buffer stock for a global market worth nearly $110bn could be prohibitive.
- Scale: Coffee is a global commodity produced by thousands of small-scale producers across many countries. A buffer stock scheme operated by a single government may be too small relative to global supply to stabilise world prices effectively.
- Time consistency: Coffee beans have a limited shelf life compared to non-perishable commodities like wheat, making long-term storage more difficult and costly.
Key Takeaways
Buffer stock schemes can theoretically stabilise commodity prices, but their practical success depends on storage feasibility, government financial capacity, and the nature of the commodity. Perishable goods and globally traded commodities present particular challenges.
Common Mistakes
- Describing the mechanism without evaluating success.
- Ignoring the specific context of coffee (perishability, small-scale producers, global market).
- Making a one-sided judgement without considering both the potential for success and the limitations.
- Failing to link the evaluation to the specific fluctuations shown in Fig. 1.1.
Things to Be Careful About
The question asks you to "consider whether" the scheme is likely to be successful, which requires a balanced evaluation. You should not simply say "yes" or "no" - you must explain the mechanism and then weigh the practical problems against the theoretical benefits. The mark scheme awards marks for identifying specific problems such as storage quality and government budget constraints.
Assess the extent to which coffee bean producers will gain from the huge increase in coffee bean prices in 2021.
Answer
Coffee bean producers are likely to gain if the demand for coffee is price inelastic. When demand is price inelastic, a large increase in price will increase total revenue for producers. Those producers who survived the weather events in Brazil and Vietnam, or who are located in unaffected countries, will benefit from higher revenue per pound sold and may invest in better storage methods.
However, producers may not gain if demand is price elastic. If consumers switch to substitutes such as tea when prices rise, total revenue could fall. Producers with very low yields may make losses and be forced out of business. Additionally, small-scale subsistence producers with no alternative income may suffer severe hardship.
Overall, whether producers gain depends on the price elasticity of demand for coffee. Since coffee is often viewed as a habit-forming good with few close substitutes for many consumers, demand is likely to be relatively price inelastic, suggesting that producers on average will gain from the price increase, though the gains will be unevenly distributed.
Producers will gain on average if demand is price inelastic, but the gains are uneven; those with low yields or facing elastic demand may lose.
Background Concept
Total revenue for producers equals the market price multiplied by the quantity sold (TR = P x Q). The effect of a price change on total revenue depends on the price elasticity of demand (PED). If demand is price inelastic (PED < 1), a price rise increases total revenue because the percentage fall in quantity demanded is smaller than the percentage rise in price. If demand is price elastic (PED > 1), a price rise decreases total revenue. Cross elasticity of demand (XED) measures how the demand for one good responds to a price change in another; substitutes have positive XED, so a rise in coffee prices may increase demand for tea.
Understanding the Question
The question asks you to assess the extent to which coffee bean producers will gain from the huge price increase in 2021. This requires evaluating both the potential gains and the potential losses to producers, using elasticity concepts, and reaching a justified conclusion about the net effect.
Approach
Analyse gains: if demand is price inelastic, higher prices increase revenue; producers with surviving stocks or in unaffected countries benefit. Analyse losses: if demand is price elastic or if consumers switch to substitutes, revenue falls; producers with crop failures may lose. Evaluate which side is stronger and under what conditions.
Step-by-Step Reasoning
Potential gains:
- The price of Arabica coffee beans more than doubled in 2021, rising from around $1.00 to $2.40 per pound.
- If the demand for coffee is price inelastic, this large price increase will raise total revenue for producers who can sell their output.
- Producers in Brazil who survived the frosts, and producers in countries not affected by the weather events, can sell at the higher price, increasing their revenue per pound and total revenue.
- Higher revenue provides funds for investment in better storage methods or diversification, potentially increasing future resilience.
- Producers with existing stocks of coffee beans can sell these at the higher price, making windfall profits.
Potential losses / limited gains:
- If demand for coffee is price elastic, the percentage decrease in quantity demanded would exceed the percentage increase in price, causing total revenue to fall. However, coffee is often a habit-forming good with few close substitutes for regular consumers, suggesting demand is relatively inelastic.
- Producers who suffered crop failures due to drought, frosts or storms may have very little or no output to sell. They face losses and may be forced out of business, particularly small-scale subsistence producers with no other income source.
- The cross elasticity of demand with substitutes such as tea is positive. If the price rise is large enough, some consumers may switch to tea, reducing the quantity of coffee demanded and potentially reducing revenue for some producers.
- The extract notes that thousands of small-scale producers elsewhere "lack power in the market" and are likely to become "victims of the unpredictable global market".
Evaluation and conclusion:
- The extent of gain depends critically on the price elasticity of demand. For a good like coffee, which has relatively few substitutes for many consumers and is habit-forming, demand is likely to be price inelastic in the short run. This suggests that producers on average will gain from the price increase.
- However, the gains are highly unevenly distributed. Large-scale producers with surviving stocks and those in unaffected regions gain significantly. Small-scale producers who lost their crops may lose everything.
- Therefore, while the average producer gains, the statement that "producers will gain" masks significant inequality in outcomes. The huge price increase benefits some producers greatly but harms others severely.
Key Takeaways
The impact of a price increase on producer revenue depends on the price elasticity of demand. When evaluating who gains from a price change, it is essential to consider both the average effect and the distribution across different groups of producers.
Common Mistakes
- Providing only one side (either gains or losses), which forfeits all evaluation marks.
- Failing to use elasticity concepts (PED, XED) to explain why revenue rises or falls.
- Not reaching a justified conclusion; simply summarising both sides without a verdict.
- Confusing producer revenue with producer surplus or profit.
- Ignoring the extract's evidence about small-scale producers and market power.
Things to Be Careful About
The mark scheme explicitly states that no evaluation mark can be awarded if only one perspective is considered. You must develop both the gains and the losses. The conclusion should be justified by the elasticity analysis and the context provided in the extract, not just a vague statement that "it depends".
Assess the likely impact of the fluctuations in coffee bean prices on the economies of major producers such as Brazil and Vietnam.
Answer
Fluctuating coffee prices can benefit major producer economies. Higher prices increase export revenues and thus tax revenues for governments, which can be spent on education, infrastructure and diversification, potentially increasing long-run productive capacity and economic growth. In the short run, higher export revenues boost national income.
However, price fluctuations also create costs. Unpredictable prices reduce business confidence, causing producers to save higher revenues for low-price periods rather than invest. This reduces long-run growth potential. Periods of low prices can cause business closures and structural unemployment in the coffee industry and related sectors.
Overall, the impact depends on the ability of governments to stabilise revenues and diversify the economy. Without effective policy responses, the costs of volatility may outweigh the benefits of temporary high prices.
The impact is mixed; while high prices boost short-run growth and tax revenue, volatility creates uncertainty and unemployment, so the net effect depends on policy responses and economic diversification.
Background Concept
Price fluctuations in commodity exports have significant macroeconomic effects on producing countries. Export revenues affect national income, government tax receipts, employment, and investment. High and stable prices allow governments to plan long-term spending on infrastructure, education and diversification. Volatile prices create uncertainty, which can reduce business confidence and investment, leading to lower long-run economic growth. Periods of low prices can cause business failures and structural unemployment in export industries.
Understanding the Question
The question asks you to assess the likely impact of coffee price fluctuations on the economies of major producers such as Brazil and Vietnam. This requires considering both the benefits and costs of price volatility to the macroeconomy, and reaching a justified judgement about the net impact.
Approach
Analyse benefits: higher prices increase export revenues, tax revenues, government spending, short-run economic growth, and potential for diversification. Analyse costs: volatility creates uncertainty, reduces investment, causes unemployment in low-price periods, and increases vulnerability to external shocks. Evaluate which dominates and under what conditions.
Step-by-Step Reasoning
Potential benefits:
- When coffee prices are high (as in 2021), export revenues rise significantly. This increases national income and improves the current account balance.
- Higher corporate profits and export volumes generate increased tax revenues for the government. These revenues can be used to finance current spending (e.g., public sector wages, health) and capital spending (e.g., infrastructure, education).
- If governments invest windfall revenues in infrastructure, education and technology, this can increase the economy's productive capacity (LRAS shifts right), leading to higher long-run economic growth.
- Investment in diversification reduces the economy's reliance on coffee, making it more resilient to future price shocks.
- In the short run, higher export revenues boost aggregate demand, increasing real output and employment in the economy.
Potential costs:
- Price fluctuations create uncertainty. The extract notes that supply regularly fluctuates between high and low years. This unpredictability makes it difficult for firms and governments to plan investment.
- When prices are high, producers and governments may save revenues to prepare for future low-price periods rather than investing. This reduces the level of investment in the economy, limiting long-run growth.
- Periods of low prices (such as the period after 2011 when prices fell to around $1.00 per lb) can cause business closures in the coffee industry. This leads to structural unemployment as workers in coffee-producing regions lose their jobs.
- Dependence on a single commodity export makes the economy vulnerable to external shocks. If coffee prices fall permanently or if climate change increases volatility, the economy may experience persistent balance of payments problems and low growth.
- Small-scale subsistence producers, who have no other source of income, are particularly vulnerable to price falls, potentially requiring government welfare spending.
Evaluation and conclusion:
- The net impact depends on the ability of governments to manage the volatility. If governments use high-price periods to build stabilisation funds and invest in diversification, the long-run benefits may outweigh the short-run costs.
- However, if governments cannot resist the temptation to increase current spending during booms (leading to inflation or debt when prices fall), or if they lack the capacity to diversify, the costs of volatility may dominate.
- Climate change may increase the frequency of extreme weather events, making supply more volatile and the costs more severe over time.
- Overall, while price fluctuations bring short-run benefits during booms, the long-run costs of uncertainty and sectoral unemployment are likely to outweigh these unless accompanied by effective government policy and economic diversification.
Key Takeaways
Commodity price volatility has both short-run and long-run macroeconomic effects. The key to managing volatility is using windfall revenues from high-price periods to invest in diversification and stabilisation, rather than consuming them.
Common Mistakes
- One-sided analysis focusing only on benefits or only on costs.
- Focusing only on producers rather than the wider macroeconomy (tax revenues, unemployment, growth).
- Ignoring the time dimension - short-run benefits versus long-run costs.
- Failing to reach a justified conclusion.
- Not linking the analysis to the specific context of Brazil and Vietnam as major producers.
Things to Be Careful About
The question asks about "fluctuations" (plural), meaning both upward and downward movements. You must address both high-price and low-price periods. The evaluation should weigh the benefits against the costs on an explicit criterion (e.g., long-run growth vs short-run revenue, or stability vs flexibility). The conclusion must be justified by the analysis, not merely a summary of both sides.
With the aid of examples, explain the characteristics of public goods and free goods and consider whether free-of-charge vaccinations offered by a government should be classified as a free good.
Answer
A free good is a good that is not scarce and therefore has zero opportunity cost. It is freely available in nature, requiring no use of scarce resources to produce it. An example is fresh air or sunlight. A public good is a good that is both non-excludable (impossible to prevent anyone from consuming it) and non-rival (one person's consumption does not reduce the amount available for others). An example is street lighting.
Free-of-charge vaccinations offered by a government should not be classified as a free good. Although the vaccine is provided at zero price to the consumer, the government must use scarce resources to purchase, distribute, and administer it. This involves an opportunity cost: the money spent on the vaccine could have been used for other priorities such as education or infrastructure. The vaccine is therefore an economic good, not a free good. It might be classified as a merit good, since it is under-consumed if left to the market due to imperfect information, and government provision addresses this market failure.
Evaluation: The fact that the vaccine is free to the consumer does not make it a free good. The key criterion is scarcity and opportunity cost, not the price charged. From the consumer's perspective there is no opportunity cost, but from society's perspective there is. Hence, it is not a free good.
Free-of-charge vaccinations are not a free good because they involve an opportunity cost to the government and society.
Background Concept
Goods are classified based on scarcity and rivalry/excludability. A free good is abundant with zero opportunity cost – no resources are used to produce it. Examples include air, sunlight, and seawater. An economic good is scarce, requiring resources and thus has an opportunity cost. A public good is a type of economic good that is non-excludable and non-rival, leading to market failure (free-rider problem) and often provided by government. A merit good is a good that is under-consumed due to imperfect information, and government may provide it free at point of use to correct market failure.
Opportunity cost is the next best alternative forgone. If a government uses resources to provide vaccines, those resources cannot be used for something else.
Understanding the Question
This part (a) has two tasks: (1) explain the characteristics of public goods and free goods with examples, and (2) consider whether free-of-charge vaccinations should be classified as a free good. The command word "explain" requires definition and features; "consider" requires a short evaluation. The mark scheme allocates 3 marks for knowledge (AO1), 3 for analysis (AO2), and 2 for evaluation (AO3). The question is point-based; each distinct point earns credit.
Approach
Start by defining free goods and public goods, giving clear examples. Then analyse the claim about vaccinations. The key is to recognise that "free at point of use" does not mean the good is free in economic terms. The government incurs costs, so there is an opportunity cost. The evaluation should conclude firmly that it is not a free good, but may be a merit good.
Step-by-Step Reasoning
- Free goods: Define – not scarce, zero opportunity cost, no production needed. Example: fresh air. (AO1)
- Public goods: Define – non-excludable and non-rival. Example: street lighting. Explain why markets fail to provide them (free-rider problem). (AO1)
- Vaccination analysis: The vaccine is free to the consumer, but government must buy it from producers, pay for storage, hire nurses, etc. This uses scarce resources. Therefore, there is an opportunity cost – the government could have spent the money on schools or roads. This makes it an economic good, not a free good. (AO2)
- Alternative perspective: From the consumer's viewpoint, no opportunity cost of choosing the vaccine over other goods, but that is a narrow view. The question asks about classification, which is an economic concept. (AO2)
- Evaluation: The vaccine may be a merit good – under-consumed due to information failure, so government provision is justified. But that does not change its classification as an economic good. The conclusion is that free-of-charge vaccinations are not a free good. (AO3)
Key Takeaways
- Free goods have zero opportunity cost; public goods are non-excludable and non-rival.
- "Free at point of use" does not imply free good; it is a policy choice, not a natural feature.
- Opportunity cost is the key test for scarcity.
Common Mistakes
- Confusing "free at point of use" with "free good" – many students think that because the consumer pays nothing, it's a free good.
- Forgetting to give examples for both public goods and free goods.
- Not explaining the two characteristics of public goods clearly.
- Offering a one-sided evaluation without a clear conclusion.
Things to Be Careful About
- Use precise economic terminology: "non-excludable", "non-rival", "opportunity cost".
- The evaluation must answer the specific question: should it be classified as a free good? Yes or no, with reasoning.
- The mark scheme allows up to 2 marks for evaluation, so a short but clear judgement is sufficient.
Assess whether the expected benefits of providing healthcare services free of charge at the point of use exceed the likely costs.
Introduction
Healthcare services are often considered merit goods – they are under-consumed if left to the market because individuals may underestimate the private benefits or be unable to afford them. Providing healthcare free at the point of use aims to correct this market failure. However, this policy also imposes costs. This essay assesses whether the expected benefits exceed the likely costs.
Benefits of free healthcare
Firstly, free healthcare improves access for all, regardless of income, reducing inequality in health outcomes. This can lead to a healthier workforce, increasing productivity and potential output. Preventative care, such as vaccinations, reduces future costs. Secondly, it avoids the problem of adverse selection in private insurance markets, where the sick are priced out. By pooling risk, the government can achieve universal coverage. Thirdly, it addresses imperfect information – individuals may not know the full benefit of treatment, so free provision ensures they consume the socially optimal quantity.
Costs of free healthcare
However, free at the point of use creates a moral hazard problem: consumers may overuse services (e.g., missing appointments, non-urgent visits) because they face no price. This can lead to excess demand, long waiting lists, and higher government expenditure. The funding for healthcare must come from taxation, which distorts incentives (e.g., higher taxes reduce work effort) and has an opportunity cost – money spent on healthcare cannot be spent on education, infrastructure, or debt reduction. Additionally, the government may not allocate resources efficiently; private firms may have stronger incentives to minimise costs and innovate.
Evaluation
The net benefit depends on the institutional design. If the system includes co-payments for non-essential care, strict management of waiting lists, and investment in preventative care, the benefits can be large. The UK's NHS, for example, provides universal coverage at relatively low cost per capita compared to the US, suggesting the benefits of equity and efficiency can outweigh costs. However, the opportunity cost is real: for a developing country, spending on healthcare may mean forgoing investment in growth. The magnitude of moral hazard also varies; some studies show that demand for essential care is relatively inelastic, so overuse is limited.
Conclusion
While the costs of free healthcare – moral hazard, government expenditure, and opportunity cost – are significant, the benefits of improved access, equity, and productivity are likely to outweigh them, particularly when the system is well-managed and focused on cost-effective care. The conclusion is that the expected benefits generally exceed the costs, but this is conditional on good governance and appropriate design.
The expected benefits of free healthcare at the point of use (improved access, equity, productivity) are likely to exceed the costs (moral hazard, opportunity cost, inefficiency) when the system is well-designed, though the balance depends on institutional context.
Background Concept
Merit goods are goods that are under-consumed due to imperfect information, leading to a divergence between private and social benefits. Healthcare is a classic merit good – individuals may not fully appreciate the benefits of treatment or may be unable to afford it. Government intervention, such as provision free at the point of use, aims to increase consumption to the socially optimal level. However, this intervention has costs: the government must raise revenue (taxation) and may face inefficiencies from lack of price signals.
Opportunity cost: resources used for healthcare have alternative uses (education, defence, etc.). Moral hazard: when people face no price, they may consume more than necessary.
Understanding the Question
This is a 12-mark levels-marked essay (AO1+AO2 8 marks, AO3 4 marks). The command word is "Assess whether", requiring a two-sided analysis and a justified conclusion. The question asks whether the expected benefits of providing healthcare free at the point of use exceed the likely costs. You must discuss both benefits and costs, then weigh them and reach a judgement.
Approach
Structure the essay into: introduction (define key terms, state the issue), analysis of benefits, analysis of costs, evaluation (weighing the two sides), and conclusion (justified answer). Ensure each point is developed with explanation and real-world examples. The evaluation should use criteria such as magnitude of effects, time period, and institutional context.
Step-by-Step Reasoning
- Introduction: Define merit goods, market failure, and the policy. State the essay's aim.
- Benefits:
- Equity: Free access reduces inequality in health outcomes. Example: NHS provides care regardless of income.
- Productivity: Healthier workers are more productive, boosting GDP.
- Information failure: Government can ensure consumption of preventative care, reducing future costs.
- Costs:
- Moral hazard: Overuse of services (e.g., missed appointments) leads to waste.
- Government expenditure: High taxes may distort labour supply and create deadweight loss.
- Opportunity cost: Resources used for healthcare could be used elsewhere.
- Inefficiency: Public sector may lack profit motive to reduce costs.
- Evaluation:
- Compare magnitude: The benefits of improved health and equity are large and long-term, while costs such as moral hazard can be mitigated (e.g., copayments, appointment systems).
- Consider context: In developed countries with strong institutions, benefits likely outweigh costs. In poorer countries, opportunity cost may be higher.
- Alternative policies: A mixed system (e.g., basic free coverage with private options) may balance costs and benefits.
- Conclusion: State that on balance, the benefits exceed the costs when the system is well-designed, but this is not absolute.
Key Takeaways
- Merit goods justify government intervention but have costs.
- A balanced essay requires developed arguments on both sides.
- The conclusion must be justified, not just a summary.
Common Mistakes
- One-sided answer: only discussing benefits or only costs – this loses all AO3 marks.
- No conclusion or a vague conclusion (e.g., "it depends") without saying what it depends on.
- Assertions without explanation: e.g., "healthcare is a merit good" without explaining why.
- Not using real-world examples or evidence.
Things to Be Careful About
- The question asks "assess whether the expected benefits exceed the likely costs". Your conclusion must directly answer that question.
- Use economic terminology: merit goods, opportunity cost, moral hazard, equity, efficiency.
- The evaluation should be integrated, not just a separate paragraph – but it's okay to have a separate evaluation section as long as it develops the weighing.
- The mark scheme awards up to 4 marks for AO3, so evaluation must be developed and supported.
Explain two economic reasons for inequality in the distribution of income and wealth and consider why inequality in the distribution of wealth cannot easily be measured.
Answer
Inequality in the distribution of income and wealth refers to the uneven spread of income and wealth among individuals or households in an economy.
One economic reason for inequality is differences in education and training. Individuals with poor education acquire fewer marketable skills, which limits their ability to obtain high-paying jobs. This results in lower income, and over time, lower income reduces the ability to save and accumulate wealth, perpetuating inequality.
A second reason is differences in saving rates. Individuals with higher incomes tend to save a larger proportion of their income, enabling them to purchase assets such as property. As property prices rise, existing owners benefit from capital gains, while those with low savings find it increasingly difficult to enter the property market, widening the wealth gap.
Regarding the measurement of wealth inequality, it is difficult because wealth comprises many different assets (housing, savings, pensions, financial instruments) which are valued differently across countries. Additionally, some wealth may be hidden in tax havens or transferred to family members to reduce reported personal wealth, making accurate measurement challenging. While measures such as the Gini coefficient exist, they rely on incomplete data. Therefore, wealth inequality cannot easily be measured with precision, although broad estimates are possible.
Wealth inequality cannot easily be measured due to the diverse nature of wealth, tax avoidance, and intra-family transfers, making precise measurement difficult despite the existence of measures like the Gini coefficient.
Background Concept
Income is a flow of earnings over a period (e.g., wages, salaries, dividends), while wealth is a stock of assets at a point in time (e.g., property, savings, shares). Inequality in income and wealth means these are distributed unevenly across the population. The Gini coefficient is a common measure of inequality, ranging from 0 (perfect equality) to 1 (perfect inequality). However, measuring wealth is particularly challenging because wealth is not always reported accurately and consists of many different types of assets.
Understanding the Question
This question has two parts: (1) explain two economic reasons for inequality in income and wealth, and (2) consider why wealth inequality cannot easily be measured. The command word "explain" requires a developed chain of reasoning for each reason. The word "consider" indicates evaluation: you must weigh the difficulties and reach a justified conclusion about the ease of measurement. The mark scheme allocates up to 3 marks for knowledge (AO1), 3 for analysis (AO2), and 2 for evaluation (AO3).
Approach
First, define inequality. Then present two reasons: differences in education/training and differences in saving rates. For each, explain the causal mechanism clearly. Then discuss the difficulties in measuring wealth: multiple asset types, tax havens, transfers. Finally, evaluate whether these difficulties make measurement impossible or just challenging, and conclude that while precise measurement is difficult, broad estimates are possible.
Step-by-Step Reasoning
- Definition: Start by stating that inequality means an uneven distribution. This earns the first knowledge mark.
- Reason 1 – Education: Poor education -> fewer skills -> lower productivity -> lower wages -> lower income -> less saving -> less wealth accumulation. This chain shows how initial disadvantage persists.
- Reason 2 – Saving rates: Higher income -> higher saving -> ability to buy assets -> asset price appreciation -> capital gains -> wealth inequality widens. Low savers are locked out.
- Measurement difficulties: Wealth is heterogeneous (housing, pensions, etc.) – different valuation methods. Tax havens hide wealth. Transfers to family reduce reported personal wealth. These make data incomplete.
- Evaluation: Acknowledge that measures like the Gini coefficient exist but rely on imperfect data. Conclude that wealth inequality cannot easily be measured with precision, but estimates are possible. This balanced view earns the evaluation marks.
Key Takeaways
- Income and wealth are different concepts; inequality in each has distinct causes.
- Two key reasons for inequality are differences in human capital and differences in saving/asset accumulation.
- Measuring wealth is harder than measuring income due to asset diversity, tax avoidance, and transfers.
- Evaluation requires acknowledging both the difficulties and the existence of imperfect measures.
Common Mistakes
- Confusing income and wealth. Ensure you distinguish them.
- Providing only one reason instead of two.
- Describing reasons without a clear chain of reasoning (e.g., just saying "education causes inequality" without explaining how).
- For the evaluation, simply stating that it is difficult without considering that some measurement is possible.
- Not reaching a conclusion – the evaluation mark requires a justified conclusion.
Things to Be Careful About
- Use precise economic terminology: "marketable skills", "capital gains", "Gini coefficient".
- Ensure each reason is fully developed with cause and effect.
- For the evaluation, explicitly state that measurement is difficult but not impossible, and justify why.
- Keep the answer focused on the question – do not discuss policies or other aspects of inequality.
Introduction
Income inequality refers to the uneven distribution of income among individuals. Governments use various policies to redistribute income, including minimum wage laws and progressive taxation. This essay assesses which of these policies is likely to be most effective.
Minimum wage
A minimum wage sets a floor on wages, raising the income of the lowest-paid workers. This directly reduces the gap between low and high earners. However, it may cause unemployment if employers reduce their workforce in response to higher labour costs, particularly among low-skilled workers. Additionally, in many economies only a small proportion of workers earn the minimum wage, limiting its redistributive impact. It can also contribute to cost-push inflation.
Progressive taxation
A progressive tax system imposes higher marginal tax rates on higher incomes, reducing post-tax income inequality. It can be targeted more broadly than a minimum wage, affecting all high earners. However, it may create disincentives to work and invest, and individuals may engage in tax avoidance or evasion. Administrative costs of implementing and enforcing progressive tax brackets can be high.
Evaluation
The effectiveness of each policy depends on the specific economic context. A minimum wage directly benefits low-income workers but may have adverse employment effects and limited coverage. Progressive taxation can achieve a more comprehensive redistribution but risks reducing economic efficiency. Transfer payments, such as welfare benefits, can complement both policies by directly supporting the poorest without distorting labour markets as much. In many economies, a combination of progressive taxation and targeted transfer payments is likely to be most effective, as it redistributes income without the negative employment effects of a high minimum wage.
Conclusion
While both minimum wage and progressive taxation can reduce income inequality, progressive taxation combined with transfer payments is likely to be more effective in redistributing income because it can be applied broadly and adjusted to minimise disincentives, whereas a minimum wage may cause unemployment and has limited coverage. Therefore, a mix of progressive taxation and transfer payments is the most effective approach.
Progressive taxation combined with transfer payments is likely to be most effective in redistributing income, as it can be broadly applied and adjusted to minimise disincentives, whereas minimum wage may cause unemployment and has limited coverage.
Background Concept
Income redistribution aims to reduce inequality by transferring income from higher-income to lower-income groups. Common policies include minimum wage laws (a price floor on labour), progressive taxation (higher tax rates on higher incomes), and transfer payments (e.g., welfare benefits). Each policy has trade-offs in terms of efficiency, equity, and administrative feasibility.
Understanding the Question
The question asks to "assess which policies are likely to be most effective in redistributing income." This is an evaluative command requiring a comparison of at least two policies, a balanced discussion of their strengths and weaknesses, and a justified conclusion. The mark scheme uses level descriptors: top band requires detailed knowledge, developed analysis, and a justified conclusion. A one-sided response cannot gain evaluation marks.
Approach
First, introduce the concept of income redistribution. Then discuss two main policies: minimum wage and progressive taxation. For each, explain how it works, its advantages, and its disadvantages. Then evaluate them against criteria such as coverage, impact on employment, incentive effects, and administrative costs. Finally, conclude which policy (or combination) is most effective, justifying the choice.
Step-by-Step Reasoning
- Introduction: Define income inequality and state the purpose of the essay.
- Minimum wage: Explain that it raises wages for low-paid workers, reducing inequality. Then discuss drawbacks: potential unemployment (especially if minimum wage is set above equilibrium), limited coverage (only formal sector workers), and inflationary pressure.
- Progressive taxation: Explain that higher earners pay a larger percentage, reducing post-tax inequality. Discuss drawbacks: possible disincentive to work (income effect vs substitution effect), tax avoidance/evasion, and administrative complexity.
- Evaluation: Compare the two. Minimum wage directly helps low-income workers but may harm employment. Progressive taxation is broader but may reduce economic efficiency. Transfer payments can target the poorest without distorting labour markets. Conclude that a combination of progressive taxation and transfer payments is likely most effective because it redistributes income broadly while minimising negative employment effects.
- Conclusion: State the justified judgement clearly.
Key Takeaways
- Redistribution policies have trade-offs; no single policy is perfect.
- Minimum wage can reduce inequality but may cause unemployment.
- Progressive taxation is broad but may create disincentives.
- Transfer payments are targeted and less distortionary.
- A combination of policies is often most effective.
- Evaluation requires comparing policies on multiple criteria and reaching a justified conclusion.
Common Mistakes
- Presenting only one policy – the question requires assessment of which policies (plural) are most effective, so at least two must be discussed.
- One-sided analysis – failing to discuss drawbacks of a policy loses evaluation marks.
- No conclusion or a vague conclusion – the top band requires a justified conclusion.
- Descriptive rather than analytical – simply listing policies without explaining how they work and their effects.
- Ignoring the specific context – the answer should consider real-world applicability.
Things to Be Careful About
- Use economic terminology: "marginal tax rate", "cost-push inflation", "disincentive to work", "transfer payments".
- Ensure the conclusion directly answers the question: which policy is most effective?
- Balance the discussion: give equal weight to strengths and weaknesses.
- Avoid overgeneralisation – acknowledge that effectiveness depends on the economy's structure.
- Keep the essay well-organised with clear paragraphs and a logical flow.
In 2021, year-on-year inflation in many economies increased to a level not experienced for fifty years.
With the help of a diagram, explain what is meant by cost-push inflation and consider whether this type of inflation has affected your own economy since 2021.
Answer
AO1 – Knowledge and understanding
Cost-push inflation is a rise in the general price level caused by an increase in the costs of production, such as wages, raw materials, or energy. This reduces short-run aggregate supply (SRAS).
AO2 – Analysis
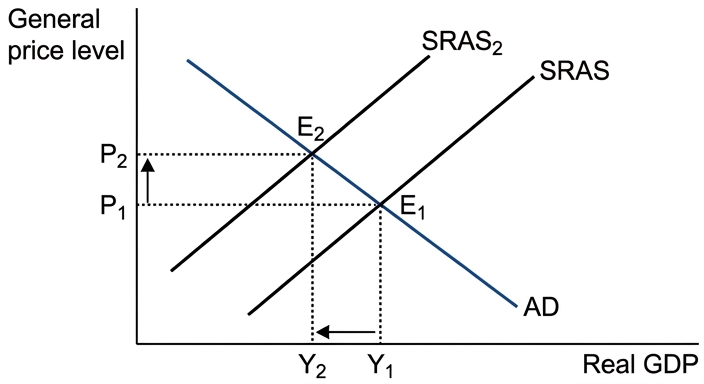
When firms face higher costs, they pass these on to consumers by raising prices. For example, in the UK since 2021, energy prices rose sharply, increasing production costs across many industries. Higher import prices, partly due to a depreciation of sterling, further raised costs. These cost increases shift the SRAS curve leftwards, leading to a higher price level and lower real output, as shown by the movement from equilibrium E1 to E2.
AO3 – Evaluation
In the UK, inflation since 2021 has been partly cost-push due to energy and import price shocks, but also demand-pull from post-pandemic recovery and fiscal stimulus. The extent of cost-push inflation depends on the persistence of energy prices and global supply chains. Overall, cost-push factors have been a significant contributor, but demand-pull elements have also played a role, so inflation has been a mix of both types.
Cost-push inflation has significantly affected the UK since 2021, but it has been combined with demand-pull factors, making it difficult to attribute solely to cost-push causes.
Background Concept
Inflation is a sustained increase in the general price level. Cost-push inflation occurs when aggregate supply decreases due to rising production costs (e.g., wages, raw materials, energy). This is shown by a leftward shift of the short-run aggregate supply (SRAS) curve, leading to a higher price level and lower real GDP. Demand-pull inflation, by contrast, occurs when aggregate demand increases.
Understanding the Question
The question asks you to explain cost-push inflation with a diagram, and then consider whether this type of inflation has affected your own economy since 2021. You must name a specific economy (e.g., the UK, USA, India). The command word "explain" requires a clear definition and a chain of reasoning. The "consider" clause requires evaluation: you must judge the extent to which inflation in your chosen economy is cost-push rather than demand-pull. The mark scheme allocates 3 marks for AO1 (knowledge and diagram), 3 for AO2 (analysis), and 2 for AO3 (evaluation).
Approach
Start by defining cost-push inflation and drawing an accurate AD/AS diagram with a leftward shift of SRAS. Then explain the transmission mechanism: higher costs -> firms raise prices -> price level rises. Connect this to your chosen economy using real-world examples (e.g., energy prices, import costs). Finally, evaluate by considering other factors (demand-pull, monetary policy, supply chain issues) and reach a justified conclusion about the relative importance of cost-push inflation.
Step-by-Step Reasoning
-
Define cost-push inflation precisely: it is inflation caused by a decrease in aggregate supply due to higher costs of production. Mention that it contrasts with demand-pull inflation.
-
Draw the diagram: axes: general price level (vertical) and real GDP (horizontal). Draw initial AD and SRAS curves intersecting at equilibrium E1 (price level P1, output Y1). Then shift SRAS leftwards to SRAS2. The new equilibrium is at E2 (higher price level P2, lower output Y2).
-
Explain the diagram: The shift represents a reduction in supply at every price level. The price level rises from P1 to P2, and real output falls from Y1 to Y2, showing stagflation (rising prices with falling output).
-
Build the chain of reasoning: An increase in costs (e.g., energy prices) raises firms' unit costs. To maintain profit margins, firms increase prices. This leads to a general rise in the price level (inflation). If the cost increase is widespread (e.g., higher oil prices affect many industries), the impact is significant.
-
Apply to the UK since 2021: Energy prices surged due to the Russia-Ukraine war, global supply chain disruptions, and post-pandemic demand. The depreciation of sterling (from $1.35 to $1.20) raised import prices. These factors increased production costs, shifting SRAS leftwards. The UK experienced high inflation (peaking at 11.1% in October 2022).
-
Evaluate: The inflation was not purely cost-push; there was also demand-pull from fiscal stimulus (furlough, tax cuts) and monetary easing. Additionally, the Bank of England's quantitative easing may have added to demand. The relative importance depends on the time period: early 2021 saw demand-pull as economies reopened, while later 2021-2022 was more cost-push. A justified conclusion could be that cost-push was a major factor, but not the sole cause; the inflation was a mix of both.
Key Takeaways
- Cost-push inflation is caused by supply-side shocks, shifting SRAS leftwards.
- The AD/AS diagram is essential for illustrating the effect on price level and output.
- Evaluation requires considering alternative causes (demand-pull) and context (specific economy).
- Always name the economy in your answer to earn evaluation marks.
Common Mistakes
- Drawing a rightward shift of SRAS (that would be disinflation/deflation).
- Confusing a movement along the AD curve with a shift of AD.
- Not labelling axes (price level, real GDP) or curves (AD, SRAS, SRAS2).
- Failing to name a specific economy in the evaluation.
- Providing a one-sided evaluation (e.g., only saying it is cost-push without considering demand-pull).
Things to Be Careful About
- Ensure the diagram is accurate: SRAS shifts left, not right.
- Label the initial and new equilibrium points (E1, E2).
- Use real-world data to support your analysis (e.g., inflation rate, energy price changes).
- In the evaluation, reach a clear conclusion: state whether cost-push has been the dominant factor, and justify why.
- Keep the evaluation concise (2 marks) – a short paragraph is sufficient.
Assess whether the potential benefits of an increasing rate of inflation outweigh the potential costs for an economy.
Introduction
Inflation is a sustained rise in the general price level. An increasing rate of inflation can have both benefits and costs for an economy. This essay will assess whether the potential benefits outweigh the potential costs, considering the effects on output, debt, competitiveness, and fiscal drag.
Potential benefits of an increasing rate of inflation
One benefit is that inflation may stimulate output and investment. If inflation is driven by rising demand, firms may expect higher future profits and invest in expanding capacity, leading to economic growth and employment. Additionally, inflation reduces the real value of debt. For households and firms with fixed-rate mortgages or loans, inflation erodes the real burden of debt, freeing up income for consumption and investment. This can boost aggregate demand further.
Potential costs of an increasing rate of inflation
However, there are significant costs. Rising inflation reduces international competitiveness if domestic prices rise faster than those of trading partners. This leads to a fall in net exports, worsening the current account balance and reducing aggregate demand. Furthermore, inflation causes fiscal drag: if tax brackets are not adjusted, individuals are pushed into higher tax bands, reducing their real disposable income. This can dampen consumption and economic activity. Inflation also creates uncertainty, discouraging long-term investment and leading to arbitrary redistribution of income from savers to borrowers.
Evaluation
The net effect depends on the magnitude and cause of inflation. A low and stable rate of inflation (e.g., 2-3%) may provide benefits without significant costs, as seen in many economies. However, rapidly increasing inflation (e.g., above 5%) tends to create severe costs, especially if it is cost-push rather than demand-pull. The time period matters: short-run benefits from debt reduction may be offset by long-run losses from reduced competitiveness. The impact also varies by stakeholder: borrowers benefit, while savers and those on fixed incomes lose. In the context of the UK since 2021, inflation rose sharply due to cost-push factors, leading to a cost of living crisis, falling real wages, and a contraction in output – suggesting the costs have outweighed the benefits.
Conclusion
While an increasing rate of inflation can bring some benefits, such as stimulating output and reducing real debt burdens, these are often outweighed by the costs of reduced competitiveness, fiscal drag, and uncertainty, especially when inflation is high and supply-driven. A careful assessment of the specific circumstances is needed, but in general, the potential costs of an increasing rate of inflation are likely to outweigh the potential benefits for most economies.
The potential costs of an increasing rate of inflation generally outweigh the benefits, especially when inflation is high and driven by supply-side shocks, as seen in many economies since 2021, though the balance depends on the cause and magnitude of inflation.
Background Concept
Inflation affects the economy through multiple channels. The benefits of inflation often relate to the 'inflation tax' on money holdings, the reduction of real debt burdens, and the possibility of stimulating demand if prices are sticky downwards. Costs include shoe-leather costs, menu costs, uncertainty, redistribution of income and wealth, and negative effects on the balance of payments. The question asks you to assess whether the benefits outweigh the costs, which is a classic evaluative exercise.
Understanding the Question
This is a 12-mark levels-based essay (AO1+AO2 out of 8, AO3 out of 4). The command word 'Assess' requires you to consider both sides and reach a justified conclusion. The indicative content lists benefits (stimulating output, reducing debt burden) and costs (reduction in net exports, fiscal drag). You must develop these into a balanced argument. The top band (Level 3 for AO1/AO2) requires detailed knowledge, developed explanations, and a well-organised response. For AO3, you need a justified conclusion with developed evaluative comments. A one-sided response cannot gain any evaluation marks.
Approach
Structure your essay with an introduction, a paragraph on benefits, a paragraph on costs, an evaluation section that weighs the two, and a conclusion. Use economic theory (AD/AS, real vs nominal, competitiveness) and real-world examples (e.g., the UK's experience since 2021). In the evaluation, consider the cause of inflation (demand-pull vs cost-push), the magnitude (low vs high), the time period (short-run vs long-run), and the impact on different stakeholders. This will allow you to reach a nuanced conclusion.
Step-by-Step Reasoning
-
Introduction: Define inflation and state the focus of the essay. Briefly mention that the answer will consider both sides and reach a conclusion.
-
Benefits: First, explain how inflation can stimulate output. If inflation is demand-pull, it signals rising demand, encouraging firms to invest and expand. This can lead to higher employment and growth. Second, explain the debt reduction effect: if inflation rises faster than expected, the real value of nominal debt falls. This helps borrowers (households, firms, government) and may increase spending. The Phillips curve trade-off also suggests that higher inflation may be associated with lower unemployment in the short run.
-
Costs: First, discuss the impact on international competitiveness. If domestic inflation is higher than abroad, exports become more expensive and imports cheaper, reducing net exports and aggregate demand. Second, explain fiscal drag: as nominal incomes rise, people move into higher tax brackets, increasing the tax burden and reducing disposable income. Third, note other costs: uncertainty for businesses, menu costs, and the arbitrary redistribution from savers to borrowers (which can be unfair if savers are pensioners).
-
Evaluation: Weigh the two sides. The key is to recognise that the net effect is not clear-cut. For example, a mild inflation (2-3%) might have small costs and provide some benefits, but high inflation (10%+) is likely to be damaging. The cause matters: demand-pull inflation may be more benign than cost-push inflation, which reduces output. The time period also matters: short-run benefits from debt reduction may be offset by long-run losses if inflation becomes entrenched. Consider stakeholders: borrowers benefit, but savers, workers on fixed incomes, and exporting firms lose. Use a real-world example: the UK's inflation spike in 2022-2023 was mainly cost-push, leading to a cost of living crisis, falling real GDP, and rising unemployment – suggesting costs outweighed benefits. However, in the 2010s, low inflation was seen as too low, and a bit more inflation might have been beneficial.
-
Conclusion: Summarise the balance you have reached. A justified conclusion might be: 'The potential costs of an increasing rate of inflation generally outweigh the benefits, especially when inflation is high and supply-driven, though the balance depends on the specific circumstances.' This is a judgement that addresses the question directly.
Key Takeaways
- You must present both sides of the argument to earn evaluation marks.
- Use economic concepts (AD/AS, competitiveness, real vs nominal, fiscal drag) and real-world examples.
- The conclusion must be justified, not just a summary.
- Consider the cause, magnitude, and time period as evaluative criteria.
Common Mistakes
- Writing a one-sided answer (only benefits or only costs) – this loses all evaluation marks.
- Providing a conclusion that is vague or merely states 'it depends' without explaining why.
- Failing to develop explanations: just listing points without chains of reasoning.
- Not using the extract/stimulus? There is no extract, but you can use general knowledge.
- Confusing the question with a discussion of deflation or disinflation.
Things to Be Careful About
- Organise your essay logically: benefits, costs, evaluation, conclusion.
- Ensure each point is explained, not just stated (e.g., explain how inflation reduces debt and why that might be beneficial).
- In the evaluation, explicitly compare the benefits and costs and state which side you think is stronger and why.
- Use terminology accurately: 'real' vs 'nominal', 'demand-pull' vs 'cost-push', 'competitiveness'.
- The conclusion should be a direct answer to the question: 'yes, the benefits outweigh the costs' or 'no, they do not', with justification.
Explain two methods of protection in international trade and consider which of these is likely to have the bigger impact on employment and output in the economy which imposes them.
Answer
Protectionism refers to government policies that restrict international trade to protect domestic industries from foreign competition.
Method 1: Tariff – A tax on imported goods. It raises the price of imports, making domestic goods relatively cheaper. This encourages consumers to switch expenditure to domestically produced goods, increasing demand for domestic output. To meet this higher demand, firms recruit more workers, raising employment. However, the extent of the switch depends on the price elasticity of demand for imports. If demand is inelastic, the reduction in imports is small, so the boost to domestic output and employment is limited.
Method 2: Import quota – A physical limit on the quantity of a good that can be imported. By directly restricting supply from abroad, it forces consumers to buy from domestic producers. This leads to a more certain increase in domestic output and employment, as the quota ensures a fixed reduction in imports regardless of demand elasticity. However, if domestic supply is unable to expand sufficiently, the quota may simply raise prices without increasing output much.
Evaluation: An import quota is likely to have a bigger impact on employment and output in the short run because it directly restricts import quantity, whereas a tariff's effect depends on the price elasticity of demand for imports. If import demand is elastic, a tariff can be effective, but if inelastic, the quota guarantees a larger reduction in imports. However, quotas can lead to higher prices for consumers and may encourage inefficiency, while tariffs generate government revenue. On balance, for the specific goal of maximising domestic employment and output, a quota is likely to be more effective in the short term, though it may be less efficient overall.
Conclusion: An import quota is likely to have a bigger impact on employment and output than a tariff, because it directly limits imports irrespective of demand elasticity, but this must be weighed against potential long-run inefficiencies.
An import quota is likely to have a bigger impact on employment and output than a tariff, because it directly restricts imports regardless of price elasticity of demand, though it may be less efficient in the long run.
Background Concept
Protectionism refers to government policies that restrict international trade to shield domestic industries from foreign competition. Two common methods are tariffs (taxes on imports) and import quotas (physical limits on the quantity of imports). Both aim to reduce imports and boost domestic production, but they work through different mechanisms. The effectiveness of each in raising employment and output depends on factors such as the price elasticity of demand for imports and the ability of domestic firms to expand supply.
Understanding the Question
The question asks you to explain two methods of protection and then consider which one is likely to have a bigger impact on employment and output in the imposing economy. The command word 'explain' requires you to describe how each method works, while 'consider' signals that you must evaluate and reach a judgement. The mark scheme allocates up to 3 marks for knowledge (AO1), 3 marks for analysis (AO2), and 2 marks for evaluation (AO3). You must cover both methods, analyse their effects, and conclude which has the greater impact.
Approach
Start by defining protectionism. Then explain two methods – tariff and import quota – in turn. For each, describe the mechanism and trace the chain of reasoning to employment and output. Use the concept of price elasticity of demand to show how the impact may vary. Finally, compare the two methods and justify which is likely to have a bigger impact, considering both short-run and long-run effects.
Step-by-Step Reasoning
-
Definition: Protectionism is government intervention to restrict international trade, often to protect domestic industries.
-
Tariff: A tariff is a tax on imports. It raises the price of imported goods relative to domestic goods. Consumers switch expenditure to domestic substitutes, increasing demand for domestic output. Firms respond by raising production, which requires more labour, so employment rises. However, the size of the switch depends on the price elasticity of demand for imports. If demand is inelastic (e.g., essential goods with few substitutes), the quantity of imports falls only slightly, so the boost to domestic output is small. If demand is elastic, the effect is larger.
-
Import quota: A quota sets a maximum quantity that can be imported. By directly limiting supply from abroad, it forces consumers to buy from domestic producers regardless of price. This creates a more certain increase in domestic output and employment, as the reduction in imports is fixed. However, if domestic supply is inelastic (e.g., capacity constraints), the quota may simply raise prices without increasing output much. Also, quotas do not generate government revenue (unlike tariffs) and can lead to higher prices for consumers.
-
Comparison: The key difference is that a quota directly restricts quantity, while a tariff works through price. Therefore, a quota is likely to have a bigger impact on employment and output when import demand is inelastic, because a tariff would fail to reduce imports significantly. When import demand is elastic, a tariff can be equally effective. In the short run, a quota guarantees a reduction in imports, making it more reliable for boosting domestic production. However, in the long run, quotas may protect inefficient industries and reduce incentives for innovation, whereas tariffs at least generate revenue that can be used for other purposes.
-
Conclusion: On balance, for the specific goal of maximising employment and output in the short term, an import quota is likely to have a bigger impact because it directly restricts imports irrespective of demand elasticity. However, this must be weighed against potential long-run inefficiencies and higher consumer prices.
Key Takeaways
- Tariffs and quotas are two common protectionist tools with different mechanisms.
- The impact on employment and output depends on price elasticity of demand for imports and domestic supply conditions.
- Quotas provide a more certain reduction in imports but may cause inefficiency.
- Evaluation requires comparing the two methods and justifying a conclusion based on the specific objective.
Common Mistakes
- Only describing the methods without analysing their impact on employment and output.
- Ignoring the role of price elasticity of demand.
- Failing to compare the two methods explicitly.
- Not reaching a justified conclusion (AO3 marks are lost).
- Confusing a tariff with a quota (e.g., saying a quota is a tax).
Things to Be Careful About
- Use correct terminology: 'tariff' is a tax, 'quota' is a quantity limit.
- Clearly distinguish between short-run and long-run effects.
- Mention that the impact also depends on the ability of domestic firms to expand supply.
- Consider the possibility of retaliation by trading partners, which could reduce exports and offset gains.
- Ensure the conclusion directly answers the question: which method has the bigger impact?
Assess whether protectionism is always the best way of reducing a deficit on the current account of the balance of payments.
Introduction
Protectionism refers to government policies that restrict international trade, such as tariffs and import quotas. A current account deficit occurs when a country's spending on imports, income outflows, and transfers exceeds its earnings from exports, income inflows, and transfers. This essay assesses whether protectionism is always the best way to reduce such a deficit, considering both its merits and drawbacks, as well as alternative policies.
Arguments for protectionism
Protectionism can reduce a current account deficit by directly lowering imports. For example, a tariff raises the price of imports, encouraging consumers to switch to domestic goods, thereby reducing import expenditure. If the price elasticity of demand for imports is elastic, the quantity of imports falls significantly, improving the current account. Import quotas directly limit the quantity of imports, guaranteeing a reduction. Protectionism can also protect infant industries, allowing them to grow and eventually export, which may improve the current account in the long run. Additionally, protectionism can be implemented quickly and does not require complex coordination with other policies.
Arguments against protectionism
However, protectionism has significant drawbacks. Retaliation by trading partners can reduce exports, worsening the current account. If import demand is inelastic, tariffs may not reduce import value much, and quotas can lead to higher prices and inefficiency. Protectionism may also protect inefficient industries, reducing competitiveness and long-run export potential. Moreover, there are alternative policies that may be more effective. Contractionary monetary policy (higher interest rates) reduces aggregate demand and imports, but can cause an appreciation of the exchange rate (due to hot money inflows), making exports less competitive and potentially worsening the current account. Supply-side policies (e.g., improving productivity, infrastructure, and innovation) can enhance export competitiveness and reduce import dependency in the long run. Fiscal policy (reducing government spending) can also reduce imports, but may conflict with other objectives like employment. Expenditure-switching policies such as devaluation can make exports cheaper and imports dearer, but may cause inflation and require time to work (J-curve effect).
Evaluation
The effectiveness of protectionism depends on several factors. In the short run, if retaliation is avoided and import demand is elastic, protectionism can quickly reduce a deficit. However, in the long run, it may harm competitiveness and invite retaliation, making it unsustainable. Alternative policies like supply-side reforms address the root causes of a deficit (e.g., low productivity) and are more sustainable, but take time to work. Contractionary monetary policy can be effective if the deficit is due to excess demand, but may cause exchange rate appreciation. The best approach depends on the specific cause of the deficit: if it is cyclical, demand-management policies may be appropriate; if structural, supply-side policies are better. Protectionism may be used as a temporary measure but is not always the best long-term solution.
Conclusion
Protectionism is not always the best way to reduce a current account deficit. While it can provide short-term relief, its drawbacks – retaliation, inefficiency, and dependence on elasticity – often make it inferior to alternative policies that address underlying causes. A combination of policies tailored to the specific circumstances is likely to be more effective. Therefore, the statement that protectionism is always the best way is rejected.
Protectionism is not always the best way to reduce a current account deficit; its effectiveness depends on factors such as price elasticity of demand, retaliation, and the underlying cause of the deficit. Alternative policies such as supply-side reforms or expenditure-switching may be more sustainable in the long run.
Background Concept
The current account of the balance of payments records trade in goods and services, primary income, and secondary income. A deficit means the country is spending more abroad than it earns. Protectionism (tariffs, quotas, subsidies) aims to reduce imports. Alternative policies include contractionary monetary policy (higher interest rates reduce spending and imports), fiscal policy (reduced government spending), supply-side policy (improve competitiveness), and expenditure-switching (devaluation). Each has different mechanisms and side effects.
Understanding the Question
The question asks you to 'assess whether protectionism is always the best way' to reduce a current account deficit. The word 'always' is an absolute, so you must challenge it. The command word 'assess' requires evaluation: you must present both sides and reach a justified conclusion. The mark scheme allocates up to 8 marks for AO1+AO2 (knowledge, understanding, analysis) and up to 4 marks for AO3 (evaluation). A one-sided response cannot gain any evaluation marks. You must discuss protectionism and at least one alternative policy.
Approach
Structure your essay as follows:
- Introduction: define key terms and state the issue.
- Arguments for protectionism: explain how tariffs/quotas can reduce a deficit, with examples and consideration of elasticity.
- Arguments against protectionism: discuss retaliation, inelastic demand, inefficiency, and the availability of better alternatives.
- Evaluation: weigh the pros and cons on criteria such as time period, elasticity, retaliation risk, and sustainability. Consider the cause of the deficit.
- Conclusion: provide a justified judgement answering the question directly.
Step-by-Step Reasoning
-
Define protectionism and current account deficit. Protectionism includes tariffs (taxes on imports) and quotas (quantity limits). A current account deficit means imports exceed exports plus net income flows.
-
Case for protectionism:
- A tariff raises import prices, reducing quantity demanded if demand is elastic. This lowers import expenditure, improving the current account.
- A quota directly limits import quantity, guaranteeing a reduction in import value (assuming no price increase fully offsets it).
- Protectionism can protect infant industries, allowing them to achieve economies of scale and become competitive exporters, improving the current account in the long run.
- It can be implemented quickly and does not require complex coordination.
-
Case against protectionism:
- Retaliation: trading partners may impose their own tariffs, reducing exports and worsening the current account.
- If import demand is inelastic, a tariff may not reduce import value much; consumers pay higher prices but still buy similar quantities.
- Protectionism can lead to inefficiency, higher prices for consumers, and reduced incentives for domestic firms to innovate.
- Alternative policies may be more effective:
- Contractionary monetary policy: higher interest rates reduce aggregate demand and imports, but can cause exchange rate appreciation (due to hot money inflows), making exports less competitive and potentially worsening the current account.
- Supply-side policy: improving productivity, infrastructure, and education can make exports more competitive and reduce import dependency in the long run. This addresses the root cause of a deficit.
- Fiscal policy: reducing government spending reduces aggregate demand and imports, but may conflict with employment objectives.
- Devaluation/depreciation: makes exports cheaper and imports dearer, improving the current account over time (J-curve effect), but may cause inflation.
-
Evaluation:
- Time period: protectionism can work in the short run but may be harmful in the long run due to retaliation and inefficiency. Supply-side policies take time but are more sustainable.
- Elasticity: protectionism works best when import demand is elastic; if inelastic, it is less effective.
- Retaliation risk: if trading partners retaliate, protectionism may backfire. This is less likely with alternative policies.
- Cause of deficit: if the deficit is due to excess demand (e.g., booming economy), contractionary policy may be appropriate. If due to structural uncompetitiveness, supply-side policy is better. Protectionism may be a temporary fix but not a long-term solution.
- Conclusion: protectionism is not always the best; the optimal policy depends on the specific circumstances. A combination of policies is often most effective.
Key Takeaways
- Protectionism can reduce a current account deficit in the short run but has significant drawbacks.
- Alternative policies (monetary, fiscal, supply-side, exchange rate) each have their own strengths and weaknesses.
- Evaluation requires considering the specific context, including elasticity, retaliation, and time horizon.
- A justified conclusion must directly answer the question and not be a simple summary.
Common Mistakes
- Writing a one-sided answer that only discusses protectionism's benefits, losing all evaluation marks.
- Failing to discuss alternative policies (the mark scheme explicitly requires consideration of at least one alternative).
- Not reaching a conclusion, or providing a vague conclusion like 'it depends' without specifying on what.
- Ignoring the role of price elasticity of demand.
- Confusing the current account with the overall balance of payments.
Things to Be Careful About
- Use the term 'current account deficit' precisely; do not confuse with 'trade deficit' (though trade in goods and services is a major component).
- Distinguish between short-run and long-run effects.
- Mention that protectionism can lead to retaliation, which is a key evaluative point.
- Ensure the conclusion is justified: state which side is stronger and why, based on the arguments presented.
- Use examples where appropriate (e.g., US tariffs on steel, China's response).