Economics 9708/13 — October/November 2024
Cambridge AS Level · AS Level Multiple Choice · answer key with instant marking and worked solutions
Topics Classification of Goods and Services · Market Equilibrium and the Price Mechanism · Production Possibility Curves · Factors of Production · Elasticities of Demand · Monetary Policy · +17 more
Tap an option under each question to check it — your score builds as you go.
The diagram shows a country’s production possibility curve.
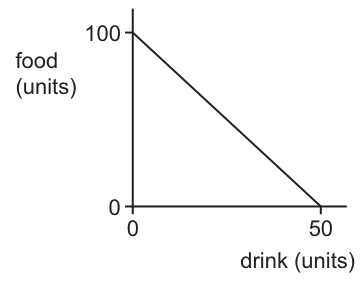
What can be concluded from the diagram?
Options
A Food and drink are normal goods.
B The country is self-sufficient in the production of food and drink.
C The opportunity cost of food falls as more drink is produced.
D There is a constant opportunity cost between food and drink.
Working
The diagram shows a production possibility curve (PPC) that is a straight line. A straight-line PPC has a constant slope, meaning the opportunity cost of producing one good in terms of the other is constant at every point. Here, to increase production of drink by 1 unit, the country must always give up 2 units of food (100/50). Option A is irrelevant because normal goods relate to income elasticity of demand, not production. Option B is incorrect because self-sufficiency refers to consuming what is produced, which cannot be determined from the PPC alone. Option C is incorrect because a straight line implies constant, not falling, opportunity cost.
Answer
D
D
Background Concept
A Production Possibility Curve (PPC) shows the maximum possible output combinations of two goods an economy can produce when all resources are fully and efficiently employed. The shape of the curve reveals the nature of opportunity cost. If the PPC is bowed outward (concave to the origin), the opportunity cost increases as more of one good is produced, because resources are not equally suited to producing both goods. If the PPC is a straight line, the opportunity cost is constant, meaning each additional unit of one good always requires the sacrifice of the same amount of the other good. This implies resources are perfectly adaptable between the two productions.
Understanding the Question
The question provides a diagram with food on the vertical axis (0 to 100 units) and drink on the horizontal axis (0 to 50 units). The curve is a straight line connecting these two intercepts. The task is to select the correct conclusion from four options. Option A introduces the concept of normal goods, which belongs to consumer demand theory (income elasticity) and has no connection to production possibilities. Option B mentions self-sufficiency, which is about whether a country produces exactly what it consumes; a PPC shows production capacity, not consumption patterns, so this cannot be concluded. Option C claims the opportunity cost of food falls as more drink is produced, which would describe a curve that gets flatter (bowed outward), not a straight line. Option D states there is a constant opportunity cost, which matches the straight-line shape.
Approach
Identify the key feature of the diagram: the curve is a straight line. Recall that a straight-line PPC indicates constant opportunity cost. Calculate the opportunity cost from the intercepts to confirm: moving from 0 to 50 drink costs 100 food, so 1 drink costs 2 food throughout. Eliminate options that refer to unrelated concepts (normal goods, self-sufficiency) or the wrong cost pattern (falling opportunity cost). Select the option that matches the constant slope.
Step-by-Step Reasoning
-
Examine the diagram: The vertical axis is food (units), ranging from 0 to 100. The horizontal axis is drink (units), ranging from 0 to 50. The frontier is a single straight line from (0, 100) to (50, 0).
-
Interpret the straight line: Because the line is straight, its slope is constant. The slope equals the opportunity cost of drink in terms of food: 100/50 = 2 units of food per unit of drink. This ratio does not change as you move along the curve.
-
Evaluate Option A: "Food and drink are normal goods." Normal goods are defined by positive income elasticity of demand. The PPC is about production, not consumption or demand. This option is irrelevant.
-
Evaluate Option B: "The country is self-sufficient in the production of food and drink." Self-sufficiency means the country produces exactly what it consumes. The PPC shows maximum production possibilities, not what is actually produced or consumed. A country could be producing at a point on the curve and still trade, or producing inside the curve and not be self-sufficient. This cannot be concluded.
-
Evaluate Option C: "The opportunity cost of food falls as more drink is produced." If opportunity cost fell, the PPC would be bowed inward (convex), getting flatter as you move right. The diagram shows a straight line, so opportunity cost is constant, not falling.
-
Evaluate Option D: "There is a constant opportunity cost between food and drink." This is exactly what a straight-line PPC represents. The trade-off is always 2 food for 1 drink, regardless of the production point.
-
Conclusion: Option D is the only conclusion supported by the diagram.
Key Takeaways
- A straight-line PPC indicates constant opportunity cost.
- A bowed-out PPC indicates increasing opportunity cost.
- The PPC illustrates production trade-offs, not consumption behaviour (normal goods) or self-sufficiency.
- Opportunity cost is measured by the slope of the PPC.
Common Mistakes
- Confusing production with consumption: Selecting options about normal goods or self-sufficiency, which are unrelated to the PPC's purpose.
- Misreading the curve shape: Assuming any curve shows increasing opportunity cost; only a bowed-out curve does. A straight line means constant opportunity cost.
- Reversing the axes: The opportunity cost of drink is 2 food, and the opportunity cost of food is 0.5 drink. Students sometimes state the reciprocal incorrectly.
Things to Be Careful About
- Always check whether the PPC is straight or curved before stating the type of opportunity cost.
- Ensure the conclusion is directly derived from the diagram's shape and intercepts.
- Do not import concepts from other topics (such as consumer theory) unless the question explicitly links them.
Which type of good does not consume scarce resources?
Options
A economic good
B free good
C merit good
D public good
Answer
A free good is defined as a good that is not scarce — it is available in unlimited quantity at a zero price and therefore does not consume scarce resources. Economic goods (including private goods, merit goods, and public goods) are all scarce because their production uses limited resources. Hence, the correct option is B.
Answer
B
B
Background Concept
Scarcity is the fundamental economic problem: resources are limited relative to unlimited wants. Most goods are economic goods — they require scarce resources to produce and therefore have a positive price. A free good is the exception: it is not scarce, meaning it is available in such abundance that it has zero opportunity cost and commands no price (e.g., air, sunlight for a brief moment).
Understanding the Question
The question asks which type of good does not consume scarce resources. The key word is "scarce resources". Only one category of good is defined by its non-scarcity; the others are all produced using limited resources.
Approach
Define each type of good and check whether its production uses scarce resources:
- Economic good – a good that is scarce and has an opportunity cost.
- Free good – a good that is not scarce.
- Merit good – an economic good with positive externalities, still scarce.
- Public good – an economic good that is non-rival and non-excludable, still scarce (e.g., street lighting uses resources).
The correct answer must be the only one that does not use scarce resources.
Step-by-Step Reasoning
-
Option A – Economic good: By definition, economic goods require scarce factors of production (land, labour, capital, enterprise) to be made available. They have a positive opportunity cost. Therefore they do consume scarce resources.
-
Option B – Free good: A free good is defined as a good that is not scarce. It is available in unlimited supply at a zero price (e.g., air, seawater). Producing nothing to obtain it, so no scarce resources are consumed.
-
Option C – Merit good: Merit goods are economic goods that society believes people under-consume due to imperfect information (e.g., education, healthcare). They are still produced with scarce resources; they have a cost and a price (even if subsidised).
-
Option D – Public good: Public goods are non-rival and non-excludable, but they are not free. For example, national defence uses labour and capital, so it consumes scarce resources.
Thus only a free good does not consume scarce resources.
Key Takeaways
- The term "free good" in economics means not scarce; it does not mean "costless to the consumer".
- All economic goods (including merit goods and public goods) are scarce and consume resources.
- This distinction is foundational to understanding the basic economic problem and the reason for choice.
Common Mistakes
- Confusing a free good with a good given away at zero price (like free samples) – those are economic goods that had to be produced.
- Thinking that public goods are free because they are often provided by the government without direct charge — they still use scarce resources financed by taxation.
- Believing that a merit good like healthcare is free in some countries — it still uses doctors, equipment, buildings, all scarce.
Things to Be Careful About
- Read the question carefully: "consume scarce resources" — this is about production, not consumption.
- The definition of a free good: zero opportunity cost, not just zero price.
- In the multiple-choice context, the other three options all belong to the category "economic goods", which are by definition scarce.
The factors of production earn different rewards.
What identifies the correct economic term for these rewards?
Options
A capital – surpluses
B enterprise – dividends
C labour – interest
D land – rents
Reasoning
The four factors of production are land, labour, capital and enterprise. Their rewards are:
- Land earns rent.
- Labour earns wages (or salaries).
- Capital earns interest.
- Enterprise earns profit.
Option D correctly identifies that land earns rent.
Options A, B and C are incorrect: capital does not earn surpluses (A), enterprise does not earn dividends (B; dividends are a distribution of profit to shareholders, but the reward to enterprise is profit itself), and labour does not earn interest (C; interest is the reward to capital).
Answer
D
D
Background Concept
In economics, the four factors of production are land, labour, capital and enterprise. Each factor receives a specific reward for its contribution to production:
- Land: all natural resources (e.g., land itself, minerals, forests). Its reward is rent.
- Labour: human effort (physical and mental). Its reward is wages (or salaries).
- Capital: man-made aids to production (machinery, tools, buildings). Its reward is interest.
- Enterprise: the risk-taking and organising role of the entrepreneur. Its reward is profit (or sometimes called 'entrepreneurial profit').
These rewards are the factor incomes that flow to households in the circular flow of income.
Understanding the Question
The question asks you to match each factor of production with the correct economic term for the reward it earns. The options pair one factor with a reward term. Only one pairing is correct according to standard economic definitions. This is a straightforward recall question testing basic knowledge of factor rewards.
Approach
Recall the reward for each factor:
- Land -> rent
- Labour -> wages
- Capital -> interest
- Enterprise -> profit
Then check each option against these definitions. Eliminate any option where the reward does not match the factor.
Step-by-Step Reasoning
- Option A: capital – surpluses. Capital earns interest, not surpluses. 'Surplus' is not the standard term for any factor reward. Hence incorrect.
- Option B: enterprise – dividends. The reward to enterprise is profit, not dividends. Dividends are payments made to shareholders out of a company's profit; they are a distribution of profit, not the factor reward itself. So incorrect.
- Option C: labour – interest. Labour earns wages, not interest. Interest is the reward to capital. So incorrect.
- Option D: land – rents. Land earns rent (often referred to as 'rent' in factor reward terminology). This is correct.
Therefore the correct answer is D.
Key Takeaways
- Know the four factors of production and their rewards: land–rent, labour–wages, capital–interest, enterprise–profit.
- Be careful not to confuse dividends (a payment to shareholders) with profit (the reward to enterprise).
- This is a fundamental building block for understanding the distribution of income and the circular flow.
Common Mistakes
- Confusing capital and labour rewards: Some students think capital earns profit or dividends, but capital earns interest.
- Thinking enterprise earns dividends: Dividends are paid to shareholders, who are owners of capital; the entrepreneur's reward is profit, which may be retained or distributed.
- Assuming 'surpluses' is a reward: Surplus is not an economic term for a factor reward; it is used in other contexts (e.g., consumer surplus, producer surplus).
Things to Be Careful About
- The term 'rent' in economics means payment to land (including natural resources), not just the rent paid for a flat.
- 'Interest' as a factor reward includes all returns to capital (e.g., interest on loans, returns on machinery).
- 'Profit' is the residual after all other costs have been paid; it is the reward for bearing uncertainty and organising production.
What is most likely to be an advantage of the division of labour?
Options
A an increase in labour force creativity
B an increase in labour productivity
C an increase in workforce flexibility
D an increase in worker satisfaction
Answer
The division of labour involves breaking down the production process into smaller, specialised tasks. This specialisation allows workers to become highly skilled at their specific task, reducing the time taken to produce each unit and increasing output per worker. Therefore, the most likely advantage is an increase in labour productivity.
Answer
B
B
Background Concept
Division of labour is a key concept in the study of production and productivity. It refers to the way a production process is split into a series of distinct, specialised tasks, each performed by a different worker or group of workers. This is closely linked to specialisation, where workers focus on a narrow range of activities. The main economic rationale is to increase efficiency and output. Adam Smith famously illustrated this with the pin factory example, where a group of workers each performing a single step could produce far more pins than the same number of workers each making a whole pin alone.
Understanding the Question
This is a straightforward multiple-choice question asking for the "most likely" advantage of the division of labour. The four options present possible outcomes: creativity, productivity, flexibility, and worker satisfaction. The question tests the candidate's knowledge of the core, established benefit of division of labour as taught in the syllabus. The correct answer is the one that is most directly and consistently associated with the practice.
Approach
Recall the standard advantages and disadvantages of division of labour. The primary advantage is increased productivity due to factors like:
- Increased dexterity and speed from repetition.
- Reduced time lost switching between tasks.
- The possibility of using specialised machinery.
Then evaluate each option against this core advantage. Option B directly matches. The other options are either not typical advantages or are often cited as disadvantages.
Step-by-Step Reasoning
-
Option A: an increase in labour force creativity. Division of labour typically involves repetitive, narrow tasks. This tends to reduce, not increase, creativity and can lead to boredom. This is generally considered a disadvantage.
-
Option B: an increase in labour productivity. This is the classic and most direct advantage. By specialising, workers become faster and more efficient at their specific task. The time saved from not switching tasks and the ability to use specialised tools all contribute to a higher output per worker per hour. This is the core reason firms adopt division of labour.
-
Option C: an increase in workforce flexibility. Division of labour reduces flexibility. A worker trained to do one specific task may not be able to easily perform another task. If a worker is absent or demand shifts, the firm may struggle to reallocate labour. This is a disadvantage.
-
Option D: an increase in worker satisfaction. As mentioned, repetitive work is often monotonous and can lead to low job satisfaction and high staff turnover. This is a well-known drawback.
Therefore, only option B is a clear and direct advantage of the division of labour.
Key Takeaways
- The primary economic advantage of division of labour is a significant increase in labour productivity and output.
- It is important to distinguish between the economic benefits (productivity, efficiency) and the potential social or human costs (boredom, lack of flexibility).
- This question tests a foundational concept that is frequently examined.
Common Mistakes
- Confusing productivity with other concepts: A student might incorrectly choose "creativity" or "satisfaction" if they have a vague or romanticised view of work, rather than the standard economic analysis.
- Misunderstanding flexibility: A student might think that doing one task makes you an expert and therefore more flexible, but in economics, flexibility usually refers to the ability to switch between different tasks or roles, which specialisation reduces.
Things to Be Careful About
- Read the question carefully: it asks for the "most likely" advantage. While there might be niche cases where division of labour increases creativity (e.g., in a highly skilled craft), the standard, textbook answer is productivity.
- Remember the classic examples from the syllabus (Adam Smith's pin factory) to anchor the concept.
- Be precise with terminology: "labour productivity" is the correct term for output per worker.
A government wishes to encourage the consumption of a merit good and reduce the consumption of a demerit good.
Which policy should it adopt towards each good?
Options
| merit good | demerit good | |
|---|---|---|
| A | impose a minimum price | produce only in the public sector |
| B | increase advertising on the benefits of the good | put legal controls on output |
| C | confine access to certain age groups | tax output |
| D | subsidise the good | set a minimum level of output |
Working
Merit goods are under-consumed due to imperfect information; advertising corrects this. Demerit goods are over-consumed; legal controls on output reduce consumption. Option B correctly pairs these policies. Options A, C, and D use inappropriate policies for one or both goods.
Answer
B
B
Background Concept
In economics, goods are classified based on the information available to consumers. Merit goods are goods that are under-consumed in a free market because consumers are not fully aware of their benefits (e.g., education, health care, vaccinations). Demerit goods are over-consumed because consumers are not fully aware of their harms (e.g., cigarettes, alcohol, gambling). This market failure arises from imperfect information. The government can intervene to correct these failures. For merit goods, policies aim to increase consumption, such as providing information (advertising, education) or subsidising the good. For demerit goods, policies aim to reduce consumption, such as taxing the good, imposing legal controls on output, or providing information about the harms.
Understanding the Question
The question asks which policy the government should adopt to encourage consumption of a merit good and reduce consumption of a demerit good. It presents four options, each pairing a policy for the merit good and a policy for the demerit good. The correct answer must achieve both objectives simultaneously. The question tests knowledge of the appropriate intervention tools for each type of good.
Approach
First, recall the nature of merit goods and demerit goods and the market failures associated with each. Then, for each option, evaluate whether the proposed policy for the merit good is likely to increase consumption and whether the proposed policy for the demerit good is likely to reduce consumption. The correct option will pair two policies that are both effective and appropriate for the respective goods.
Step-by-Step Reasoning
-
Merit goods: Under-consumption due to imperfect information. Common policy: provide information (e.g., advertising, public health campaigns) to correct the information failure and increase demand. Other possible policies: subsidies, direct provision, but these are not the only ones. The question requires a specific policy from the options.
-
Demerit goods: Over-consumption due to imperfect information. Common policy: legal controls on output (e.g., ban, quota, age restrictions) to reduce supply or consumption. Other policies: taxation, information campaigns, but legal controls are a direct way to limit consumption.
-
Evaluate each option:
-
Option A: Merit good: impose a minimum price. A minimum price (price floor) above equilibrium would reduce quantity demanded, contradicting the goal of encouraging consumption. Demerit good: produce only in the public sector. Producing in the public sector does not necessarily reduce consumption; it could even increase if the government provides it cheaply. Not effective.
-
Option B: Merit good: increase advertising on the benefits. This addresses the information failure directly, encouraging consumption. Demerit good: put legal controls on output. This directly limits the quantity available, reducing consumption. Both policies are appropriate and effective. This is correct.
-
Option C: Merit good: confine access to certain age groups. This restricts consumption, not encourages it. Demerit good: tax output. Taxation is a valid policy for demerit goods as it raises price and reduces consumption. However, the merit good policy is wrong, so the option is incorrect.
-
Option D: Merit good: subsidise the good. Subsidies lower the price and increase consumption, which is a valid policy for merit goods. Demerit good: set a minimum level of output. This would force producers to supply at least a certain amount, which would increase consumption, not reduce it. So the demerit good policy is counterproductive. Thus, incorrect.
-
-
Therefore, only Option B meets both objectives.
Key Takeaways
- Merit goods are under-consumed due to imperfect information; policies that increase information or lower price can correct this.
- Demerit goods are over-consumed due to imperfect information; policies that reduce supply or raise price can correct this.
- The correct policy mix must target the specific market failure for each good.
- Legal controls on output are a direct way to reduce consumption of demerit goods, while advertising is a direct way to increase consumption of merit goods.
Common Mistakes
- Confusing merit goods with public goods: merit goods are rival and excludable but under-consumed due to information failure, not non-excludability.
- Thinking that any policy that reduces consumption of a demerit good is appropriate, but it must also be effective; for example, taxation is effective but legal controls can be more direct.
- Assuming that subsidies always increase consumption (true for merit goods) but not considering that the pairing must be correct for both goods.
- Overlooking that a minimum price reduces consumption, which is opposite to the goal for merit goods.
Things to Be Careful About
- Read the question carefully: it asks for a policy that encourages consumption of the merit good AND reduces consumption of the demerit good. Both conditions must be satisfied.
- Pay attention to the direction of the policy: a minimum price reduces consumption, a maximum price might increase consumption but not for merit goods in this context.
- Legal controls on output can take various forms (ban, quota, license), but the key is that they limit quantity.
- In multiple-choice questions, eliminate options that have at least one incorrect policy, even if the other policy is correct.
Shoe manufacturers often use leather to make their most expensive shoes. Due to a world shortage of leather, the price of leather has risen.
What will be the effect of this price change?
Options
A The demand curve for leather shoes will shift to the left.
B The demand curve for a substitute for leather shoes will shift to the right.
C The supply curve for leather shoes will shift to the right.
D The supply curve for a substitute for leather to make expensive shoes will shift to the right.
Reasoning
The rise in the price of leather increases the cost of producing leather shoes, shifting the supply curve for leather shoes to the left. This raises the equilibrium price of leather shoes. As leather shoes become more expensive, consumers switch to substitutes, increasing the demand for those substitutes. This shift in demand for substitutes is represented by a rightward shift of the demand curve. Therefore, option B is correct.
Answer
B
B
Background Concept
The question involves the concept of derived demand and the relationship between input prices and supply. Leather is a factor of production in the manufacture of leather shoes. A rise in its price increases the cost of production, which reduces the profitability of supplying leather shoes at any given price, causing a leftward shift in the supply curve. This leads to a higher equilibrium price for leather shoes. Consumers then may switch to substitutes, shifting the demand curve for those substitutes to the right.
Substitutes are goods that can be used in place of each other. When the price of one good rises, the demand for its substitute increases, ceteris paribus.
Understanding the Question
The question presents a scenario: a world shortage of leather has raised the price of leather. Shoe manufacturers use leather for expensive shoes. We are asked to identify the effect of this price change on the markets for leather shoes and their substitutes. The options include shifts in demand and supply curves for leather shoes and for a substitute for leather shoes. We must trace the chain of causation carefully.
Approach
First, identify the initial impact: the price of leather is an input, so a rise in its price affects the supply of leather shoes. This is a supply-side shock. Then, consider the effect on the price of leather shoes. Finally, consider how the change in the price of leather shoes affects demand for substitutes. Evaluate each option against this reasoning.
Step-by-Step Reasoning
- The world shortage of leather reduces the availability of leather, driving up its price.
- Leather is a key input in the production of expensive leather shoes. A higher price of leather increases the cost of producing leather shoes.
- At the current market price for leather shoes, producers now earn lower profit margins. Some producers may reduce output or exit the market, leading to a decrease in supply. This is represented by a leftward shift of the supply curve for leather shoes.
- The leftward shift in supply, with demand unchanged, raises the equilibrium price of leather shoes from P1 to P2 and reduces the equilibrium quantity from Q1 to Q2.
- Consumers now face a higher price for leather shoes. They may seek alternatives that offer similar utility at a lower cost. These alternatives are substitutes for leather shoes, such as shoes made from synthetic materials, canvas, or other materials.
- The increase in the price of leather shoes makes these substitutes relatively cheaper, ceteris paribus. This increases the quantity demanded of substitutes at each price, i.e., the demand curve for substitutes shifts to the right.
- Option B states: "The demand curve for a substitute for leather shoes will shift to the right." This is correct.
- Option A: "The demand curve for leather shoes will shift to the left." This is incorrect because the change in the price of leather does not directly affect consumers' willingness to buy leather shoes at a given price; it affects the supply side. The higher price of leather shoes will cause a movement along the demand curve, not a shift. For a shift in demand, there must be a change in factors other than the good's own price, such as income, tastes, or prices of related goods. The price of leather shoes itself is not a determinant of its own demand; it is the outcome of supply and demand. So the demand curve for leather shoes does not shift.
- Option C: "The supply curve for leather shoes will shift to the right." This is incorrect because higher input costs reduce supply, shifting the supply curve left, not right. A rightward shift would indicate an increase in supply, which would occur if input costs fell or technology improved.
- Option D: "The supply curve for a substitute for leather to make expensive shoes will shift to the right." This is incorrect for two reasons. First, the question asks about a substitute for leather shoes (finished goods), not a substitute for leather as an input. Second, even if we consider the market for a substitute input (e.g., synthetic leather), the change in the price of leather does not directly affect the supply of that substitute input. The supply of synthetic leather depends on its own production costs, not on the price of leather. There might be an indirect effect if the demand for synthetic leather increases (as a substitute input), but that would affect the demand curve for synthetic leather, not its supply. So option D is not correct.
Therefore, the only correct answer is B.
Key Takeaways
- Understand the distinction between a shift in supply and a shift in demand. The initial impact of a change in input price is on the supply curve of the good using that input.
- Recognize that a change in the price of a good affects the demand for its substitutes (and complements).
- Be able to trace the chain of causation: input price change -> supply shift -> price change of final good -> demand shift for related goods.
- In multiple-choice questions, carefully evaluate each option by considering whether the described shift is plausible and correctly directed.
Common Mistakes
- Confusing the effect on the supply of leather shoes: some students might think that because the price of leather has risen, the supply of leather shoes will increase (since the price of an input is higher, producers might produce more to cover costs? That is wrong; higher costs reduce supply).
- Thinking that the demand for leather shoes shifts left because the price of leather shoes will rise: but the price rise is the result of the supply shift, and it causes a movement along the demand curve, not a shift. The demand curve for leather shoes only shifts if there is a change in preferences, income, or prices of related goods (other than its own price).
- Misidentifying the substitute: the substitute is for leather shoes, not for leather. Option D refers to a substitute for leather as an input, which is a different concept.
- Assuming that the price of leather shoes will fall because of the shortage? No, shortage raises price.
Things to Be Careful About
- Read the question carefully: "What will be the effect of this price change?" The price change is the rise in the price of leather. Keep the focus on the consequences of that price rise.
- Distinguish between the market for leather shoes and the market for substitutes. The question asks about the effect on the substitute, but we must reason through the intermediate steps.
- In multiple-choice questions, one correct answer is often the one that correctly identifies the shift in demand for substitutes. The other options are designed to test common misconceptions.
- Remember that a shift in supply is caused by changes in input prices, technology, taxes, subsidies, etc. A shift in demand is caused by changes in income, tastes, prices of related goods, expectations, etc.
The Chinese government relaxed controls on private house ownership. Private house ownership rose sharply, replacing demand for apartments rented from the state.
What would have been most likely to happen to private house prices and the rents of apartments?
Options
| private house prices | apartment rents | |
|---|---|---|
| A | decrease | decrease |
| B | decrease | increase |
| C | increase | decrease |
| D | increase | increase |
The relaxation of controls increased the desire for private house ownership, causing the demand for private houses to increase, shifting the demand curve to the right. With supply assumed constant, the equilibrium price of private houses rises. At the same time, the shift away from renting reduces the demand for apartments, shifting the demand curve for apartments to the left, lowering the equilibrium rent. Therefore, private house prices increase and apartment rents decrease.
Answer
C
C
Background Concept
In a market economy, the price of a good is determined by the interaction of demand and supply. A change in any factor other than the good’s own price shifts the entire demand curve. When demand increases (shifts right), at the original price there is a shortage, putting upward pressure on price until a new equilibrium is reached at a higher price. When demand decreases (shifts left), there is a surplus, and the price falls. Private houses and rental apartments are substitutes in consumption: if one becomes more attractive, people switch away from the other.
Understanding the Question
The Chinese government relaxed controls on private house ownership, making it easier or more desirable to buy a home. As a result, private house ownership rose sharply, and this ‘replaced’ demand for state-rented apartments. The question asks for the most likely effect on private house prices and apartment rents. Since the supply side is not mentioned (we assume no immediate change in the stock of houses or apartments), the price changes will come entirely from shifts in demand.
Approach
Identify the two markets: private houses and rental apartments. Recognise that they are substitutes. The policy change makes private ownership more attractive, so demand for private houses increases. At the same time, demand for rental apartments decreases because people are switching from renting to owning. Apply the standard supply-and-demand model: an increase in demand raises price; a decrease in demand lowers price. No diagram is needed for this simple logical deduction.
Step-by-Step Reasoning
-
Private houses market: Initially at equilibrium with demand D1 and supply S (fixed). After the relaxation of controls, more people want to buy private houses → demand shifts right to D2. At the original price there is excess demand (shortage). Competition among buyers bids the price up until the market clears at a higher equilibrium price. Therefore, private house prices increase.
-
Rental apartments market: Initially at equilibrium with demand D1’ and supply S’. As people switch to owning, the desire to rent apartments falls → demand shifts left to D2’. At the original rent there is excess supply (surplus). Landlords lower rents to attract tenants, so the equilibrium rent decreases. Therefore, apartment rents decrease.
-
The combined outcome: private house prices increase, apartment rents decrease. This matches option C.
Key Takeaways
- Changes in tastes or regulations that affect the attractiveness of a good shift its demand curve.
- Substitutes in consumption: an increase in demand for one good reduces demand for the other.
- When supply is unchanged, a shift in demand leads to a change in equilibrium price in the same direction as the shift.
- It is important to analyse each market separately and then combine the results.
Common Mistakes
- Confusing movement along the curve with a shift: The change in preferences causes a shift of the demand curve, not a movement along it due to a price change.
- Thinking that because more private houses are bought, the price might fall: This would only happen if supply increased, which is not given. An increase in the quantity demanded at every price leads to a higher price.
- Ignoring the substitution relationship: Some students might treat the two markets as independent, failing to see that the rise in private ownership directly reduces demand for rentals.
Things to Be Careful About
- Distinguish between the two markets clearly: price of private houses and rent of apartments are different prices.
- Recognise that “replacing demand for apartments” explicitly indicates a shift away from renting, so the demand for apartments falls.
- The question asks for the “most likely” outcome, so the standard textbook analysis applies; no exceptional factors are given to complicate the prediction.
The supply, S, of a product is determined by the equation S = 10 + 10P, when P is the price of the product.
What is the price elasticity of supply when the price changes from $1 to $2?
Options
A 0
B 0.5
C 1.0
D 2.0
Working
The supply equation is S = 10 + 10P. This is linear, so ΔQ/ΔP = 10.
When P = $1, quantity supplied Q = 10 + 10(1) = 20.
Price elasticity of supply (PES) = (ΔQ/ΔP) × (P/Q) = 10 × (1/20) = 0.5.
Answer
B
B
Background Concept
Price elasticity of supply (PES) measures the responsiveness of the quantity supplied of a good to a change in its price. It is calculated as the percentage change in quantity supplied divided by the percentage change in price. For linear supply functions, a simpler formula is PES = (ΔQ/ΔP) × (P/Q), where (ΔQ/ΔP) is the slope of the supply curve and (P, Q) is a specific price–quantity point. This formula gives a point elasticity at that point, not an average over an interval.
Understanding the Question
The question provides a linear supply function S = 10 + 10P and asks for the price elasticity of supply when the price changes from $1 to $2. Because the supply curve is straight and the change is given, one might think of arc elasticity. However, with only one mark and with 0.5 as a neat option, the intended method is point elasticity at the initial price (P = $1) using the slope of the function. The supply equation implies that for every $1 increase in price, quantity supplied rises by 10 units.
Approach
- Identify the slope of the supply function: ΔQ/ΔP = 10.
- Calculate the quantity supplied at the starting price (P = $1).
- Apply point elasticity formula: PES = (ΔQ/ΔP) × (P/Q).
- Match the result to the given options.
Step-by-Step Reasoning
- The supply equation is S = 10 + 10P. This is in the form Q = a + bP, where b is the slope. Here b = 10. So for each unit increase in price, quantity supplied increases by 10 units. Therefore ΔQ/ΔP = 10.
- At a price of $1, quantity supplied = 10 + 10(1) = 20 units.
- Using point elasticity: PES = (ΔQ/ΔP) × (P/Q) = 10 × (1/20) = 10/20 = 0.5.
- The value 0.5 indicates that supply is inelastic at that point: a 1% rise in price leads to a 0.5% rise in quantity supplied.
- If one incorrectly used the ending price (P = $2) and its quantity (Q = 30), the calculation would give 10 × (2/30) ≈ 0.667, which is not among the options. Using arc elasticity with the midpoint also yields a different value (0.6), so the only clean match is 0.5.
Key Takeaways
- For a linear supply curve, PES varies along the curve: it is less elastic at low prices (where base quantity is small) and more elastic at high prices (where base quantity is large).
- The point elasticity formula PES = (ΔQ/ΔP) × (P/Q) is simple and direct when the supply function is linear.
- Always check which price and quantity are used as the base: the question's context often implies the starting point.
Common Mistakes
- Using the price change from $1 to $2 in an arc elasticity formula, which yields a non-matching value and leads to confusion.
- Forgetting that the slope (ΔQ/ΔP) is the coefficient of P in a linear supply equation (b), and misreading it as 10P without extracting the constant slope.
- Confusing the initial and final quantities, or applying the formula with the average quantity.
Things to Be Careful About
- In a linear supply function Q = a + bP, b is the absolute change in quantity per unit change in price; do not divide by the price coefficient unless it is presented in a different form.
- When a question specifies a price change "from $1 to $2", it is testing whether you recognise to use the initial price for point elasticity, as is standard in such simple MCQ settings.
- Ensure units are consistent; here no units cause trouble.
A good has the following elasticity values.
| cross elasticity of demand | +1.4 |
| income elasticity of demand | -0.8 |
Which statement is correct?
Options
A The good is a complement and inferior.
B The good is a complement and normal.
C The good is a substitute and inferior.
D The good is a substitute and normal.
Answer
Cross elasticity of demand (XED) = +1.4, which is positive. A positive cross elasticity indicates that the two goods are substitutes, as a rise in the price of one leads to an increase in demand for the other.
Income elasticity of demand (YED) = -0.8, which is negative. A negative income elasticity indicates that the good is an inferior good, as demand falls when income rises.
Therefore, the good is a substitute and inferior, which corresponds to option C.
Answer
C
C
Background Concept
Cross elasticity of demand (XED) measures the responsiveness of the quantity demanded of one good to a change in the price of another good. It is calculated as:
XED = (% change in quantity demanded of good A) / (% change in price of good B)
- If XED > 0, the goods are substitutes (an increase in the price of B leads to an increase in demand for A).
- If XED < 0, the goods are complements (an increase in the price of B leads to a decrease in demand for A).
- If XED = 0, the goods are unrelated.
Income elasticity of demand (YED) measures the responsiveness of quantity demanded to a change in consumer income:
YED = (% change in quantity demanded) / (% change in income)
- If YED > 0, the good is normal (demand rises as income rises).
- If YED < 0, the good is inferior (demand falls as income rises).
- If YED is between 0 and 1, the good is a necessity; if YED > 1, it is a luxury.
Understanding the Question
We are given two elasticity values for a single good: XED = +1.4 and YED = -0.8. The question asks which statement correctly describes the good: whether it is a substitute or complement, and whether it is normal or inferior. The options combine these two characteristics. The task is to interpret the signs of the coefficients and match them to the correct combination.
Approach
- Interpret the sign of XED: +1.4 is positive → substitutes.
- Interpret the sign of YED: -0.8 is negative → inferior.
- Combine: the good is a substitute and inferior.
- Compare with options: C matches.
No calculation is needed beyond reading the signs; the magnitude is not required for this classification.
Step-by-Step Reasoning
- Cross elasticity of demand for this good is +1.4. The positive sign indicates that when the price of the related good increases, the demand for this good increases. This is the defining characteristic of substitutes: consumers switch between the two goods. (A complement would have a negative cross elasticity.)
- Income elasticity of demand is -0.8. The negative sign means that as income rises, demand for this good falls. This is the defining characteristic of an inferior good – consumers buy less of it when they become wealthier. (A normal good would have a positive YED.)
- Therefore, the correct description is that the good is a substitute and an inferior good. Option C states exactly that.
Key Takeaways
- The sign of cross elasticity tells you whether goods are substitutes (positive) or complements (negative).
- The sign of income elasticity tells you whether a good is normal (positive) or inferior (negative).
- In multiple-choice questions like this, simply read the signs and match them to the definitions; no calculations are needed.
Common Mistakes
- Confusing the sign interpretation: a common error is to think that a positive XED means complements. This is wrong – the sign is the key: positive = substitutes, negative = complements.
- For income elasticity, some students might think a negative sign indicates a luxury good, but luxury goods have positive YED > 1. Inferior goods have negative YED.
- Overthinking: the magnitude of the coefficients (1.4 and -0.8) is irrelevant for this classification; only the sign matters.
Things to Be Careful About
- Always check the sign first. For XED, a positive value means substitutes; for YED, a negative value means inferior.
- Remember that the question asks for the correct statement – ensure you match both characteristics (substitute/inferior) correctly.
- In this case, the answer is C because it is the only option that combines substitute and inferior.
Different areas on the diagram represent different aspects of a market.
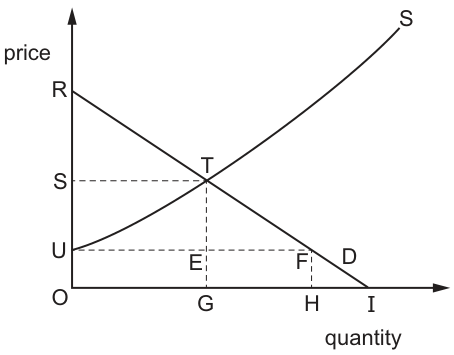
Which row correctly identifies the three variables shown?
Options
| consumer surplus | producer surplus | total consumer expenditure | |
|---|---|---|---|
| A | RST | TUOG | STEU |
| B | RST | UST | STGO |
| C | RTU | UTE | STGO |
| D | RTEU | TEF | RFU |
Working
Consumer surplus is the area between the demand curve and the equilibrium price, up to the equilibrium quantity. On the diagram, equilibrium is at point T, with price S and quantity G, so consumer surplus is the triangle RST.
Producer surplus is the area between the supply curve and the equilibrium price, up to the equilibrium quantity, which is the triangle UST.
Total consumer expenditure is equilibrium price multiplied by equilibrium quantity, equal to the rectangular area STGO.
These match the entries in row B.
Answer
B
B
Background Concept
Consumer surplus is the economic benefit that consumers receive when they are able to purchase a good for a price lower than the maximum they are willing to pay. On a demand and supply diagram, the demand curve represents the maximum price consumers are willing to pay for each unit of the good (their marginal benefit). The market price is the equilibrium price where demand equals supply. Consumer surplus is the area between the demand curve and the equilibrium price, for all units up to the equilibrium quantity traded.
Producer surplus is the economic benefit that producers receive when they are able to sell a good for a price higher than the minimum they are willing to accept. The supply curve represents the minimum price producers will accept for each unit (their marginal cost of production). Producer surplus is the area between the supply curve and the equilibrium price, for all units up to the equilibrium quantity traded.
Total consumer expenditure is the total amount of money spent by all consumers on a good in a given period. It is calculated as the equilibrium market price multiplied by the equilibrium quantity of the good traded in the market.
Understanding the Question
The question presents a standard demand and supply diagram (Fig. 10.1) with a downward-sloping demand curve (D) and upward-sloping supply curve (S), intersecting at equilibrium point T. The equilibrium price is marked as S on the vertical price axis, and the equilibrium quantity is marked as G on the horizontal quantity axis. The question asks to match three economic concepts (consumer surplus, producer surplus, total consumer expenditure) to the three areas listed in the four answer options. This is a 1-mark multiple-choice question, so it only requires recognition of the standard diagrammatic representations of the three concepts, with no complex analysis or calculation required.
Approach
To answer this question, first recall the precise definition and diagrammatic representation of each of the three concepts:
- First, identify the area that corresponds to consumer surplus, using its definition as the benefit to consumers from paying below their maximum willingness to pay.
- Next, identify the area that corresponds to producer surplus, using its definition as the benefit to producers from receiving a price above their minimum acceptable price.
- Then, identify the area that corresponds to total consumer expenditure, using its definition as price multiplied by quantity.
- Finally, match these three areas to the entries in the options to find the correct row.
Step-by-Step Reasoning
- Identifying consumer surplus: Consumer surplus is the difference between what consumers are willing to pay (shown by the demand curve) and what they actually pay (the equilibrium price S), for every unit purchased up to the equilibrium quantity G. On the diagram, this forms a triangle bounded by point R (the intercept of the demand curve on the price axis, the maximum price any consumer is willing to pay for the first unit), point S (the equilibrium price on the price axis, the price all consumers actually pay), and point T (the equilibrium point where demand equals supply, at quantity G). This area is the triangle RST, so consumer surplus is RST.
- Identifying producer surplus: Producer surplus is the difference between the price producers actually receive (the equilibrium price S) and the minimum price they are willing to accept (shown by the supply curve, which represents their marginal cost of production), for every unit sold up to the equilibrium quantity G. On the diagram, this forms a triangle bounded by point U (the intercept of the supply curve on the price axis, the minimum price any producer is willing to accept for the first unit), point S (the equilibrium price on the price axis, the price all producers actually receive), and point T (the equilibrium point). This area is the triangle UST, so producer surplus is UST.
- Identifying total consumer expenditure: Total consumer expenditure is the total amount spent by consumers on the good, equal to the price per unit multiplied by the number of units purchased. At equilibrium, this is the equilibrium price S multiplied by the equilibrium quantity G. On the diagram, this forms a rectangle bounded by the origin O, point G on the quantity axis, point T (the equilibrium), and point S on the price axis. This area is the rectangle STGO, so total consumer expenditure is STGO.
- Matching to the options: The three areas we identified are RST (consumer surplus), UST (producer surplus), and STGO (total consumer expenditure). This exactly matches the entries in row B. All other options have incorrect areas: for example, row A lists producer surplus as TUOG (a quadrilateral that includes part of the expenditure area, not the producer surplus triangle), row C lists consumer surplus as RTU (a quadrilateral that is not the consumer surplus area), and row D lists consumer surplus as RTEU (an incorrect polygon that does not match the definition of consumer surplus).
Key Takeaways
This question tests the ability to link economic definitions to their diagrammatic representations. The key rules to remember are:
- Consumer surplus is always the triangular area between the demand curve and the market price, up to the equilibrium quantity.
- Producer surplus is always the triangular area between the supply curve and the market price, up to the equilibrium quantity.
- Total consumer (or producer) expenditure/revenue is always the rectangular area of market price multiplied by quantity traded.
Common Mistakes
Common errors students make with this type of question include:
- Confusing consumer surplus with the area below the demand curve and above the quantity axis (which would include the total expenditure area, not just the surplus).
- Confusing producer surplus with the area below the supply curve (which is total variable cost, not surplus).
- Miscalculating total expenditure as a triangular area rather than the price-quantity rectangle.
- Mixing up the vertices of the surplus triangles, leading to selecting an option with the wrong area labels.
Things to Be Careful About
When identifying these areas, always start from the definition of each concept rather than trying to guess the area from the shape. Make sure to distinguish between surplus (the extra benefit to consumers or producers) and total expenditure (the total amount of money changing hands in the transaction, which is the same as total producer revenue). Also, confirm that the areas are bounded correctly: both surplus areas are only measured up to the equilibrium quantity, not the entire curve length.
Which combination of the classification of a good and market change will cause the demand curve for the good to shift to the right?
Options
| classification of good | market change | |
|---|---|---|
| A | inferior good | income decrease |
| B | inferior good | price decrease |
| C | normal good | income decrease |
| D | normal good | price decrease |
Reasoning
For a normal good, an increase in income leads to an increase in demand (shift right), and a decrease in income leads to a decrease in demand (shift left). For an inferior good, the opposite is true: a decrease in income leads to an increase in demand (shift right). A price change, whether increase or decrease, causes a movement along the demand curve, not a shift. Therefore, the only combination that causes a rightward shift is an inferior good with a decrease in income.
Answer
A
A
Background Concept
Goods are classified as normal or inferior based on how their demand responds to changes in income. A normal good has a positive income elasticity of demand (YED > 0): as income rises, demand increases; as income falls, demand decreases. An inferior good has a negative income elasticity of demand (YED < 0): as income rises, demand decreases; as income falls, demand increases. This classification is separate from the effect of price changes, which cause movements along the demand curve.
A shift of the demand curve occurs when a non-price determinant of demand changes, such as income, tastes, prices of related goods, or expectations. A price change, whether it is a decrease or increase, leads to a change in quantity demanded along the existing demand curve, NOT a shift of the curve.
Understanding the Question
The question asks which combination of good classification and market change will cause the demand curve to shift to the right. It presents a 2x2 table: classification (inferior or normal) and market change (income decrease or price decrease). The correct answer must satisfy two conditions: (1) the change must be a non-price determinant to cause a shift, and (2) the direction of the shift must be to the right (increase in demand).
Approach
First, eliminate any option involving a price change, because a price change does not shift the demand curve; it only causes a movement along the curve. Thus, options B (price decrease for inferior good) and D (price decrease for normal good) are incorrect. Then, among the remaining options involving income decrease, determine whether the good is normal or inferior. For a normal good, income decrease reduces demand (shift left). For an inferior good, income decrease increases demand (shift right). Therefore, only option A (inferior good, income decrease) yields a rightward shift.
Step-by-Step Reasoning
- Identify the nature of the change: income decrease and price decrease are the two changes. Only income change is a non-price determinant; price change does not shift the demand curve.
- Eliminate options B and D because they involve price decrease, which cannot cause a shift.
- For option A (inferior good, income decrease): recall that inferior goods are those for which demand increases when income falls. So a decrease in income raises demand, shifting the demand curve to the right.
- For option C (normal good, income decrease): normal goods see demand fall when income falls, so demand decreases, shifting the curve to the left.
- Therefore, only A satisfies the condition of a rightward shift.
Key Takeaways
- The distinction between a shift of the demand curve (caused by non-price factors) and a movement along the curve (caused by price change) is fundamental.
- The classification of goods as normal or inferior depends on the sign of income elasticity of demand.
- A decrease in income increases demand for inferior goods and decreases demand for normal goods.
Common Mistakes
- Confusing a movement along the curve with a shift: many students think a price decrease shifts the demand curve to the right, but it actually causes an extension along the curve.
- Misapplying the inferior good concept: some think inferior goods are low quality, but the definition is purely based on income elasticity sign.
- Forgetting that for inferior goods, lower income leads to higher demand.
Things to Be Careful About
- Always check whether the change is a price or non-price determinant of demand.
- Remember that the phrase "increase in demand" means a shift to the right, while "increase in quantity demanded" means a movement along the curve.
- For inferior goods, the relationship between income and demand is inverse.
- The question asks for a shift to the right, not just any change in demand.
Which policy is most likely to solve the free rider problem caused by public goods?
Options
A an advertising campaign
B a direct provision by the government
C a minimum price
D a tax on a substitute good
Answer
Public goods are non-rival and non-excludable, creating the free rider problem: individuals cannot be excluded from consumption, so private firms cannot charge a price and the good would not be provided by the market. Direct provision by the government solves this because the government can finance the good through compulsory taxation, ensuring everyone pays and the good is supplied.
- An advertising campaign (A) does not make the good excludable; it only informs consumers and does not solve the free rider problem.
- A minimum price (C) is a price floor used to support producers, not a solution to the free rider problem.
- A tax on a substitute good (D) is unrelated; it would not ensure provision of the public good.
Therefore, direct provision by the government is the most likely policy to solve the free rider problem.
Answer
B
B
Background Concept
Public goods have two key characteristics: non-rivalry (one person's consumption does not reduce the amount available for others) and non-excludability (it is impossible or very costly to prevent anyone from consuming the good). These characteristics lead to the free rider problem: individuals can benefit from the good without paying for it, because they cannot be excluded. As a result, private firms cannot make a profit by providing the good, and the market would fail to supply it. The government must step in to ensure the good is provided, typically by supplying it directly and funding it through taxation.
Examples of public goods include national defence, street lighting, and lighthouses. The free rider problem is why these goods are typically provided by the state rather than by private firms.
Understanding the Question
The question asks: "Which policy is most likely to solve the free rider problem caused by public goods?" It is a multiple-choice question with four options. The key concept is that the free rider problem is a fundamental market failure associated with public goods. The correct policy must directly address the non-excludability issue, ensuring that the good is provided despite the inability to charge a price.
Approach
Consider each option in turn:
-
A: an advertising campaign – Advertising can inform consumers or change preferences, but it does not alter the non-excludable nature of the good. Even if people are aware of the good, they can still free ride. Advertising does not solve the free rider problem.
-
B: a direct provision by the government – The government can provide the public good using tax revenue. Since taxes are compulsory, everyone contributes, and the good is supplied. This directly overcomes the free rider problem.
-
C: a minimum price – A minimum price is a price floor set above the equilibrium price, used to support producers (e.g., in agriculture). It does not address non-excludability or the free rider problem. It is irrelevant to public goods.
-
D: a tax on a substitute good – A tax on a substitute would raise the price of the substitute, but it does not ensure the provision of the public good. The free rider problem remains because the public good itself is still non-excludable and unprofitable to provide privately.
Only option B directly tackles the market failure.
Step-by-Step Reasoning
-
Identify the problem: Public goods suffer from the free rider problem because of non-excludability. Private firms cannot charge consumers, so they will not produce the good.
-
Evaluate each option:
- Option A: Advertising might increase demand, but it does not change the fact that the good is non-excludable. People can still consume without paying. Advertising alone cannot solve the free rider problem.
- Option B: Direct provision by the government means the state produces or pays for the good and finances it through taxation. Taxation is compulsory, so everyone contributes, and the good is provided. This is the standard solution to the free rider problem.
- Option C: Minimum prices are used to keep prices above the market equilibrium, often to support producers. They do not address the non-excludability of public goods. The free rider problem is not about price levels; it is about the inability to charge a price at all.
- Option D: A tax on a substitute good would make the substitute more expensive, potentially encouraging consumption of the public good. But the public good is still non-excludable; people can still free ride. The tax does not solve the funding problem.
-
Conclusion: Only direct provision by the government ensures the public good is provided and paid for, solving the free rider problem. Therefore, option B is correct.
Key Takeaways
- Public goods are non-rival and non-excludable, leading to the free rider problem.
- The free rider problem means the market will under-provide or not provide the good at all.
- The government can solve this by providing the good directly and funding it through taxation.
- Other policies like advertising, price controls, or taxes on substitutes do not address the fundamental issue of non-excludability.
Common Mistakes
- Confusing public goods with merit goods: Merit goods are under-consumed due to imperfect information, not due to non-excludability. The solution for merit goods is often information provision or subsidies, not direct provision (though direct provision may also be used).
- Thinking advertising can solve the problem: Advertising changes preferences but does not eliminate the free rider problem; the good remains non-excludable.
- Thinking a minimum price might help: Minimum prices apply to goods that are already excludable; they cannot solve the problem of a good that cannot be priced at all.
Things to Be Careful About
- Understand the defining characteristics of public goods: non-rivalry and non-excludability.
- The free rider problem arises specifically because of non-excludability. If a good is excludable, even if it is non-rival (like a pay-per-view movie), it can be provided privately.
- Direct provision is the classic solution, but other methods like government contracts or subsidies to private firms can also work. However, among the given options, direct provision is the most direct and effective.
Very low interest rates in an economy encourage economic growth and cause a large increase in house prices.
Which group of people is most likely to experience a fall in income and an increase in wealth as a result of these changes?
Options
A retired people living in rented houses
B retired people who own their houses
C young people buying their own houses
D young people living with their parents
Reasoning
Low interest rates reduce the income from savings for those with bank deposits, such as retired people. They also stimulate housing demand, raising house prices, which increases the wealth of homeowners. Retired people who own their houses experience both a fall in their interest income and a rise in the value of their house. The other groups do not experience both effects: retired renters have no wealth increase; young buyers may have lower mortgage payments (income rise) and also wealth increase; young people living with parents have no wealth increase.
Answer
B
B
Background Concept
Low interest rates are a tool of expansionary monetary policy. They reduce the cost of borrowing, encouraging consumption and investment, which boosts aggregate demand and economic growth. They also reduce the return on savings, so households with deposit accounts see their interest income fall. At the same time, lower mortgage rates increase demand for housing, pushing up house prices, which increases the wealth of homeowners. Wealth is a stock of assets; income is a flow over time. The question asks for a group that simultaneously experiences a fall in income and a rise in wealth.
Understanding the Question
The question presents a scenario: very low interest rates lead to economic growth and a large increase in house prices. We need to identify which group among four is most likely to face a fall in income and an increase in wealth. The key is to trace the effects on each group: retired people often rely on interest income from savings; homeowners benefit from rising house prices. Young people buying houses may benefit from lower mortgage payments (income rise) and also gain wealth from higher house prices, but they do not experience a fall in income. The correct group is retired homeowners (B).
Approach
Assess each group for both effects: income change and wealth change. For retired people, income from savings falls; wealth from house rises if they own. For young buyers, income may rise (lower mortgage payments) and wealth rises; no fall in income. For renters, no wealth effect. For those living with parents, no wealth effect. The only group with both a fall in income and a rise in wealth is retired homeowners.
Step-by-Step Reasoning
- Low interest rates reduce the cost of borrowing, so mortgage payments fall for those with variable-rate mortgages. This increases disposable income for homeowners with mortgages.
- Low interest rates also reduce the return on savings, so people with bank deposits receive less interest income.
- Lower mortgage rates increase demand for housing as borrowing becomes cheaper. This pushes up house prices, increasing the wealth of existing homeowners.
- Consider each group:
- A: Retired people in rented houses. They have savings, so their interest income falls (income fall). But they do not own a house, so no wealth change. They experience only a fall in income, not a wealth increase.
- B: Retired people who own their houses. They have savings, so interest income falls (income fall). They own a house, which increases in value (wealth increase). This matches both criteria.
- C: Young people buying their own houses. They have mortgages, so lower interest rates reduce their mortgage payments (income rise). They also own a house that increases in value (wealth increase). They experience an income rise, not a fall.
- D: Young people living with their parents. They likely have no mortgage and no house, so no significant income change (maybe slight if they have savings, but not main effect) and no wealth increase. They do not experience both effects.
- Therefore, option B is correct.
Key Takeaways
- Understand that macroeconomic policies have distributional effects: low interest rates hurt savers and benefit borrowers.
- Wealth and income are different concepts; a change in one does not imply a change in the other.
- In multiple-choice questions, systematically evaluate each option against the given criteria.
Common Mistakes
- Confusing income and wealth: thinking that a rise in house prices directly increases income (it does not; it increases wealth unless the house is sold).
- Assuming that all retired people are homeowners: the question specifies different groups.
- Overlooking the effect on mortgage payments: young buyers benefit from lower interest rates, so their income may rise, not fall.
- Not considering that retired people's income from savings is a significant part of their income.
Things to Be Careful About
- The question asks for "a fall in income AND an increase in wealth". Both conditions must be met.
- The phrase "very low interest rates" implies expansionary monetary policy; this is the key cause.
- The economic growth aspect is secondary; the main channels are through interest income and housing demand.
- Be precise about the groups: the question labels them clearly, so read each description carefully.
A large-scale farming enterprise uses inputs of labour and capital equipment that are substitutes.
If the government introduces a policy to subsidise capital equipment, how would this affect the factor inputs?
Options
| quantity of labour | quantity of capital equipment | |
|---|---|---|
| A | decreases | increases |
| B | decreases | decreases |
| C | increases | decreases |
| D | increases | increases |
Reasoning
The subsidy reduces the cost of capital equipment, making it relatively cheaper than labour. Since labour and capital are substitutes, the firm will substitute capital for labour to minimise costs. This leads to an increase in the quantity of capital equipment demanded and a decrease in the quantity of labour demanded. Therefore, the correct option is A.
Answer
A
A
Background Concept
In production, firms use factors of production (inputs) such as labour and capital. The demand for a factor is a derived demand, depending on the demand for the final product and the productivity of the factor. When the price of one factor changes relative to another, firms will adjust their input mix to minimise costs. This is known as the substitution effect. The subsidy on capital equipment effectively reduces its price, making it cheaper relative to labour. Since labour and capital are substitutes, the firm will use more capital and less labour to produce the same output, provided the output level remains constant. The overall effect on factor quantities depends on both the substitution effect and the scale effect (if output expands due to lower costs). However, in this question, the enterprise is a large-scale farming enterprise, and the subsidy is a policy to subsidise capital equipment. The most direct effect is the substitution effect, leading to a decrease in labour and an increase in capital.
Understanding the Question
The question presents a scenario: a large-scale farming enterprise uses labour and capital equipment as substitutes. The government introduces a policy to subsidise capital equipment. The question asks how this would affect the quantity of labour and the quantity of capital equipment. The options are combinations of increases and decreases. The key is to recognise that a subsidy on capital equipment reduces the cost of capital to the firm. Since labour and capital are substitutes, the firm will replace some labour with capital, thus decreasing labour demand and increasing capital demand. Note: The question does not specify whether the output level changes, but the substitution effect is the primary effect. In the long run, if the subsidy reduces costs, the firm might expand output, which could increase demand for both factors, but this scale effect is likely smaller than the substitution effect, and the question is straightforward: the subsidy makes capital cheaper, so firms will use more capital and less labour. Thus, answer A is correct.
Approach
To solve, apply the concept of derived demand and substitution between factors. Identify that the subsidy reduces the price of capital relative to labour. Determine the direction of substitution: since they are substitutes, the firm will use more of the cheaper factor (capital) and less of the more expensive factor (labour). This leads to the predicted changes: quantity of labour decreases, quantity of capital increases. Match to the options.
Step-by-Step Reasoning
- The government policy subsidises capital equipment, which means the firm pays a lower effective price for each unit of capital it uses.
- Labour and capital are substitutes in production; they can be used in varying proportions to produce the same output.
- With the subsidy, the relative price of capital falls compared to labour. The firm's profit-maximising or cost-minimising behaviour will lead it to adjust its input mix.
- To minimise cost for a given output, the firm will use more of the cheaper input (capital) and less of the expensive input (labour). This is the substitution effect.
- Therefore, the quantity of labour demanded decreases, and the quantity of capital equipment demanded increases.
- Option A states: quantity of labour decreases, quantity of capital equipment increases. This matches the reasoning.
- Option B: both decrease – would occur if the subsidy reduced the firm's scale of production, but a subsidy generally reduces costs and may increase output, not decrease both.
- Option C: labour increases, capital decreases – opposite of the substitution effect.
- Option D: both increase – could happen if the scale effect dominates, but the substitution effect is the primary and more direct effect; the question does not provide information about output expansion, so the most plausible answer is the substitution effect.
- Therefore, the correct answer is A.
Key Takeaways
- The demand for factors of production is derived from the demand for the final product.
- Changes in relative input prices lead to substitution between factors.
- A subsidy on a factor reduces its effective price and encourages its use, while reducing the use of substitute factors.
- In multiple-choice questions, apply the economic logic step by step, and eliminate options that contradict the substitution effect.
Common Mistakes
- Confusing the substitution effect with the scale effect. Some students might think that a subsidy on capital reduces costs, so the firm will expand output and thus increase demand for both labour and capital, choosing option D. However, the primary effect, and the one most directly tested, is the substitution effect. The question does not mention output expansion, so the substitution effect is the focus.
- Assuming that labour and capital are complements, which would lead to a different answer. But the question explicitly states they are substitutes.
- Confusing the direction: thinking that subsidising capital makes it cheaper, so the firm will use less of it (since it's cheaper, maybe they think less cost leads to less use? No, cheaper means more use).
Things to Be Careful About
- Read the question carefully: it says "inputs of labour and capital equipment that are substitutes." This is crucial.
- The subsidy is on capital equipment, not on labour. So the relative price of capital falls.
- The answer should reflect the immediate substitution effect; do not overcomplicate with scale effects unless the question explicitly asks for the overall effect.
- In multiple-choice, always consider the most direct economic reasoning.
A country experienced an annual deflation rate of 2% for four successive years.
Which statement is correct for the four-year period?
Options
A The price level fell by 8%.
B The price level fell by less than 8%.
C The real value of money fell by 8%.
D The real value of money fell by less than 8%.
Reasoning
A 2% deflation rate means the price level falls by 2% each year. After four years, the cumulative effect is not simply 4 × 2% = 8% because each year's fall applies to a lower base. The price level after four years is (1 - 0.02)^4 = 0.98^4 ≈ 0.9224, which is a fall of about 7.76%, less than 8%.
Answer
B
B
Background Concept
Deflation is a sustained fall in the general price level over time, measured as a negative inflation rate. When the price level falls by a constant percentage each year, the cumulative effect is calculated using compound growth, not simple addition. This is because the percentage change is applied to the price level at the start of each year, which is already lower than the previous year's starting level.
Understanding the Question
The question states that a country experienced an annual deflation rate of 2% for four successive years. It asks which statement is correct about the four-year period. The key issue is whether the total fall in the price level after four years is exactly 8% (the simple sum) or less than 8% (due to compounding). Options C and D relate to the real value of money, which is inversely related to the price level, but here the correct answer is about the price level itself.
Approach
Recognise that the deflation rate is a percentage decrease applied each year to the price level at the beginning of that year. To find the total change over four years, multiply the price level by (1 - 0.02) four times, i.e., (0.98)^4. Compare this result to 0.92 (which would be a fall of 8%) to see whether the fall is exactly 8% or less. Also note that the real value of money (purchasing power) rises when the price level falls, so options C and D are incorrect as they suggest a fall in real value.
Step-by-Step Reasoning
- Let the initial price level be 100 (any base works).
- After one year of 2% deflation, the price level is 100 × (1 - 0.02) = 98.
- After two years, 98 × 0.98 = 96.04.
- After three years, 96.04 × 0.98 = 94.1192.
- After four years, 94.1192 × 0.98 = 92.2368.
- The total fall in price level is 100 - 92.2368 = 7.7632, which is 7.76% of the original price level, less than 8%.
Alternatively, using the formula: (1 - 0.02)^4 = 0.98^4 ≈ 0.9224, so the price level after four years is 92.24% of the original, meaning a fall of 7.76%. - Therefore, the price level fell by less than 8% (option B is correct).
- Regarding the real value of money: if the price level falls, the purchasing power of money increases. The real value of money (the amount of goods and services one unit of money can buy) rises by the same percentage that the price level falls, but also compounded. So the real value of money rises, not falls. Hence options C and D are incorrect.
Key Takeaways
- Percentage changes that occur over multiple periods must be compounded, not simply added, unless the problem explicitly states simple addition (which is rare in economics).
- Deflation means the price level is falling, so the real value of money (purchasing power) is rising.
- The formula for cumulative change after n periods at a constant growth rate r is (1 + r)^n, where r can be negative for deflation.
Common Mistakes
- Assuming that a 2% fall each year for four years adds up to an 8% fall. This is incorrect because each year's fall is a percentage of a smaller base.
- Confusing the price level with the real value of money. A fall in the price level increases the real value of money.
- Misapplying the formula: using (1 - 0.02 × 4) = 0.92, which treats the percentage as a simple subtraction from the initial value.
Things to Be Careful About
- Always check whether the percentage change is applied to the same base or a changing base. In economics, annual rates are usually compounded.
- When dealing with deflation, the multiplier is (1 - rate), and the exponent is the number of years.
- The question asks about the price level, not the value of money. Read the options carefully.
- The calculation of 0.98^4 can be done manually or with a calculator; approximate values are sufficient for this question.
In the circular flow of income model of an economy, Y, C, I, G, X, S, T and M represent total income, consumption, investment, government expenditure, exports, saving, taxation and imports respectively.
Which statement is correct?
Options
A At equilibrium, the levels of Y and C are always the same.
B Governments always adjust G so that the economy is in equilibrium.
C If I is not equal to S, it is still possible for the national income to be in equilibrium.
D If the national income is in equilibrium, X must be equal to M.
Reasoning
In the circular flow model, equilibrium national income occurs when total injections equal total leakages: I + G + X = S + T + M. This condition does not require that any particular injection equals any particular leakage individually. Therefore, even if I is not equal to S, equilibrium is still possible as long as the sum of all injections equals the sum of all leakages. Option C correctly captures this.
Answer
C
C
Background Concept
The circular flow of income model illustrates the flows of money between households, firms, the government, and the foreign sector. In an open economy with government, the main flows are:
- Injections: Investment (I), Government expenditure (G), Exports (X)
- Leakages: Saving (S), Taxation (T), Imports (M)
National income (Y) is in equilibrium when the total value of injections equals total leakages: I + G + X = S + T + M. This is because any injection adds to the circular flow, while any leakage reduces it. If injections exceed leakages, national income will rise; if leakages exceed injections, national income will fall. Only when they are equal is there no tendency for income to change.
Understanding the Question
The question presents four statements about the circular flow model and asks which is correct. The variables are defined: Y = total income, C = consumption, I = investment, G = government expenditure, X = exports, S = saving, T = taxation, M = imports. The correct statement must be consistent with the equilibrium condition.
Approach
We evaluate each option against the equilibrium condition. Option C is the only one that correctly reflects that equilibrium does not require I = S individually. Options A, B, and D make incorrect claims about necessary conditions for equilibrium.
Step-by-Step Reasoning
-
Option A: "At equilibrium, the levels of Y and C are always the same." This is false. Consumption (C) is a component of aggregate demand, but Y includes other components such as I, G, and net exports. At equilibrium, Y = C + I + G + (X - M). So Y and C are not equal unless the other components sum to zero, which is not generally true.
-
Option B: "Governments always adjust G so that the economy is in equilibrium." This is false. Governments may use fiscal policy to influence the economy, but they do not always adjust G to achieve equilibrium. They may have other objectives (e.g., price stability, redistribution) or may not intervene at all. The statement is a normative claim, not a necessary feature of the model.
-
Option C: "If I is not equal to S, it is still possible for the national income to be in equilibrium." This is true. The equilibrium condition is I + G + X = S + T + M. Even if I ≠ S, the equality can hold if the other injections and leakages adjust. For example, if I > S, then G + X could be less than T + M by the same amount, maintaining equilibrium. So C is correct.
-
Option D: "If the national income is in equilibrium, X must be equal to M." This is false. At equilibrium, total injections equal total leakages, but X does not have to equal M individually. For instance, a trade deficit (X < M) can be offset by a government budget surplus (G < T) or by saving exceeding investment (S > I), so that total leakages still equal total injections.
Thus, only option C is correct.
Key Takeaways
- The equilibrium condition in the circular flow is total injections = total leakages.
- Individual components do not need to balance; only the sums matter.
- Understanding this condition helps analyze the effects of changes in injections or leakages on national income.
Common Mistakes
- Thinking that equilibrium requires I = S or X = M individually. This is a common error because in a simple two-sector model (no government, no foreign sector), equilibrium does require I = S. But in a more complete model with government and foreign sector, the condition is broader.
- Confusing the equality of Y and C. Y is total income, C is only part of it.
- Assuming that governments always intervene to maintain equilibrium. In reality, governments may not act or may have conflicting objectives.
Things to Be Careful About
- Always consider the full set of injections and leakages when analyzing equilibrium in an open economy with government.
- Remember that the circular flow model is a simplification; real economies are more complex.
- In multiple-choice questions, evaluate each option carefully against the theoretical condition.
What leads to a rise in frictional unemployment?
Options
A an economy moving into a period of recession
B replacement of workers with computers in the service sector
C a change from an agriculturally based economy to an industrial economy
D a rise in the number of workers leaving one job to look for another job
Frictional unemployment occurs when workers are temporarily between jobs, actively searching for new positions. A rise in the number of workers leaving one job to look for another directly increases the pool of workers in this search process, raising frictional unemployment.
Option A describes cyclical unemployment (caused by recession). Option B describes technological/structural unemployment (replacement by computers). Option C describes structural unemployment (change in economic structure).
Answer
D
D
Background Concept
Frictional unemployment is a type of unemployment that arises from the normal process of workers moving between jobs. It exists because it takes time for workers to find suitable employment and for employers to find suitable workers, even when there are enough vacancies overall. It is often considered a natural and even healthy part of a dynamic labour market, as it reflects job search and labour mobility. Other main types of unemployment include structural (mismatch of skills or location), cyclical (due to downturns in the business cycle), seasonal (due to predictable changes in demand), and technological (a form of structural unemployment caused by automation).
Understanding the Question
This multiple-choice question asks you to identify which of four scenarios would cause a rise in frictional unemployment. The key is to focus on the precise definition: frictional unemployment is directly linked to the process of job search and voluntary job-to-job movement. The distractors each represent a different type of unemployment: recession (cyclical), replacement by computers (technological/structural), and a shift from agriculture to industry (structural). Only one option matches the frictional type.
Approach
For each option, evaluate whether it is primarily associated with frictional unemployment by checking if it involves workers voluntarily leaving jobs to search for new ones (the core of frictional unemployment). If it describes a cause that leads to a mismatch of skills, a downturn in aggregate demand, or a permanent change in the structure of the economy, it belongs to another type.
Step-by-Step Reasoning
-
Option A: “An economy moving into a period of recession” – A recession reduces aggregate demand, leading to a fall in output and employment. Workers lose their jobs due to insufficient demand, not because they are searching between jobs. This is cyclical unemployment.
-
Option B: “Replacement of workers with computers in the service sector” – This describes automation, which makes certain jobs obsolete. Workers may lack the skills needed for new jobs, creating a skills mismatch. This is technological unemployment, a subset of structural unemployment.
-
Option C: “A change from an agriculturally based economy to an industrial economy” – This is a major structural shift in the economy. Agricultural workers may not have the skills for industrial jobs, and jobs may be located in different regions. This is structural unemployment.
-
Option D: “A rise in the number of workers leaving one job to look for another job” – This directly increases frictional unemployment. Workers who quit to search for a better match are frictionally unemployed during the search period. More quits mean more frictional unemployment, all else equal.
Therefore, D is the correct answer.
Key Takeaways
- Frictional unemployment is voluntary and temporary, arising from the time it takes to match workers and jobs.
- Distinguishing between unemployment types requires understanding the underlying cause: demand deficiency (cyclical), mismatch (structural), technology (technological/structural), seasonal patterns (seasonal), and job search (frictional).
- In multiple-choice questions, focus on the core definition of each type and match it to the scenario.
Common Mistakes
- Confusing frictional unemployment with structural unemployment. Both involve a period of joblessness, but structural has a fundamental mismatch, whereas frictional is about normal job search in a changing but not mismatched labour market.
- Assuming any job loss is frictional. Job loss due to recession, automation, or industry decline is not frictional unless the worker is voluntarily searching between comparable jobs.
- Choosing Option A (recession) because it is the most common type in some contexts; recession causes cyclical, not frictional.
Things to Be Careful About
- Always read the definition: frictional unemployment specifically relates to the time lag between jobs when workers are searching.
- Do not confuse the cause (voluntary quit) with other causes like recessions or structural shifts.
- Remember that frictional unemployment can rise even in a healthy economy if more workers decide to quit and search.
The information shows data from a country’s national income accounts.
| $ million | |
|---|---|
| gross domestic product at market prices | 200 000 |
| gross value added at basic prices | 180 000 |
| subsidies | 5 000 |
| capital consumption | 30 000 |
What can be concluded from the income accounts?
Options
| net domestic product at market prices $ million | indirect tax revenue $ million | |
|---|---|---|
| A | 170 000 | 15 000 |
| B | 170 000 | 25 000 |
| C | 150 000 | 15 000 |
| D | 150 000 | 25 000 |
Working
Net domestic product at market prices = GDP at market prices - capital consumption
= 200 000 - 30 000 = 170 000
Indirect tax revenue = GDP at market prices - Gross value added at basic prices + subsidies
= 200 000 - 180 000 + 5 000 = 25 000
Answer
B
B
Background Concept
National income accounts measure the value of output produced in an economy. There are two key adjustments: from market prices to basic prices, and from gross to net. Market prices include indirect taxes and exclude subsidies. Basic prices exclude indirect taxes and include subsidies. Gross values include capital consumption (depreciation), while net values exclude it. The relationships are:
GDP at market prices = Gross value added at basic prices + indirect taxes - subsidies.
Net domestic product at market prices = GDP at market prices - capital consumption.
Understanding the Question
The question provides data for a country: GDP at market prices ($200,000 million), gross value added at basic prices ($180,000 million), subsidies ($5,000 million), and capital consumption ($30,000 million). The task is to compute net domestic product at market prices and indirect tax revenue, and select the correct combination from the options.
Approach
We will use the two formulas. First, compute net domestic product by subtracting capital consumption from GDP. Second, rearrange the relationship between market prices and basic prices to solve for indirect taxes. Then match the results to the options.
Step-by-Step Reasoning
- Net domestic product at market prices = GDP at market prices - capital consumption = $200,000 - $30,000 = $170,000 million.
- To find indirect tax revenue, start from the relationship: GDP at market prices = Gross value added at basic prices + indirect taxes - subsidies.
Rearranged: indirect taxes = GDP at market prices - Gross value added at basic prices + subsidies.
Substituting: indirect taxes = $200,000 - $180,000 + $5,000 = $25,000 million. - The combination (170,000; 25,000) corresponds to option B.
Key Takeaways
- Understand the difference between market prices and basic prices: indirect taxes are added, subsidies are subtracted.
- Capital consumption is the depreciation of capital, deducted to get net domestic product.
- These adjustments are crucial for accurate national income comparisons.
Common Mistakes
- Confusing the direction of adjustment: some might think subsidies are added to get from market to basic, but actually they are subtracted.
- Forgetting to add back subsidies when computing indirect taxes: a common error is to do $200,000 - $180,000 = $20,000, ignoring the $5,000 subsidies, leading to option A.
- Using gross value added instead of GDP in the net calculation: capital consumption applies to GDP, not to gross value added.
Things to Be Careful About
- Ensure the units are consistent (all in $ million).
- Remember that capital consumption is a deduction from gross to net.
- The term "gross value added at basic prices" is the sum of value added across all sectors, excluding indirect taxes and including subsidies. It is not the same as GDP at market prices.
- When computing net domestic product, we subtract capital consumption from GDP at market prices, not from gross value added.
A government is considering building a large hospital. The impact on the country’s price level will depend partly on the amount of expensive raw materials the country imports for the hospital and the level of unemployment in the country.
Which combination of imports of materials for the hospital and the level of unemployment is most likely to lead to the largest rise in the price level?
Options
| imports of materials | unemployment | |
|---|---|---|
| A | high | high |
| B | high | low |
| C | low | high |
| D | low | low |
Government spending on the hospital increases aggregate demand (AD). Expensive imported raw materials raise construction costs, shifting short-run aggregate supply (SRAS) leftwards (cost-push inflation). When unemployment is low, the economy is near full capacity, so aggregate supply is relatively inelastic; any increase in AD or decrease in SRAS causes a larger rise in the price level than when there is spare capacity. Therefore, the combination of high imports of materials (more cost-push) and low unemployment (less spare capacity) is most likely to lead to the largest rise in the price level.
Answer
B
B
Background Concept
The aggregate demand / aggregate supply (AD/AS) model is used to analyse changes in the price level and real output. Aggregate demand (AD) is the total demand for goods and services in an economy; aggregate supply (AS) is the total output firms are willing to produce at different price levels. An increase in AD (demand-pull inflation) or a decrease in AS (cost-push inflation) can raise the price level. The extent of the price level change depends on the elasticity of AS: when the economy has spare capacity (high unemployment), AS is more elastic, so an AD increase causes a smaller price rise and a larger output rise; when the economy is near full capacity (low unemployment), AS is less elastic, so the same AD increase causes a larger price rise and a smaller output rise.
Understanding the Question
The government is building a large hospital, which is an increase in government spending (a component of AD). However, the question does not directly ask about AD; it asks about the impact on the price level depending on two factors: how much expensive raw materials are imported for the hospital, and the level of unemployment in the country. The answer requires understanding that expensive imported raw materials raise the cost of construction, which can shift the SRAS curve leftwards (cost-push inflation). At the same time, the level of unemployment indicates the degree of spare capacity: low unemployment means less spare capacity, so any given increase in AD or decrease in AS will have a larger effect on the price level. The question asks for the combination that is "most likely to lead to the largest rise in the price level." Thus, we need to choose the option that combines the strongest cost-push effect (high imports of expensive materials) with the least spare capacity (low unemployment).
Approach
We can evaluate each combination by considering both the supply-side effect (imported materials) and the demand-side capacity constraint (unemployment). For each factor, we assess whether it increases or decreases price level pressure. Then, we compare the four combinations: (high imports, high unemployment), (high imports, low unemployment), (low imports, high unemployment), (low imports, low unemployment). The combination with the strongest upward pressure on prices is the one with high imports (causing cost-push) and low unemployment (amplifying the price effect).
Step-by-Step Reasoning
-
Effect of expensive imported raw materials: When the hospital construction uses a large amount of expensive imported raw materials, the cost of building rises. This is a negative supply shock: the cost of a major input increases, so firms (construction companies and, more broadly, the economy) face higher production costs. In the AD/AS framework, this shifts the short-run aggregate supply (SRAS) curve to the left. A leftward shift of SRAS, for any given AD, raises the price level and reduces real output. Therefore, high imports of materials contribute to a rise in the price level. Low imports mean less cost-push, so the price effect is smaller.
-
Effect of the level of unemployment: Unemployment indicates the amount of spare capacity in the economy. When unemployment is low, the economy is operating at or near full employment; resources are scarce and the AS curve is steep (inelastic). In this situation, any increase in AD (from the government spending) or any decrease in AS (from cost-push) will translate largely into a higher price level rather than higher output. Conversely, when unemployment is high, there is slack; the AS curve is flatter (more elastic), so the same AD increase or AS decrease will result in a smaller price increase and a larger output change. Thus, low unemployment amplifies the price-level effect of any shock, while high unemployment dampens it.
-
Combining the two factors: We consider all four options:
- A: High imports, high unemployment. The cost-push effect raises the price level, but the high unemployment (spare capacity) means that some of the pressure is absorbed by increased output rather than prices. So the price level rise is moderate.
- B: High imports, low unemployment. The cost-push effect is present (SRAS shifts left), and the economy has little spare capacity, so the leftward shift of SRAS results in a relatively large increase in the price level. Additionally, the government spending (the hospital) increases AD, which further pushes up prices because the AS curve is steep. This combination yields the largest price level rise.
- C: Low imports, high unemployment. Without the cost-push effect, the only pressure on prices comes from the AD increase (government spending). With high unemployment (spare capacity), the AD increase mainly raises output, with little price pressure. So the price level rise is small.
- D: Low imports, low unemployment. The AD increase occurs but no cost-push. Low unemployment means the AD increase causes some price rise, but less than in option B because there is no cost-push. So the price level rise is smaller than in B.
-
Conclusion: Option B (high imports of materials, low unemployment) is most likely to lead to the largest rise in the price level, as it combines cost-push inflation with an economy operating near full capacity.
Key Takeaways
- Government spending increases AD, but the price effect depends on the slope of AS (capacity utilisation).
- Expensive imported raw materials can act as a cost-push factor, shifting SRAS leftwards and raising the price level.
- Low unemployment indicates less spare capacity, making the AS curve less elastic, so any demand or supply shock has a larger impact on the price level.
- When analysing macroeconomic outcomes, it is essential to consider both demand-side and supply-side factors together with the state of the economy.
Common Mistakes
- Confusing high unemployment with inflation: Some students might think high unemployment is inflationary (perhaps from the Phillips curve). But in the context of spare capacity, high unemployment dampens price rises from demand increases.
- Ignoring the supply-side effect of imports: Students may only consider the demand effect of government spending and forget that imported materials affect costs and thus aggregate supply.
- Treating imports as only a leakage: While imports are a leakage from the circular flow (reducing the multiplier), the question specifically says the materials are "expensive raw materials"; the focus is on their cost effect, not the leakage effect. The leakage effect would reduce the AD increase, possibly lowering price pressure, but the cost-push effect is stronger here and is the intended interpretation.
Things to Be Careful About
- Distinguish between movements along AD/AS curves and shifts of the curves. Government spending shifts AD right; imported materials shifting SRAS left are separate shifts.
- Consider the elasticity of AS: the same shift of AD or AS has different price and output effects depending on whether AS is elastic (spare capacity) or inelastic (full capacity).
- Read the question carefully: it asks for the combination "most likely to lead to the largest rise in the price level," so we need the option that maximises upward price pressure from both factors.
- Note that the question says "the impact on the country's price level will depend partly on the amount of expensive raw materials the country imports for the hospital and the level of unemployment." So the correct answer integrates both factors.
If interest rates are reduced, what is most likely to decrease?
Options
A borrowing by firms
B consumer spending
C import prices
D export prices
Reasoning
A reduction in interest rates reduces the return on holding the currency, leading to a decrease in demand for the currency on the foreign exchange market. This causes a depreciation of the currency. A depreciation makes exports cheaper in foreign currency terms, so export prices (in foreign currency) are likely to decrease. In contrast, borrowing by firms and consumer spending are likely to increase due to lower borrowing costs, and import prices are likely to increase due to the depreciation. Therefore, export prices are the most likely to decrease.
Answer
D
D
Background Concept
Interest rates and exchange rates are linked through international capital flows. When a country's interest rates fall, the return on assets denominated in that currency becomes less attractive to foreign investors. They may sell their holdings of the currency, reducing demand for it. In a floating exchange rate system, a decrease in demand for the currency (or an increase in supply) leads to a depreciation of the exchange rate. Depreciation means the currency buys fewer units of foreign currency, so exports become cheaper for foreign buyers (priced in their own currency) and imports become more expensive for domestic buyers. This is a key channel through which monetary policy affects the external sector.
Understanding the Question
The question asks: if interest rates are reduced, which of the four options is most likely to decrease? We need to evaluate each option: borrowing by firms, consumer spending, import prices, and export prices. The question tests understanding of the causal chain from interest rates to borrowing, spending, and exchange rates, and then to trade prices. The correct answer is the one that actually falls as a result of lower interest rates.
Approach
We consider the effect of a reduction in interest rates on each variable:
- Borrowing by firms (A): Lower interest rates reduce the cost of borrowing, so firms are more likely to borrow to invest. This would increase, not decrease.
- Consumer spending (B): Lower interest rates reduce the cost of consumer credit and may reduce the incentive to save, so consumer spending is likely to increase, not decrease.
- Import prices (C): Lower interest rates lead to a depreciation of the currency, which makes imports more expensive, so import prices rise, not fall.
- Export prices (D): Depreciation makes exports cheaper in foreign currency, so export prices (as seen by foreign buyers) decrease.
Thus, only export prices decrease.
Step-by-Step Reasoning
-
Effect on borrowing and spending: Lower interest rates mean cheaper loans, so firms borrow more for investment, and consumers borrow more for consumption. Savings become less attractive, further boosting spending. So A and B increase.
-
Effect on exchange rate: Lower interest rates reduce the incentive for foreign investors to hold the currency. They may sell the currency, shifting the demand curve for the currency leftwards. This causes a depreciation (fall in the value of the domestic currency relative to foreign currencies).
-
Effect on import prices: A depreciation means the domestic currency buys fewer units of foreign currency, so imported goods become more expensive in domestic currency. Hence import prices rise.
-
Effect on export prices: From the perspective of foreign buyers, a depreciation means they can buy the same amount of domestic currency with less of their own currency. So the price of exports in foreign currency falls. Therefore, export prices (in foreign currency terms) decrease.
Therefore, the only option that decreases is export prices.
Key Takeaways
- Understanding the link between interest rates and exchange rates via capital flows.
- Recognizing that a depreciation makes exports cheaper and imports more expensive.
- Being able to distinguish between the effects on different variables in the economy.
Common Mistakes
- Confusing the effect on export prices with import prices: some students might think lower interest rates reduce import prices, but the opposite is true.
- Thinking that lower interest rates always reduce borrowing: in reality, they encourage borrowing.
- Overlooking the exchange rate channel entirely and assuming no effect on prices.
Things to Be Careful About
- The question asks for the effect “most likely” to decrease; in the short run, the exchange rate effect is immediate, but other factors may also change. However, among the options, only export prices consistently decrease.
- The question assumes a floating exchange rate; if the exchange rate is fixed, the effect would be different. But in a typical AS context, the standard model is floating.
- Ensure you reason step by step, considering the chain of causation.
Supply-side policy often has fiscal consequences.
Which statement is not correct?
Options
A Increased government spending supporting technical progress has beneficial long-term supply-side effects but may have short-term inflationary consequences.
B Increased government expenditure on training increases a country’s long-run aggregate supply (LRAS) and also has an expansionary effect on aggregate demand (AD).
C Reduced government infrastructure spending reduces an economy’s LRAS and has a short-term expansionary effect on AD.
D Reduced rates of tax on higher incomes increases an economy’s LRAS and has an expansionary effect on AD.
Answer
Options A and B are correct: increased government spending on technical progress (A) and on training (B) both shift LRAS rightwards (supply-side effect) and also increase AD (fiscal expansion). In the short run, the AD shift may be inflationary, especially if the economy is near full capacity.
Option D is also correct: reduced tax rates on higher incomes can increase incentives to work and invest, shifting LRAS rightwards, and by leaving more disposable income, also increases consumption and AD.
Option C is incorrect: reduced government infrastructure spending reduces LRAS (as the economy's productive capacity falls) and also reduces AD (contractionary fiscal effect), not an expansionary effect. Therefore C is the statement that is not correct.
Answer
C
C
Background Concept
Supply-side policy aims to increase the productive capacity of the economy, shifting the long-run aggregate supply (LRAS) curve to the right. Many supply-side policies involve changes in government spending or taxation, which also affect aggregate demand (AD) in the short run. For example, increased government spending on infrastructure, training, or R&D directly adds to AD (G component) and also boosts LRAS over time. Conversely, cuts in government spending reduce AD in the short run. Tax cuts can stimulate AD (more disposable income) and also improve incentives, shifting LRAS.
Understanding the Question
The question asks which of four statements about supply-side policy and its fiscal consequences is not correct. Each statement describes a combination of a fiscal change (increase or decrease in government spending or taxation) and its effects on LRAS and AD. The student must identify the one that contains an error in either the direction of the effect on LRAS or AD, or the short-term/long-term distinction.
Approach
For each option, evaluate:
- Does the fiscal change affect LRAS (supply side) as stated? (e.g., spending on training should increase LRAS; cutting infrastructure spending should decrease LRAS)
- Does the fiscal change affect AD in the short run as stated? (e.g., increased government spending increases AD; lower taxes increase AD; reduced government spending reduces AD)
- Then identify the option that contradicts economic logic.
Step-by-Step Reasoning
Option A: Increased government spending supporting technical progress (e.g., R&D subsidies) will improve technology and productivity, shifting LRAS rightwards. This is a supply-side effect. In the short run, the increase in government spending adds to AD, which can cause demand-pull inflation if the economy is near full capacity. So the statement is correct.
Option B: Increased government expenditure on training raises the quality of labour, increasing LRAS. At the same time, the spending itself is part of G, so AD increases. This is correct.
Option C: Reduced government infrastructure spending means less capital formation, so the economy's productive capacity falls, shifting LRAS leftwards. The reduction in G also reduces AD, so it is contractionary, not expansionary. The statement says it has a 'short-term expansionary effect on AD' – that is wrong. It should be contractionary. Therefore C is not correct.
Option D: Reduced tax rates on higher incomes can increase work effort and investment, shifting LRAS rightwards. Lower taxes also increase disposable income, boosting consumption, thus AD increases. This is correct.
Hence the incorrect statement is C.
Key Takeaways
- Supply-side policies that involve government spending have both short-run demand-side effects (via AD) and long-run supply-side effects (via LRAS).
- A cut in government spending is contractionary for AD, not expansionary.
- Tax cuts are expansionary for AD and can also improve supply-side incentives.
Common Mistakes
- Confusing the direction of the AD effect: reduced government spending reduces AD, not increases it. Some students might think that cutting infrastructure spending frees up resources for private investment, but in the short run, the direct effect on AD is negative.
- Overlooking the short-run inflationary consequences of fiscal expansion: some may think supply-side improvements always reduce inflation, but in the short run, the AD boost can cause inflation.
- Thinking that reduced tax rates always shift LRAS immediately; in reality, the supply-side effect may take time to materialise, but the question accepts the theoretical direction.
Things to Be Careful About
- Read each statement carefully: note the exact wording, especially 'short-term expansionary effect on AD' – if the fiscal change is a reduction in spending, that effect is contractionary.
- Distinguish between the short-run and long-run effects: supply-side policies take time to shift LRAS, while fiscal changes affect AD immediately.
- Remember that government spending is a component of AD, so any change in G directly affects AD.
Changes in fiscal policy can affect the distribution of income and wealth.
Which combination of fiscal policy would most likely be regressive?
Options
A a fall in the lowest level of income when income tax has to be paid and a fall in the rate of inheritance tax
B a fall in the charge made for visits to a doctor and a rise in the level of unemployment benefit
C a rise in the rate of income tax charged at higher levels of income and a rise in the standard rate of corporation tax
D a rise in the standard rate of income tax and a fall in the standard rate of goods and services tax
Answer
A regressive fiscal policy change benefits higher-income groups disproportionately relative to lower-income groups, or imposes a larger burden on lower-income groups as a proportion of their income.
Option A: Lowering the income tax threshold (personal allowance) brings more low-income earners into the tax net, increasing their tax burden. Reducing inheritance tax benefits the wealthy, who are the main payers. Together, these changes make the tax system more regressive.
Option B: Reducing healthcare charges and raising unemployment benefits are progressive measures that help lower-income groups.
Option C: Higher income tax on higher incomes is progressive; higher corporation tax is not clearly regressive.
Option D: Raising income tax (proportional or progressive) and cutting GST (a regressive tax) could be progressive overall.
Thus, the combination most likely regressive is A.
A
Background Concept
Fiscal policy involves changes in government spending and taxation to influence the economy. The distributional impact of fiscal policy refers to how these changes affect different income groups. A tax is progressive if the average tax rate increases as income rises (e.g., higher income tax rates for higher brackets). A tax is regressive if the average tax rate falls as income rises, meaning lower-income groups pay a larger proportion of their income in tax (e.g., a flat consumption tax like GST). Inheritance tax is typically paid only by the wealthy, so reducing it benefits the rich. The personal allowance (threshold for income tax) determines who pays income tax; lowering it brings more low-income earners into the tax net, increasing their burden. Changes in benefits (e.g., unemployment benefit) directly affect the poorest. The question asks which combination of fiscal policy changes is most likely regressive in its overall effect on the distribution of income and wealth.
Understanding the Question
The question requires identifying the option where the combined effect of the two policy changes is regressive, i.e., it disproportionately benefits the rich or burdens the poor. Each option pairs two changes. We must evaluate the regressive nature of each change and then judge the net effect. The key is to remember that regressive does not mean 'bad' but describes the pattern of tax burden relative to income.
Approach
For each option:
- Determine whether each individual policy change is progressive, regressive, or proportional.
- Consider the combined impact on the distribution of income and wealth.
- A regressive combination will either increase the burden on the poor, decrease the burden on the rich, or both.
We will examine each option in order.
Step-by-Step Reasoning
Option A:
- 'A fall in the lowest level of income when income tax has to be paid' means the personal allowance is reduced. This means that people with lower incomes now have to pay income tax, increasing their tax burden. This is regressive because it makes the tax system less progressive (or more regressive) by taxing poorer people who were previously exempt.
- 'A fall in the rate of inheritance tax' reduces the tax on inherited wealth. Inheritance tax is paid primarily by the wealthy. Reducing it benefits the rich, making the overall tax system more regressive.
- Combined effect: Both changes are regressive, so the overall impact is regressive.
Option B:
- 'A fall in the charge made for visits to a doctor' reduces out-of-pocket healthcare costs. This benefits everyone, but lower-income groups are more likely to rely on public healthcare and spend a larger proportion of their income on health. So this is progressive (or at least not regressive).
- 'A rise in the level of unemployment benefit' directly increases the income of the unemployed, who are among the poorest. This is progressive.
- Combined effect: Both changes are progressive, so the overall impact is not regressive.
Option C:
- 'A rise in the rate of income tax charged at higher levels of income' is progressive because it increases the tax burden on the rich.
- 'A rise in the standard rate of corporation tax' is a tax on company profits. Its incidence falls on shareholders (who tend to be wealthier) and possibly on workers or consumers. It is generally considered progressive or at least not regressive.
- Combined effect: Both are progressive or neutral, not regressive.
Option D:
- 'A rise in the standard rate of income tax' is a proportional tax (if a flat rate) or mildly progressive (if brackets remain). It increases the burden on all income earners, but the rich pay more in absolute terms. This is not regressive.
- 'A fall in the standard rate of goods and services tax (GST)' reduces a regressive consumption tax. Lower-income groups spend a larger share of their income on consumption, so they benefit proportionally more from a GST cut. This is progressive.
- Combined effect: The combination of a proportional tax rise and a progressive cut is likely progressive overall, not regressive.
Therefore, only Option A results in a regressive overall effect.
Key Takeaways
- Regressive policies shift the tax burden towards lower-income groups or reduce taxes on the wealthy.
- Changes to tax thresholds (personal allowance) directly affect the progressivity of income tax.
- Inheritance tax is paid by the wealthy, so reducing it is regressive.
- Benefits and consumption taxes have significant distributional effects.
- When evaluating combinations, consider the net effect on the distribution of income and wealth.
Common Mistakes
- Confusing regressive with proportional or progressive. A flat tax is proportional, not regressive; regressive means the average rate falls as income rises.
- Overlooking that a regressive policy can be a reduction in progressive taxes (e.g., inheritance tax) or an increase in regressive taxes (e.g., GST).
- Not considering both elements of the combination; assuming a single change determines the overall effect.
- Thinking that all consumption taxes are regressive; they are, but a reduction in such a tax is progressive.
Things to Be Careful About
- The question asks for 'most likely regressive', so we must be careful about ambiguous cases. Option A is clearly regressive; others are clearly not.
- Remember that 'regressive' is a technical term, not a value judgement. It describes the relationship between income and tax rate.
- In the exam, read each option carefully and consider the direction of the change (increase or decrease) and the likely incidence of the tax or spending.
- Do not assume that all tax increases are regressive or all tax cuts are progressive; it depends on the type of tax and who pays it.
What does it mean when a government has a budget surplus?
Options
A Government revenue exceeds expenditure.
B Imports exceed exports.
C The government has an expansionary fiscal policy.
D The national debt is increasing.
Answer
A budget surplus is a situation where government revenue is greater than government expenditure. Option A matches this definition. Therefore, the correct answer is A.
A
Background Concept
A government budget is a financial statement showing the government's planned revenue and expenditure over a period, typically a fiscal year. A budget surplus occurs when revenue (mainly from taxes) exceeds expenditure (spending on public services, infrastructure, etc.). This is the opposite of a budget deficit, where expenditure exceeds revenue. The budget balance is a key indicator of fiscal policy stance: a surplus is often associated with contractionary fiscal policy, while a deficit is associated with expansionary fiscal policy.
Understanding the Question
This question tests the basic definition of a budget surplus. It is a straightforward recall question, asking for the correct description among four options. The other options are common misconceptions or related concepts: a trade surplus (B), expansionary fiscal policy (C), and an increasing national debt (D).
Approach
Recall the definition of a budget surplus: government revenue > government expenditure. Identify the option that matches this definition. Then check each distractor to confirm it does not describe a budget surplus.
Step-by-Step Reasoning
- Option A states "Government revenue exceeds expenditure." This is exactly the definition of a budget surplus. Therefore, A is correct.
- Option B states "Imports exceed exports." This describes a trade deficit, not a government budget surplus. It is a confusion between the government budget and the balance of trade.
- Option C states "The government has an expansionary fiscal policy." Expansionary fiscal policy typically involves increasing government spending and/or cutting taxes, which tends to create a budget deficit (or reduce a surplus). A surplus is usually associated with contractionary fiscal policy, not expansionary.
- Option D states "The national debt is increasing." A budget surplus reduces the national debt (because the government can use the surplus to pay off debt), while a budget deficit increases the national debt. So D is the opposite of the effect of a surplus.
Therefore, only option A is correct.
Key Takeaways
- A budget surplus = government revenue > expenditure.
- A budget deficit = government expenditure > revenue.
- A surplus reduces the national debt; a deficit increases it.
- A surplus is associated with contractionary fiscal policy; a deficit with expansionary fiscal policy.
- Do not confuse government budget surplus with trade surplus (exports > imports).
Common Mistakes
- Confusing budget surplus with trade surplus (option B).
- Thinking a surplus means expansionary policy (option C) – actually, a surplus is contractionary.
- Thinking a surplus increases national debt (option D) – it actually decreases it.
Things to Be Careful About
- Always distinguish between the government budget balance and the balance of trade.
- Remember that fiscal policy stance is determined by the direction of change in the budget balance relative to the state of the economy, not just the level. But for this basic definition, a surplus is a surplus.
- The national debt is the accumulation of past deficits minus surpluses; a surplus reduces the debt.
A country subsidises domestic production of manufactured goods.
What is the most likely outcome?
Options
A a rise in economic growth
B a rise in imports of manufactured goods
C a rise in the rate of inflation
D a rise in unemployment
Reasoning
A subsidy to domestic producers reduces their costs of production. This shifts the domestic supply curve for manufactured goods to the right, increasing domestic output. In the AD/AS framework, this is a positive supply-side shock: the SRAS (and potentially LRAS) curve shifts right, raising real output and lowering the price level. Higher real output means higher real GDP, which is economic growth.
Option B is wrong because a rise in domestic output reduces the need for imports. Option C is wrong because the subsidy lowers costs and prices, not raises them. Option D is wrong because higher output tends to increase employment, not reduce it.
Answer
A
A
Background Concept
A subsidy is a payment by the government to producers, typically per unit of output. It reduces the producer's marginal cost, shifting the supply curve to the right (or downward). In a single market, this leads to a lower equilibrium price and a higher equilibrium quantity. At the macroeconomic level, a widespread subsidy to domestic manufacturing acts as a supply-side policy: it shifts the short-run aggregate supply (SRAS) curve to the right, increasing the economy's capacity to produce real output at any given price level. This is distinct from demand-side policies (fiscal or monetary expansion) which shift AD and can cause inflation.
Understanding the Question
The question presents a simple scenario: a country subsidises domestic production of manufactured goods. It asks for the 'most likely outcome' among four options. This is a positive economics question requiring a causal chain. The key is to recognise that a production subsidy is a supply-side intervention, not a demand-side one. The correct answer must follow from the logic of a rightward shift in supply.
Approach
- Identify the direct microeconomic effect of the subsidy: lower costs for domestic manufacturers -> increased domestic supply.
- Translate this to the macroeconomic level: increased domestic supply of manufactured goods contributes to a rightward shift of the SRAS curve.
- Trace the consequences of a rightward SRAS shift: real output (GDP) rises, the price level falls.
- Match these consequences to the options: a rise in real GDP is economic growth (A). The other options are inconsistent with a supply-side expansion.
Step-by-Step Reasoning
-
Step 1: Micro effect of the subsidy. A subsidy to domestic producers of manufactured goods reduces their cost of production. For each unit produced, the producer receives the market price plus the subsidy. This makes production more profitable at every price, so firms increase output. The domestic supply curve for manufactured goods shifts to the right.
-
Step 2: Macro effect on aggregate supply. The manufacturing sector is a significant part of the economy. A rightward shift in the supply of manufactured goods contributes to a rightward shift of the economy's short-run aggregate supply (SRAS) curve. If the subsidy also encourages investment in capital or technology, it could also shift the long-run aggregate supply (LRAS) curve to the right, representing an increase in productive capacity.
-
Step 3: Impact on real output and the price level. In the AD/AS model, a rightward shift of SRAS (with AD unchanged) leads to a new equilibrium with a higher level of real output (Y) and a lower price level (P). Higher real output means the economy is producing more goods and services, which is measured as an increase in real GDP. This is economic growth.
-
Step 4: Evaluating the options.
- A: a rise in economic growth. This is correct. The increase in real output constitutes economic growth.
- B: a rise in imports of manufactured goods. This is incorrect. The subsidy makes domestic goods cheaper relative to imports, so domestic consumers and firms will substitute away from imports towards domestically produced goods. Imports of manufactured goods are likely to fall.
- C: a rise in the rate of inflation. This is incorrect. A supply-side expansion reduces costs and prices, putting downward pressure on the price level. It is disinflationary (or deflationary), not inflationary. Inflation is more likely to result from demand-side expansion.
- D: a rise in unemployment. This is incorrect. To produce the higher output, firms will need to employ more workers (assuming the economy is not at full employment). Unemployment is likely to fall.
Key Takeaways
- A production subsidy is a supply-side policy; its primary effect is to shift the supply curve rightwards.
- Supply-side expansions increase real output and reduce the price level (disinflationary).
- Economic growth is an increase in real GDP, which can come from either demand-side or supply-side factors.
- Always distinguish between the effects of demand-side policies (AD shifts) and supply-side policies (AS shifts).
Common Mistakes
- Confusing subsidy with demand stimulus: A common error is to think a subsidy to producers increases demand. It does not; it increases supply. The effect on price and output is opposite to that of a demand increase.
- Ignoring the supply-side nature: Students might incorrectly think the subsidy will cause inflation (C) because they associate government spending with demand-pull inflation. However, a subsidy is not government spending on goods and services; it is a transfer to producers that lowers their costs.
- Assuming imports rise: Some might think that subsidising domestic production will lead to more imports because the economy is growing. But the direct effect is import substitution: cheaper domestic goods replace foreign ones.
Things to Be Careful About
- Read the question carefully: it says 'subsidises domestic production', not 'subsidises consumption' or 'imposes a tariff'. The mechanism is supply-side.
- Remember that 'economic growth' in this context means an increase in real GDP, not just nominal GDP. The subsidy increases real output.
- In the AD/AS model, a rightward shift of SRAS lowers the price level. This is the opposite of inflation.
What is not a valid explanation of why a government might allow a deficit on the balance of payments current account to continue?
Options
A The balance of payments account must always balance.
B Foreign direct investment might help to finance the deficit.
C The country may have a larger surplus on the other parts of its balance of payments account.
D The standard of living is increased if the level of cheap food imports is significant.
Reasoning
The question asks which option is NOT a valid explanation for why a government might allow a current account deficit to persist. Options B, C and D all describe genuine reasons: foreign direct investment can finance the deficit (B), a surplus elsewhere in the balance of payments can offset it (C), and cheap imports can raise living standards (D). Option A states that 'the balance of payments account must always balance' — this is an accounting identity, not a policy reason for tolerating a deficit. It is a statement of fact about how the accounts are constructed, not an explanation of why a government might choose not to correct a deficit. Therefore A is the invalid explanation.
Answer
A
A
Background Concept
The balance of payments is a record of all economic transactions between residents of one country and the rest of the world over a period. It is divided into the current account (trade in goods, services, primary income and secondary income) and the capital and financial account (flows of financial assets and liabilities). By double-entry accounting, the overall balance of payments must always balance — every credit on one account is matched by a debit on another. A deficit on the current account is therefore always matched by a surplus on the capital and financial account (or by a change in official reserves). This accounting identity is not a policy choice; it is a constraint that always holds.
Understanding the Question
The question asks which of the four options is NOT a valid explanation for why a government might allow a current account deficit to continue. The key is to distinguish between an accounting fact (the balance of payments always balances) and genuine economic or policy reasons for tolerating a deficit. Options B, C and D each give a plausible reason: the deficit can be financed by foreign investment (B), offset by surpluses elsewhere in the balance of payments (C), or the deficit may reflect beneficial imports that raise living standards (D). Option A, however, merely restates the accounting identity — it is not a reason for inaction, but a description of how the accounts work.
Approach
Read each option carefully. For each, ask: 'Could a government use this as a reason to not correct a current account deficit?' If yes, it is a valid explanation. If the option is simply a true statement about accounting but not a policy rationale, it is invalid. Option A is the only one that fails the test.
Step-by-Step Reasoning
-
Option A: 'The balance of payments account must always balance.' This is true as an accounting identity — every current account deficit is automatically matched by a surplus on the capital/financial account. However, it is not a reason for a government to allow a deficit to persist. It is a statement of fact, not a policy justification. A government might still worry about the sustainability of the deficit, the level of foreign debt, or the exchange rate. Therefore A is NOT a valid explanation.
-
Option B: 'Foreign direct investment might help to finance the deficit.' This is a valid reason. If a country attracts FDI, the capital inflow appears as a surplus on the financial account, offsetting the current account deficit. The government may view this as a sign of confidence and not feel the need to intervene.
-
Option C: 'The country may have a larger surplus on the other parts of its balance of payments account.' This is also valid. A surplus on the capital/financial account can more than offset a current account deficit, so the overall balance of payments is in surplus. The government may not be concerned about the current account deficit in isolation.
-
Option D: 'The standard of living is increased if the level of cheap food imports is significant.' This is a valid reason. If the deficit is caused by importing cheap food, consumers benefit from lower prices and a higher real standard of living. The government may accept the deficit as a trade-off for improved welfare.
Since A is the only option that does not provide a genuine policy reason, it is the correct answer.
Key Takeaways
- The balance of payments always balances by accounting definition — this is not a policy choice.
- A current account deficit can be financed by capital inflows (FDI, portfolio investment) or by running down reserves.
- Governments may tolerate a current account deficit if it reflects beneficial trade (cheap imports) or if it is offset by other parts of the balance of payments.
- The question tests the distinction between an accounting identity and a policy rationale.
Common Mistakes
- Confusing the accounting identity (the balance of payments always balances) with a policy reason for inaction. Option A is a true statement but does not answer the question.
- Thinking that a current account deficit is always a problem — the question asks for explanations of why it might be allowed to continue, implying there are valid reasons.
- Misreading the question: 'What is not a valid explanation' — the answer is the one that does not explain why a government might allow a deficit.
Things to Be Careful About
- Read the question carefully: it asks for the option that is NOT a valid explanation.
- Distinguish between an accounting fact and a policy reason.
- Remember that the balance of payments always balances by construction — this is not a reason for inaction.
A country currently producing at point X on its production possibility curve decides to specialise in the manufacture of cars and import trucks. It finds it can import one truck in exchange for four cars.
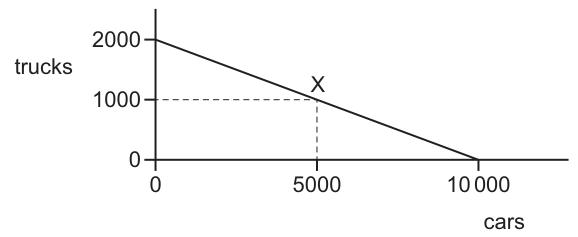
What is the result in the domestic market if it exports all the extra cars?
Options
A 250 extra trucks
B 1000 extra trucks
C 1250 extra trucks
D 2000 extra trucks
Working
At point X the economy produces 5000 cars and 1000 trucks. By specializing fully in cars, production moves to the horizontal intercept of the PPC, giving 10000 cars and 0 trucks. The extra cars available for export are therefore 10000 - 5000 = 5000 cars.
The terms of trade are 1 truck = 4 cars. Exporting the extra 5000 cars allows the country to import:
5000 / 4 = 1250 trucks.
Originally the economy produced 1000 trucks. The net increase in trucks available for domestic use is:
1250 - 1000 = 250 trucks.
Answer
A
A
Background Concept
A production possibility curve (PPC) shows the maximum combinations of two goods an economy can produce when all resources are fully and efficiently employed. The curve in Fig. 26.1 is a straight line, indicating constant opportunity cost: each additional car costs the same number of trucks, and vice versa. The intercepts reveal the maximum possible output of each good if all resources are devoted to it—2000 trucks or 10000 cars.
Specialization means concentrating production on the good for which the economy has a comparative advantage. The terms of trade specify the rate at which the two goods can be exchanged internationally. If the terms of trade are better than the domestic opportunity cost, trade allows the economy to consume beyond its own PPC. Here, the domestic opportunity cost of 1 truck is 5 cars (2000/10000), but the country can import 1 truck for only 4 cars, so trade is beneficial.
Understanding the Question
The question places the economy at point X (5000 cars, 1000 trucks). It then asks what happens domestically if the country fully specializes in cars (moving to 10000 cars, 0 trucks) and exports all the additional cars produced. The key phrase is "extra cars"—this means the increase in car output due to specialization, not the total. The terms of trade are 1 truck = 4 cars. The question asks for the result in terms of extra trucks available domestically, which requires comparing the imported trucks after trade with the original 1000 trucks produced before specialization.
Approach
- Identify the current production bundle at point X from the diagram.
- Identify the maximum car output if the economy fully specializes (the x-intercept).
- Calculate the extra cars produced: maximum cars minus current cars.
- Convert these extra cars into trucks using the given terms of trade (divide by 4).
- Subtract the original truck production (1000) to find the net gain in trucks.
Step-by-Step Reasoning
Step 1: Reading the diagram. The PPC has a y-intercept of 2000 trucks and an x-intercept of 10000 cars. Point X is at (5000 cars, 1000 trucks). This means the economy is currently producing 5000 cars and 1000 trucks.
Step 2: Specialization. If the economy specializes completely in cars, it moves to the x-intercept: 10000 cars and 0 trucks. The increase in car output is 10000 - 5000 = 5000 extra cars.
Step 3: Applying the terms of trade. The country can trade at a rate of 4 cars for 1 truck. To find how many trucks can be imported with 5000 cars, divide:
5000 cars / 4 cars per truck = 1250 trucks.
Step 4: Finding the net gain. Before specialization, the economy had 1000 trucks. After trade, it has 1250 trucks. The extra trucks available for domestic use are:
1250 - 1000 = 250 trucks.
This matches option A.
Key Takeaways
- Always read the intercepts of a PPC carefully: they represent maximum output when all resources go to one good.
- "Extra" or "additional" output means the change from the original position, not the total.
- When applying terms of trade, ensure you divide in the correct direction: if 4 cars buy 1 truck, then cars / 4 = trucks.
- The net benefit of trade is the post-trade consumption minus the pre-trade production of the imported good.
Common Mistakes
- Forgetting to subtract the original output: A common error is to stop at 1250 trucks and choose option C. The question asks for the extra trucks, not the total trucks after trade.
- Inverting the terms of trade: Confusing "4 cars per truck" with "4 trucks per car" leads to a wildly wrong answer.
- Misreading the diagram: Mixing up the axes (trucks vertical, cars horizontal) or misreading the coordinates of point X leads to using the wrong starting figures.
- Using the wrong intercept: Some candidates might use the y-intercept (2000) instead of the x-intercept (10000) for car specialization, or vice versa.
Things to Be Careful About
- The PPC is a straight line, so the opportunity cost is constant. This simplifies the calculation but does not change the method.
- The phrase "exports all the extra cars" is precise: it refers only to the 5000 additional cars, not the original 5000. If the country exported all 10000 cars, it would get 2500 trucks, but that is not what the question states.
- Always check the units and direction of the trade ratio before dividing. Here, cars are the export good and trucks are the import good, so cars must be divided by the number of cars per truck.
What is most likely to cause a current account deficit?
Options
A a recession in the domestic economy
B a relatively high rate of inflation
C an undervalued exchange rate
D high labour productivity
A relatively high rate of inflation makes a country's exports less price-competitive in international markets and makes imports relatively cheaper, thereby increasing the trade deficit. Options A, C and D would all tend to improve the current account: a recession reduces import demand, an undervalued exchange rate boosts exports and reduces imports, and high labour productivity lowers costs and improves competitiveness.
Answer
B
B
Background Concept
The current account of the balance of payments records transactions in goods, services, primary income (e.g. investment income) and secondary income (e.g. transfers). A current account deficit occurs when payments abroad (imports of goods and services, income outflows, transfers) exceed receipts from abroad (exports, income inflows, transfers). The main driver is often the trade balance – the difference between exports and imports of goods and services. Price competitiveness is a key determinant: if a country's prices rise relative to its trading partners, its exports become less attractive and imports become relatively cheaper, worsening the trade balance.
Understanding the Question
This multiple-choice question asks: 'What is most likely to cause a current account deficit?' You must choose the one option among four that would tend to push the current account into deficit or worsen an existing deficit. The other three options would typically have the opposite effect.
Approach
Consider each option in turn, looking at its effect on exports and imports:
- Option A: A recession reduces domestic income and spending, which normally reduces imports, improving the current account.
- Option B: A relatively high rate of inflation makes domestic goods dearer relative to foreign goods, reducing exports and boosting imports, worsening the current account.
- Option C: An undervalued exchange rate makes exports cheaper and imports dearer, improving the current account.
- Option D: High labour productivity lowers unit costs, increasing competitiveness and improving the current account.
Only Option B unambiguously worsens the current account.
Step-by-Step Reasoning
-
Define a current account deficit: A deficit means that the value of imports of goods and services plus other payments exceeds the value of exports plus other receipts. The trade balance is the largest component.
-
Analyse Option A – recession: A recession leads to falling output and incomes. Lower income reduces the demand for imports (since imports are positively related to income). This reduces the trade deficit or increases the trade surplus, thus improving the current account. So a recession is unlikely to cause a deficit; it tends to reduce one.
-
Analyse Option B – high inflation: If a country's inflation rate is higher than that of its trading partners, its exports become relatively expensive (foreign buyers switch to cheaper alternatives) and imports become relatively cheap (domestic consumers buy more imports). The export volume falls and the import volume rises, worsening the trade balance and causing a current account deficit – or making an existing deficit larger. This is the most direct cause among the options.
-
Analyse Option C – undervalued exchange rate: An undervalued exchange rate means the domestic currency is cheaper than the market-clearing rate. This makes exports cheaper for foreign buyers (greater demand for exports) and imports dearer for domestic consumers (reduced demand for imports). This improves the trade balance and thus the current account. So an undervalued exchange rate is a measure that corrects a deficit, not one that causes it.
-
Analyse Option D – high labour productivity: Higher labour productivity lowers unit costs of production. This makes domestic goods more competitive internationally, boosting exports and reducing imports. Again, this improves the trade balance and the current account. It is a supply-side strength, not a cause of deficit.
-
Conclusion: Only Option B – a relatively high rate of inflation – is likely to cause a current account deficit.
Key Takeaways
- The current account is heavily influenced by price competitiveness.
- High inflation erodes competitiveness and worsens the trade balance.
- A recession reduces import demand and improves the current account (this is a key point often misunderstood).
- An undervalued exchange rate and high productivity both boost competitiveness.
- Always think through the causal chain: what happens to exports and imports, and why.
Common Mistakes
- Thinking a recession causes a deficit: In reality, lower income reduces imports, so the current account tends to improve.
- Confusing an undervalued exchange rate with an overvalued one: An overvalued currency makes exports expensive and imports cheap, causing a deficit; an undervalued one does the opposite.
- Believing high productivity reduces competitiveness: Higher productivity lowers costs per unit, making exports more attractive.
- Overlooking the effect of inflation on trade: Inflation differentials are a fundamental driver of trade flows.
Things to Be Careful About
- Distinguish between nominal and real exchange rates: inflation affects the real exchange rate even if the nominal rate is fixed.
- The question asks 'most likely' – some factors might have ambiguous effects in the very short run (e.g., J-curve effect), but at this level, the straightforward theoretical effect is what is tested.
- Labour productivity can sometimes rise due to capital investment that might also increase imports of capital goods, but the net effect on competitiveness is usually positive.
- Always check each option independently.
Two statements describing forms of protectionism a government can use are listed.
1 There is a total ban on imports.
2 All imported goods have to be of a specified standard.
Which combination correctly describes these two statements?
Options
| statement 1 | statement 2 | |
|---|---|---|
| A | administrative barrier | import quota |
| B | administrative barrier | embargo |
| C | embargo | administrative barrier |
| D | embargo | import quota |
Answer
Statement 1 describes a total ban on imports, which is an embargo. Statement 2 requires imported goods to meet a specified standard; this is an administrative barrier (a non-tariff barrier). The correct combination is C: statement 1 = embargo, statement 2 = administrative barrier.
C
Background Concept
Protectionism refers to government measures that restrict international trade to shield domestic industries from foreign competition. Barriers can be tariff-based (e.g., import duties) or non-tariff (e.g., quotas, embargoes, administrative barriers). An embargo is a complete prohibition of trade with a particular country or for a specific product — the most extreme form of protection. An administrative barrier imposes procedural or quality requirements (such as safety standards, labelling rules, or excessive red tape) that make it harder or costlier for foreign goods to enter the market. These are often less transparent than tariffs but can be equally restrictive.
Understanding the Question
The question presents two statements describing protectionist measures and asks to match each with its correct label from a list. It directly tests knowledge of the definitions of embargo, import quota, and administrative barrier. An import quota is a quantitative limit (a maximum quantity allowed), not a total ban. An administrative barrier involves rules and standards, not a quantity restriction. By understanding these distinctions, the right combination can be selected. The question is pure recall — no calculation or evaluation required.
Approach
Identify each statement by its core feature: statement 1 says "total ban" — that is the defining characteristic of an embargo. Statement 2 says "specified standard" — that is a classic administrative barrier. Then compare with the options and eliminate those that swap the labels or incorrectly use "import quota".
Step-by-Step Reasoning
-
Statement 1: "There is a total ban on imports."
- An embargo is a complete ban. This matches exactly.
- An import quota allows some imports up to a limit, so it is not a total ban. Therefore statement 1 cannot be an import quota.
- An administrative barrier does not involve a total ban; it imposes conditions but allows imports that satisfy them.
- So statement 1 must be labelled "embargo".
-
Statement 2: "All imported goods have to be of a specified standard."
- This is a requirement that imports must meet certain quality or technical criteria — it does not ban them outright but restricts those that fail to comply. This is the essence of an administrative barrier (also called a non-tariff barrier).
- An embargo is a total ban, not a conditional standard.
- An import quota sets a quantity limit, not a quality condition.
- So statement 2 must be labelled "administrative barrier".
-
Now check the options:
- A says statement 1 = administrative barrier, statement 2 = import quota. Both wrong.
- B says statement 1 = administrative barrier, statement 2 = embargo. Statement 1 wrong.
- C says statement 1 = embargo, statement 2 = administrative barrier. Both match — correct.
- D says statement 1 = embargo, statement 2 = import quota. Statement 2 wrong.
Hence C is the correct answer.
Key Takeaways
- Embargo: a complete ban on imports (or exports) of a product or with a country.
- Import quota: a quantitative limit on the number or value of goods that can be imported.
- Administrative barrier: standards, inspections, paperwork, or other regulations that increase the cost or difficulty of importing.
- Read the wording carefully: "total ban" vs "specified standard" gives away the type.
Common Mistakes
- Confusing an import quota with an embargo (quota allows some imports, embargo allows none).
- Thinking that a standard is a quota (a standard is a quality condition, not a quantity limit).
- Misremembering administrative barriers as being about paperwork only — they include product standards, labelling, health/safety checks, etc.
- Not reading the options table carefully and swapping the two labels.
Things to Be Careful About
- An embargo can be total (ban on all imports from a country) or partial (ban on a specific good). The question's phrasing "total ban on imports" confirms it is an embargo.
- An administrative barrier often appears under the name "non-tariff barrier" or "red tape". Remember that it does not set a quantity restriction.
- The question uses "specified standard" which is a clear indicator of administrative barrier. In other contexts, "health and safety regulations" or "technical requirements" would signal the same.
When is there an improvement in a country’s terms of trade?
Options
A when the price of exports falls more than the price of imports
B when there is no change in the price of exports but a fall in the price of imports
C when the value of exports increases relative to the total value of imports
D when the volume of exports increases relative to the total volume of imports
Answer
The terms of trade measure the ratio of export prices to import prices. An improvement occurs when export prices rise relative to import prices (or when import prices fall relative to export prices). Option B describes a situation where export prices are unchanged and import prices fall, so the ratio of export prices to import prices increases, meaning the terms of trade improve. Options A, C, and D are incorrect because they refer to relative falls in export prices, or to values or volumes rather than prices.
B
Background Concept
The terms of trade (TOT) are defined as the ratio of a country's export prices to its import prices, usually expressed as an index:
TOT = (Index of export prices / Index of import prices) × 100
An improvement in the terms of trade means that export prices have risen relative to import prices. This can happen in three ways: export prices rise while import prices stay the same, export prices stay the same while import prices fall, or export prices rise by more than import prices. The key point is that the ratio moves in favour of exports. A deterioration means the opposite: import prices rise relative to export prices.
Understanding the Question
The question asks: "When is there an improvement in a country’s terms of trade?" The phrase "improvement" is a standard term meaning the country can buy more imports with a given amount of exports. The options are all phrased as comparisons. The candidate must identify which scenario causes the ratio of export prices to import prices to increase. Note that the question uses "price" in options A and B, and "value" and "volume" in C and D. This is a deliberate trap: the terms of trade are about prices, not values or volumes.
Approach
Start with the definition of terms of trade. Then evaluate each option by checking whether the described change raises the export-price/import-price ratio. Eliminate options that refer to values or volumes, as they are irrelevant. Then compare the two price-based options (A and B) to see which one yields an increase in the ratio.
Step-by-Step Reasoning
-
Definition recall: The terms of trade = (price of exports / price of imports) × 100. An improvement means this ratio increases.
-
Option A: "when the price of exports falls more than the price of imports" – If export prices fall and import prices fall less, the ratio falls (since numerator falls more than denominator). This is a deterioration, not an improvement. So A is incorrect.
-
Option B: "when there is no change in the price of exports but a fall in the price of imports" – Here export prices unchanged, import prices fall. The ratio exports/imports increases because the denominator is smaller. So the terms of trade improve. This matches the definition. B is correct.
-
Option C: "when the value of exports increases relative to the total value of imports" – The terms of trade are about prices, not values. Value is price × quantity. An increase in the value of exports could be due to higher prices or higher volumes. This option does not isolate price changes, so it is not a correct statement about the terms of trade. C is incorrect.
-
Option D: "when the volume of exports increases relative to the total volume of imports" – Again, volume is about quantities, not prices. This is irrelevant to the terms of trade. D is incorrect.
Therefore, only option B is correct.
Key Takeaways
- The terms of trade are a price ratio, not a value or volume ratio.
- An improvement means export prices rise relative to import prices, so the country can import more for the same export volume.
- When evaluating such questions, always return to the definition and apply it to each option.
Common Mistakes
- Confusing the terms of trade with the balance of trade (which is about values and volumes).
- Thinking that any increase in export value means an improvement in the terms of trade, ignoring that value can rise due to quantity increases.
- Misreading option A: a fall in export prices relative to import prices is a deterioration, not an improvement.
Things to Be Careful About
- Always check whether the option refers to prices, values, or volumes. The question explicitly tests this distinction.
- Remember that the "improvement" is defined in terms of the ratio, not just a single direction. Both an increase in export prices and a decrease in import prices cause improvement.
- For MCQs, after identifying the correct answer, quickly verify that the other options are indeed wrong to avoid careless errors.
What is likely to happen if there is a rise in the international value of a country’s currency?
Options
A a fall in the foreign currency price of its exports
B a fall in the volume of its exports
C a rise in the domestic currency price of its imports
D a rise in the domestic price level
Answer
A rise in the international value of a country’s currency is an appreciation. This makes the country’s exports more expensive in foreign currency, reducing their competitiveness. As a result, the volume of exports (quantity demanded) is likely to fall.
Option A is incorrect: the foreign currency price of exports rises, not falls.
Option C is incorrect: the domestic currency price of imports falls, not rises.
Option D is incorrect: cheaper imports and reduced net exports tend to lower the domestic price level, not raise it.
Therefore, the correct answer is B.
B
Background Concept
An exchange rate is the price of one currency in terms of another. When a country’s currency appreciates (rises in international value), each unit of domestic currency buys more foreign currency. This makes the country’s goods more expensive for foreign buyers and makes foreign goods cheaper for domestic buyers. The immediate effect on trade volumes depends on price elasticities, but in the basic model, a price rise reduces quantity demanded.
Understanding the Question
The question asks what is likely to happen following a rise in the international value of a currency. It presents four possible outcomes: a fall in the foreign currency price of exports, a fall in the volume of exports, a rise in the domestic currency price of imports, and a rise in the domestic price level. You need to identify which one is correct based on the standard theory of exchange rate changes.
Approach
First, recognise that a rise in international value is an appreciation. Then consider how appreciation affects each variable mentioned in the options. Remember the distinction between prices expressed in domestic currency and prices expressed in foreign currency. Use the law of demand to predict quantity changes.
Step-by-Step Reasoning
-
Option A: The foreign currency price of exports. When the currency appreciates, the same domestic price for an export good translates into a higher price in foreign currency. For example, if a good costs 100 units of domestic currency and the exchange rate moves from 1 unit of domestic = 2 units of foreign to 1 unit = 2.5 units of foreign, the foreign price rises from 200 to 250. So the foreign currency price rises, not falls. Therefore A is incorrect.
-
Option B: The volume of exports. Because the price in foreign currency has risen, foreign buyers will reduce the quantity demanded (law of demand). Unless demand is perfectly inelastic, export volume falls. This is the most direct and likely outcome. Therefore B is correct.
-
Option C: The domestic currency price of imports. With a stronger currency, each unit of domestic currency buys more foreign currency, so importing goods costs less in domestic currency. The domestic price of imports falls, not rises. Therefore C is incorrect.
-
Option D: The domestic price level. Appreciation has two effects that both put downward pressure on prices: (1) cheaper imports reduce the cost of imported inputs and final goods, lowering the general price level; (2) the fall in net exports reduces aggregate demand, also lowering the price level. Therefore the domestic price level is likely to fall or at least not rise. So D is incorrect.
Hence the only likely outcome is a fall in the volume of exports.
Key Takeaways
- Appreciation means a currency becomes more valuable relative to others.
- It makes exports more expensive in foreign currency and imports cheaper in domestic currency.
- Export volume falls; import volume rises (if elastic enough).
- Always convert prices carefully between domestic and foreign currency.
Common Mistakes
- Thinking appreciation makes imports more expensive (it makes them cheaper in domestic currency).
- Confusing the price of exports in domestic currency (unchanged) with the price in foreign currency (rises).
- Believing that appreciation automatically raises inflation (it usually reduces it).
Things to Be Careful About
- The phrase “rise in the international value” means appreciation, not depreciation.
- The question asks what is “likely” to happen, so the basic prediction is sufficient; extreme elasticities or long-run complications (like the J-curve) are not required for this level.
- Ensure you understand the direction of change for each variable before selecting the answer.
Your score so far
Answer a question to start scoring
Your marks add up here as you work through the paper.