Economics 9708/12 — October/November 2024
Cambridge AS Level · AS Level Multiple Choice · answer key with instant marking and worked solutions
Topics Unemployment · Exchange Rates · Balance of Payments · Production Possibility Curves · Factors of Production · Economic Methodology · +16 more
Tap an option under each question to check it — your score builds as you go.
The production possibility curve for a country is shown.
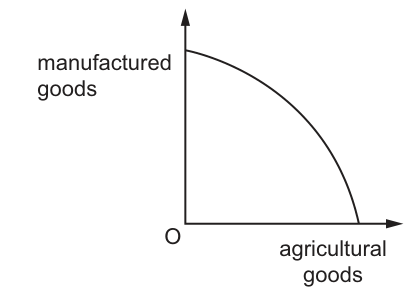
What can be determined from the diagram?
Options
A the consumers’ preferred combination of output
B the level of economic growth
C the opportunity cost of manufactured goods in terms of agricultural products
D the preference for present consumption rather than future consumption
Answer
The production possibility curve (PPC) illustrates the trade-off between two goods. Its slope shows the opportunity cost of the good on the vertical axis in terms of the good on the horizontal axis. With manufactured goods on the vertical axis and agricultural goods on the horizontal axis, the diagram reveals the opportunity cost of manufactured goods in terms of agricultural products.
C
C
Background Concept
The production possibility curve (PPC) is a fundamental economic model that illustrates scarcity, choice, and opportunity cost. It shows the maximum possible output combinations of two goods that an economy can produce with given resources and technology, assuming full and efficient employment. The curve is typically concave to the origin, reflecting increasing opportunity cost: as production of one good increases, increasingly larger amounts of the other good must be sacrificed because resources are not perfectly adaptable. The slope of the PPC at any point measures the marginal opportunity cost of the good on the vertical axis in terms of the good on the horizontal axis.
Understanding the Question
The question presents a PPC diagram with manufactured goods on the vertical axis and agricultural goods on the horizontal axis. The curve is concave to the origin. It asks what can be determined from this diagram. This tests whether the student understands the specific information conveyed by a PPC and can distinguish it from other economic concepts such as consumer preferences, economic growth, or intertemporal choice.
Approach
Evaluate each option against the definition and purpose of a PPC:
- Eliminate options describing concepts shown by different models (e.g., consumer preferences shown by indifference curves).
- Eliminate options describing dynamic changes rather than static relationships (e.g., economic growth shown by a shift in the PPC).
- Identify the option that correctly describes the trade-off shown by the curve's slope.
Step-by-Step Reasoning
- Option A: the consumers' preferred combination of output. This is incorrect. A PPC shows production possibilities, not consumer preferences. Consumer preferences would be shown by a community indifference curve. The PPC contains no information about what consumers want to consume.
- Option B: the level of economic growth. This is incorrect. The diagram shows a single static PPC representing current productive capacity. Economic growth is represented by an outward shift of the PPC, not by the position of the curve itself.
- Option C: the opportunity cost of manufactured goods in terms of agricultural products. This is correct. The slope of the PPC shows the opportunity cost. Because manufactured goods are on the vertical axis and agricultural goods on the horizontal axis, the curve shows how many agricultural goods must be given up to produce more manufactured goods. This trade-off is the definition of opportunity cost.
- Option D: the preference for present consumption rather than future consumption. This is incorrect. Preferences between present and future consumption relate to intertemporal choice and are not depicted on a standard PPC for current goods.
Therefore, the diagram determines the opportunity cost of manufactured goods in terms of agricultural products.
Key Takeaways
- A PPC shows the trade-offs and opportunity costs involved in producing different combinations of two goods.
- The slope of the PPC represents opportunity cost.
- A PPC does not show consumer preferences, economic growth (only current capacity), or time preferences.
- The concave shape indicates increasing opportunity cost.
Common Mistakes
- Confusing the PPC with an indifference curve: students sometimes think the PPC shows what people want to consume, but it shows what can be produced.
- Thinking the PPC shows economic growth: growth is a shift in the curve, not the curve itself.
- Misidentifying the axes: always check which good is on which axis to correctly state the opportunity cost.
Things to Be Careful About
- Ensure you read the axis labels carefully. The opportunity cost is of the good on the vertical axis in terms of the good on the horizontal axis.
- The PPC assumes full and efficient use of resources; points inside the curve represent inefficiency.
- The question asks what can be determined from the diagram, not what the diagram illustrates in general. Be precise about what the specific diagram shows.
In a clothing business, after specialisation, real output per worker increased in the first six months but then output per worker began to fall.
What might be the most likely reason for the reduction in productivity?
Options
A An increase in output per worker in the long run depends on an increase in pay.
B An increase in output per worker requires more capital.
C Specialisation means workers lose skills.
D Workers get bored if they are repeating the same work.
Answer
Specialisation initially raises productivity as workers become more efficient at a narrow task. However, repeated performance of the same task can lead to boredom and reduced motivation, which lowers effort and output per worker. This is the most likely reason for the decline.
Answer
D
D
Background Concept
Division of labour involves breaking down a production process into separate tasks, with each worker specialising in one task. This typically increases productivity because workers become more skilled and faster at their specific task, and time is saved from switching between tasks. However, there are also disadvantages: highly repetitive work can lead to monotony, boredom, and reduced job satisfaction, which may eventually lower productivity as workers become less motivated and may produce lower quality output.
Understanding the Question
The question describes a clothing business where after introducing specialisation, output per worker initially increased but then began to fall. The task is to identify the most likely reason for this decline from the given options. The key is to recognise that while specialisation has initial benefits, it can have negative effects in the longer term, particularly due to worker boredom.
Approach
Evaluate each option in light of the known advantages and disadvantages of division of labour. The correct option should directly explain why productivity would fall after an initial rise, rather than why it might not rise further or why it would continue to rise.
Step-by-Step Reasoning
- Option D is correct: Specialisation involves repeating the same task many times. This can cause boredom, reduce motivation, and lead to lower effort, mistakes, and absenteeism, all of which reduce output per worker. This is a well-documented drawback of division of labour, especially in mass production settings.
- Option A suggests that productivity increases depend on pay increases. While pay can affect motivation, there is no automatic link that an increase in pay is necessary for productivity to rise. Moreover, the question is about a decline after an initial increase, not about the conditions for increase. So A is not the most likely reason.
- Option B states that an increase in output per worker requires more capital. This is not necessarily true; productivity can also increase through better organisation, training, or specialisation itself. Furthermore, adding capital would generally increase output, not reduce it, so it does not explain a decline.
- Option C claims that specialisation means workers lose skills. In fact, specialisation typically improves skills in the specific task, though it may cause loss of skills in other tasks. However, the loss of other skills does not directly cause a reduction in productivity in the specialised task; in fact, the worker's skill in that task is higher, so productivity would be expected to rise, not fall. Therefore, C is not the most likely reason.
Key Takeaways
- Specialisation has clear benefits but also drawbacks, including the risk of boredom and declining productivity over time.
- When answering multiple-choice questions, consider the most direct and plausible economic explanation for the given scenario.
- Understanding both the advantages and disadvantages of division of labour is important for analysing real-world production decisions.
Common Mistakes
- Choosing C because of confusion between losing overall skills and losing productivity in the specific task. Losing skills in other tasks does not reduce output per worker in the specialised task; it may even increase it.
- Choosing B because of a misunderstanding that more capital is always required for productivity gains. The question is about a decline, not a requirement for increase.
- Choosing A because of a belief that pay is the main determinant of productivity, ignoring the specific effect of repetitive work.
Things to Be Careful About
- Read the question carefully: it asks for the most likely reason for the reduction in productivity. The answer must explain why productivity falls, not why it might not increase further.
- Distinguish between the initial benefits of specialisation (which are well-known) and the longer-term drawbacks (which are less obvious but equally important).
- In multiple-choice questions, eliminate clearly incorrect options by applying economic reasoning, and select the one that best fits the scenario based on established theory.
A wine producer and bottler wanted to expand its production significantly. To finance the expansion it offered investors discounts on restaurant meals if they bought 2000 shares in the company.
Which factors of production are most likely to be involved in this expansion?
Options
A labour, land, capital and enterprise
B labour, land and capital only
C enterprise and land only
D enterprise only
Answer
The expansion of a wine producer and bottler involves all four factors of production:
- Land: the vineyards and land used for production.
- Labour: the workers involved in growing grapes, bottling, and distribution.
- Capital: the machinery, bottling equipment, and buildings.
- Enterprise: the entrepreneur who organises the expansion, takes risks, and raises finance by offering discounts.
Therefore, the correct option is A.
A
Background Concept
Factors of production are the resources used to produce goods and services. They are categorised into four types:
- Land: all natural resources used in production (e.g., soil, water, minerals).
- Labour: the human effort, both physical and mental, used in production.
- Capital: man-made goods used to produce other goods (e.g., machinery, tools, buildings).
- Enterprise: the role of the entrepreneur who organises the other three factors, takes risks, and makes business decisions.
Understanding the Question
The question describes a wine producer and bottler that wants to expand production. To finance the expansion, it offers discounts on restaurant meals to investors who buy shares. The question asks which factors of production are most likely involved in this expansion. The key is to recognise that any expansion of production will require additional resources from all four categories.
Approach
Think about what is needed to expand wine production:
- More land for vineyards or more efficient use of existing land.
- More labour to tend vines, harvest, bottle, and distribute.
- More capital such as bottling machines, storage tanks, and buildings.
- Enterprise: the entrepreneur must plan, organise, and take the risk of expansion; the method of financing (offering discounts) is an entrepreneurial decision.
Since all four are needed, the correct answer is the one that includes all four. Option A includes all four; B excludes enterprise; C excludes labour and capital; D excludes land, labour, and capital. Therefore, A is correct.
Step-by-Step Reasoning
-
Identify each factor and its role in the scenario:
- Land: The wine producer uses vineyards (land) to grow grapes. Expansion would likely require more land or more intensive use of existing land.
- Labour: Workers are needed to plant, tend, harvest grapes, and for bottling and distribution. Expansion increases the need for labour.
- Capital: The bottling plant, machinery, barrels, and buildings are capital goods. Expansion requires more capital equipment.
- Enterprise: The entrepreneur initiates the expansion, bears the risk, and devises the financing scheme (offering discounts). This is the classic role of enterprise.
-
Since all four factors are involved, the correct answer must include all four. Only option A does so.
-
Option B (labour, land, capital only) ignores enterprise, which is essential because the expansion decision and financing are entrepreneurial activities. Without enterprise, the other factors would not be combined.
-
Option C (enterprise and land only) ignores labour and capital, which are clearly needed for wine production.
-
Option D (enterprise only) ignores land, labour, and capital.
Therefore, the correct answer is A.
Key Takeaways
- The four factors of production are land, labour, capital, and enterprise.
- In any production activity, all four factors are typically involved, though the proportions vary.
- Enterprise is the factor that organises and coordinates the other three and takes the risk.
Common Mistakes
- Choosing B (excluding enterprise) because students may think enterprise is not a factor or that the entrepreneur is not directly involved. However, the decision to expand and the method of financing are entrepreneurial roles.
- Choosing D (only enterprise) because the question mentions shares and financing, which might seem purely entrepreneurial. But production cannot occur without the other factors.
- Overlooking the fact that the wine producer is already using all factors and expansion will require more of each.
Things to Be Careful About
- Read the question carefully: it asks for factors "most likely to be involved in this expansion." The expansion is of production, not just the financing. The financing is part of the entrepreneurial role, but production itself requires all factors.
- Remember that enterprise is not just 'risk-taking' but also includes organising and decision-making. The offer of discounts is an example of entrepreneurial innovation.
- Do not confuse capital with finance; capital in economics refers to physical capital goods, not money. The money raised is used to buy capital, but the capital goods themselves are the factor.
- In multiple-choice questions, identify the option that is most comprehensive and logically consistent with the scenario.
Which statement is positive?
Options
A All taxes should be proportional to income.
B A progressive tax is a fair tax.
C Greater equality of income is desirable.
D Income inequality is decreasing.
Working
A positive statement is objective and can be tested against facts. A normative statement expresses a value judgement and cannot be tested.
Option A says "should be" – normative.
Option B says "is a fair tax" – involves a value judgement, so normative.
Option C says "is desirable" – normative.
Option D says "is decreasing" – states a fact that can be verified (whether income inequality is actually decreasing), thus positive.
Answer
D
D
Background Concept
Economics distinguishes between positive and normative statements. A positive statement is objective, fact-based, and can be tested against evidence – it describes 'what is'. A normative statement expresses a value judgement, opinion, or prescription – it states 'what ought to be' or what is 'good'/'bad', 'fair'/'unfair'. The key is that normative statements cannot be proven true or false by data alone because they involve ethical or moral values.
Understanding the Question
The question presents four statements and asks which one is positive, i.e., which can be verified as true or false without reference to value judgements. The candidate must apply the definition to each option and identify the only statement that makes a factual claim.
Approach
For each option, ask: can this statement be tested using real-world data? If it uses words like 'should', 'fair', 'desirable', or any other evaluative language, it is normative. Option D describes a change in income inequality, which is measurable (e.g., using Gini coefficients) – it is a factual claim that can be checked.
Step-by-Step Reasoning
- Option A: "All taxes should be proportional to income." The word 'should' indicates a recommendation – this is a value judgement about how taxes ought to be structured. Normative.
- Option B: "A progressive tax is a fair tax." 'Fair' is a subjective, ethical judgement – what one person considers fair another may not. Cannot be objectively tested. Normative.
- Option C: "Greater equality of income is desirable." 'Desirable' again expresses a preference or value judgement – it says what is good. Normative.
- Option D: "Income inequality is decreasing." This is a statement about an observable trend. We can collect data on income distribution (e.g., Gini coefficient over time) and determine whether inequality is indeed falling. Thus it is a positive statement.
Therefore, only D is positive.
Key Takeaways
- Positive statements are about facts; normative statements are about opinions.
- Common normative words: should, ought, fair, unfair, desirable, good, bad, better, worse, just, unjust.
- Mastering this distinction is fundamental to understanding economics as a social science that tries to separate analysis from value judgements.
Common Mistakes
- Students often confuse 'positive' with 'optimistic' – but in economics, positive means factual, not favourable.
- Some might argue that option D requires interpretation (e.g., what measure of inequality?) – but that does not make it normative; the claim is still testable.
- Assuming that any statement about a controversial topic (like inequality) must be normative – but whether inequality is decreasing is a factual question.
Things to Be Careful About
- Look out for verbs like 'should', 'ought', 'must', and adjectives like 'fair', 'desirable', 'just' – they signal normative statements.
- Even if a statement seems obvious, if it can be proven wrong by data, it is positive.
- The same statement can be recast as normative or positive: e.g., "higher taxes reduce inequality" is positive; "higher taxes should be used to reduce inequality" is normative.
The diagram shows the change in a country’s production possibility curve from PQ to PR.
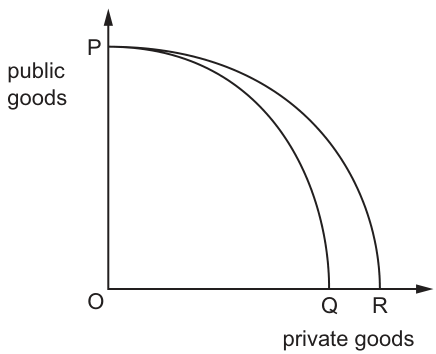
What increases as a result of the change from PQ to PR?
Options
A the price of private goods
B the price of public goods
C the opportunity cost of private goods
D the opportunity cost of public goods
Reasoning
The diagram shows an outward shift of the production possibility curve (PPC) from PQ to PR, with the vertical intercept (maximum possible output of public goods) unchanged at P, and the horizontal intercept (maximum possible output of private goods) increasing from Q to R.
Opportunity cost of a good is the amount of the other good that must be sacrificed to produce one more unit of it. The opportunity cost of public goods is equal to the maximum output of private goods divided by the maximum output of public goods, as producing the full maximum of public goods requires giving up the full maximum of private goods. After the shift, this ratio rises from Q/P to R/P, so the opportunity cost of public goods increases.
Options A and B refer to prices, which are not shown or implied by a PPC diagram, which only illustrates production capacity and trade-offs. The opportunity cost of private goods falls, as more private goods can now be produced for the same sacrifice of public goods.
Answer
D
D
Background Concept
A production possibility curve (PPC) is a graphical economic model that shows the maximum possible combinations of two goods an economy can produce when all resources are fully and efficiently employed, given the current state of technology. The curve is typically bowed outward (concave to the origin) because of increasing opportunity cost: as more of one good is produced, resources less suited to its production are reallocated, so the opportunity cost of producing additional units of that good rises.
Opportunity cost is the value of the next best alternative forgone when a choice is made. On a PPC, the opportunity cost of producing one more unit of the good on the horizontal axis (in this case, private goods) is the amount of the good on the vertical axis (public goods) that must be given up, and vice versa. For the good on the vertical axis, the opportunity cost per unit is calculated as the maximum possible output of the horizontal-axis good divided by the maximum possible output of the vertical-axis good, because producing the full maximum of the vertical-axis good requires sacrificing the full maximum of the horizontal-axis good.
An outward shift of the PPC represents economic growth: an increase in the economy’s productive capacity, caused by factors such as an increase in the quantity or quality of resources, or technological progress. If the shift occurs only along one axis, it means productive capacity has increased only for that good, while the maximum possible output of the other good remains unchanged.
Understanding the Question
The question provides a PPC diagram where the curve shifts from PQ to PR. The vertical axis measures public goods, the horizontal axis measures private goods. The vertical intercept (maximum possible output of public goods) stays at P, while the horizontal intercept (maximum possible output of private goods) rises from Q to R. The question asks which of the four listed variables increases as a result of this shift.
This is a multiple-choice question requiring application of PPC and opportunity cost theory to the given diagram. The key task is to recognise that the PPC illustrates production trade-offs, not prices, and to correctly calculate how the shift changes the opportunity cost of each good.
Approach
First, eliminate the two options that refer to prices (A and B). A PPC is a model of real production capacity and trade-offs, not price determination. There is no information in the diagram or standard PPC theory to suggest that the price of either good will rise as a result of the shift, so these options can be ruled out immediately. This leaves options C and D, which refer to the opportunity cost of private goods and public goods respectively.
Next, apply the definition of opportunity cost on a PPC: the opportunity cost of a good is the amount of the other good that must be sacrificed to produce it. For public goods (the vertical-axis good), the opportunity cost per unit is equal to the maximum output of private goods divided by the maximum output of public goods, because producing the full maximum of public goods requires giving up the full maximum of private goods.
Compare the opportunity cost of public goods before and after the shift: before the shift, it is Q/P (maximum private goods / maximum public goods); after the shift, it is R/P. Since R is larger than Q, R/P is larger than Q/P, so the opportunity cost of public goods increases. For private goods, the opportunity cost per unit is P/R after the shift, compared to P/Q before, which is a fall, so option C is incorrect.
Step-by-Step Reasoning
- Interpret the PPC shift: The original curve PQ has intercepts at P (maximum public goods) on the vertical axis and Q (maximum private goods) on the horizontal axis. The new curve PR has the same vertical intercept P, but a higher horizontal intercept R, meaning the economy can now produce more private goods than before, but the maximum possible output of public goods is unchanged.
- Eliminate price-related options: A PPC is a real-model of production, not a market model of price determination. There is no mechanism in the model linking an increase in productive capacity for private goods to a rise in the price of either private or public goods, so options A and B are incorrect.
- Calculate the opportunity cost of public goods: To produce the maximum possible quantity of public goods (P units), the economy must give up the maximum possible quantity of private goods. Before the shift, this maximum private goods quantity is Q, so the opportunity cost of 1 unit of public goods is Q/P units of private goods. After the shift, the maximum private goods quantity is R, so the opportunity cost of 1 unit of public goods is R/P units of private goods. Since R > Q, R/P > Q/P, so the opportunity cost of public goods has increased.
- Check the opportunity cost of private goods: The opportunity cost of 1 unit of private goods is the amount of public goods sacrificed. Before the shift, producing the maximum Q private goods requires giving up P public goods, so the opportunity cost per unit is P/Q. After the shift, producing the maximum R private goods requires giving up P public goods, so the opportunity cost per unit is P/R. Since R > Q, P/R < P/Q, so the opportunity cost of private goods has fallen, meaning option C is incorrect.
- Confirm the correct option: Only option D (the opportunity cost of public goods) increases as a result of the shift.
Key Takeaways
- A PPC illustrates the trade-offs between producing two goods, and its intercepts show the maximum possible output of each good when all resources are devoted to that good.
- An outward shift of the PPC represents an increase in productive capacity (economic growth). If the shift is only along one axis, capacity has increased only for that good.
- The opportunity cost of the good on the vertical axis is equal to (maximum output of horizontal-axis good) / (maximum output of vertical-axis good), and vice versa. A rise in the maximum output of the horizontal-axis good, with the vertical-axis maximum unchanged, will raise the opportunity cost of the vertical-axis good and lower the opportunity cost of the horizontal-axis good.
- PPCs do not show prices, so any option referring to price changes can be eliminated immediately for PPC questions unless there is explicit information linking the shift to price changes.
Common Mistakes
- Confusing the PPC with a price diagram: Students often assume that a shift in the PPC will affect prices, but the PPC is a real-model of production, not a market model of price determination. Options A and B are distractors for this reason.
- Mixing up which opportunity cost is which: Students may incorrectly calculate the opportunity cost of public goods as the ratio of public to private goods, rather than private to public, leading them to choose option C instead of D.
- Forgetting that the intercepts represent maximum output when all resources are devoted to one good: The opportunity cost calculation relies on using the maximum outputs, not intermediate points on the curve.
Things to Be Careful About
- Always check which axis each good is on: the opportunity cost of the vertical-axis good is calculated as (horizontal intercept)/(vertical intercept), and vice versa. Mixing up the axes will lead to the wrong conclusion.
- Remember that the PPC shows real output and trade-offs, not nominal variables like prices. Any option referring to prices is automatically incorrect for a PPC question unless there is explicit information linking the shift to price changes, which there is not here.
- Confirm the direction of the shift: in this case, only the horizontal intercept increases, so only the opportunity cost of the vertical-axis good (public goods) rises.
The graph shows the demand and supply curves for an industry.
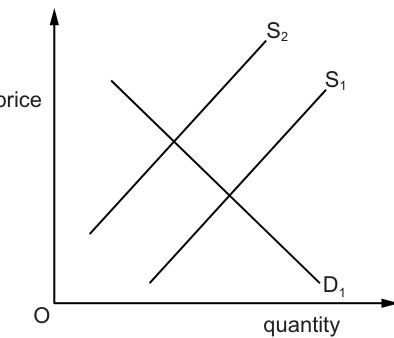
What would cause a shift in the supply curve from S1 to S2?
Options
A an increase in the number of firms in the industry
B an increase in the number of workers employed
C an increase in the productivity of the workforce
D an increase in the wage rates paid to workers
The diagram shows the supply curve shifting leftwards from S1 to S2. This represents a decrease in supply, which occurs when production costs increase or when firms become less willing or able to supply at each price level.
- An increase in the number of firms (A) would increase supply, shifting the curve right.
- An increase in the number of workers (B) would increase supply, shifting the curve right.
- An increase in workforce productivity (C) would lower unit costs and increase supply, shifting the curve right.
- An increase in wage rates (D) raises firms' costs of production, causing a decrease in supply and a leftward shift from S1 to S2.
Answer
D
D
Background Concept
The supply curve shows the relationship between the price of a good and the quantity that producers are willing and able to supply, ceteris paribus. A movement along the supply curve is caused by a change in the price of the good itself. By contrast, a shift of the entire supply curve (an increase or decrease in supply) is caused by changes in non-price determinants of supply. These include input prices (such as wages), productivity, the number of firms in the market, technology, and government taxes or subsidies. An increase in supply shifts the curve to the right (or down), meaning more is supplied at each price. A decrease in supply shifts the curve to the left (or up), meaning less is supplied at each price.
Understanding the Question
The question presents a diagram where the supply curve shifts from S1 to S2. Based on the diagram description, S2 is to the left of S1, indicating a decrease in supply. The question asks which of the four options would cause this specific leftward shift. This requires applying knowledge of the determinants of supply and their directional effect on the curve.
Approach
To answer this, evaluate each option against the economic model of supply:
- Confirm the direction of the shift shown (leftward = decrease in supply).
- Recall that a decrease in supply is caused by factors that raise production costs or reduce firms' willingness or ability to produce.
- Test each option: would it increase supply (rightward shift) or decrease supply (leftward shift)?
- Select the option that matches the leftward shift.
Step-by-Step Reasoning
The diagram shows S1 shifting to S2, which is a leftward shift. In supply analysis, a leftward shift represents a decrease in supply—at any given price, firms are now willing and able to supply less output than before.
- Option A: An increase in the number of firms in the industry means more producers are supplying the good. This increases total market supply, shifting the curve to the right, not left. Therefore, A is incorrect.
- Option B: An increase in the number of workers employed represents an increase in the quantity of the labour input. With more labour, firms can produce more output, increasing supply and shifting the curve right. Therefore, B is incorrect.
- Option C: An increase in the productivity of the workforce means workers produce more output per unit of input. This lowers the average cost of production and increases supply, shifting the curve right. Therefore, C is incorrect.
- Option D: An increase in wage rates paid to workers raises the cost of production for firms (since labour is a factor of production). Higher costs reduce profitability at each output level, causing firms to supply less. This decreases supply and shifts the curve leftward from S1 to S2. Therefore, D is correct.
Key Takeaways
- A leftward shift of the supply curve (S1 to S2) indicates a decrease in supply.
- Decreases in supply are caused by increases in production costs or adverse changes in non-price determinants.
- Wage rates are a key input cost; higher wages shift supply left.
- Increases in the number of firms, employment, or productivity all shift supply right (increase supply).
Common Mistakes
- Confusing a shift of the curve with a movement along the curve. The question asks about a shift, not a response to a price change.
- Assuming that more workers always helps without considering that the question asks about a decrease in supply. More workers would increase supply.
- Confusing productivity with wage rates. Higher productivity reduces costs and increases supply, whereas higher wages increase costs and decrease supply.
- Misreading the diagram direction. S2 is to the left of S1, confirming a decrease in supply, not an increase.
Things to Be Careful About
- Always check the direction of the shift in the diagram. Leftward means decrease; rightward means increase.
- Distinguish between a change in the quantity supplied (movement along the curve caused by price change) and a change in supply (shift caused by non-price factors).
- Remember that input prices are inverse to supply: higher input prices shift supply left; lower input prices shift supply right.
- Ensure you select the option that causes a decrease in supply, as the diagram clearly shows S2 to the left of S1.
A firm produces a good using a very labour-intensive process. There is an increase in the price of the good.
Under which conditions will the supply of the firm’s good be most price elastic?
Options
| nature of the labour employed by the firm | level of unemployment in the economy | |
|---|---|---|
| A | skilled | high |
| B | skilled | low |
| C | unskilled | high |
| D | unskilled | low |
Reasoning
Price elasticity of supply (PES) measures the responsiveness of quantity supplied to a change in price. Supply is more price elastic when firms can increase output quickly and at low cost.
- Unskilled labour is easier and faster to hire than skilled labour because unskilled workers require less training. This makes supply more elastic when labour is unskilled.
- High unemployment implies a larger pool of available workers, allowing the firm to expand its workforce more rapidly in response to a price rise. This also increases elasticity.
Therefore, the combination of unskilled labour and high unemployment (option C) gives the most price-elastic supply.
Answer
C
C
Background Concept
Price elasticity of supply (PES) measures the responsiveness of the quantity supplied of a good to a change in its price. It is calculated as the percentage change in quantity supplied divided by the percentage change in price. Supply is said to be elastic when PES > 1 (proportionate change in quantity supplied is greater than the proportionate change in price) and inelastic when PES < 1.
Several factors influence PES, the most important being:
- Availability of spare capacity: If a firm has unused resources, it can increase output quickly.
- Ease of acquiring inputs: If the necessary factors of production (labour, raw materials, capital) can be obtained swiftly and at low cost, supply is more elastic.
- Time period: In the short run, supply is often inelastic because it takes time to adjust production; in the long run, supply becomes more elastic.
- Storage possibilities: Goods that can be stored easily have more elastic supply.
- Complexity of production: Simple, labour-intensive production processes can be scaled up more easily than complex, capital-intensive ones.
This question focuses on two specific determinants: the skill level of labour (which affects how easily the firm can hire suitable workers) and the level of unemployment (which affects the availability of workers in the economy).
Understanding the Question
The question describes a firm using a very labour-intensive production process. This means that the firm’s ability to increase output in response to a price rise depends heavily on its ability to hire additional workers. We are asked: under which combination of (i) the nature of labour employed (skilled vs unskilled) and (ii) the level of unemployment in the economy (high vs low) will the firm’s supply be most price elastic – i.e., the quantity supplied will respond most strongly to a given price increase.
Approach
Since the key factor is the ease and speed with which the firm can hire more labour, we can evaluate each of the four options by considering two effects:
- Skill level: Unskilled labour is much easier to find and hire quickly. Skilled labour is scarcer, requires more time to recruit, and may need training. Therefore, unskilled labour contributes to higher PES.
- Unemployment level: High unemployment means there are many workers seeking jobs. The firm can expand its workforce rapidly without having to raise wages much. Low unemployment means labour is scarce, making it harder and more costly to hire quickly. Thus, high unemployment contributes to higher PES.
To achieve the most elastic supply, we need the combination where both factors favour elasticity: unskilled labour AND high unemployment.
Step-by-Step Reasoning
-
Option A: Skilled labour + high unemployment. Although unemployment is high, skilled labour is still relatively scarce; skilled workers may not be immediately available or may require specific qualifications. The firm cannot expand output as quickly as it could with unskilled workers. Therefore supply is less elastic.
-
Option B: Skilled labour + low unemployment. Both factors work against elasticity. Skilled workers are hard to find, and low unemployment means there are even fewer candidates. Supply is the least elastic of the four options.
-
Option C: Unskilled labour + high unemployment. Both factors strongly favour elasticity. Unskilled workers are plentiful and can be hired with minimal delay; high unemployment means a large pool of applicants, so the firm can quickly increase its workforce. This is the combination that gives the most elastic supply.
-
Option D: Unskilled labour + low unemployment. Unskilled labour is easier to hire, but low unemployment means fewer people are available. The firm may still be able to attract workers but would likely have to offer higher wages to lure them from other jobs, which adds cost and time. Supply is quite elastic, but not as elastic as in option C.
Thus, option C is the correct answer.
Key Takeaways
- Price elasticity of supply is not just about the production process itself; it also depends on the external availability of inputs. Labour market conditions (unemployment, skill availability) are important factors.
- In a labour-intensive firm, the ease of hiring labour directly affects how quickly output can be increased.
- The most elastic supply occurs when both input availability and ease of acquisition are maximised.
Common Mistakes
- Assuming that skilled labour always leads to higher productivity but forgetting that it is less readily available, which reduces the speed of response. The question is about responsiveness to price, not about productivity per worker.
- Ignoring the unemployment condition altogether and only focusing on skill level. Both factors must be considered together.
- Confusing price elasticity of supply with price elasticity of demand. The question is about the firm’s ability to increase production, not about consumer response.
Things to Be Careful About
- Read the question carefully: it asks for the conditions that make supply most price elastic, not just whether a single factor helps.
- Recognise that the term “very labour-intensive” is a key clue: labour is the critical input, so the ability to hire labour is the main determinant.
- In economics, “skilled” labour implies a more specialised and less plentiful resource, which tends to reduce the speed of adjustment compared to unskilled labour.
- High unemployment generally means a slack labour market, making it easier for firms to hire without significant wage increases, which keeps marginal costs down when expanding output.
Always think about the marginal cost of expanding production: if the firm can hire workers at the going wage without pushing up wages, the marginal cost of extra output stays relatively constant, making supply more elastic.
What is most likely to cause the demand curve of an inferior good to shift to the right?
Options
A a rise in consumers’ incomes
B a rise in income tax
C a rise in sales tax
D a rise in the price of a complement
Reasoning
An inferior good has negative income elasticity: demand falls when income rises. To increase demand (rightward shift), real income must fall. A rise in income tax reduces disposable income, so demand for the inferior good increases. The other options either reduce demand or cause a movement along the curve.
Answer
B
B
Background Concept
Inferior goods are goods for which demand decreases as consumer income increases, and vice versa. This is because consumers switch to superior substitutes when they can afford them. The income elasticity of demand (YED) for an inferior good is negative. A change in income causes a shift of the demand curve: an increase in income shifts demand left (decrease), a decrease in income shifts demand right (increase).
Understanding the Question
The question asks which event is most likely to cause a rightward shift of the demand curve for an inferior good. A rightward shift means an increase in quantity demanded at every price, caused by a change in a non-price determinant of demand. For an inferior good, the key determinant is income: a fall in income increases demand. The options test understanding of how different changes affect demand.
Approach
Evaluate each option in terms of its effect on the demand for an inferior good. Consider whether the change affects income (real income) or other determinants like prices of related goods or the good's own price. Only a change that reduces real income will shift demand right.
Step-by-Step Reasoning
- Option A: A rise in consumers' incomes. For an inferior good, higher income reduces demand (leftward shift). So not correct.
- Option B: A rise in income tax. This reduces disposable income, effectively lowering real income. Lower income increases demand for inferior goods (rightward shift). This is correct.
- Option C: A rise in sales tax. This increases the price of the good itself, causing a movement along the demand curve (contraction in quantity demanded), not a shift of the curve. So not correct.
- Option D: A rise in the price of a complement. Complements are goods consumed together. If the price of a complement rises, demand for the good falls (leftward shift) because the combined cost of consumption increases. So not correct.
Thus, only option B causes a rightward shift.
Key Takeaways
- Inferior goods have negative income elasticity: demand moves opposite to income.
- A change in income shifts the demand curve; a change in the good's own price causes a movement along the curve.
- Income tax affects disposable income, so it shifts demand for normal and inferior goods in opposite directions.
Common Mistakes
- Confusing inferior goods with normal goods: thinking that a rise in income increases demand for all goods.
- Thinking that a sales tax shifts the demand curve: it actually shifts the supply curve or causes a movement along demand.
- Ignoring the effect of income tax on real income.
Things to Be Careful About
- Distinguish between a shift of the demand curve (change in non-price determinant) and a movement along it (change in own price).
- Remember that for inferior goods, the relationship with income is inverse.
- Consider the indirect effect of taxes: income tax reduces disposable income, sales tax affects the good's price.
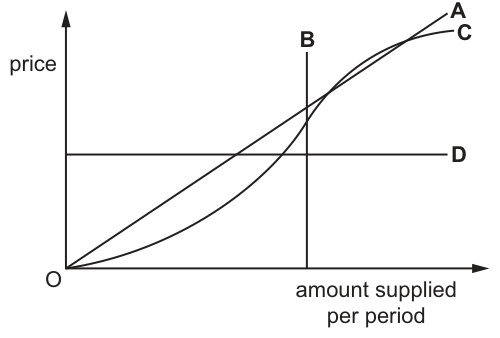
The diagram shows four supply curves.
Which curve has a price elasticity of supply of 1 for all levels of quantity supplied?
Options
A curve A
B curve B
C curve C
D curve D
Working
Price elasticity of supply (PES) measures the responsiveness of quantity supplied to a change in price, calculated as:
PES = (% change in quantity supplied) / (% change in price)
A PES of 1 is unit price elasticity, meaning quantity supplied changes by exactly the same percentage as price. For a straight-line supply curve that passes through the origin, this ratio of percentage changes is constant and equal to 1 at every point along the curve.
Curve A is a straight line passing through the origin, so it has a PES of 1 for all quantities supplied. Curve B becomes steeper as quantity rises, so PES falls below 1 (inelastic supply). Curve C becomes flatter, so PES rises above 1 (elastic supply). Curve D is horizontal, meaning quantity supplied is infinitely responsive to price, so PES is perfectly elastic (infinite).
Answer
A
A
Background Concept
Price elasticity of supply (PES) measures how responsive the quantity of a good firms are willing to supply is to a change in the good's price. It is calculated as the percentage change in quantity supplied divided by the percentage change in price, and is always positive because the supply curve slopes upwards (higher prices incentivise higher output). A PES of 1 is unit price elasticity: quantity supplied changes by exactly the same percentage as price. PES greater than 1 is elastic supply (quantity is more responsive to price changes than the price change itself), while PES less than 1 is inelastic supply (quantity is less responsive). A horizontal supply curve has a PES of infinity (perfectly elastic supply, as any price change leads to an infinite change in quantity supplied), while a vertical supply curve has a PES of 0 (perfectly inelastic supply, as quantity does not respond to price changes).
The shape of a supply curve directly determines its PES value. For a straight-line (linear) supply curve passing through the origin, the slope is constant, so the ratio of percentage changes in quantity and price is always 1, giving a constant unit PES at every point. If the supply curve is convex to the price axis (getting steeper as quantity increases, like Curve B), PES falls as quantity rises (becomes more inelastic). If the supply curve is concave to the price axis (getting flatter as quantity increases, like Curve C), PES rises as quantity rises (becomes more elastic).
Understanding the Question
This multiple-choice question asks you to identify which of the four labelled supply curves has a price elasticity of supply equal to 1 at every level of quantity supplied. The diagram shows four supply curves on a standard price (vertical axis) and quantity supplied per period (horizontal axis) graph: Curve A is a straight line through the origin, Curve B is a convex curve starting at the origin, Curve C is a concave curve starting at the origin, and Curve D is a horizontal line. You need to apply your knowledge of the relationship between supply curve shape and PES to select the correct option.
Approach
To answer this question, first recall the definition and formula for PES, and the link between supply curve shape and PES values. Then test each curve against the requirement of having a constant PES of 1:
- First identify the unique property of a supply curve that gives a constant PES of 1 at all output levels.
- Match this property to the four curves in the diagram.
- Eliminate incorrect options by identifying their PES characteristics.
Step-by-Step Reasoning
- Start with the PES formula: PES = (% change in quantity supplied) / (% change in price). For PES to equal 1 at all quantities, the percentage change in quantity supplied must always equal the percentage change in price, regardless of the current level of output.
- A straight-line supply curve that passes through the origin has this property. The slope of the curve (change in price / change in quantity) is constant, so the inverse ratio (change in quantity / change in price) is also constant. When the line passes through the origin, the percentage changes in price and quantity are equal at every point, so PES = 1 everywhere along the curve.
- Now evaluate each curve:
- Curve A is a straight line passing through the origin, so it meets the requirement of having PES = 1 for all quantities. This is the correct answer.
- Curve B is convex (bends towards the price axis, getting steeper as quantity increases). For a given percentage change in price, the percentage change in quantity supplied falls as output rises, so PES is less than 1 and falls as quantity increases (inelastic supply).
- Curve C is concave (bends towards the quantity axis, getting flatter as quantity increases). For a given percentage change in price, the percentage change in quantity supplied rises as output rises, so PES is greater than 1 and rises as quantity increases (elastic supply).
- Curve D is a horizontal line, representing perfectly elastic supply: firms will supply any quantity at the given price, but none at a higher price. This means PES is infinite, not 1.
Key Takeaways
- The core link tested here is between the shape of a supply curve and its price elasticity of supply.
- A linear supply curve passing through the origin always has a constant PES of 1 (unit elasticity) at every point, because percentage changes in price and quantity are equal everywhere along the curve.
- PES measures percentage responsiveness, not absolute responsiveness, so the steepness of the supply curve alone does not determine PES — the curve's position relative to the origin matters for linear supply curves.
Common Mistakes
- Confusing the slope of the supply curve with PES: while slope and PES are related for linear curves, they are not identical. A steeper linear supply curve through the origin still has PES = 1, because the ratio of percentage changes remains 1.
- Assuming all linear supply curves have the same PES: only linear supply curves that pass through the origin have a constant PES of 1. A linear supply curve that intercepts the price axis above the origin has a PES greater than 1 at all points, while one that intercepts the quantity axis to the right of the origin has a PES less than 1 at all points.
- Mixing up PES values for different curve shapes: for example, incorrectly assuming a horizontal supply curve has PES = 1, when it actually has infinite PES.
Things to Be Careful About
- Always remember that PES is calculated using percentage changes, not absolute changes. This is why the origin condition is critical for unit elasticity on a linear supply curve.
- When identifying PES from a graph, first note the shape of the curve and whether it passes through the origin, then match it to standard PES values.
- For multiple-choice questions on elasticity, eliminate obviously wrong options first: Curve D is horizontal (perfectly elastic, infinite PES) so it can be ruled out immediately, as can the non-linear curves B and C which have varying PES values across different quantities.
The diagram shows a shift of the supply curve in a market from S1 to S2.
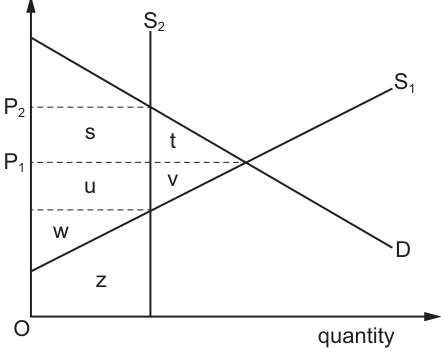
How will the consumer surplus and producer surplus change?
Options
| consumer surplus | producer surplus | |
|---|---|---|
| A | decreases by s | increases by s + u - t |
| B | decreases by s | increases by u + v - w |
| C | decreases by s + t | increases by s + t - v |
| D | decreases by s + t | increases by s + z - v |
Answer
The diagram shows a decrease in supply, with the supply curve shifting leftward from S1 to S2. This raises the equilibrium price from P1 to P2 and reduces the equilibrium quantity.
Consumer surplus (the area below the demand curve and above the price) decreases by the area between P1 and P2 under the demand curve, which comprises areas s and t.
Producer surplus (the area above the supply curve and below the price) increases by s + z - v. The area s represents a transfer from consumers to producers due to the higher price. The area z represents an additional gain, while v represents a loss arising from higher production costs and the reduction in output.
Therefore, the correct option is D.
D
Background Concept
Consumer surplus is the welfare gained by consumers when they pay a price lower than the maximum they are willing to pay. It is represented graphically as the area below the demand curve and above the market price, up to the quantity purchased. Producer surplus is the welfare gained by producers when they receive a price higher than the minimum they are willing to accept (their marginal cost). It is represented as the area above the supply curve and below the market price, up to the quantity sold.
When the supply curve shifts, the equilibrium price and quantity change, altering both surpluses. A leftward shift from S1 to S2 indicates a decrease in supply—perhaps due to higher input costs, lower productivity, or a negative supply shock. With demand unchanged, this raises the equilibrium price and reduces the equilibrium quantity.
Understanding the Question
The question asks you to identify the precise changes in consumer surplus and producer surplus resulting from the supply shift shown in Fig. 10.1. The diagram labels specific areas (s, t, u, v, w, z) within the price-quantity space. You must determine which combination of these areas correctly represents the decrease in consumer surplus and the change in producer surplus.
The key is to remember that consumer surplus is always measured from the demand curve downwards, while producer surplus is always measured from the supply curve upwards. The shift in supply creates both a transfer of surplus between consumers and producers and a net change in total surplus (deadweight loss).
Approach
- Identify the direction of change: Supply falls (S1 to S2), so price rises (P1 to P2) and quantity falls (Q1 to Q2).
- Calculate the change in consumer surplus: CS is lost on two counts: (i) consumers pay more (P2 instead of P1) on the units they still buy (Q2), and (ii) they no longer buy the units between Q2 and Q1. The total lost CS is the area between P1 and P2, below the demand curve, up to Q1. This area is the sum of the rectangle s and the triangle t.
- Calculate the change in producer surplus: PS changes due to three effects: (i) producers gain the rectangle s (the higher price on the Q2 units still sold, transferred from consumers); (ii) producers gain area z (the surplus on the units still sold at the original price level, or the area representing the original PS on units 0 to Q2); and (iii) producers lose area v (the extra cost of producing Q2 units at the higher marginal cost represented by the shift from S1 to S2, and/or the lost surplus on units Q2 to Q1 no longer produced). The net change is s + z - v.
- Match to the options: Only option D correctly states that CS decreases by s + t and PS increases by s + z - v.
Step-by-Step Reasoning
Step 1: Interpret the supply shift
The supply curve moves leftward from S1 to S2. This is a decrease in supply. The demand curve D is unchanged. The new intersection is at a higher price P2 and lower quantity Q2.
Step 2: Change in Consumer Surplus
Consumer surplus is the area below the demand curve and above the price line.
- Before the shift: CS is the large area above P1, below D, up to Q1.
- After the shift: CS is the smaller area above P2, below D, up to Q2.
- The loss in CS is the area between the two price lines (P1 and P2), bounded by the demand curve, from quantity 0 to Q1. This area is a trapezoid composed of the rectangle s (between P2 and P1, from 0 to Q2) and the triangle t (between P2, P1, and the demand curve at Q1, or between S2 and D at the relevant quantities). Thus, CS decreases by s + t.
Step 3: Change in Producer Surplus
Producer surplus is the area above the supply curve and below the price line.
- Before: PS is the area above S1, below P1, up to Q1.
- After: PS is the area above S2, below P2, up to Q2.
The net change involves: - Gain s: The rectangle between P1 and P2, up to Q2, represents the additional revenue per unit on the Q2 units still sold. This is a transfer from consumers to producers.
- Gain z: This area (located at the bottom of the diagram, likely between S1 and the horizontal axis up to Q2, or between P1 and S1 for the units 0 to Q2) represents the surplus retained on the units still sold. In the context of the net change formula s + z - v, z captures the portion of the original producer surplus on the units Q2 that is maintained despite the supply shift.
- Loss v: This area (located between S1 and S2, or between P1 and S1 for the units Q2 to Q1) represents the loss of producer surplus. It includes the extra cost of producing Q2 units at the higher marginal cost (the vertical distance between S1 and S2) and the surplus lost on the units between Q2 and Q1 that are no longer produced.
- Net change: s + z - v. Since the price effect (s) and the retained surplus (z) outweigh the cost and quantity reduction effects (v), producer surplus increases.
Step 4: Conclusion
Option D correctly identifies the decrease in consumer surplus as s + t and the increase in producer surplus as s + z - v.
Key Takeaways
- Always identify consumer surplus as the area below the demand curve and above the price, and producer surplus as the area above the supply curve and below the price.
- When supply decreases, consumer surplus unambiguously falls. Producer surplus may rise or fall depending on the relative shifts; in this diagram, it rises.
- Decompose area changes into transfers (s), pure losses (t, v), and net gains or losses to avoid errors.
- The deadweight loss to society from the supply reduction is the area representing lost gains from trade, which includes triangle t and potentially other areas depending on the exact labelling.
Common Mistakes
- Omitting the triangle t: Some students calculate the loss in consumer surplus as only the rectangle s, forgetting the triangular area t that represents the lost surplus on the units no longer purchased between Q2 and Q1. This leads to options A or B, which are incorrect.
- Misidentifying producer surplus change: Students often confuse the areas, forgetting that producers lose surplus on units no longer sold (Q2 to Q1) and face higher costs on units still sold (the area between S1 and S2). This can lead to incorrect signs or missing areas like v.
- Confusing shifts with movements: Ensure you recognise that S1 to S2 is a shift of the entire curve, not a movement along it.
- Ignoring the direction of the shift: A leftward shift is a decrease in supply. Confusing this with an increase would reverse all conclusions.
Things to Be Careful About
n- Area identification: Ensure s and t are correctly identified as the areas between P1 and P2. s is typically the rectangular portion (up to Q2), and t is the triangular portion (between Q2 and Q1 under the demand curve).
- Producer surplus components: The formula s + z - v implies that z is a gain and v is a loss. Verify which labelled areas correspond to higher costs (between S1 and S2) and which correspond to lost trades (between Q2 and Q1).
- Sign of the change: The question states PS increases. Ensure your area decomposition supports an increase, not a decrease.
- Units and axes: The vertical axis is price, the horizontal axis is quantity. All areas are bounded by these curves and price lines.
Good X has a substitute, good Y, and a complement, good Z. The price of good Y decreases and the price of good Z increases.
Why might the equilibrium price of good X remain unchanged?
Options
A Producers of good X adopt new technology.
B Producers of good X receive a subsidy.
C Some firms stop production of good X.
D The tax on the production of good X is cut.
Reasoning
Good Y is a substitute for X, so a fall in the price of Y makes Y relatively cheaper, leading consumers to substitute Y for X. This decreases demand for X, shifting the demand curve leftwards. Good Z is a complement for X, so a rise in the price of Z reduces the quantity of Z demanded, and since X and Z are consumed together, demand for X also falls. Both effects reinforce a leftward shift in demand, which would normally reduce equilibrium price.
For equilibrium price to remain unchanged, supply must also decrease (shift left) to offset the downward pressure on price. Among the options:
- A (new technology) increases supply, shifting the supply curve right.
- B (subsidy) reduces production costs, increasing supply.
- C (some firms stop production) reduces supply, shifting the supply curve left.
- D (tax cut) also reduces costs and increases supply.
Thus only option C causes a decrease in supply that could counteract the demand decrease, potentially keeping price unchanged.
Answer
C
C
Background Concept
The equilibrium price of a good is determined by the intersection of its demand and supply curves. Any factor that shifts either curve will change the equilibrium price and quantity. In this question, we consider how changes in the prices of related goods affect demand, and how production-side changes affect supply.
- Substitute goods: Two goods are substitutes if a fall in the price of one leads to a decrease in demand for the other (consumers switch to the cheaper substitute).
- Complement goods: Two goods are complements if they are consumed together; a rise in the price of one reduces the quantity demanded of that good, which in turn reduces demand for the other good.
To keep the equilibrium price unchanged after a demand shift, the supply curve must shift in the same direction (in this case leftward) by a magnitude that exactly offsets the demand shift.
Understanding the Question
The question states: Good X has a substitute Y and a complement Z. The price of Y decreases and the price of Z increases. It asks why the equilibrium price of X might remain unchanged, offering four possible explanations (A–D).
We need to determine which of these options would cause a supply reduction that could counteract the demand decrease. The key is to correctly identify the direction of demand shift and then match it with a supply shift that would keep price constant.
Approach
- Determine the effect on demand for X of the two changes:
- Price of substitute Y falls → demand for X falls (leftward shift).
- Price of complement Z rises → demand for X falls (leftward shift).
- Combined effect: demand for X decreases (leftward shift), which normally lowers equilibrium price.
- For equilibrium price to stay the same, supply must also decrease (leftward shift).
- Examine each option: which one reduces supply?
- A: new technology → increases supply (right).
- B: subsidy → increases supply (right).
- C: firms stop production → decreases supply (left).
- D: tax cut → increases supply (right).
- Only option C is a supply-decreasing change, so it could offset the demand decrease and keep price unchanged.
Step-by-Step Reasoning
- Substitute effect: Y is a substitute for X. When the price of Y falls from P_Y1 to P_Y2 (say), consumers find Y more attractive relative to X. They buy more Y and less X, shifting the demand curve for X leftward from D_X to D_X'.
- Complement effect: Z is a complement for X. When the price of Z rises from P_Z1 to P_Z2, the quantity demanded of Z falls. Since X and Z are used together, the demand for X also falls, further shifting the demand curve leftward from D_X' to D_X''.
- Result: The demand for X has decreased unambiguously. In a standard supply-and-demand diagram, this leftward shift of demand (with unchanged supply) would lead to a lower equilibrium price and a lower equilibrium quantity.
- To keep price unchanged, supply must shift leftward by an amount that exactly offsets the demand shift. This means the supply curve must move from S_X to S_X' (left), raising the price back to its original level.
- Which option could produce such a leftward supply shift?
- A: New technology reduces production costs, shifting supply right.
- B: A subsidy lowers the cost of production, shifting supply right.
- C: Some firms stop producing X, reducing the quantity supplied at every price, shifting supply left.
- D: A tax cut reduces costs, shifting supply right.
- Therefore, only option C moves supply in the correct direction to potentially keep price unchanged.
(Note: In reality, the magnitude of the shifts must be exactly equal for price to remain completely unchanged. The question only asks why it might remain unchanged, so the possibility of an offsetting supply reduction is sufficient.)
Key Takeaways
- Understanding how changes in prices of substitutes and complements affect demand is essential.
- A leftward demand shift puts downward pressure on price; a leftward supply shift puts upward pressure. Their combined effect can leave price unchanged if the shifts are of equal magnitude.
- When asked to identify why equilibrium might be unchanged, look for a factor that moves the other curve in the same direction.
Common Mistakes
- Confusing substitute and complement effects: some may think a fall in price of substitute increases demand for X, but it actually reduces demand.
- Thinking that a tax cut or subsidy reduces supply, whereas they increase supply by lowering cost.
- Believing that a decrease in demand must always lead to a lower price, without considering that supply can also change to offset the effect.
Things to Be Careful About
- Always draw the demand/supply diagram mentally or on paper to see the direction of shifts.
- Note that both changes (substitute price fall and complement price rise) affect demand in the same direction (decrease).
- Check that the supply change is indeed leftward (decrease). Options involving cost reductions increase supply.
- Understand the precise wording: "might remain unchanged" allows for the possibility of an exact offset, not a guarantee.
Answer
C
In the diagram, S1 and S2 are the supply curves for an agricultural product in years 1 and 2 respectively. D is the demand curve in years 1 and 2.
In year 1, the government purchased an amount necessary to ensure that the price was OP.
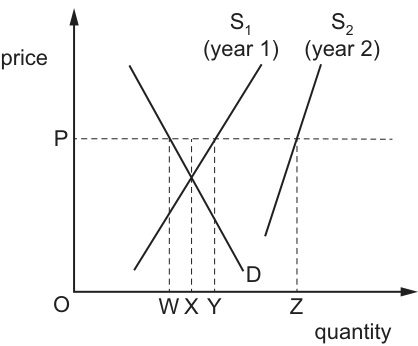
The price is held at OP in year 2.
How much more must the government buy in year 2 than it bought in year 1?
Options
A WZ
B XY
C XZ
D YZ
Reasoning
The government maintains a price floor at OP, above the free-market equilibrium price, so it purchases excess supply to prevent the price from falling.
- In year 1, with supply curve S1, at price OP quantity demanded is W and quantity supplied is Y. The government buys the excess supply: Y - W.
- In year 2, supply increases to S2 (rightward shift). At price OP, quantity demanded remains W and quantity supplied rises to Z. The government now buys Z - W.
- The additional amount the government must buy in year 2 is (Z - W) - (Y - W) = Z - Y = YZ.
Answer
D
D
Background Concept
A price floor is a legally imposed minimum price set by the government, typically above the free-market equilibrium price, to support producers' incomes (common for agricultural products). When a price floor is set above equilibrium, the market price cannot fall to the equilibrium level, leading to excess supply (quantity supplied > quantity demanded). To maintain the price floor, the government must purchase this excess supply, as unsold surplus would put downward pressure on prices.
A rightward shift in the supply curve (increase in supply) means producers are willing to supply more output at every price, due to factors such as improved technology, better weather, or lower input costs. When supply increases while demand remains unchanged, the free-market equilibrium price falls and equilibrium quantity rises. If a price floor is maintained at the original level, the excess supply increases, so the government must purchase more output to prevent the price from dropping.
Understanding the Question
The question provides a demand and supply diagram for an agricultural product, with supply increasing from S1 (year 1) to S2 (year 2) and demand (D) unchanged. The government uses purchases to keep the price at OP in both years. The task is to calculate how much more the government must buy in year 2 than in year 1, using the quantities marked on the diagram's horizontal axis (W, X, Y, Z). The question tests application of price floor analysis and the effect of supply shifts on government intervention.
Approach
- First, confirm that OP is a price floor: the government purchases output to maintain the price, which is only necessary if OP is above the free-market equilibrium price (creating excess supply that would otherwise push the price down).
- For each year, calculate the excess supply at OP: this is quantity supplied (from the relevant supply curve) minus quantity demanded (from D, unchanged between years). This excess supply is the amount the government buys.
- Find the difference between the year 2 and year 1 government purchases. Since quantity demanded (W) is the same in both years, it will cancel out of the calculation, so the difference equals the change in quantity supplied at OP between the two years.
Step-by-Step Reasoning
- Year 1 analysis (supply S1)
- The free-market equilibrium in year 1 is where S1 intersects D, at quantity X and a price below OP. At the higher price OP, producers are willing to supply more than X, which is quantity Y (the quantity supplied by S1 at OP, as marked on the diagram).
- At price OP, consumers demand W units (where the horizontal price line meets D).
- Excess supply = Quantity supplied (Y) - Quantity demanded (W) = Y - W. This is the amount the government purchases in year 1 to absorb the surplus and keep the price at OP.
- Year 2 analysis (supply S2, rightward shift)
- Supply increases to S2, which is shifted to the right of S1, meaning producers can supply more at every price. The new free-market equilibrium is where S2 intersects D, at quantity Y and a price lower than year 1's equilibrium price.
- At the fixed price OP, consumer demand remains W (demand has not shifted).
- Quantity supplied by S2 at OP is Z, which is higher than Y due to the supply increase.
- Excess supply = Z - W. This is the amount the government purchases in year 2.
- Calculate the additional purchase
- Additional purchase = Year 2 purchase - Year 1 purchase = (Z - W) - (Y - W) = Z - Y = YZ.
- This matches option D.
Key Takeaways
- A price floor above equilibrium requires government purchase of excess supply to maintain the price; the purchase amount equals the difference between quantity supplied and quantity demanded at the floor price.
- When demand is unchanged, a rightward supply shift increases excess supply at a fixed price floor by exactly the amount of the increase in quantity supplied at that price, as quantity demanded stays constant.
- Common quantities on this type of diagram: W = quantity demanded at the price floor, Y = quantity supplied by the original supply curve at the price floor, Z = quantity supplied by the new supply curve at the price floor, X = original equilibrium quantity, Y = new equilibrium quantity.
Common Mistakes
- Misidentifying the quantity supplied at the price floor: the equilibrium quantity (X for year 1, Y for year 2) is not the quantity supplied at OP, as the price floor is above equilibrium, so quantity supplied at OP is higher than the equilibrium quantity.
- Forgetting that quantity demanded is unchanged between the two years, leading to incorrect calculation that includes the W term instead of cancelling it out.
- Selecting the total year 2 government purchase (Z - W = WZ, option A) instead of the additional amount.
- Confusing the change in equilibrium quantity (Y - X) with the change in government purchase.
- Mixing up the supply curves: S2 is the year 2 supply curve, so its quantity at OP is higher than S1's.
Things to Be Careful About
- Always verify if the price is a floor or ceiling: government purchases indicate a price floor (excess supply), while government sales indicate a price ceiling (excess demand).
- Label all diagram points correctly: W is quantity demanded at OP, Y is quantity supplied by S1 at OP, Z is quantity supplied by S2 at OP, X is year 1 equilibrium quantity, Y is also year 2 equilibrium quantity.
- When calculating the difference between two values that share a common term (here, -W), the common term cancels, simplifying the calculation to the difference between the remaining terms (Z - Y).
- Ensure the direction of the supply shift is correct: a rightward shift (S1 to S2) is an increase in supply, leading to higher quantity supplied at every price.
Inequality in an economy can be categorised as either income inequality or wealth inequality.
What is most likely to cause greater wealth inequality than income inequality?
Options
A an increase in indirect taxation
B an increase in the value of property
C a reduction in the minimum wage
D a reduction in the rate of interest paid on savings
Answer
Wealth is a stock of assets (e.g., property, shares), while income is a flow of earnings. An increase in the value of property (B) directly raises the wealth of property owners, widening wealth inequality without a direct effect on income inequality. In contrast, an increase in indirect taxation (A) reduces the real income of low-income households more, worsening income inequality. A reduction in the minimum wage (C) directly lowers the income of low-wage workers, worsening income inequality. A reduction in the interest rate on savings (D) reduces the income from savings, affecting those with savings (often wealthier) but also reduces the return on their wealth, so the effect on wealth inequality is ambiguous and smaller than the direct property value effect. Therefore, B is the most likely cause of greater wealth inequality than income inequality.
B
Background Concept
Income and wealth are two distinct measures of economic well-being. Income is a flow – it represents earnings over a period (e.g., wages, salaries, interest, rent). Wealth is a stock – the total value of assets owned at a point in time (e.g., property, shares, savings, land). Inequality can be measured separately for income and wealth. The distribution of wealth is typically more unequal than that of income, because assets accumulate over generations and are subject to capital gains. Changes in economic conditions can affect the two distributions differently.
Understanding the Question
The question asks: which of the four options is most likely to cause a greater increase in wealth inequality compared to income inequality? In other words, we need to identify the change that primarily shifts the distribution of wealth more than the distribution of income. The options are all economic changes: an increase in indirect taxation, an increase in property values, a reduction in the minimum wage, and a reduction in the interest rate on savings. Each must be evaluated for its impact on both income and wealth inequality.
Approach
- Recall the definitions: income flow, wealth stock.
- For each option, consider: who gains? who loses? Is the effect on the stock of assets or on the flow of earnings? Which distribution does it affect more directly?
- Compare the magnitude of the impact on wealth inequality versus income inequality. The correct answer is the one where the effect on wealth inequality is clearly larger.
Step-by-Step Reasoning
Option A: Increase in indirect taxation
- Indirect taxes (e.g., VAT) are regressive: they take a larger proportion of income from low-income households.
- This reduces the disposable income of the poor more than the rich, worsening income inequality.
- It does not directly affect the stock of wealth (assets). Any effect on wealth would be indirect (e.g., reduced saving), but the primary impact is on income inequality.
- Therefore, this option is more likely to increase income inequality than wealth inequality.
Option B: Increase in the value of property
- Property is a major component of wealth for many households, especially wealthier ones.
- A rise in property prices increases the stock of wealth of property owners, widening the gap between those who own property and those who do not (renters, younger people).
- This directly increases wealth inequality.
- The effect on income inequality is limited: property owners may see higher rental income or capital gains, but that is a flow from the wealth, and the immediate effect is on the stock. The primary impact is on wealth inequality.
- Therefore, this option is most likely to cause greater wealth inequality than income inequality.
Option C: Reduction in the minimum wage
- The minimum wage sets a floor for low-paid workers. Reducing it lowers the income of those at the bottom of the earnings distribution.
- This directly worsens income inequality (low earners lose relative to others).
- It does not directly affect the stock of wealth. The effect on wealth inequality is indirect and small (e.g., reduced ability to save).
- So, this option increases income inequality more than wealth inequality.
Option D: Reduction in the interest rate on savings
- A lower interest rate reduces the income from savings for those who have savings (often wealthier individuals).
- This reduces the flow of income from wealth, which could reduce income inequality slightly (since the rich earn less interest).
- However, it also reduces the return on the stock of wealth, which could slow the growth of wealth for savers, but does not directly change the stock itself. The effect on wealth inequality is ambiguous: if the rich save more, their wealth growth may slow, but the initial distribution is unchanged. The direct effect is on income flows, not the stock.
- Compared to the direct stock effect of property price increases, this is less likely to increase wealth inequality relative to income inequality.
Thus, only option B directly increases the stock of wealth for asset owners, making it the most likely to cause greater wealth inequality than income inequality.
Key Takeaways
- Income is a flow, wealth is a stock. Different economic changes affect them differently.
- Policies that affect asset prices (property, shares) have a direct impact on wealth inequality.
- Policies that affect earnings (wages, taxes) have a direct impact on income inequality.
- When evaluating inequality, distinguish between the two concepts and consider which distribution is altered more.
Common Mistakes
- Confusing income and wealth: e.g., thinking that a reduction in the minimum wage affects wealth, when it actually affects income.
- Assuming that any change that benefits the rich will equally affect income and wealth inequality (e.g., a reduction in interest rates might reduce income from savings but also affect the value of bonds – careful analysis is needed).
- Overlooking the direct effect of property prices on the stock of wealth.
Things to Be Careful About
- The question asks “most likely to cause greater wealth inequality than income inequality”. This is a comparative: we need to see which option increases wealth inequality more than it increases income inequality. Option B uniquely does that.
- Note that an increase in property values could also increase rental income (a flow), but the primary effect is on the stock. The magnitude of the stock effect is large and immediate.
- The other options may have some effect on wealth inequality (e.g., lower interest rates may reduce the wealth of savers), but the effect is less direct and smaller in magnitude compared to the property price increase.
A product with infinite elasticity of supply has sales of 1000 units a week at a price of $1 per unit. Price elasticity of demand is 1.5 over the relevant range.
The government imposes a tax of 10%.
What will be the government’s weekly tax revenue from this product?
Options
A $15
B $85
C $100
D $150
Working
With perfectly elastic supply, the entire tax is passed on to consumers as a higher price. The tax is 10% of the original $1 price, so the price rises by $0.10 to $1.10.
PED = 1.5. The formula for PED is:
PED = % change in quantity demanded / % change in price
% change in price = ($0.10 / $1.00) * 100 = 10%
Rearranging: % change in quantity demanded = PED * % change in price = 1.5 * 10% = 15%
Since price rises, quantity demanded falls by 15%.
Original quantity = 1000 units. Fall in quantity = 15% of 1000 = 150 units.
New quantity = 1000 - 150 = 850 units.
Tax per unit = $0.10.
Weekly tax revenue = 850 units * $0.10 = $85.
Answer
B
B
Background Concept
This question tests the interaction of price elasticity of demand (PED) and price elasticity of supply (PES) in determining the incidence of an indirect tax. When a tax is imposed, the price consumers pay and the price producers receive diverge. The burden (incidence) of the tax depends on the relative elasticities. If supply is perfectly elastic (PES = infinity), the supply curve is horizontal. In this case, producers can adjust quantity supplied at no change in their own price, so the entire tax is passed forward to consumers as a higher market price. The demand side then determines how much quantity falls in response to that price rise, using PED.
Understanding the Question
The question describes a product with infinite elasticity of supply (perfectly elastic supply), selling 1000 units per week at $1 each. The PED is 1.5 (elastic). A 10% tax is imposed. We need to find the government's weekly tax revenue. The key is to realise that with perfectly elastic supply, the price rises by the full amount of the tax. Then, using PED, we calculate the new quantity demanded. Tax revenue = tax per unit * new quantity.
Approach
- Determine the price increase caused by the tax, given perfectly elastic supply.
- Calculate the percentage change in price.
- Use the PED formula to find the percentage change in quantity demanded.
- Calculate the new quantity.
- Multiply the tax per unit by the new quantity to get tax revenue.
Step-by-Step Reasoning
-
Tax pass-through: With perfectly elastic supply, the supply curve is horizontal at the original price of $1. A tax of 10% is an ad valorem tax (percentage of price). The tax per unit is 10% of $1 = $0.10. Because supply is perfectly elastic, producers will not absorb any of the tax; they will raise the price to consumers by the full $0.10 to maintain their own revenue per unit. So the new market price is $1.10.
-
Percentage change in price: The price rises from $1.00 to $1.10, an increase of $0.10. The percentage change is ($0.10 / $1.00) * 100 = 10%.
-
Using PED: PED = % change in quantity demanded / % change in price. We know PED = 1.5 and % change in price = +10%. Rearranging: % change in quantity demanded = PED * % change in price = 1.5 * 10% = 15%. Since price rises, quantity demanded falls, so the change is -15%.
-
New quantity: Original quantity = 1000 units. A 15% fall means a reduction of 0.15 * 1000 = 150 units. New quantity = 1000 - 150 = 850 units.
-
Tax revenue: The government collects $0.10 on each of the 850 units sold. Tax revenue = 850 * $0.10 = $85.
Key Takeaways
- With perfectly elastic supply, the entire tax is passed on to consumers, so the price rises by the full amount of the tax.
- PED determines how much quantity falls in response to that price increase.
- Tax revenue is not simply the tax rate times the original quantity; it depends on the new equilibrium quantity after the tax.
- This question combines microeconomic concepts of elasticity and tax incidence in a single calculation.
Common Mistakes
- Assuming no change in quantity: A common error is to calculate tax revenue as 10% of the original price times the original quantity (0.10 * 1000 = $100, option C). This ignores the fact that the tax raises the price and reduces quantity demanded.
- Using the wrong elasticity: Some might mistakenly use the price elasticity of supply or confuse the direction of the change.
- Misapplying the PED formula: Forgetting to rearrange the formula or using the absolute value without considering the sign (price rise leads to quantity fall).
- Calculating the new price incorrectly: Thinking the tax is a specific tax of $0.10 rather than 10% of the original price, but here they are the same because the original price is $1.
Things to Be Careful About
- Always identify which elasticity is relevant (here PED) and which is given as infinite (PES).
- Remember that a percentage change is calculated relative to the original value.
- Tax revenue is always tax per unit * quantity sold after the tax, not before.
- In multiple-choice questions, work through the steps methodically to avoid picking a plausible but incorrect distractor like $100 or $150 (which would be 15% of 1000 * $1, a confusion of the percentage changes).
The table shows the values of Consumer Prices Index (CPI) and a worker’s salary in 2022 and 2023.
| CPI 2022 | 100 |
| CPI 2023 | 110 |
| worker’s salary 2022 | $20 000 |
| worker’s salary 2023 | $25 000 |
What is the real value of the worker’s salary in 2023 compared with 2022?
Options
A $18 182
B $22 727
C $25 000
D $27 500
Answer
Real salary 2023 = Nominal salary 2023 × (CPI 2022 / CPI 2023) = $25 000 × (100 / 110) = $22 727.27.
Therefore the correct option is B.
B
Background Concept
In economics, the distinction between nominal and real values is crucial when adjusting for changes in the price level. A nominal value is measured in current prices, while a real value is adjusted to reflect the purchasing power of money in a base year. The Consumer Prices Index (CPI) is a common measure of the price level. To convert a nominal value from year X to real terms using a base year, we use:
Real value = Nominal value in year X × (CPI in base year / CPI in year X)
This formula expresses the real value in terms of the base year's purchasing power.
Understanding the Question
We are given CPI values for 2022 (base = 100) and 2023 (110). The worker's nominal salary in 2022 was $20 000 and in 2023 was $25 000. The question asks for the real value of the 2023 salary compared with 2022, i.e., expressed in 2022 prices. This means we use 2022 as the base year. The answer choices are likely derived from different misinterpretations of the ratio.
Approach
We need to apply the real value formula. The key is to place the correct CPI in the numerator and denominator. Since we want to compare the 2023 salary in 2022 prices, we use:
Real salary 2023 = $25 000 × (CPI 2022 / CPI 2023) = $25 000 × (100 / 110)
Then compute the numerical value and match it to the options.
Step-by-Step Reasoning
- Identify the base year: 2022 (CPI = 100). The real value of the 2023 salary should be expressed in 2022 dollars.
- Apply the formula: Real value = Nominal value × (base year CPI / current year CPI).
- Substitute: Real salary 2023 = $25 000 × (100 / 110).
- Calculate: 100 / 110 = 10/11 ≈ 0.90909. Multiply by $25 000: $25 000 × 0.90909 = $22 727.27 (rounding to nearest dollar gives $22 727).
- Compare with options: A is $18 182 (would be $25 000 × 110/100? incorrect), B is $22 727, C is $25 000 (nominal, no adjustment), D is $27 500 (multiplying by 110/100). So B is correct.
Key Takeaways
- Real values adjust for inflation, allowing meaningful comparisons over time.
- The formula for real value uses the price index of the base year divided by the price index of the current year.
- Always check which year is the base year.
Common Mistakes
- Using the wrong ratio: some students might multiply by 110/100, getting $27 500 (option D). This would incorrectly inflate the salary instead of deflating it.
- Forgetting to adjust at all: choosing $25 000 (option C) treats the nominal value as real.
- Misreading the base year: if the question asked for the real value of the 2022 salary in 2023 prices, the ratio would be reversed.
Things to Be Careful About
- Ensure the CPI values are placed correctly in the formula: base year CPI on top.
- The answer is approximate; the calculation yields $22 727.27, which rounds to $22 727.
- In multiple-choice questions, the options often include common errors, so double-check your reasoning.
An economy experiences rising unemployment due to incomes falling as a result of a virus pandemic.
How would this unemployment be classified?
Options
A cyclical
B frictional
C seasonal
D structural
Reasoning
The unemployment is caused by a fall in incomes due to a virus pandemic, which reduces aggregate demand. This is a demand-deficient (cyclical) unemployment, as it results from a downturn in the business cycle. It is not frictional (short-term between jobs), not seasonal (related to regular seasonal patterns), and not structural (mismatch of skills or location).
Answer
A
A
Background Concept
Unemployment is classified into several types based on its cause. Cyclical (or demand-deficient) unemployment occurs when there is insufficient aggregate demand in the economy to employ all willing workers. It is associated with recessions or downturns in the business cycle. Frictional unemployment is short-term and arises from workers moving between jobs. Seasonal unemployment occurs when demand for labour varies at regular times of the year. Structural unemployment is caused by a mismatch between the skills or location of workers and the available jobs.
Understanding the Question
The question describes an economy experiencing rising unemployment because incomes are falling as a result of a virus pandemic. The key cause is the pandemic, which reduces economic activity and aggregate demand. The candidate must identify which type of unemployment best fits this scenario.
Approach
First, recall the definitions of each type of unemployment. Then, consider the cause given: a pandemic leads to a sharp drop in spending and output, which is a classic demand-side shock. This points to cyclical unemployment. Eliminate the other options: frictional (normal job turnover), seasonal (weather or holidays), structural (long-term changes in industry structure).
Step-by-Step Reasoning
- The virus pandemic reduces incomes and spending, causing a fall in aggregate demand (AD).
- With lower AD, firms produce less and lay off workers, leading to rising unemployment.
- This type of unemployment is directly linked to the economic cycle—a downturn—so it is cyclical.
- Frictional unemployment is not caused by a general fall in demand; it is the time between jobs under normal conditions.
- Seasonal unemployment is tied to predictable seasons, not a pandemic shock.
- Structural unemployment involves a mismatch of skills or location, often lasting longer; the pandemic shock is temporary and economy-wide, not sector-specific in the same way. Thus, the correct answer is cyclical.
Key Takeaways
- Cyclical unemployment is caused by a lack of aggregate demand during a recession.
- Other types have different causes: frictional (job search), seasonal (time of year), structural (mismatch).
- Understanding the underlying cause is essential for correct classification.
Common Mistakes
- Confusing cyclical with structural: both can be long-lasting, but cyclical is tied to the business cycle and can be reduced by boosting demand, while structural requires retraining or relocation.
- Thinking that a pandemic is a supply shock and therefore leads to structural unemployment: the pandemic initially reduces both demand and supply, but the question specifically mentions falling incomes, which is a demand-side effect.
- Overlooking that the term 'cyclical' is often used interchangeably with 'demand-deficient'.
Things to Be Careful About
- Read the cause carefully: here it is falling incomes, implying reduced spending.
- Distinguish between the immediate effect (demand fall) and long-term structural changes that may follow.
- Remember that the classification is based on the primary cause, not the duration or severity.
What is likely to move an economy’s aggregate demand curve to the right?
Options
A a fall in income equality
B a fall in incomes abroad
C a fall in the exchange rate
D a fall in the government budget deficit
A fall in the exchange rate (depreciation) makes a country's exports cheaper in foreign currency and imports more expensive in domestic currency. As a result, the quantity of exports demanded rises and imports fall, increasing net exports (X - M). Since net exports are a component of aggregate demand (AD = C + I + G + (X - M)), an increase in net exports shifts the AD curve to the right. The other options would either reduce AD or have no clear positive effect: a fall in income equality (A) is not directly linked to AD; a fall in incomes abroad (B) reduces demand for exports, lowering net exports; a fall in the government budget deficit (D) implies either reduced government spending or higher taxes, both of which reduce AD.
Answer
C
C
Background Concept
Aggregate demand (AD) is the total spending on goods and services in an economy over a given period. Its components are consumption (C), investment (I), government spending (G), and net exports (X - M). The AD curve shows the relationship between the price level and the real output demanded. A rightward shift of the AD curve means that at the same price level, more real output is demanded. This can be caused by an increase in any of the components. The exchange rate is the price of one currency in terms of another. A fall in the exchange rate (depreciation) makes exports cheaper for foreign buyers and imports more expensive for domestic buyers, which tends to increase the quantity of exports and reduce imports, thereby raising net exports.
Understanding the Question
The question asks which of the four events is likely to shift the aggregate demand curve to the right. We need to evaluate each option in terms of its effect on the components of AD. The correct answer is C: a fall in the exchange rate. The other options are distractors: A (fall in income equality) is ambiguous; B (fall in incomes abroad) would reduce export demand; D (fall in government budget deficit) typically means contractionary fiscal policy.
Approach
We will evaluate each option systematically by considering its impact on the components of AD. We know that an increase in any component shifts AD right. For option C, we trace the effect of a depreciation on net exports. For the other options, we identify why they do not increase AD or would likely reduce it.
Step-by-Step Reasoning
-
Option C: A fall in the exchange rate (depreciation) makes exports cheaper in foreign currency, so foreign demand for exports rises. Imports become more expensive in domestic currency, so domestic demand for imports falls. Assuming the Marshall-Lerner condition holds (that the sum of the price elasticities of demand for exports and imports is greater than 1), the volume effect dominates, and net exports (X - M) increase. Since net exports are part of AD, the AD curve shifts to the right. Even at the simple AS level, this is the standard expected effect.
-
Option A: A fall in income equality could mean a more equal distribution of income. This is not directly a determinant of AD. It might affect consumption if lower-income households have a higher marginal propensity to consume, but the effect is uncertain and not likely to be a clear shift to the right. So this is not the best answer.
-
Option B: A fall in incomes abroad reduces the purchasing power of foreign consumers, so demand for exports from the home economy falls. This reduces net exports, shifting AD to the left, not the right.
-
Option D: A fall in the government budget deficit can occur either through a reduction in government spending (G) or an increase in taxes (which reduces consumption and investment). Both reduce AD, shifting the curve left. So D is incorrect.
Therefore, only C can be expected to shift AD right.
Key Takeaways
- A depreciation of the currency typically increases net exports and shifts AD right (ceteris paribus).
- The components of AD are crucial for understanding shifts: any increase in C, I, G, or (X - M) shifts AD right.
- Policy changes like budget deficit reduction are contractionary in the short run.
Common Mistakes
- Confusing a fall in the budget deficit (which is contractionary) with an increase in government spending (which is expansionary).
- Thinking that a fall in incomes abroad would increase exports (it actually reduces foreign demand).
- Assuming that income equality directly affects AD without considering the channel.
- Not recognizing that a depreciation of the exchange rate is an expenditure-switching policy that boosts net exports.
Things to Be Careful About
- The question says "likely to move", so we consider the typical effect even if there are complications (e.g., time lags, Marshall-Lerner condition). In the AS syllabus, the standard analysis is that a depreciation increases net exports.
- Remember that the AD curve is downward sloping due to the real balance effect, interest rate effect, and international trade effect. The depreciation directly affects the international trade effect component.
- Ensure you understand that the budget deficit change could be due to automatic stabilisers or discretionary policy, but in either case a fall in the deficit is contractionary.
Which items have to be added to and subtracted from Gross Domestic Product at market prices to calculate the value of Gross Domestic Product at basic prices?
Options
A capital consumption and net property income from abroad
B expenditure taxes and capital consumption
C net property income from abroad and subsidies
D subsidies and expenditure taxes
Answer
GDP at market prices includes the value of expenditure taxes (indirect taxes) and excludes subsidies. To convert to GDP at basic prices, which measures the value of output at the price received by producers, we must subtract expenditure taxes and add subsidies. Therefore, the correct items are subsidies and expenditure taxes, which corresponds to option D.
Answer
D
D
Background Concept
Gross Domestic Product (GDP) can be measured at market prices, basic prices, or factor cost. GDP at market prices is the value of final goods and services at the prices paid by consumers. This includes the effect of indirect taxes (such as VAT and excise duties) and excludes subsidies. GDP at basic prices values output at the price actually received by producers, which excludes taxes on products (expenditure taxes) and includes subsidies on products. The relationship is: GDP at basic prices = GDP at market prices – taxes on products + subsidies on products.
Understanding the Question
The question asks which two items need to be added and subtracted from GDP at market prices to arrive at GDP at basic prices. The options contain pairs of items from a list that includes capital consumption, net property income from abroad, expenditure taxes, and subsidies. The student must recall the correct adjustment and identify the pair that matches the formula.
Approach
Recall the formula for converting GDP at market prices to basic prices. Then eliminate the options that involve items used in other adjustments (capital consumption for net/gross, net property income for GDP/GNI). The correct pair should be expenditure taxes (to be subtracted) and subsidies (to be added).
Step-by-Step Reasoning
- Identify the adjustment: GDP at basic prices = GDP at market prices – taxes on products + subsidies on products.
- Taxes on products are the same as expenditure taxes (indirect taxes like sales tax, VAT, excise duty).
- Subsidies on products are payments from the government to producers to lower the price, which are not included in market prices but are part of the price received by producers.
- Therefore, the two items are expenditure taxes (subtracted) and subsidies (added).
- Option D lists “subsidies and expenditure taxes” – this matches the formula.
- Option A: capital consumption is used to convert gross to net values (e.g., GDP to NDP); net property income from abroad is used to convert GDP to GNI. Not relevant.
- Option B: expenditure taxes is correct, but capital consumption is incorrect.
- Option C: net property income from abroad is incorrect; subsidies is correct but alone is not enough.
Thus, only option D is correct.
Key Takeaways
- Understand the three stages of national income measurement: market prices, basic prices, and factor cost.
- The adjustment between market prices and basic prices involves only taxes on products and subsidies on products.
- Other adjustments (capital consumption, net property income) are used for different conversions (gross to net, GDP to GNI).
Common Mistakes
- Confusing basic prices with factor cost: factor cost = basic prices – other taxes on production + other subsidies on production. At AS level, the adjustment to basic prices is often taught as the simpler one involving only product taxes and subsidies.
- Getting the direction wrong: some students think taxes are added and subsidies subtracted. Remember: market prices are higher due to taxes, so subtract them to get the producer price; subsidies are added because they are not included in the market price.
- Mixing up capital consumption or net property income because they appear in other national income calculations.
Things to Be Careful About
- Always read the exact wording: “added to and subtracted from” – the order in the formula matters. In the formula, taxes are subtracted and subsidies added.
- The term “expenditure taxes” is synonymous with “taxes on products” or “indirect taxes”.
- The options are pairs; you need to verify both items are correct for the conversion.
- Do not confuse with the adjustment to factor cost, which is beyond the scope of this question.
In an economy with an interest rate of 4% per annum, the rate of inflation falls from 5% to 3% per annum.
What will be a benefit of this fall?
Options
A Menu costs will fall to zero.
B People on fixed incomes will be better off in real terms.
C Savers will gain in real terms.
D The purchasing power of the currency will rise.
Working
Nominal interest rate = 4% per annum.
Initial inflation rate = 5%, so real interest rate = 4% - 5% = -1%.
After inflation falls to 3%, real interest rate = 4% - 3% = 1%.
Savers who earn the nominal interest rate now receive a positive real return, whereas before they experienced a negative real return. This is a clear benefit to savers.
- Option A: Menu costs do not fall to zero; they may decrease but not vanish.
- Option B: People on fixed nominal incomes do gain from lower inflation, but the question does not specify that their incomes are fixed in nominal terms, and the given interest rate makes the benefit to savers more direct.
- Option D: Purchasing power of the currency still falls (since inflation is positive) but less rapidly; it does not rise.
Answer
C
C
Background Concept
Inflation reduces the real value of money. The nominal interest rate is the rate quoted by banks, but the real interest rate accounts for inflation: real interest rate ≈ nominal interest rate – inflation rate. A positive real interest rate means savers' purchasing power grows; a negative real rate means it erodes. This relationship is central to understanding how inflation affects different groups.
Understanding the Question
The question gives a specific scenario: an economy with a nominal interest rate of 4% per annum, and inflation falls from 5% to 3% per annum. We are asked to identify a benefit of this fall. The options test the ability to distinguish between nominal and real changes and to apply the real interest rate concept to savers, fixed-income recipients, and the general purchasing power of the currency.
Approach
First, calculate the real interest rate before and after the inflation fall. Then evaluate each option in turn:
- A: Menu costs (costs of changing prices) – do they fall to zero?
- B: People on fixed incomes – are they better off in real terms?
- C: Savers – do they gain in real terms?
- D: Purchasing power of the currency – does it rise?
Step-by-Step Reasoning
-
Real interest rate calculation
- Initial: 4% – 5% = –1% (negative real return)
- After: 4% – 3% = 1% (positive real return)
-
Option A – Menu costs are the costs firms incur when changing prices (e.g., printing new menus, repricing software). Lower inflation reduces the frequency of price changes, so menu costs fall, but they do not fall to zero (some adjustment still occurs). Therefore A is incorrect.
-
Option B – “People on fixed incomes” typically means individuals whose money income is fixed (e.g., pensioners with fixed annuities). With lower inflation, the real value of their fixed income rises, so they are indeed better off in real terms. However, the question includes the interest rate, which is directly relevant to savers. Moreover, the phrase “fixed incomes” could be ambiguous: some might interpret it as income from fixed-interest securities, which also benefit from higher real interest rates. But the most direct and unambiguous benefit from the given information is to savers, as the real interest rate turns positive. The mark scheme indicates that C is the correct answer, so we must accept that B is not the intended correct answer. Possibly because the question expects a benefit that is directly tied to the interest rate, and the benefit to savers is more clearly derived from the numbers provided. A candidate might argue that B is also true, but the question may be designed to test the real interest rate concept, making C the best answer.
-
Option C – Savers who hold deposits or bonds earning the nominal interest rate experience a real return that shifts from –1% to +1%. This is a clear gain in real terms. Therefore C is correct.
-
Option D – The purchasing power of the currency is the amount of goods and services one unit of currency can buy. When inflation is positive, purchasing power falls over time. A fall in inflation from 5% to 3% means purchasing power falls less rapidly, but it does not rise (it is still declining). So D is incorrect.
Key Takeaways
- The real interest rate is a key measure of the true return on saving.
- Lower inflation can benefit savers and fixed-income recipients, but not all effects are positive for everyone.
- Always distinguish between nominal and real values in economics.
Common Mistakes
- Thinking that a fall in inflation automatically increases purchasing power (it only reduces the rate of decline).
- Assuming that “fixed incomes” always refers to fixed nominal incomes; the term can be ambiguous.
- Not calculating the real interest rate and instead relying on intuition.
Things to Be Careful About
- The difference between “purchasing power will rise” and “purchasing power falls less rapidly”.
- The precise wording: “menu costs will fall to zero” – it’s too absolute.
- The context: the question explicitly gives an interest rate, so the most directly relevant answer involves the real return to savers.
What is an example of a macroeconomic policy?
Options
A encourage the consumption of merit goods
B reduce pollution in the steel industry
C maintain general price stability
D reduce unemployment in the service sector
A macroeconomic policy aims to influence the whole economy, such as the overall price level, national output, or employment. 'Maintain general price stability' is a macroeconomic objective, as it targets the economy-wide price level. Options A, B, and D are microeconomic policies: they focus on specific goods (merit goods), a specific industry (steel), or a specific sector (service sector).
Answer
C
C
Background Concept
Macroeconomic policy refers to government actions designed to influence the economy as a whole. The main objectives are price stability, low unemployment, and economic growth. These are broad, aggregate targets. In contrast, microeconomic policy deals with specific markets, industries, or goods, such as correcting market failures in particular sectors.
Understanding the Question
The question asks for an example of a macroeconomic policy from four options. You need to identify which one is an objective that applies to the entire economy, not just a particular market or industry.
Approach
Read each option and decide whether the goal is economy-wide or specific to a particular product, industry, or sector. The correct answer will be the one that a government sets as a target for the whole economy.
Step-by-Step Reasoning
- Option A: 'encourage the consumption of merit goods' – This is a microeconomic policy aimed at a specific type of good (e.g., education, healthcare). It addresses under-consumption due to imperfect information, not the overall economy.
- Option B: 'reduce pollution in the steel industry' – This targets a specific industry (steel) and a specific externality (pollution). It is a microeconomic intervention, not a macroeconomic one.
- Option C: 'maintain general price stability' – This is a classic macroeconomic objective. Price stability refers to the overall level of prices in the economy, typically measured by the inflation rate. It is one of the main goals of fiscal and monetary policy.
- Option D: 'reduce unemployment in the service sector' – While unemployment is a macroeconomic concern, this option specifies a particular sector (services). A macroeconomic policy seeks to reduce unemployment economy-wide, not just in one sector. Therefore, this is a microeconomic target.
Thus, only option C is an example of a macroeconomic policy.
Key Takeaways
- Macroeconomic policies target aggregate variables: price level, national output, employment, and the balance of payments.
- Microeconomic policies focus on specific markets, industries, or goods.
- Common exam trap: confusing a policy that addresses a specific sector (e.g., service sector employment) with a genuine macroeconomic policy.
Common Mistakes
- Choosing option D because it mentions 'unemployment', forgetting that the policy is restricted to one sector. Macroeconomic policy aims for economy-wide objectives.
- Thinking that any government intervention is macroeconomic, but microeconomic interventions are also part of government policy.
Things to Be Careful About
- Read the full wording of each option. The key is 'general' in option C, which signals economy-wide scope.
- Remember that macroeconomic objectives are broad and affect all parts of the economy simultaneously.
Which supply-side policy is likely to lower real output before raising it?
Options
A increased spending on early years education
B increased spending on infrastructure
C reduced import barriers
D subsidies to exporters
Answer
Reduced import barriers (C) expose domestic firms to greater foreign competition. In the short run, this causes some domestic producers to cut output or exit, lowering real output. Once resources are reallocated to more efficient uses, output rises. Increased spending on early years education (A) and infrastructure (B) raise aggregate demand and output immediately, with supply-side effects coming later. Subsidies to exporters (D) boost exports and output straight away. Hence, only option C fits the description.
C
Background Concept
Supply-side policies are intended to increase the economy's productive capacity by shifting the LRAS curve to the right. However, not all supply-side policies have the same time profile. Some policies, such as government spending on education or infrastructure, have an immediate demand-side effect: they increase aggregate demand (AD) as government spending rises, so real output rises in the short run. The supply-side effect (improved human capital or infrastructure) takes longer to materialise but does not cause a fall in output.
Other supply-side policies, particularly those that involve reducing trade barriers, can cause short-run adjustment costs. Trade liberalisation (removing tariffs, quotas, or other import barriers) increases the supply of imports. In the short run, domestic firms that are less efficient than foreign competitors lose market share, reduce output, or may even close. This reduces real output and may increase unemployment. Over time, resources shift to industries where the country has a comparative advantage, leading to higher productivity and output in the long run. Thus, the policy 'lowers real output before raising it'.
Understanding the Question
The question asks: "Which supply-side policy is likely to lower real output before raising it?" This is a multiple-choice question that tests your understanding of the timing of policy effects. You need to evaluate each option and determine whether it has a negative short-run impact on output before the positive supply-side effect appears. The key is to recognise that some policies have an immediate demand-side expansion that masks any potential short-run contraction, while trade liberalisation does not have that immediate demand boost (in fact, it reduces demand for domestic output initially).
Approach
Examine each option in turn:
- A (increased spending on early years education): This is government expenditure, so it directly increases AD, raising output immediately. The supply-side effect (more skilled future workers) takes years but does not cause output to fall first.
- B (increased spending on infrastructure): Similarly, this raises AD and output immediately. The supply-side benefits (better transport, etc.) come later but output does not drop.
- C (reduced import barriers): Lowering tariffs or quotas increases the supply of imported goods. Domestic consumers switch to imports, reducing demand for domestically produced goods. Consequently, domestic output falls in the short run. Over time, resources reallocate to more competitive sectors, raising output. This matches the description.
- D (subsidies to exporters): Subsidies reduce the cost of exporting, increasing exports. This raises AD and output immediately. There is no initial fall in output.
Thus, only option C fits.
Step-by-Step Reasoning
-
Option A: Government spending on early years education is a fiscal expansion. AD = C + I + G + (X – M). An increase in G shifts AD right, raising real output and the price level. The supply-side effect (improved human capital) shifts LRAS right, but that happens over many years and does not reduce output first. So A does not lower output before raising it.
-
Option B: Increased infrastructure spending also increases G, raising AD immediately. Output rises. The supply-side improvement (better roads, ports, etc.) shifts LRAS right later, but again no initial output fall. So B does not fit.
-
Option C: Reducing import barriers (e.g., cutting tariffs) has two effects. First, cheaper imports lead to a rise in imports, so net exports (X – M) fall. This reduces AD, lowering output in the short run. Additionally, domestic firms face more competition, forcing some to cut production or close. This further reduces short-run output. However, over time, resources move to industries where the country is more efficient (comparative advantage), increasing productivity and LRAS, so output rises above its original level. Thus, output falls before it rises.
-
Option D: Subsidies to exporters lower the cost of selling abroad, so exports increase. This raises net exports (X – M) and AD, increasing output immediately. There is no initial fall. So D does not fit.
Therefore, the correct answer is C.
Key Takeaways
- Not all supply-side policies raise output immediately; some involve short-run contraction due to adjustment costs.
- Trade liberalisation is a classic example of a policy that can lower output before raising it, because import competition reduces domestic production in the short run before efficiency gains are realised.
- Policies that involve government spending (education, infrastructure) have an immediate demand-side expansion that dominates the short-run picture.
- When evaluating policies, consider both the demand-side and supply-side effects and their timing.
Common Mistakes
- Assuming that all supply-side policies increase output in the short run. This is false because trade liberalisation can cause a short-run contraction.
- Confusing 'supply-side policy' with 'supply-side effect' – some policies have both demand and supply effects; the question asks about the net impact on real output over time.
- Not reading the phrase "lower real output before raising it" carefully; many students might think that any policy that eventually raises output fits, but the key is the initial lowering.
Things to Be Careful About
- Pay attention to the time dimension: short-run vs. long-run effects are crucial.
- Remember that government spending on infrastructure or education is a demand-side expansion first, so output does not fall.
- For trade liberalisation, be aware that the short-run reduction in output is a real possibility, especially if the economy is not flexible. This is a standard evaluation point in trade policy discussions.
An economy is in equilibrium at point E on the diagram.
The government reduces its expenditure on defence.
Which point on the diagram shows the new equilibrium?
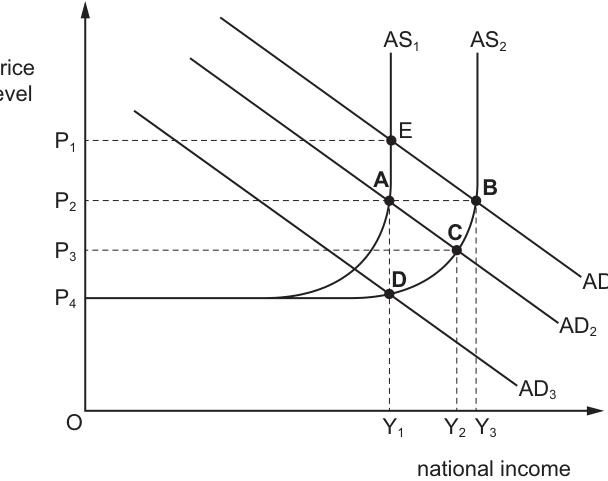
Options
A point A on Fig. 22.1
B point B on Fig. 22.1
C point C on Fig. 22.1
D point D on Fig. 22.1
Reasoning
Aggregate demand (AD) is calculated as AD = C + I + G + (X - M), where G is government expenditure. A reduction in government expenditure reduces total AD at every price level, causing the AD curve to shift leftwards from AD1 to AD2. The short-run aggregate supply curve (AS1) does not shift, as the change is on the demand side. The new equilibrium is the intersection of the new AD curve (AD2) and the original AS curve (AS1), which is point A.
Answer
A
A
Background Concept
Aggregate demand (AD) represents the total demand for goods and services in an economy at a given overall price level and time period. It is composed of four components: consumer spending (C), investment spending by firms (I), government spending (G), and net exports (X - M, the value of exports minus imports). The AD curve is downward-sloping: as the price level falls, the total quantity of output demanded rises, due to the wealth effect, interest rate effect, and international trade effect. Aggregate supply (AS) represents the total quantity of goods and services that firms are willing and able to produce at a given price level. Short-run AS (SRAS) is upward-sloping, as higher prices make production more profitable, encouraging firms to increase output. Macroeconomic equilibrium occurs where the AD curve intersects the AS curve, determining the equilibrium price level and national income (real output). Shifts in the AD curve are caused by changes in any of its four components, while shifts in AS are caused by changes in production costs, technology, productivity, or other supply-side factors.
Understanding the Question
This 1-mark multiple-choice question describes an economy initially in equilibrium at point E, which is the intersection of the AD1 and AS1 curves on the provided AD/AS diagram. The government reduces its defence expenditure, and the task is to identify which labelled point (A, B, C or D) represents the new macroeconomic equilibrium. The question tests knowledge of what determines shifts in the AD curve, and how to locate the new equilibrium after such a shift. There is no change to aggregate supply in this scenario, as the policy change is a demand-side fiscal policy adjustment.
Approach
To solve this question, first recall that government expenditure (G) is a direct component of aggregate demand. A reduction in G will lower total AD at every price level, causing the AD curve to shift leftwards (inwards). Since the change is to a demand-side component, the AS curve will not shift. The new equilibrium is therefore the point where the new left-shifted AD curve intersects the original AS1 curve. Match this intersection to the labelled points on the diagram to select the correct option.
Step-by-Step Reasoning
- First confirm the components of aggregate demand: AD = C + I + G + (X - M). Government expenditure (G) is one of the four components, so any change in G will directly affect the total level of AD.
- The government is reducing its expenditure, so G falls. This means that at every price level, the total quantity of goods and services demanded is lower than before.
- A fall in AD is represented by a leftward (inward) shift of the AD curve. On the diagram, AD1 is the original AD curve, and AD2 is the curve to the left of AD1, so the new AD curve after the spending cut is AD2. AD3 is further left, but a standard reduction in G would not shift AD to that extent, so AD2 is the relevant curve.
- The change is a demand-side policy change, so there is no reason for the short-run aggregate supply curve to shift. AS1 remains the relevant supply curve.
- The new equilibrium is the intersection of the new AD curve (AD2) and the original AS curve (AS1). Looking at the diagram, this intersection is point A.
- The other points are incorrect: point B is the intersection of AD1 and AS2 (a rightward shift in AS, which is not caused by a fall in G); point C is the intersection of AD2 and AS2 (both AD and AS have shifted, which is not the case here); point D is the intersection of AD3 and AS1 (AD has shifted too far left, which is inconsistent with a standard reduction in G).
Key Takeaways
- Government expenditure is a core component of aggregate demand, so changes in G will shift the AD curve: higher G shifts AD right, lower G shifts AD left.
- A shift in AD leads to a new equilibrium at the intersection of the shifted AD curve and the existing AS curve, unless there is also a shift in AS.
- When analysing AD/AS changes, first identify whether the change is demand-side or supply-side to determine which curve shifts, and in which direction.
Common Mistakes
- Confusing a shift in AD with a shift in AS: Some students may incorrectly think a change in government spending affects AS, leading them to select points B or C which involve a shift in AS. Government spending changes are demand-side, so only AD shifts.
- Getting the direction of the AD shift wrong: A reduction in G reduces AD, so the shift is leftward, not rightward. Selecting point B (which is on the original AD1) would be incorrect as it does not reflect the lower AD.
- Matching the shifted AD to the wrong AS curve: Point C uses the shifted AD2 but also a shifted AS2, which is not relevant here as AS does not change.
Things to Be Careful About
- Always link the policy change to the correct curve: fiscal policy changes (taxes, government spending) affect AD, while supply-side policies (training, infrastructure) or changes in production costs affect AS.
- When identifying the new equilibrium, always use the original AS curve unless the question specifies a change to supply-side conditions.
- Check the direction of the shift carefully: a cut in government spending reduces AD, so the new AD curve is to the left of the original, not the right.
The number of people employed in a country and the level of unemployment both decrease.
What could explain this?
Options
A net inward immigration
B an increase in the level of unemployment benefits
C an increase in the age at which state pensions are payable
D an increase in the number of university students
Reasoning
The level of unemployment is the number of people who are out of work and actively seeking work. If employment and unemployment both decrease, the total labour force (employed + unemployed) must have decreased.
Option D – an increase in the number of university students – means that some people who were previously in the labour force (either employed or unemployed) leave the labour force to study full-time. They are no longer counted as either employed or unemployed, so both figures fall.
Option A (net inward immigration) would increase both employment and unemployment, not decrease both. Option B (increase in unemployment benefits) might reduce the incentive to seek work, which could reduce unemployment if people stop looking, but it would not directly reduce employment. Option C (increase in the age at which state pensions are payable) would keep older workers in the labour force longer, increasing both employment and unemployment.
Answer
D
D
Background Concept
In economics, the labour force consists of those who are employed plus those who are unemployed and actively seeking work. The unemployment rate is the percentage of the labour force that is unemployed. A key point is that the number of unemployed can fall either because more people find jobs (employment rises) or because people leave the labour force (e.g., become students, retire early, stop looking for work). Similarly, employment can fall without unemployment rising if people leave the labour force. The measurement of unemployment depends on the definition of the labour force, and changes in the labour force can obscure the relationship between employment and unemployment.
Understanding the Question
The question presents a scenario where both the number of people employed and the level of unemployment decrease. This is a puzzle because normally if employment falls, we would expect unemployment to rise (as more people are out of work). For both to fall, something must be happening to the labour force. The question asks: what could explain this simultaneous decrease? The correct answer is the one that causes a reduction in the labour force. Option D, an increase in the number of university students, means that people who were previously part of the labour force (either employed or unemployed) leave to study, so they are no longer counted in either category. The other options would either increase the labour force (A, C) or not directly affect employment (B).
Approach
To solve this, we need to understand the definition of unemployment and how it is measured. We then consider each option in turn, asking: does this option increase or decrease the labour force? If it increases the labour force, both employment and unemployment would likely rise (or at least not both fall). If it decreases the labour force, both could fall. The only option that clearly reduces the labour force is D.
Step-by-Step Reasoning
- Define the labour force: employed + unemployed (those actively seeking work).
- The scenario: employed falls, unemployed falls. This implies that the labour force has shrunk by more than the fall in employment.
- Evaluate each option:
- Option A: Net inward immigration increases the number of people in the country, many of whom will join the labour force. This would tend to increase both employment and unemployment, not decrease both.
- Option B: An increase in unemployment benefits might reduce the incentive to search for work, so some unemployed people might stop looking and leave the labour force. This could reduce unemployment. However, it does not directly reduce employment; employment might remain unchanged or even rise if the benefits are funded by taxes that reduce labour demand. The question says both decrease, so this option does not explain a fall in employment.
- Option C: An increase in the retirement age keeps older workers in the labour force longer. This would increase the labour force, so both employment and unemployment would likely increase (or at least not both fall).
- Option D: An increase in the number of university students means that some people who were previously employed or unemployed leave the labour force to study full-time. They are not counted as employed or unemployed, so both figures fall. This directly explains the scenario.
- Therefore, D is the correct answer.
Key Takeaways
- The labour force is not the entire population; it excludes those not seeking work (e.g., students, retirees, homemakers).
- Changes in the labour force can cause employment and unemployment to move in the same direction.
- When analysing employment and unemployment data, always consider whether the labour force itself has changed.
- This question tests the ability to apply definitions rather than recall facts.
Common Mistakes
- Mistaking employment for the labour force. Some students might think that if employment falls, unemployment must rise, forgetting that people can leave the labour force.
- Choosing option B because they think unemployment benefits reduce the incentive to work and thus reduce unemployment, but they forget that employment must also fall for the scenario to hold.
- Choosing option A because they think immigration increases the labour force, but they might not realise that both employment and unemployment would increase.
Things to Be Careful About
- The exact wording: "the level of unemployment" refers to the number of unemployed, not the unemployment rate. Both fall.
- The distinction between stock and flow: employment and unemployment are stocks. The flows are hiring, firing, and labour force entry/exit.
- In multiple-choice questions, always test each option against the scenario, not just the one that seems plausible.
- Remember that students are not counted as unemployed if they are not actively seeking work.
Which circumstances would most help a firm to gain from a depreciation of the exchange rate?
Options
A It sells mainly abroad and relies on domestic suppliers for inputs.
B It sells mainly abroad and relies on foreign suppliers for inputs.
C It sells mainly in its home market and relies on domestic suppliers for inputs.
D It sells mainly in its home market and relies on foreign suppliers for inputs.
Answer
A depreciation of the exchange rate makes a country's exports cheaper in foreign currency and imports more expensive in domestic currency. A firm that sells mainly abroad will see its revenue increase because its goods become more competitive internationally. If it also relies on domestic suppliers for inputs, its costs are not affected by the rise in import prices. Therefore, its profit margin improves. Option A describes exactly this combination. Option B: relies on foreign suppliers, so costs rise, offsetting revenue gain. Option C: sells at home, so no direct benefit from cheaper exports, but costs unchanged. Option D: sells at home and uses foreign inputs, so costs rise with no revenue benefit. Hence, A is correct.
A
Background Concept
An exchange rate is the price of one currency in terms of another. A depreciation means the domestic currency becomes less valuable relative to foreign currencies, so it takes more domestic currency to buy the same amount of foreign currency. This has two immediate effects:
- Exports become cheaper for foreign buyers (because they need less of their own currency to buy the same amount of domestic goods).
- Imports become more expensive for domestic buyers (because they need more domestic currency to buy the same amount of foreign goods).
For a firm, the impact of depreciation depends on where it sells its output and where it sources its inputs. If the firm sells abroad, it benefits from increased demand due to lower prices. If it uses imported inputs, its costs rise. The net effect on profit depends on which effect dominates.
Understanding the Question
This multiple-choice question asks which combination of sales market and input source would most help a firm gain from a depreciation of the exchange rate. The four options cover all possible combinations:
- A: sells abroad, uses domestic inputs.
- B: sells abroad, uses foreign inputs.
- C: sells at home, uses domestic inputs.
- D: sells at home, uses foreign inputs.
The task is to select the one where the firm's profit is most likely to increase.
Approach
First, recall the two effects of depreciation: makes exports cheaper (boosts revenue for exporters) and makes imports dearer (raises costs for importers). Then evaluate each option by considering the net effect on profit:
- Revenue effect: positive if the firm sells abroad, unchanged if it sells at home (since domestic prices are not directly affected by depreciation).
- Cost effect: negative if the firm uses foreign inputs, unchanged if it uses domestic inputs.
The combination that maximises the net gain is the one where the revenue effect is positive and the cost effect is neutral. That is option A.
Step-by-Step Reasoning
-
Depreciation of the domestic currency: the domestic currency becomes weaker, so one unit of foreign currency buys more domestic currency. For example, if the exchange rate changes from $1 = 1.5 to $1 = 2.0, a foreign buyer now needs fewer dollars to buy the same domestic good. Hence, demand for exports increases. For a firm selling abroad, revenue rises (assuming some demand elasticity).
-
If the firm relies on domestic suppliers for inputs, its input prices are unchanged because they are priced in domestic currency. Therefore, its costs remain constant. The profit margin increases.
-
Option A matches this: sells abroad (revenue up) and uses domestic inputs (costs unchanged). So the firm gains.
-
Option B: sells abroad (revenue up) but uses foreign inputs (costs up because imports are now more expensive). The net effect is ambiguous; the gain may be partially or fully offset, so it is not the most helpful circumstance.
-
Option C: sells at home (revenue unchanged) and uses domestic inputs (costs unchanged). No change in profit; the firm does not gain or lose.
-
Option D: sells at home (revenue unchanged) and uses foreign inputs (costs up). Profit falls, so the firm loses.
Thus, only option A unambiguously improves the firm's profit.
Key Takeaways
- Exchange rate depreciation benefits exporters and hurts importers.
- A firm's net gain depends on whether its revenue or cost side is more exposed to the exchange rate.
- The ideal scenario for a firm to profit from depreciation is to have export revenue and domestic-sourced inputs.
Common Mistakes
- Confusing depreciation with appreciation: depreciation means the domestic currency falls in value, making exports cheaper, not more expensive.
- Thinking that selling abroad automatically means profit increases, without considering the impact on input costs if inputs are imported.
- Failing to consider that selling at home does not directly benefit from depreciation (unless the firm faces import competition, but that is not part of the question).
Things to Be Careful About
- The question asks for the circumstance that would most help the firm gain. Option B could potentially still lead to a gain if the increase in revenue outweighs the increase in costs, but it is not the most helpful because the cost increase reduces the net benefit. Option A provides a pure gain with no cost increase.
- The distinction between domestic and foreign suppliers: domestic suppliers' prices are in domestic currency, so they are unaffected by exchange rate changes. Foreign suppliers' prices are in foreign currency, so they become more expensive when the domestic currency depreciates.
- The question assumes ceteris paribus: other factors (like demand elasticity, pass-through) are not considered. The answer is based on the direct effects.
A country has a floating exchange rate. Its current account on the balance of payments moves from a surplus to a deficit.
Which rate is likely to increase in the short run as a consequence of this worsening of its current account?
Options
A economic growth rate
B exchange rate
C interest rate
D unemployment rate
Reasoning
A worsening of the current account from surplus to deficit means net exports (X - M) fall. With a floating exchange rate, the deficit puts downward pressure on the currency as demand for foreign currency rises. The exchange rate therefore depreciates, not increases — eliminating option B.
The fall in net exports is a reduction in aggregate demand (AD = C + I + G + (X - M)). Assuming no immediate offset from other components, AD shifts left. A fall in AD reduces real output and, in the short run, raises unemployment (cyclical unemployment). Hence the unemployment rate is likely to increase — option D.
Economic growth (option A) falls, not rises. The interest rate (option C) is not directly affected by a current account deficit in a floating rate system; the central bank does not adjust interest rates to defend the currency. Therefore only D is correct.
Answer
D
D
Background Concept
The current account of the balance of payments records trade in goods, services, primary income, and secondary income. A surplus means exports exceed imports (plus net income flows), while a deficit means the opposite.
Under a floating exchange rate, the value of the currency is determined by market forces of demand and supply. A current account deficit implies an excess supply of the domestic currency (importers selling domestic currency to buy foreign currency), which causes the domestic currency to depreciate.
Aggregate demand (AD) is the total spending in the economy: AD = C + I + G + (X - M). A fall in net exports (X - M) directly reduces AD. In the short run, when the price level and wages are sticky, a fall in AD leads to a lower level of real output and higher unemployment (cyclical unemployment).
Unemployment is measured as the number of people without jobs who are actively seeking work. A rise in unemployment is a key macroeconomic indicator of economic downturn.
Understanding the Question
The question asks: when a country with a floating exchange rate sees its current account move from surplus to deficit, which of four rates is likely to increase in the short run?
The four options are: economic growth rate (A), exchange rate (B), interest rate (C), and unemployment rate (D). The answer hinges on understanding the causal chain from a current account deficit to each of these variables.
Approach
First, identify the direct effect of the current account deficit on the exchange rate: under floating, the deficit causes the currency to depreciate (fall), not appreciate (rise) — so option B can be eliminated.
Second, consider the impact on aggregate demand: net exports fall, so AD falls. A fall in AD reduces real output and employment — meaning the unemployment rate rises, and the economic growth rate falls (not rises). So D is correct, and A is incorrect.
Third, consider interest rates: in a pure floating exchange rate system, the central bank does not target the exchange rate, so there is no automatic link from a current account deficit to a rise in interest rates. Option C is therefore unlikely.
Step-by-Step Reasoning
-
Current account deficit and the exchange rate (option B)
- A deficit means the value of imports exceeds the value of exports (plus net income flows). To purchase imports, domestic residents sell their currency and buy foreign currency, increasing the supply of the domestic currency on the foreign exchange market and increasing demand for foreign currency. This excess supply of the domestic currency causes its price (the exchange rate) to fall — i.e., the currency depreciates. Since the question asks which rate increases, and the exchange rate decreases, option B is incorrect.
-
Current account deficit and aggregate demand
- Net exports (X - M) are a component of aggregate demand. A move from surplus to deficit means (X - M) falls (or becomes negative). AD thus decreases. Graphically, the AD curve shifts left. In the short run, with sticky wages and prices, this leads to a lower equilibrium level of real GDP. The economy moves to a point with lower output and a higher price level effect (though price level may also fall depending on the slope of SRAS). The fall in output means fewer workers are needed, so unemployment rises.
-
Economic growth (option A)
- Economic growth is measured by the rate of increase in real GDP. A fall in AD reduces real GDP, so the growth rate would likely fall, not increase. Therefore option A is incorrect.
-
Unemployment (option D)
- As argued, the fall in output leads to layoffs and reduced hiring, so the unemployment rate rises. This is cyclical unemployment, caused by a deficiency of aggregate demand. Therefore option D is correct.
-
Interest rate (option C)
- In a floating exchange rate system, the central bank does not have a commitment to maintain a particular exchange rate. It can set interest rates independently to target domestic objectives like inflation or employment. There is no automatic mechanism that forces interest rates to rise as a direct consequence of a current account deficit. If the central bank pursued an inflation target, a depreciation might raise import prices and thus inflation, potentially leading to higher interest rates later — but this is not a short-run direct consequence. The question asks for the rate likely to increase in the short run as a direct consequence, so C is not appropriate.
Key Takeaways
- A current account deficit under a floating exchange rate leads to a depreciation of the currency (the exchange rate falls, not rises).
- The deficit reduces net exports, which reduces aggregate demand, lowering output and raising unemployment in the short run.
- Economic growth rate falls, not rises, as a result of lower output.
- Interest rates are not automatically linked to current account deficits under floating rates.
- This question tests the ability to chain together balance of payments, exchange rate determination, AD/AS, and unemployment.
Common Mistakes
- Confusing depreciation with appreciation: thinking that a current account deficit strengthens the currency. In reality, it weakens it because importers sell the currency.
- Assuming that a current account deficit always leads to higher interest rates (as in a fixed exchange rate system where the central bank might raise rates to defend the currency). In a floating system, this is not necessary.
- Thinking that a current account deficit is a sign of economic strength and thus growth will increase. In many cases, a deficit can be associated with high growth if imports are driven by strong demand, but the question asks specifically about the consequence of the worsening from surplus to deficit — which means net exports fall, hurting AD and growth.
- Forgetting the short-run focus: in the long run, the economy might adjust through exchange rate changes and other mechanisms, but the question explicitly limits to the short run.
Things to Be Careful About
- Distinguish between the effect on the exchange rate (falls) and the effect on the unemployment rate (rises). The question asks which rate increases, so only unemployment fits.
- Remember that AD = C + I + G + (X - M). A change in net exports directly shifts AD.
- In the short run, the SRAS curve is assumed to be upward-sloping (not perfectly vertical), so a fall in AD reduces output and raises unemployment, with a possible fall in the price level.
- Be precise about 'short run' — the question limits the time horizon, so longer-run adjustments (such as the J-curve effect or automatic stabilisers) are not considered.
- The exchange rate is a price, and its direction of change matters: a depreciation means the exchange rate falls, an appreciation means it rises.
- For MCQs, eliminate clearly wrong options to narrow down to the correct one.
Which policy is most likely to reduce a balance of payments deficit without causing inflation?
Options
A decreased import quotas
B depreciation of currency
C higher interest rates
D decreased import tariffs
Working
Higher interest rates are a contractionary monetary policy tool. They reduce aggregate demand by discouraging borrowing and spending, which reduces imports and thus improves the balance of payments current account. At the same time, lower aggregate demand reduces demand-pull inflation, so the policy does not cause inflation; it helps to reduce it. In contrast, depreciation of the currency would increase import prices and could cause cost-push inflation. Decreased import quotas and tariffs restrict the supply of imported goods, which can raise prices and cause inflation. Therefore, higher interest rates are the most likely to reduce a balance of payments deficit without causing inflation.
Answer
C
C
Background Concept
Balance of payments deficit occurs when a country's imports of goods, services, and income transfers exceed its exports. Policies to reduce a deficit can be categorised as expenditure-switching (e.g., depreciation, tariffs, quotas) or expenditure-reducing (e.g., contractionary fiscal or monetary policy). Inflation is a sustained increase in the general price level. Policies that affect the balance of payments can also affect inflation, especially if they change import prices or aggregate demand. Understanding the dual impact of each policy is essential to answer this question.
Understanding the Question
This multiple-choice question asks which policy is most likely to reduce a balance of payments deficit without causing inflation. The key word is 'without causing inflation' – we must select a policy that does not lead to higher prices. The options are: decreased import quotas, depreciation of currency, higher interest rates, and decreased import tariffs. The correct answer is higher interest rates because it reduces aggregate demand, lowering both imports and inflationary pressure simultaneously.
Approach
We will evaluate each policy option based on its impact on the balance of payments and inflation:
-
A: Decreased import quotas – Quotas limit the quantity of imports, so they reduce the deficit by restricting the volume of imports. However, by reducing the supply of imported goods, they can push up prices of those goods and potentially lead to inflation, especially if domestic substitutes are not readily available. This policy would likely cause inflation.
-
B: Depreciation of currency – Depreciation makes exports cheaper and imports more expensive, which improves the current account as exports rise and imports fall. However, the higher price of imports directly increases the cost of imported inputs and consumer goods, which can cause cost-push inflation. It also may increase demand for exports, leading to demand-pull inflation if the economy is near full capacity. So depreciation typically causes inflation.
-
C: Higher interest rates – This is a contractionary monetary policy. Higher interest rates reduce borrowing and spending, leading to lower aggregate demand. Lower aggregate demand reduces the demand for imports, improving the current account. At the same time, lower aggregate demand reduces demand-pull inflation. If the currency appreciates due to higher interest rates, import prices fall, further reducing inflation. Thus, higher interest rates reduce the deficit without causing inflation; they may even reduce inflation.
-
D: Decreased import tariffs – Tariffs are taxes on imports; reducing them would lower the price of imported goods, which could reduce inflation. However, lower tariffs would increase the volume of imports, worsening the trade deficit. Therefore, this policy would not reduce the deficit; it would increase it. So D is clearly not the answer.
Thus, only option C meets both criteria: reducing the deficit without causing inflation.
Step-by-Step Reasoning
(We'll expand on each policy's mechanism in detail. For each, we can show the chain of reasoning.)
Option A: Decreased import quotas
- Quotas are a direct restriction on import quantities.
- Effect on deficit: If the quota is reduced, fewer imports enter, so the value of imports falls, improving the trade balance.
- Effect on inflation: The reduced supply of imported goods, assuming demand remains, causes prices of those goods to rise. This can feed into overall inflation if imported goods are significant in the consumption basket or are used as inputs. Domestic producers may also raise prices due to reduced competition. Therefore, inflation is likely.
Option B: Depreciation of currency
- Depreciation means the domestic currency loses value relative to foreign currencies.
- Effect on deficit: Exports become cheaper to foreign buyers, so export quantity rises; imports become more expensive, so import quantity falls. Provided the Marshall-Lerner condition holds (sum of PED for exports and imports > 1), the current account improves.
- Effect on inflation: The higher price of imports directly increases the cost of imported consumer goods and raw materials. This raises the general price level through cost-push inflation. Additionally, increased export demand may boost aggregate demand, causing demand-pull inflation if the economy is at or near full capacity. So depreciation causes inflation.
Option C: Higher interest rates
- Interest rates are a tool of monetary policy. Higher rates increase the cost of borrowing and the return on saving, reducing consumption and investment.
- Effect on deficit: Lower aggregate demand reduces the demand for all goods, including imports. Therefore, import spending falls, improving the current account. Additionally, higher interest rates may attract foreign capital, causing the currency to appreciate. An appreciation makes imports cheaper, further reducing import spending and improving the trade balance (though the effect on exports is ambiguous; but overall, the net effect is usually an improvement in the current account).
- Effect on inflation: Lower aggregate demand reduces demand-pull inflation. If the currency appreciates, cheaper import prices also reduce cost-push inflation. Thus, higher interest rates reduce inflation, not cause it.
Option D: Decreased import tariffs
- Tariffs are taxes on imports. Reducing them lowers the price of imported goods.
- Effect on deficit: Lower tariffs make imports cheaper, so the quantity of imports rises, worsening the trade deficit. This is the opposite of what is needed.
- Effect on inflation: Lower import prices reduce the cost of imported goods, which can reduce inflation in the short term. However, because the deficit worsens, this policy fails to achieve the primary objective. Therefore, it is not suitable.
Key Takeaways
- Contractionary monetary policy (higher interest rates) can address both a balance of payments deficit and inflation simultaneously, making it a powerful tool when both problems exist.
- Expenditure-switching policies like depreciation and protectionism often cause inflation because they raise import prices or reduce supply.
- When evaluating policies, always consider their impact on multiple macroeconomic objectives.
- The 'most likely' phrasing requires a comparative assessment of all options.
Common Mistakes
- Assuming that depreciation always improves the current account without considering its inflationary consequences. The Marshall-Lerner condition is necessary for the current account to improve, but even if it does, inflation is a likely side effect.
- Forgetting that tariffs and quotas raise prices, leading to inflation. Both are protectionist measures that restrict supply and can cause cost-push inflation.
- Confusing expenditure-reducing policies (contractionary monetary/fiscal) with expenditure-switching policies. Expenditure-reducing policies lower overall demand, which reduces imports and inflation, while expenditure-switching policies redirect demand but may raise prices.
- Thinking that decreasing import tariffs would reduce the deficit – it would actually increase imports and worsen the deficit.
Things to Be Careful About
- The question asks 'without causing inflation' – so even if a policy reduces the deficit, if it causes inflation, it is not the correct answer.
- Higher interest rates may have a contractionary effect on the economy, potentially causing unemployment, but the question does not ask about other objectives. Focus only on the deficit and inflation.
- Note that the question says 'most likely' – there may be circumstances where the other policies might not cause inflation (e.g., if the economy is in a recession, depreciation might not cause inflation if there is spare capacity), but in general, higher interest rates are the safest bet.
- Be precise with terminology: depreciation is a fall in the currency under floating exchange rates; tariffs and quotas are protectionist; interest rates are monetary policy.
The table shows the average price of exports and imports.
Which combination of changes in export prices and import prices could result in a country’s terms of trade increasing from 100 to 110?
Options
| the average price of exports | the average price of imports | |
|---|---|---|
| A | falls by 5% | rises by 5% |
| B | remains unchanged | rises by 10% |
| C | rises by 5% | falls by 5% |
| D | rises by 10% | remains unchanged |
Working
The terms of trade (TOT) index is calculated as:
TOT = (average export price / average import price) × 100
Starting from 100, the ratio of export to import prices is 1. To rise to 110, the new ratio must be 1.1.
Test each option, assuming initial export price = E and initial import price = I:
- Option A: exports fall 5% → 0.95E; imports rise 5% → 1.05I. New TOT = (0.95E / 1.05I) × 100 = 90.5. This is a decrease.
- Option B: exports unchanged → E; imports rise 10% → 1.1I. New TOT = (E / 1.1I) × 100 = 90.9. This is a decrease.
- Option C: exports rise 5% → 1.05E; imports fall 5% → 0.95I. New TOT = (1.05E / 0.95I) × 100 = 110.5. This is an increase, but not exactly 110.
- Option D: exports rise 10% → 1.1E; imports unchanged → I. New TOT = (1.1E / I) × 100 = 110. This is exactly 110.
Only Option D yields a precise increase from 100 to 110.
Answer
D
D
Background Concept
The terms of trade (TOT) measure the relative price of a country's exports compared to its imports. It is usually expressed as an index number:
[ \text{TOT} = \frac{\text{average export price}}{\text{average import price}} \times 100 ]
A rise in the index (e.g., from 100 to 110) means that export prices have increased relative to import prices – the country can buy more imports for the same quantity of exports. This is called an improvement in the terms of trade. A fall means the opposite.
Understanding the Question
The question provides a table of possible percentage changes in the average price of exports and imports. We are asked which combination would cause the terms of trade index to increase from 100 to 110. The initial index is 100, implying the ratio of export to import prices is 1. To reach 110, the new ratio must be 1.1. We need to find which change in export and import prices produces that ratio.
Approach
We will define the initial export price as E and import price as I. For each option, apply the given percentage change to both prices, then compute the new TOT index. Compare the result to 110. Only the option that gives exactly 110 is correct.
Step-by-Step Reasoning
-
Recall the formula: TOT = (export price / import price) × 100.
-
Initial TOT = 100 → (E / I) × 100 = 100 → E / I = 1.
-
For each option, calculate the new ratio after the changes.
Option A: Exports fall 5% → 0.95E; imports rise 5% → 1.05I.
New TOT = (0.95E / 1.05I) × 100 = (0.95/1.05) × 100 ≈ 90.5. This is a decrease, not an increase to 110.Option B: Exports unchanged → E; imports rise 10% → 1.1I.
New TOT = (E / 1.1I) × 100 = (1/1.1) × 100 ≈ 90.9. Again a decrease.Option C: Exports rise 5% → 1.05E; imports fall 5% → 0.95I.
New TOT = (1.05E / 0.95I) × 100 = (1.05/0.95) × 100 ≈ 110.5. This is an increase, but not exactly 110. The question asks specifically for an increase from 100 to 110, so this option overshoots.Option D: Exports rise 10% → 1.1E; imports unchanged → I.
New TOT = (1.1E / I) × 100 = 1.1 × 100 = 110. Exactly 110. -
Only Option D gives the precise target.
Key Takeaways
- The terms of trade index is calculated as the ratio of export prices to import prices, multiplied by 100.
- An improvement in the terms of trade means export prices rise relative to import prices.
- When working with percentage changes, it is essential to apply them correctly to the numerator and denominator.
Common Mistakes
- Confusing the numerator and denominator: a rise in export prices improves the terms of trade; a rise in import prices worsens it.
- Miscalculating combined percentage changes: a 5% rise in exports and a 5% fall in imports does not give a 10% increase in the index; it gives (1.05/0.95) ≈ 1.1053, a 10.53% increase.
- Not checking the exact numerical outcome: the question asks for a result of 110, not just any increase.
Things to Be Careful About
- Always use the correct formula: (export price / import price) × 100.
- When comparing options, calculate the exact index value, not just whether it is higher or lower.
- Remember that the initial index of 100 implies the ratio of prices is 1, so a 10% increase in the index requires a 10% increase in the ratio.
What is not an example of protectionism?
Options
A the European Union (EU) requiring goods imported into member states to meet safety standards
B the Pakistan government increasing the rate of goods and services tax (GST) on some exported goods from 2% to 5%
C the Nigeria government banning the import of packaged sugar
D the US imposing a 35% tariff on tyres imported from China
Reasoning
Protectionism refers to government policies that restrict international trade, typically to protect domestic industries from foreign competition. Common examples include tariffs on imports, import quotas, embargoes, and excessive administrative burdens ('red tape') that make importing difficult.
Option A describes safety standards that, while they may act as a barrier, are primarily regulatory requirements; however, the EU's safety standards are a form of non-tariff barrier and are often considered protectionist in effect. Option C is an outright import ban, a clear protectionist measure. Option D is a tariff on imports, a classic protectionist tool.
Option B, however, is a tax on exports — an increase in the goods and services tax on goods sold abroad. This does not restrict imports or protect domestic industries from foreign competition; it makes domestic exports more expensive, which is the opposite of protectionism. It is a domestic fiscal measure, not a trade barrier.
Answer
B
B
Background Concept
Protectionism is the set of government policies designed to restrict or discourage international trade, with the aim of shielding domestic producers from foreign competition. The main instruments of protectionism are:
- Tariffs: taxes on imported goods, raising their price and making domestic substitutes relatively cheaper.
- Import quotas: physical limits on the quantity of a good that can be imported.
- Embargoes: complete bans on trade with a particular country or on specific goods.
- Export subsidies: payments to domestic producers that allow them to sell abroad at artificially low prices, which can be considered a form of protectionism because it distorts trade.
- Excessive administrative burdens ('red tape'): complex regulations, licensing requirements, or safety standards that are disproportionately costly for foreign firms to meet, effectively acting as non-tariff barriers.
A tax on exports, by contrast, is not a protectionist measure. It raises the cost of domestically produced goods sold abroad, making them less competitive in international markets. This is a domestic fiscal policy — it may be used to raise revenue, discourage the export of certain raw materials, or manage the balance of payments — but it does not protect domestic industries from imports.
Understanding the Question
The question asks which of the four options is not an example of protectionism. This is a straightforward recognition question. The candidate must know the definition of protectionism and be able to identify which policy does not fit. The key is to notice that three of the options involve restrictions on imports (or, in the case of safety standards, a non-tariff barrier that makes importing harder), while one involves a tax on exports.
Approach
- Recall the definition of protectionism: policies that restrict imports to protect domestic industries.
- Examine each option in turn:
- Option A: EU safety standards on imports — a non-tariff barrier (protectionist).
- Option B: Pakistan increasing GST on exported goods — a tax on exports, not on imports.
- Option C: Nigeria banning the import of packaged sugar — an import ban (protectionist).
- Option D: US imposing a 35% tariff on tyres from China — a tariff on imports (protectionist).
- Identify the odd one out: Option B is the only one that does not restrict imports.
Step-by-Step Reasoning
-
Option A: The EU requires imported goods to meet safety standards. While safety standards can have legitimate public health objectives, they are often used (or can be used) as a non-tariff barrier to trade. If the standards are more burdensome for foreign producers than for domestic ones, they act as a form of protectionism. In the context of this question, this is considered an example of protectionism (specifically, a non-tariff barrier).
-
Option B: The Pakistan government increases the rate of GST on some exported goods from 2% to 5%. This is a tax on goods being sold abroad. It does not affect imports at all. It makes Pakistani exports more expensive, reducing their competitiveness. This is the opposite of protectionism — it is a domestic tax policy. Therefore, it is not an example of protectionism.
-
Option C: The Nigeria government bans the import of packaged sugar. This is an outright import ban, which is a very strong form of protectionism. It completely prevents foreign sugar from entering the Nigerian market, protecting domestic sugar producers.
-
Option D: The US imposes a 35% tariff on tyres imported from China. A tariff is a tax on imports, raising their price and making domestically produced tyres relatively cheaper. This is a classic protectionist measure.
Key Takeaways
- Protectionism is about restricting imports to protect domestic industries.
- A tax on exports is not protectionism; it is a domestic fiscal policy that may harm domestic exporters.
- Common protectionist tools include tariffs, quotas, embargoes, and non-tariff barriers (e.g., excessive safety standards, red tape).
- Always distinguish between policies that affect imports and those that affect exports.
Common Mistakes
- Confusing a tax on exports with a tariff. A tariff is specifically a tax on imports. A tax on exports is a different policy instrument.
- Assuming that any government intervention in trade is protectionist. Not all trade-related policies are protectionist — some are fiscal, some are regulatory with legitimate non-trade objectives.
- Overthinking Option A: some students might argue that safety standards are not protectionist if they are genuinely about safety. However, in the context of this question, the EU's requirement is presented as a barrier to imports, and it is the only option that could be debated. The key is that Option B is clearly not protectionist, making it the correct answer.
Things to Be Careful About
- Read each option carefully. Note the direction of the policy: is it on imports or exports?
- Remember that protectionism is about restricting imports. Any policy that makes it harder or more expensive to bring goods into a country is potentially protectionist. Any policy that affects exports is not, by definition, protectionism.
- Do not confuse 'goods and services tax' (GST) with a tariff. GST is a domestic consumption tax; a tariff is a tax on imports.
Turkey imported $220 million worth of goods and services. Turkey exported $12 million worth of goods and services during the same period. Its net income was -$15 million.
What is Turkey’s current account balance?
Options
A -$223 million
B -$217 million
C +$208 million
D +$247 million
Working
Trade balance = exports - imports = $12 million - $220 million = -$208 million.
Net income = -$15 million.
Current account balance = trade balance + net income = (-$208 million) + (-$15 million) = -$223 million.
Answer
A
A
Background Concept
The current account of the balance of payments records all transactions involving the exchange of goods, services, primary income (such as investment earnings and wages) and secondary income (such as transfers) between residents of a country and the rest of the world. The overall current account balance is the sum of the balance of trade in goods and services and the balance on income and transfers. A deficit means the country is a net borrower from the rest of the world; a surplus means it is a net lender.
Understanding the Question
The question gives three pieces of data for Turkey over one period: imports ($220 million), exports ($12 million), and net income (-$15 million). 'Net income' is a primary income item (e.g. profits, dividends, interest, workers' remittances) and is already net — so a negative value means outflows exceed inflows. The task is to combine these into the current account balance. No secondary income (transfers) is given, so we ignore it.
Approach
The current account balance is computed as: (Exports of goods and services - Imports of goods and services) + Net income. This is a standard formula. We first compute the trade balance (exports minus imports), then add net income, taking care with signs.
Step-by-Step Reasoning
- Identify exports: $12 million (credit).
- Identify imports: $220 million (debit; subtract them as a negative).
- Compute trade balance: $12 million - $220 million = -$208 million. This negative signifies a trade deficit.
- Identify net income: -$15 million (also a deficit).
- Sum: current account balance = (-$208 million) + (-$15 million) = -$223 million.
- The negative overall balance means Turkey has a current account deficit of $223 million.
Comparing with options: A is -$223 million; B is -$217 million (incorrect order of magnitude); C is +$208 million (only trade balance with wrong sign); D is +$247 million (wrong signs and addition).
Key Takeaways
- The current account balance is not simply exports minus imports; it also includes net income and transfers.
- Always treat imports as a debit (negative) and exports as a credit (positive).
- 'Net income' is already net, so add it directly with its sign.
- Small arithmetic errors can lead to plausible wrong answers; check signs carefully.
Common Mistakes
- Forgetting to include net income and only looking at trade balance — leads to answer C.
- Adding imports and exports with wrong signs, e.g. 220 + 12 = 232 and then adjusting with -15 to get 217 or 247 — typical sign errors.
- Treating net income as positive when it is given as negative.
Things to Be Careful About
- Use the exact figures provided; do not round or estimate.
- Write down the formula first: current account = (X - M) + net income.
- Check signs: a negative net income reduces the balance; a positive would increase it.
- The unit is millions of dollars; no conversion needed.
The table shows the exchange rate for national currencies per US dollar.
Which currency has the smallest percentage appreciation against the US dollar between 2019 and 2020?
Options
| 2019 | 2020 | |
|---|---|---|
| A | 6.91 | 6.90 |
| B | 70.4 | 74.1 |
| C | 14.4 | 16.5 |
| D | 0.99 | 0.94 |
Working
The exchange rate is given as national currency per US dollar. A fall in the number means the national currency has appreciated (fewer units of national currency are needed to buy one US dollar). The percentage appreciation is calculated as:
Percentage change = (new rate - old rate) / old rate * 100%
A negative result indicates appreciation.
Option A: (6.90 - 6.91) / 6.91 * 100% = -0.01 / 6.91 * 100% ≈ -0.145%
Option B: (74.1 - 70.4) / 70.4 * 100% = 3.7 / 70.4 * 100% ≈ 5.26% (depreciation)
Option C: (16.5 - 14.4) / 14.4 * 100% = 2.1 / 14.4 * 100% ≈ 14.58% (depreciation)
Option D: (0.94 - 0.99) / 0.99 * 100% = -0.05 / 0.99 * 100% ≈ -5.05%
Comparing the appreciations (negative changes):
- Option A: -0.145%
- Option D: -5.05%
Option A has the smallest percentage appreciation (closest to zero).
Answer
A
A
Background Concept
An exchange rate is the price of one currency in terms of another. The table shows the exchange rate expressed as "national currency per US dollar". This means the number tells you how many units of the national currency are needed to buy one US dollar.
- If the number falls (e.g., from 6.91 to 6.90), it means fewer units of the national currency are needed to buy one dollar. This means the national currency has become stronger or appreciated against the dollar.
- If the number rises (e.g., from 70.4 to 74.1), it means more units of the national currency are needed to buy one dollar. This means the national currency has become weaker or depreciated against the dollar.
Percentage change is a standard way to compare changes of different sizes. The formula is:
Percentage change = (new value - old value) / old value * 100%
A negative percentage change indicates an appreciation (the number fell). A positive percentage change indicates a depreciation (the number rose).
Understanding the Question
The question asks: "Which currency has the smallest percentage appreciation against the US dollar between 2019 and 2020?"
- We are given four exchange rates (A, B, C, D) for 2019 and 2020.
- We need to calculate the percentage change for each.
- We only care about currencies that appreciated (the rate fell).".
- Among those that appreciated, we need the one with the smallest percentage change (closest to zero).".
Approach
- For each option, calculate the percentage change from 2019 to 2020.
- Identify which options show a negative change (appreciation).".
- Compare the absolute values of the negative changes. The smallest absolute value is the smallest appreciation.
Step-by-Step Reasoning
Option A:
- Old rate (2019): 6.91
- New rate (2020): 6.90
- Change: 6.90 - 6.91 = -0.01
- Percentage change: (-0.01 / 6.91) * 100% ≈ -0.145%
- This is an appreciation of about 0.145%.
Option B:
- Old rate (2019): 70.4
- New rate (2020): 74.1
- Change: 74.1 - 70.4 = 3.7
- Percentage change: (3.7 / 70.4) * 100% ≈ 5.26%
- This is a depreciation (positive change), so it is not an appreciation. We can ignore it for the question.
Option C:
- Old rate (2019): 14.4
- New rate (2020): 16.5
- Change: 16.5 - 14.4 = 2.1
- Percentage change: (2.1 / 14.4) * 100% ≈ 14.58%
- This is a depreciation, so we ignore it.
Option D:
- Old rate (2019): 0.99
- New rate (2020): 0.94
- Change: 0.94 - 0.99 = -0.05
- Percentage change: (-0.05 / 0.99) * 100% ≈ -5.05%
- This is an appreciation of about 5.05%.
Now compare the appreciations:
- Option A: -0.145%
- Option D: -5.05%
The smallest appreciation (closest to zero) is Option A.
Key Takeaways
- Understand how exchange rate quotations work: "national currency per US dollar" means a fall in the number is an appreciation of the national currency.
- Percentage change is the correct tool to compare changes of different magnitudes.
- Always check the sign of the change to determine if it is an appreciation or depreciation.
- The question asks for the "smallest" appreciation, which is the one with the smallest absolute negative change.
Common Mistakes
- Confusing appreciation and depreciation: A rising number means depreciation, a falling number means appreciation.
- Not calculating percentage change and just looking at the absolute difference. For example, the absolute difference for A is 0.01 and for D is 0.05, but because the base values are different, the percentage change is the correct measure.
- Forgetting to check the sign: Options B and C show depreciation, not appreciation, so they are not candidates.
Things to Be Careful About
- Always identify the direction of the change before calculating.
- Use the correct formula: (new - old) / old * 100%.
- Round appropriately, but keep enough precision to compare.
- The answer is the option letter, not the percentage value.
Your score so far
Answer a question to start scoring
Your marks add up here as you work through the paper.