Economics 9708/11 — October/November 2024
Cambridge AS Level · AS Level Multiple Choice · answer key with instant marking and worked solutions
Topics Production Possibility Curves · Demand and Supply · Fiscal Policy · Balance of Payments · Economic Methodology · Classification of Goods and Services · +15 more
Tap an option under each question to check it — your score builds as you go.
Which statement is a normative statement?
Options
A The annual rate of inflation in Malaysia increased from 2.8% in May 2022 to 3.4%.
B The annual rate of inflation was 3.4% in Malaysia, lower than the 7.7% annual rate of inflation for Thailand.
C The Malaysian Central Bank raised interest rates from 2.0% to 2.25% on 6 July 2022.
D The rise in interest rates in Malaysia in July 2022 is expected to only have a small impact on the rate of inflation.
A positive statement is a factual claim that can be tested or verified, while a normative statement expresses a value judgement or opinion about what ought to be. Options A, B and C are all factual statements that can be checked against data. Option D includes the phrase 'is expected to only have a small impact', which is a subjective judgement about the likely effect of the interest rate rise, making it a normative statement.
Answer
D
D
Background Concept
In economics, statements are classified as either positive or normative. A positive statement is objective and can be tested against evidence. It describes what is, was, or will be, and can be proven true or false by checking data. For example, 'The inflation rate is 3.4%' is positive because we can look up the actual figure. A normative statement is subjective and expresses a value judgement or opinion about what ought to be. It often contains words like 'should', 'ought', 'better', 'fair', or 'expected to' when the expectation is a matter of judgement rather than a testable prediction. Normative statements cannot be verified by facts alone because they depend on personal values.
Understanding the Question
The question asks which of the four statements is a normative statement. Each option is a sentence about economic data or policy. The task is to identify the one that contains a value judgement rather than a purely factual claim. The correct answer is D because it includes the phrase 'is expected to only have a small impact', which is an opinion about the size of the effect, not a verifiable fact.
Approach
Read each option and ask: 'Can this statement be proven true or false by checking data or historical records?' If yes, it is positive. If the statement includes a judgement, opinion, or prescription, it is normative. Look for words that signal subjectivity, such as 'should', 'ought', 'better', 'expected', 'likely', 'unfair', etc.
Step-by-Step Reasoning
-
Option A: 'The annual rate of inflation in Malaysia increased from 2.8% in May 2022 to 3.4%.' This is a factual claim about a change in a specific statistic. It can be verified by looking at official inflation data. Therefore, it is a positive statement.
-
Option B: 'The annual rate of inflation was 3.4% in Malaysia, lower than the 7.7% annual rate of inflation for Thailand.' Again, this is a comparison of two factual figures. It can be checked against published data. Positive statement.
-
Option C: 'The Malaysian Central Bank raised interest rates from 2.0% to 2.25% on 6 July 2022.' This is a statement of a specific policy action on a specific date. It is verifiable by checking central bank announcements. Positive statement.
-
Option D: 'The rise in interest rates in Malaysia in July 2022 is expected to only have a small impact on the rate of inflation.' The phrase 'is expected to only have a small impact' is a judgement about the magnitude of the effect. While it might be based on some analysis, it is not a statement of fact that can be definitively tested at the time it is made. It expresses an opinion or prediction that is inherently subjective. Therefore, it is a normative statement.
Thus, D is the correct answer.
Key Takeaways
- Positive statements are testable; normative statements are value judgements.
- Common normative words: 'should', 'ought', 'better', 'fair', 'expected', 'likely', 'unfair'.
- Even statements that sound like predictions can be normative if they are based on opinion rather than a testable hypothesis.
- In economics, distinguishing positive from normative is important for understanding the difference between objective analysis and policy advocacy.
Common Mistakes
- Mistaking a statement that is false for a normative statement. A false positive statement is still positive because it can be tested and shown to be false. Normative statements cannot be proven true or false.
- Thinking that any statement about the future is normative. Some predictions are based on models and can be tested later, making them positive. The key is whether the statement is a testable hypothesis or a value judgement.
- Overlooking subtle normative language like 'expected to' or 'likely' when they are used as opinions rather than as part of a testable forecast.
Things to Be Careful About
- Read each option carefully for any word that implies a judgement.
- Remember that the same sentence can be positive if it is a factual claim (e.g., 'The policy is expected to reduce inflation by 0.5% according to the central bank's model') but becomes normative if it is the speaker's own opinion without a testable basis.
- In this question, option D is normative because the 'expected' impact is presented as a personal judgement, not as a reference to a specific model or forecast that could be verified.
A firm operating in country S moved its existing capital equipment to a larger factory in country T. It also installed more of the same equipment and increased the size of its workforce.
From the evidence provided, what must be true?
Options
A The firm is operating in the long run.
B The firm is operating in the very long run.
C The firm's division of labour has increased.
D The firm's supply curve has shifted to the left.
Reasoning
The long run is defined as a period in which all factors of production are variable. The very long run additionally involves changes in technology. In the description, the firm moved its existing capital equipment (variable), installed more of the same equipment (no technology change), and increased its workforce (variable). Since all factors are variable but technology is unchanged, the firm must be operating in the long run. Division of labour is not necessarily increased, and the supply curve would likely shift right, not left.
Answer
A
A
Background Concept
In the theory of the firm, economists distinguish between the short run, the long run, and the very long run. The short run is a period during which at least one factor of production is fixed – typically capital (e.g. factory size, machinery). Firms can only change variable factors like labour and raw materials. The long run is a period long enough for all factors of production to be variable: the firm can build new factories, buy more machinery, and hire or fire workers. However, the state of technology is assumed unchanged. The very long run extends beyond the long run and includes changes in technology and the knowledge base – firms can adopt entirely new production methods.
Understanding the Question
The question describes a firm that moves its existing capital equipment to a larger factory in another country, installs more of the same type of equipment, and increases its workforce. We are asked what must be true based on this evidence. The options relate to whether the firm is in the long run, very long run, whether division of labour has increased, or whether the supply curve has shifted left. The key is to apply the definitions of the time periods and see which statement is necessarily true.
Approach
First, identify whether any factor of production is fixed. The firm can change its factory (new larger factory), its capital equipment (they moved it, and can install more), and its labour (increase). All three major categories – land (factory), capital, and labour – are changed, so no factor is fixed. Therefore the firm must be operating in the long run. The very long run would require a change in technology, but the equipment is “the same equipment” – no technological change is mentioned. Division of labour could increase if tasks become more specialised, but that is not a necessary consequence of moving and hiring more workers; it might or might not happen. The supply curve shifting left would mean a decrease in supply, but the firm is expanding its factory and labour force, which would likely increase capacity and shift supply right, not left. So only option A is necessarily true.
Step-by-Step Reasoning
- Definitions: Long run = all factors variable; very long run = all factors variable + technological change; short run = at least one factor fixed.
- Apply to the scenario: The firm moved its capital equipment (so capital is not fixed; it can be relocated and added to). It installed more of the same equipment (increase in capital stock, but no new technology). It increased its workforce (labour is variable). Since both capital and labour are changed, all factors are variable → the firm is in the long run. There is no mention of new technology, so we cannot claim the very long run.
- Review alternatives:
- A: Long run – fits the evidence.
- B: Very long run – requires technological change, not present.
- C: Division of labour has increased – division of labour refers to specialisation of tasks. Increasing the workforce does not automatically mean tasks are more subdivided; it could mean more workers doing the same jobs. Not necessarily true.
- D: Supply curve shifted left – a leftward shift means a decrease in supply at each price. The firm is expanding, so supply is expected to increase (shift right); we cannot infer a left shift.
- Conclusion: Only A must be true.
Key Takeaways
- The distinction between short run, long run, and very long run is based on which factors are variable and whether technology changes.
- To determine the time period, look at what the firm can change: if any factor is fixed, it's short run; if all factors variable but technology constant, it's long run; if technology also changes, it's very long run.
- Be careful not to confuse division of labour (specialisation) with simply having more labour. Division of labour requires a reorganisation of tasks.
Common Mistakes
- Confusing the long run with the very long run: many students think any increase in capital automatically means the very long run. But the very long run specifically involves new technology or knowledge, not just more of the same.
- Thinking that because the firm moved to a larger factory, it must be in the short run because capital is being moved; but the ability to change the factory size shows capital is variable, not fixed.
- Selecting "division of labour has increased" because the workforce increased, ignoring that division of labour is about the specialisation of tasks, not just numbers.
- Selecting supply curve left shift, misunderstanding that expanding capacity shifts supply right.
Things to Be Careful About
- Always apply the definition exactly: short run = fixed factor(s), long run = all variable, very long run = all variable plus technology.
- In multiple-choice questions, "must be true" means only one option is guaranteed. Eliminate options that could be false.
- The command "from the evidence provided" means you should only use what is stated; do not add assumptions (e.g., no technology change is stated, so do not assume the very long run).
Which statement is not correct?
Options
A Addictive drugs are regarded as demerit goods because users are unaware of the full damage they do.
B Air is regarded as a free good because its use has no opportunity cost.
C National defence is regarded as a public good because one citizen 'consuming' it reduces the amount of it available to others.
D Visits to a doctor are regarded as private goods partly because they are rival.
Reasoning
The question asks which statement is not correct. Evaluate each option.
- Option A: Addictive drugs are demerit goods because consumers lack full information about the long-term harm. This is correct.
- Option B: Air is a free good because it is not scarce and its use has zero opportunity cost. This is correct.
- Option C: National defence is a public good, but the statement that one citizen's consumption reduces the amount available to others is incorrect. Public goods are non-rival – one person's consumption does not reduce the quantity available for others. This is the defining property that makes this statement false.
- Option D: Visits to a doctor are private goods partly because they are rival (one person's consultation prevents another from the same appointment at the same time). This is correct.
Therefore, the incorrect statement is C.
Answer
C
C
Background Concept
Goods and services are classified according to two key characteristics: rivalry (whether one person's consumption reduces availability for others) and excludability (whether people can be prevented from consuming). Based on these, we have:
- Private goods: rival and excludable.
- Public goods: non‑rival and non‑excludable. Because of non‑rivalry, one person's consumption does not diminish the quantity available to others. Because of non‑excludability, people cannot be prevented from consuming, leading to the free‑rider problem.
- Free goods: goods that are not scarce; they have zero opportunity cost because they exist in sufficient quantity for everyone without sacrifice.
- Merit goods: goods that are under‑consumed if left to the market because consumers have imperfect information about their long‑term benefits.
- Demerit goods: goods that are over‑consumed because consumers underestimate the long‑term harm, often due to imperfect information.
Understanding the Question
This multiple‑choice question asks you to identify which of four statements about the classification of goods is incorrect. Each statement makes a claim about a specific type of good. You need to know the precise definitions of demerit goods, free goods, public goods and private goods to spot the mistake.
Approach
Read each statement carefully and compare it with the textbook definition of the good it describes. The incorrect statement will contain a characteristic that contradicts the definition. For public goods, the defining feature of non‑rivalry is that one person's consumption does not reduce availability for others. The statement that says it does is therefore wrong.
Step‑by‑Step Reasoning
-
Option A: "Addictive drugs are regarded as demerit goods because users are unaware of the full damage they do." – This is correct. Demerit goods are over‑consumed because consumers have imperfect information about the true costs. Addictive drugs fit this description.
-
Option B: "Air is regarded as a free good because its use has no opportunity cost." – Correct. Air is not scarce; we can breathe it without sacrificing another good. Therefore its opportunity cost is zero, making it a free good.
-
Option C: "National defence is regarded as a public good because one citizen 'consuming' it reduces the amount of it available to others." – Incorrect. National defence is a classic example of a pure public good, but the reason given is wrong. The correct defining features of a public good are non‑rivalry (consumption by one does not reduce the amount left for others) and non‑excludability (it is impossible to exclude anyone from its protection). The statement wrongly asserts rivalry, which is the opposite of the truth. This is the false statement.
-
Option D: "Visits to a doctor are regarded as private goods partly because they are rival." – Correct. A doctor's appointment is rival because one patient's consultation at a given time prevents another from using that same slot. It is also excludable (the clinic can refuse service). Hence it is a private good.
Since option C is the only one that contradicts the definition, it is the answer.
Key Takeaways
- Always distinguish between rival and non‑rival goods. Rivalry means one person's consumption reduces availability for others.
- Public goods are non‑rival and non‑excludable. Private goods are rival and excludable.
- Free goods have zero opportunity cost because they are not scarce.
- Demerit goods involve imperfect information causing over‑consumption.
Common Mistakes
- Assuming that "public" means "provided by the government". The classification is based on economic characteristics, not the provider.
- Confusing rivalry with excludability. A good can be rival but excludable (private good) or non‑rival but excludable (club good), etc.
- Thinking that a free good is one for which you do not pay. The defining criterion is opportunity cost, not price.
Things to Be Careful About
- Read each statement in full. Option C contains a factual error in the justification, not the classification itself; the classification is correct (national defence is a public good) but the reasoning is wrong. The question asks for "not correct" – that includes statements that give a wrong reason even if the classification is right.
- For multiple‑choice questions, eliminate obviously correct statements first, then focus on the remaining candidate.
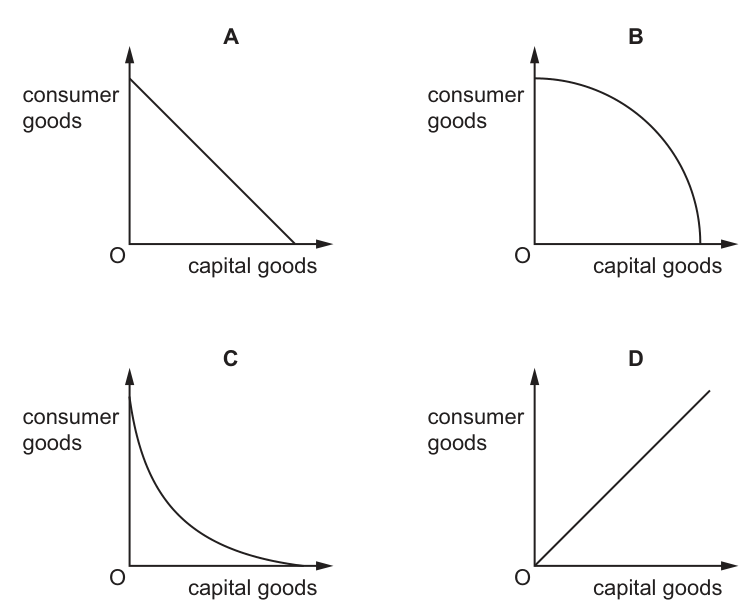
The diagrams show production possibility curves.
Which diagram shows constant opportunity costs?
Options
Working
Constant opportunity cost is represented by a straight-line (linear) production possibility curve because the trade-off between the two goods remains unchanged at all points. Diagram A is a straight downward-sloping line, showing constant opportunity cost. Diagram B (concave to the origin) shows increasing opportunity cost, Diagram C (convex to the origin) shows decreasing opportunity cost, and Diagram D is upward-sloping, which cannot represent a PPC because it implies more of both goods can be obtained simultaneously.
Answer
A
A
Background Concept
A production possibility curve (PPC) shows the maximum possible output combinations of two goods an economy can produce when all resources are fully and efficiently employed, given the current state of technology. The slope of the PPC represents the opportunity cost—what must be given up of the good on the vertical axis to produce one more unit of the good on the horizontal axis.
When opportunity cost is constant, the PPC is a straight line (linear). This occurs when resources are perfectly adaptable between producing the two goods, so the same amount of consumer goods must always be sacrificed to produce an additional unit of capital goods. When opportunity cost increases (the more realistic case), the PPC is concave (bowed outward) to the origin because resources are not perfectly adaptable—as production of one good expands, increasingly unsuitable resources must be used, raising the opportunity cost. A convex (bowed inward) curve would represent decreasing opportunity cost, which is theoretically possible but unusual.
Understanding the Question
The question asks you to identify which of four labelled diagrams (A, B, C, D) shows constant opportunity costs. All diagrams have consumer goods on the vertical axis and capital goods on the horizontal axis. You must match the economic concept of constant opportunity cost to its correct graphical representation.
Approach
Recall that constant opportunity cost corresponds to a linear PPC. Examine each diagram:
- Diagram A: Straight downward-sloping line.
- Diagram B: Concave (bowed outward) curve.
- Diagram C: Convex (bowed inward) curve.
- Diagram D: Straight upward-sloping line.
Select the diagram whose shape matches constant opportunity cost, and be prepared to explain why the others are incorrect.
Step-by-Step Reasoning
Diagram A is correct. A straight-line PPC has a constant slope, meaning the opportunity cost of producing capital goods in terms of consumer goods is the same at every point on the curve. For example, if the line runs from 100 units of consumer goods (when no capital goods are produced) to 100 units of capital goods (when no consumer goods are produced), the economy always gives up 1 unit of consumer goods to gain 1 unit of capital goods, regardless of the production point. This is the definition of constant opportunity cost.
Diagram B is incorrect. This curve is concave to the origin (bowed outward). This shape represents increasing opportunity cost. As the economy produces more capital goods, it must give up increasingly larger amounts of consumer goods because resources are not perfectly adaptable—some resources are better suited to making consumer goods and become scarce as capital goods production expands. This is the standard PPC shape for most real-world economies.
Diagram C is incorrect. This curve is convex to the origin (bowed inward). This would represent decreasing opportunity cost, where the economy gives up less and less consumer goods to produce each additional unit of capital goods. This is rare and not what the question asks for.
Diagram D is incorrect. An upward-sloping line implies a positive relationship between the two goods—producing more capital goods allows more consumer goods to be produced as well. This violates the fundamental economic concept of scarcity and trade-offs that the PPC is designed to illustrate. A PPC must slope downward from left to right.
Key Takeaways
- A linear (straight-line) PPC indicates constant opportunity cost.
- A concave (bowed-out) PPC indicates increasing opportunity cost.
- A convex (bowed-in) PPC indicates decreasing opportunity cost.
- A PPC must always slope downward from the axes because resources are scarce and production involves trade-offs.
- Constant opportunity cost assumes resources are perfectly adaptable between the two types of production.
Common Mistakes
- Confusing concave and convex: Students often mix up which curve shape represents increasing versus decreasing opportunity cost. Remember that increasing opportunity cost bows outward (concave) because the curve lies below the straight line connecting the intercepts.
- Choosing Diagram B because it looks 'standard': Diagram B is indeed the most common real-world PPC shape, but the question specifically asks for constant opportunity cost, which requires the linear shape of Diagram A.
- Overlooking Diagram D: Some students may think Diagram D is valid because it is straight, but an upward slope is impossible for a PPC showing trade-offs between two goods.
- Ignoring the axes: Always check which good is on which axis, though for identifying the shape of constant opportunity cost, the axis labels do not change the answer.
Things to Be Careful About
- Ensure you read the question carefully: it asks for constant opportunity cost, not the most common or realistic case.
- When describing shapes in your explanation, be precise: 'straight line', 'concave to the origin', and 'convex to the origin' are the standard terms.
- In an exam, if you are asked to sketch a PPC with constant opportunity cost, draw a straight line from the consumer goods axis intercept to the capital goods axis intercept.
- Remember that the PPC illustrates trade-offs: any point on the curve represents efficient production, and the slope at any point equals the marginal rate of transformation (MRT), which equals the opportunity cost.
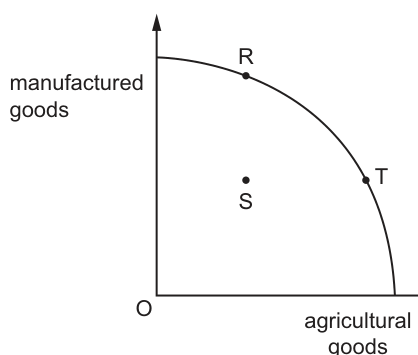
Farmers using traditional methods lack access to finance and often employ family members on a part-time basis.
If working practices in agriculture could be improved, how would this be likely to be shown on the production possibility curve?
Options
A by a movement from R to T
B by a movement from S to R
C by a movement from S to T
D by a movement from T to R
Reasoning
Point S lies inside the production possibility curve (PPC), which indicates that resources are not being fully or efficiently used. This matches the description of traditional farming methods, limited access to finance and part-time family labour, which lead to underemployment and low productivity in agriculture. Improving working practices in the agricultural sector increases the productivity of existing resources, eliminating this inefficiency and allowing the economy to move from the interior point S to a point on the PPC. Since the improvement is specific to agriculture, the movement is to a point with higher agricultural goods output, which is point T.
Answer
C
C
Background Concept
A production possibility curve (PPC) is a fundamental economic model that illustrates the maximum possible combinations of two goods an economy can produce using its current resources and technology, assuming all resources are fully and efficiently employed. The curve is typically concave to the origin due to the principle of increasing opportunity cost: as production of one good increases, the opportunity cost of producing additional units of that good rises, because resources are not perfectly adaptable between the two sectors.
Points on the PPC represent productive efficiency: the economy is using all available resources (labour, capital, land, enterprise) to their maximum potential, with no waste or unemployment. It is impossible to produce more of one good without producing less of the other when operating on the curve.
Points inside the PPC represent inefficiency: resources are either unemployed, underemployed, or used in a poorly organised way. This means the economy can produce more of one or both goods without sacrificing the production of the other, simply by using existing resources more effectively. Points outside the PPC are unattainable with the economy's current resources and technology.
Understanding the Question
The question describes an agricultural sector that uses traditional methods, lacks access to finance, and relies on part-time family labour. These characteristics mean that resources in agriculture (labour, land, capital) are not being used to their full potential: there is likely underemployment of labour, low investment in productive capital due to lack of finance, and low productivity from outdated methods. As a result, the economy is operating at an interior point of the PPC (point S) rather than on the curve, producing less of both agricultural and manufactured goods than it could.
The question asks how improving working practices in agriculture would be shown on the PPC. The provided diagram (Fig. 5.1) has three labelled points: R (on the PPC, high manufactured goods output, low agricultural output), S (inside the PPC, low output of both goods), and T (on the PPC, low manufactured goods output, high agricultural output). The task is to identify the correct movement between these points that results from improved agricultural working practices.
Approach
To solve this, follow three steps:
- First, interpret the meaning of each point on the PPC: S is inefficient (inside the curve), R and T are efficient (on the curve).
- Link the described problem (inefficient agricultural practices) to the position of S: the economy is operating inside the PPC because resources in agriculture are underused or poorly used.
- Consider the effect of improving working practices: this is a productivity improvement in the agricultural sector, which means existing resources can produce more agricultural output, or the same output with fewer resources. This eliminates the inefficiency, so the economy moves from the interior point S to a point on the PPC. Since the improvement is specific to agriculture, the new point will have higher agricultural output than S, which is point T.
Eliminate incorrect options: Movements along the PPC (options A and D) only occur when the economy is already operating at full efficiency and reallocates resources between the two sectors, which does not apply here as the economy starts at an inefficient interior point. Option B (S to R) is a movement to a point with higher manufactured goods output, which would require an improvement in manufacturing productivity, not agriculture.
Step-by-Step Reasoning
- Interpret the PPC diagram: The vertical axis measures output of manufactured goods, the horizontal axis measures output of agricultural goods. The concave curve is the PPC, showing the maximum possible output combinations given current resources and technology.
- Interpret point S: S lies inside the PPC, meaning the economy is not using all resources fully or efficiently. This aligns with the question's description: traditional farming methods, lack of access to finance (limiting investment in machinery or better inputs), and part-time family labour mean that agricultural resources are underutilized or used unproductively. As a result, total output of both goods is below the maximum possible.
- Effect of improved working practices: Improving working practices (e.g., better crop rotation, more efficient use of labour, access to finance for better equipment) increases the productivity of resources used in agriculture. This means the economy can produce more agricultural goods with the same amount of resources, or the same amount of agricultural goods with fewer resources. The freed-up resources can then be used to produce more manufactured goods if desired.
- Resulting movement: This improvement eliminates the inefficiency that placed the economy inside the PPC, so the economy moves from point S to a point on the PPC. Since the productivity gain is specific to agriculture, the new point will have a higher quantity of agricultural goods than S. Point T is on the PPC at a higher level of agricultural output than S, while point R is on the PPC at a higher level of manufactured goods and lower agricultural output. Therefore, the correct movement is from S to T.
- Reject other options:
- Option A (R to T) and D (T to R) are movements along the PPC. These represent reallocating resources between the two sectors when the economy is already operating at full efficiency (on the curve). This does not apply here, as the economy starts at the inefficient point S.
- Option B (S to R) is a movement from the interior to the PPC, but R is a point with higher manufactured goods output. This would only occur if the productivity improvement was in the manufacturing sector, not agriculture.
Key Takeaways
- The position of an economy relative to the PPC reveals its efficiency: points on the curve are efficient, points inside are inefficient, points outside are unattainable with current resources.
- Improvements in productivity or efficiency in one sector allow the economy to move from an interior point to a point on the PPC, with higher output of the improved sector.
- Movements along the PPC only occur when the economy is already efficient and reallocates resources between sectors; they do not result from productivity improvements that eliminate inefficiency.
- Always link the sector of improvement to the relevant axis on the PPC: an improvement in agricultural productivity will lead to a point with higher agricultural output (further along the horizontal axis).
Common Mistakes
- Confusing a movement from inside the PPC to the curve with a shift of the entire PPC: a shift of the PPC occurs when there is a permanent increase in the quantity or quality of resources (e.g., more labour, better education) or technological progress that expands the maximum possible output of both goods. In this question, the improvement is in working practices (better use of existing resources), so it is a movement from the interior point S to the existing PPC, not a shift of the curve.
- Choosing a movement along the PPC (options A and D): these are only relevant when the economy is already operating at full efficiency, which is not the case here as the economy starts at the inefficient point S.
- Choosing movement to R (option B): R is a point with higher manufactured goods output, which would require an improvement in the manufacturing sector, not agriculture. The question explicitly states the improvement is in agricultural working practices, so the gain is in agricultural output, leading to point T.
- Misinterpreting the axes: remember that agricultural goods are on the horizontal axis, so higher agricultural output is further to the right along the horizontal axis, which is point T relative to S.
Things to Be Careful About
- Always first identify whether the economy is operating inside, on, or outside the PPC before determining the type of movement. Interior points indicate inefficiency, so improvements in resource use move the economy to the curve, not along it.
- Link the sector of improvement to the correct axis: an improvement in the sector on the horizontal axis (agricultural goods here) will lead to a point further along that axis, which is T in this diagram.
- Do not confuse productivity improvements that eliminate inefficiency (movement from inside to the curve) with technological progress that increases the economy's productive capacity (an outward shift of the entire PPC). This question refers to the former, as the options only include movements between existing points, not a shift of the curve.
In a particular year, 12 000 units of a good are sold at $1 per unit. In a later year, 14 000 units are sold at $1.20 per unit.
If consumer tastes have remained constant, what could account for the change between the two years?
Options
A a decrease in the price of raw materials used by producers
B an increase in the price of a substitute good
C an increase in the rate of tax imposed on producers
D the formation of a monopoly in the production of the good
Answer
The data show that both price and quantity increased: price from $1 to $1.20, quantity from 12 000 to 14 000. This can only be caused by a rightward shift in the demand curve (increase in demand). A decrease in the price of raw materials (A) would shift supply right, lowering price and raising quantity – not matching. An increase in the tax (C) shifts supply left, raising price but lowering quantity. The formation of a monopoly (D) typically reduces output and raises price, so quantity would fall. Only an increase in the price of a substitute good (B) would increase demand for this good, shifting demand right and raising both price and quantity. Therefore, B is correct.
Answer
B
B
Background Concept
This question tests the understanding of market equilibrium and the effects of shifts in demand and supply. In a competitive market, the equilibrium price and quantity are determined by the intersection of the demand and supply curves. When either curve shifts, the equilibrium changes. A rightward shift in demand (increase in demand) raises both price and quantity. A rightward shift in supply (increase in supply) lowers price and raises quantity. A leftward shift in supply (decrease in supply) raises price and lowers quantity. A leftward shift in demand (decrease in demand) lowers both price and quantity.
Understanding the Question
We are given two data points: in one year, 12 000 units are sold at $1 per unit; in a later year, 14 000 units are sold at $1.20 per unit. Both price and quantity increased. The question asks what could account for this change, assuming consumer tastes have remained constant. The answer must be one of the four options. The key is to recognise that the only way both price and quantity can rise is for demand to increase (shift right). Any change that affects supply alone would move price and quantity in opposite directions. Therefore, we need to find the option that increases demand for this good.
Approach
- Identify the observed change: price up, quantity up. This implies a rightward shift in demand.
- Evaluate each option to see whether it would shift demand right, or shift supply left/right, or have no effect in the direction needed.
- Option A: decrease in price of raw materials (affects supply, not demand).
- Option B: increase in price of a substitute good (affects demand).
- Option C: increase in tax on producers (affects supply).
- Option D: formation of a monopoly (affects supply/market structure, typically reduces output).
- Conclude that only B matches the requirement.
Step-by-Step Reasoning
- Start with the data: price increased from $1 to $1.20 (a 20% increase) and quantity increased from 12 000 to 14 000 (a 16.7% increase). Both variables increased.
- Recall the standard analysis:
- If demand increases (shifts right), at any given price consumers want more. The new equilibrium has higher price and higher quantity. This matches our observation.
- If supply increases (shifts right), the new equilibrium has lower price and higher quantity. This does not match because price increased.
- If supply decreases (shifts left), the new equilibrium has higher price and lower quantity. This does not match because quantity increased.
- If demand decreases (shifts left), equilibrium has lower price and lower quantity. Not matching.
- Therefore, the change must be due to an increase in demand.
- Now evaluate each option:
- A: A decrease in the price of raw materials reduces production costs, shifting the supply curve to the right. This would lead to a lower price and higher quantity. The actual price increased, so A is not correct.
- B: An increase in the price of a substitute good makes the substitute relatively more expensive. Consumers will switch from the substitute to this good, increasing demand for this good. This shifts the demand curve to the right, raising both price and quantity. This matches the observed change.
- C: An increase in the rate of tax imposed on producers raises their costs, shifting the supply curve to the left. This would lead to a higher price and lower quantity. The actual quantity increased, so C is not correct.
- D: The formation of a monopoly involves the market being taken over by a single seller. A monopoly typically restricts output to raise price, compared to a competitive market. This would reduce quantity and increase price. The quantity increased, so D is not correct.
- Therefore, only option B is consistent with the observed increase in both price and quantity.
Key Takeaways
- Understanding that an increase in both equilibrium price and quantity is caused by an increase in demand (rightward shift) is a fundamental concept in microeconomics.
- Changes in the price of substitutes affect demand, not supply.
- Taxes and input costs affect supply, not demand.
- Market structure changes (e.g., monopoly) can affect the supply side but typically reduce output.
Common Mistakes
- Confusing a movement along a curve with a shift: students might think an increase in price alone would reduce quantity demanded, but here both rose, so it's a shift.
- Assuming that a tax increase always raises price and lowers quantity, but forgetting that both price and quantity changed in opposite directions from what is observed.
- Not considering that a monopoly, while raising price, typically reduces quantity, so it cannot explain an increase in quantity.
Things to Be Careful About
- Always start by determining what the observed change means for the curves: price and quantity both up -> demand shift right.
- Check each option against the direction of the shift it causes on the relevant curve.
- Remember that constant tastes means the demand shift is not due to taste changes, but other factors like substitutes, income, etc. The question says tastes constant, so option B works as it is a substitute price change, not a taste change.
What is most likely to cause an increase in the consumer surplus in the market for a normal good?
Options
A an increase in consumer incomes
B an increase in the number of substitute goods
C an increase in the price of a complementary good
D an increase in the price of the good
Working
For a normal good, an increase in consumer incomes raises demand. The demand curve shifts rightwards. At the new equilibrium, both price and quantity are higher. Consumer surplus is the area below the demand curve and above the price line. The rightward shift of the demand curve — consumers are now willing to pay more for each unit — increases total consumer surplus despite the higher price. The other options either reduce demand or raise the price without increasing willingness to pay, so they would reduce consumer surplus.
Answer
A
A
Background Concept
Consumer surplus is the difference between the maximum price a consumer is willing to pay for a good (as shown by the demand curve) and the actual market price they pay. Graphically, it is the area below the demand curve and above the price line, up to the quantity traded. A normal good is one for which demand rises when consumer income rises (positive income elasticity).
Understanding the Question
The question asks which change is most likely to increase consumer surplus in the market for a normal good. Four possible changes are given: an increase in consumer incomes, an increase in the number of substitute goods, an increase in the price of a complementary good, and an increase in the price of the good itself. Only one of these shifts the demand curve in a way that raises both willingness to pay and the quantity exchanged, which can increase consumer surplus.
Approach
For each option, consider first how it affects the demand curve (or the supply curve, where relevant). Then evaluate the direction of change in consumer surplus by thinking about the area under the demand curve above the price. A rightward shift of demand (higher willingness to pay) tends to increase consumer surplus, especially if the price rise is not too large. A leftward shift or a pure price rise without a shift tends to reduce it.
Step-by-Step Reasoning
Option A: an increase in consumer incomes. For a normal good, higher income raises demand. The demand curve shifts to the right. In the new equilibrium, both price and quantity are higher. The demand curve is now higher — consumers are willing to pay more for every unit. The price has risen, which by itself would reduce consumer surplus, but the upward shift of the demand curve can more than compensate. The area under the new demand curve above the new price is typically larger than the old area, because the demand curve is higher and the quantity is larger. Therefore consumer surplus increases. This is the most direct and likely cause among the options.
Option B: an increase in the number of substitute goods. More substitutes make demand more price-elastic. This does not shift the demand curve itself; it changes its slope. For a given demand curve, a more elastic demand means a smaller increase in price for a given shift? Actually it primarily affects the responsiveness to price changes. Consumer surplus is determined by the position of the demand curve and the market price, not directly by elasticity. An increase in substitutes might lower the price if competition intensifies, but the question does not indicate a supply change. The effect on consumer surplus is ambiguous and not clearly an increase. It is less likely than A.
Option C: an increase in the price of a complementary good. A rise in the price of a complement reduces demand for the good in question (demand shifts left). The demand curve shifts leftwards, lowering equilibrium price and quantity. Both the lower demand curve and the lower price reduce consumer surplus: the area under the new demand curve above the new price is almost certainly smaller. Consumer surplus decreases.
Option D: an increase in the price of the good itself. This is a movement along the existing demand curve, not a shift. A higher price reduces quantity demanded. Consumer surplus is the area above the new higher price and below the same demand curve. That area is unambiguously smaller than before (consumers pay more for fewer units). Consumer surplus falls.
Therefore only Option A is likely to increase consumer surplus.
Key Takeaways
- Consumer surplus depends on both the position of the demand curve (willingness to pay) and the market price.
- A change in income for a normal good shifts demand, altering both equilibrium price and quantity, and can increase consumer surplus.
- Changes that reduce demand or raise price without increasing willingness to pay reduce consumer surplus.
- Understanding the distinction between a shift of the demand curve and a movement along it is crucial for analysing changes in surplus.
Common Mistakes
- Confusing consumer surplus with total revenue or profit. Consumer surplus is a measure of consumer welfare, not producer gain.
- Assuming that a higher price always reduces consumer surplus. If the demand curve shifts upward enough, consumer surplus can increase despite a higher price.
- Thinking that an increase in the number of substitutes increases consumer surplus because of greater choice — this is a microeconomic welfare point but not a direct shift of the demand curve, and the effect is less certain.
- Forgetting that a normal good has positive income elasticity, so income rise increases demand.
Things to Be Careful About
- Always ask: does the change shift the demand curve or the supply curve? Only shifts change the underlying willingness to pay or cost conditions; movements along occur in response to price changes.
- Consumer surplus is measured with respect to the market price, so when analysing an exogenous price change (Option D), be careful to note that the demand curve is fixed.
- The phrase "most likely" in the question signals that we are choosing the option that is unambiguously and directly causal, not one that might have a small or ambiguous effect.
The table shows Lee's and Yim's price elasticity of demand for restaurant meals and cinema tickets.
| Lee | Yim | |
|---|---|---|
| restaurant meals | -1.2 | -0.8 |
| cinema tickets | -0.7 | -1.3 |
There is a rise in the price of restaurant meals and a fall in the price of cinema tickets.
What can be concluded after these price changes?
Options
A Restaurant owners will receive more income.
B Lee will spend more money on both cinema tickets and restaurant meals.
C Yim will spend more money on both cinema tickets and restaurant meals.
D Cinema owners will receive less income.
Reasoning
For each person and good, determine the effect on their total spending using the PED-total revenue relationship:
-
Restaurant meals (price rise):
- Lee: PED = -1.2 (elastic) -> total spending falls.
- Yim: PED = -0.8 (inelastic) -> total spending rises.
-
Cinema tickets (price fall):
- Lee: PED = -0.7 (inelastic) -> total spending falls.
- Yim: PED = -1.3 (elastic) -> total spending rises.
Thus Yim's total spending rises on both goods, while Lee's falls on both. Option C is correct.
Answer
C
C
Background Concept
Price elasticity of demand (PED) measures the responsiveness of quantity demanded to a change in price. It is calculated as the percentage change in quantity demanded divided by the percentage change in price. The sign is usually negative (law of demand). The absolute value of PED determines whether demand is elastic (|PED|>1), inelastic (|PED|<1), or unit elastic (|PED|=1).
A key application of PED is its relationship with total revenue (or total expenditure by consumers). When demand is elastic, a price increase leads to a proportionally larger fall in quantity demanded, so total revenue falls. Conversely, a price decrease leads to a proportionally larger increase in quantity demanded, so total revenue rises. When demand is inelastic, a price increase leads to a proportionally smaller fall in quantity demanded, so total revenue rises. A price decrease leads to a proportionally smaller increase in quantity demanded, so total revenue falls.
Understanding the Question
The question provides a table of PED values for two individuals (Lee and Yim) for two goods: restaurant meals and cinema tickets. It then states that the price of restaurant meals rises and the price of cinema tickets falls. We are asked to determine which of the four statements can be concluded after these price changes. The options involve changes in spending by individuals or income received by sellers.
Approach
We need to apply the PED-total revenue relationship to each person-good combination. For each person, we know their PED, so we can predict whether their total spending on that good will rise or fall given the price change. Then we examine each option to see which one is consistent with all four predictions. Option A and D are about sellers' total income, which depends on the aggregate spending of all consumers, not just Lee and Yim, so we cannot conclude from the given data. Options B and C are about individual spending on both goods. We can compute for each person whether their spending on both goods rises or falls.
Step-by-Step Reasoning
-
Identify the price changes:
- Restaurant meals: price rises.
- Cinema tickets: price falls.
-
For each person, use their PED to determine the effect on their total spending on each good.
-
Restaurant meals (price rise):
- Lee: PED = -1.2 (elastic) -> total spending falls.
- Yim: PED = -0.8 (inelastic) -> total spending rises.
-
Cinema tickets (price fall):
- Lee: PED = -0.7 (inelastic) -> total spending falls.
- Yim: PED = -1.3 (elastic) -> total spending rises.
-
-
Combine the results:
- Lee: spending on restaurant meals falls, spending on cinema tickets falls. So Lee spends less on both.
- Yim: spending on restaurant meals rises, spending on cinema tickets rises. So Yim spends more on both.
-
Evaluate each option:
- A: Restaurant owners will receive more income. This would require that the total spending on restaurant meals by all consumers increases. But we only have data for two individuals; their spending moves in opposite directions. Without knowing their relative budgets, we cannot conclude. Also, there may be other consumers. So A is not necessarily true.
- B: Lee will spend more money on both cinema tickets and restaurant meals. We found Lee spends less on both. So B is false.
- C: Yim will spend more money on both cinema tickets and restaurant meals. This matches our finding. So C is true.
- D: Cinema owners will receive less income. Total spending on cinema tickets across all consumers: Lee's spending falls, Yim's rises. Cannot conclude overall. So D is false.
Therefore, the correct answer is C.
Key Takeaways
- The relationship between PED and total revenue is crucial for predicting how changes in price affect consumer spending and producer revenue.
- When given individual PED values, you can determine the direction of change in total spending for each person, but aggregate effects depend on the distribution of spending across consumers.
- In multiple-choice questions, carefully evaluate each option against the derived predictions.
Common Mistakes
- Confusing elastic and inelastic: forgetting that for elastic demand, price and total revenue move in opposite directions; for inelastic, they move in the same direction.
- Applying the relationship to the market instead of individuals: the question asks about individual spending, but options A and D refer to sellers' income, which is a market-level concept. The data only allow conclusions about Lee and Yim, not the whole market.
- Misreading the table: note that PED values are negative, so elastic means absolute value >1, inelastic means absolute value <1.
Things to Be Careful About
- Always check the sign of PED: the absolute value determines elasticity, but the sign (negative) indicates inverse relationship between price and quantity.
- When price falls, total revenue changes in the opposite direction of the price change for elastic demand, and same direction for inelastic demand.
- The question gives individual elasticities, not market elasticities. Be cautious about statements that depend on aggregate behaviour.
- Consider both goods separately and then combine to see if a person's spending on both rises or falls.
What is not held constant when aggregating individual firms' supply curves to give the short-run market supply curve?
Options
A the number of firms in the industry
B the price of the product
C the prices of factors of production
D the state of technology
Answer
The short-run market supply curve is the horizontal sum of the supply curves of all individual firms. Each firm's supply curve is drawn assuming that the number of firms, the prices of factors of production, and the state of technology are held constant. The market supply curve shows the relationship between the price of the product and the total quantity supplied. Therefore, the price of the product is the variable on the vertical axis and is not held constant. The correct answer is B.
B
Background Concept
The short-run market supply curve for a perfectly competitive industry is derived by horizontally summing the individual supply curves of all firms. Each firm's supply curve (its marginal cost curve above the shut-down point) is drawn under the ceteris paribus assumption that factor prices, technology, and the number of firms are fixed. When we aggregate, we add the quantities supplied at each possible price; price is the independent variable, not a constant.
Understanding the Question
The question asks which of the four listed items is not held constant when we perform the aggregation. The individual supply curves are constructed with certain things held constant (ceteris paribus). The market supply curve is then a function of price, with the other determinants assumed unchanged. The correct answer is the one that is actually the variable on the axes of the market supply curve.
Approach
Recognise that the market supply curve is a schedule relating price to quantity supplied. Any factor that can cause a shift of the supply curve is held constant along the curve. The price of the product itself is the variable on the vertical axis; it is not held constant but is allowed to vary. The other three options – number of firms, factor prices, and technology – are determinants of supply that shift the curve when they change; they are held constant when drawing a given market supply curve.
Step-by-Step Reasoning
- List the factors that are typically held constant when deriving a firm's supply curve: technology, input prices, and expectations (but not the number of firms, which is a market-level factor). For the market supply curve, the number of firms is also held constant; if new firms enter, the market supply curve shifts right.
- The market supply curve is plotted with price on the vertical axis and quantity on the horizontal axis. Price is the variable that changes along the curve; it is not held constant.
- Therefore, out of the options, the price of the product is the one that is not held constant during aggregation.
Key Takeaways
- The market supply curve is derived from individual supply curves, and the ceteris paribus conditions apply to the market curve as well.
- Price is the variable on the axis; all other determinants are held constant to isolate the relationship between price and quantity supplied.
- The question tests the distinction between a movement along the supply curve (price changes) and a shift of the curve (other factors change).
Common Mistakes
- Confusing the number of firms as a variable that is not held constant: in fact, for a given market supply curve, the number of firms is fixed. If the number of firms changes, the curve shifts.
- Thinking that factor prices or technology could change during aggregation: they are underlying assumptions that remain constant.
Things to Be Careful About
- Read the question carefully: it asks what is not held constant. The answer is the variable that is on the axes.
- Remember that the market supply curve is a snapshot under given conditions; any change in the listed factors would shift the curve.
Which elasticity would a shortage of skilled workers affect?
Options
A cross elasticity of demand
B income elasticity of demand
C price elasticity of demand
D price elasticity of supply
Answer
A shortage of skilled workers limits the ability of firms to increase production in response to a price rise, because it restricts the availability of a key factor of production. This directly affects the price elasticity of supply, which measures the responsiveness of quantity supplied to a change in price. The other elasticities relate to demand: cross elasticity of demand measures responsiveness of demand for one good to a change in the price of another good; income elasticity measures responsiveness of demand to a change in income; and price elasticity of demand measures responsiveness of quantity demanded to a change in price. Therefore, the correct answer is D (price elasticity of supply).
D
Background Concept
Price elasticity of supply (PES) measures the responsiveness of the quantity supplied of a good or service to a change in its price. It is calculated as the percentage change in quantity supplied divided by the percentage change in price. The main factors that determine PES include the availability of spare capacity, the ease of storing stocks, the length of the production period, and the availability of factors of production, such as skilled labour. A shortage of skilled workers reduces the ability of firms to increase output quickly, making supply more inelastic. This question tests the understanding that a shortage of skilled workers is a supply-side factor, not a demand-side factor.
Understanding the Question
The question asks which elasticity would be affected by a shortage of skilled workers. The four options are all elasticities: cross elasticity of demand, income elasticity of demand, price elasticity of demand, and price elasticity of supply. The key is to recognise that a shortage of skilled workers is a change in the availability of a factor of production, which affects the production side of the market. Therefore, it will affect the supply side, not the demand side. Among the options, only price elasticity of supply is a supply-side elasticity; the others are demand-side elasticities.
Approach
First, recall what each elasticity measures. Then consider which side of the market (demand or supply) is impacted by a shortage of skilled workers. Since skilled workers are a factor of production, their shortage affects the production capacity of firms, i.e., the supply side. Therefore, the elasticity that will be affected is the price elasticity of supply. Eliminate the other options because they relate to demand.
Step-by-Step Reasoning
-
Understand the definitions:
- Cross elasticity of demand (XED): measures the responsiveness of quantity demanded of good A to a change in price of good B. It is about demand for one good relative to another.
- Income elasticity of demand (YED): measures the responsiveness of quantity demanded to a change in income. It is about demand.
- Price elasticity of demand (PED): measures the responsiveness of quantity demanded to a change in the good's own price. It is about demand.
- Price elasticity of supply (PES): measures the responsiveness of quantity supplied to a change in the good's own price. It is about supply.
-
A shortage of skilled workers means there are fewer workers with the required skills. This is a factor input that firms need to produce goods and services. When there is a shortage of skilled workers, firms may find it harder to increase production quickly when the price of their product rises. This makes the supply less elastic (more inelastic) because the firm cannot easily expand output due to the limited availability of skilled labour.
-
Therefore, the shortage of skilled workers directly affects the price elasticity of supply. It does not affect the demand elasticities because demand depends on consumer preferences, income, and prices of related goods, not on the availability of factors of production.
-
Hence, the correct answer is D.
Key Takeaways
- Price elasticity of supply is determined by factors that affect the ability of producers to change output, including the availability of factors of production.
- A shortage of skilled workers makes supply more inelastic.
- It is important to distinguish between demand-side elasticities (PED, YED, XED) and supply-side elasticity (PES).
- When a question mentions a factor of production, think about supply side.
Common Mistakes
- Confusing the effect on supply with an effect on demand. Some students might think a shortage of skilled workers reduces the number of workers and thus reduces demand for goods (because workers have less income), but that is a secondary effect. The primary and direct effect is on the supply side because the workers are inputs.
- Choosing cross elasticity of demand, thinking that skilled workers are a complement or substitute in production. But cross elasticity is about demand for goods, not factors of production.
- Choosing price elasticity of demand, thinking that if workers are scarce, prices will rise and demand will be affected. But the question asks which elasticity is affected by the shortage, not which elasticity might change as a result. The shortage directly affects the firm's ability to supply, so it is PES.
Things to Be Careful About
- Read the question carefully: 'affect' means which elasticity is influenced by the shortage, not which elasticity measures something else.
- Remember that elasticities are specific to the side of the market: demand-side elasticities are about consumer behaviour; supply-side elasticity is about producer behaviour.
- Avoid overthinking: the direct link is that a shortage of a factor of production affects the ability to produce, hence supply elasticity.
D1D1 shows an individual's initial demand curve for public transport.
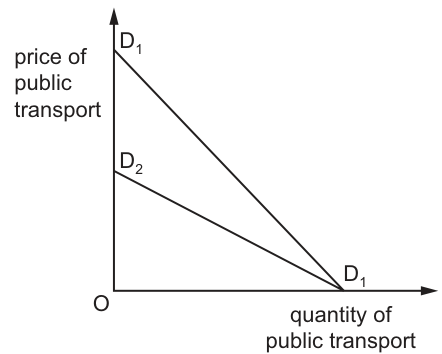
What would cause the demand curve to shift to D2D1?
Options
A The cost of running the individual's car rises.
B The individual is banned from driving.
C The price of public transport rises.
D The quality of public transport declines.
Reasoning
A shift of the demand curve (rather than a movement along it) is caused by a change in a non-price determinant of demand. The diagram shows D2D1 pivoting inward from the vertical axis, meaning the individual is willing to pay a lower price for every quantity of public transport except the maximum quantity (where both curves meet the horizontal axis).
- Option A: A rise in car running costs makes driving more expensive, increasing demand for public transport and shifting the curve right, so incorrect.
- Option B: A driving ban removes the alternative to public transport, increasing demand and shifting the curve right, so incorrect.
- Option C: A rise in the price of public transport causes a movement up along the existing demand curve, not a shift, so incorrect.
- Option D: A decline in the quality of public transport reduces the individual's willingness to pay for any given quantity, pivoting the demand curve inward from the vertical axis as shown, so this is correct.
Answer
D
D
Background Concept
A demand curve illustrates the relationship between the price of a good and the quantity demanded by an individual or market, holding all other factors constant (ceteris paribus). A movement along the demand curve occurs only when the price of the good itself changes: a higher price leads to a lower quantity demanded, and vice versa, as shown by moving up or down the existing curve. A shift of the entire demand curve (either left/right or a pivot) is caused by a change in a non-price determinant of demand, such as consumer income, prices of related goods (substitutes or complements), consumer tastes and preferences, population size, or the quality of the good.
A pivot of the demand curve (where the curve rotates around a fixed point on one axis) happens when the change in the non-price determinant affects either the maximum price the consumer is willing to pay for the first unit (the vertical intercept) or the maximum quantity they would demand if the good were free (the horizontal intercept), but not both. In the diagram provided, the two demand curves meet at the same point on the horizontal axis, meaning the maximum quantity of public transport the individual would ever demand is unchanged. Only the maximum price they are willing to pay for the first unit falls, as shown by the vertical intercept moving from D1 to D2.
Understanding the Question
This multiple-choice question asks you to identify which of four events would cause the individual's demand curve for public transport to shift from D1D1 to D2D1, the inward-pivoting curve shown in Fig. 11.1. The core task is to first distinguish between a movement along the demand curve and a shift of the curve, then match the shape of the curve change (inward pivot from the vertical axis) to the correct cause from the options given. The question tests your understanding of what factors shift demand, and how different types of changes to demand determinants affect the shape and position of the demand curve.
Approach
To solve this question, follow these steps:
- First, eliminate any options that would cause a movement along the demand curve, rather than a shift. Only a change in the price of public transport itself causes a movement along the curve, so any option referring to the price of public transport can be ruled out immediately.
- Next, eliminate any options that would increase demand for public transport (shifting the curve rightward, outward from the vertical axis) rather than decreasing it. The curve in the diagram shifts inward, so demand is falling, not rising.
- Finally, check the remaining option against the shape of the curve change: the pivot is from the vertical axis, with the horizontal intercept unchanged. This means the change reduces willingness to pay at all positive quantities, but does not change the maximum quantity the individual would ever use.
Step-by-Step Reasoning
Let us evaluate each option in detail against the above criteria:
-
Option A: The cost of running the individual's car rises.
The cost of running a private car is the price of a substitute good for public transport, as both services satisfy the same need (transport from one location to another). If car running costs rise, driving becomes more expensive relative to public transport, so the individual will choose to use public transport more often at every price level. This increases demand for public transport, shifting the demand curve to the right (outward from the vertical axis), which is the opposite of the inward pivot shown in the diagram. Therefore, A is incorrect. -
Option B: The individual is banned from driving.
A ban on driving completely removes the individual's ability to use a private car for any journey. This eliminates the substitute for public transport entirely, so the individual will demand public transport for all journeys they previously made by car, at every price level. This causes a large rightward shift of the demand curve, which is the reverse of the change shown. Therefore, B is incorrect. -
Option C: The price of public transport rises.
A change in the price of the good itself (public transport) never shifts the demand curve. Instead, it causes a movement along the existing demand curve: a higher price leads to a lower quantity demanded, as the individual moves up along D1D1 to a point with a lower quantity. The shape and position of the curve do not change, so this cannot explain the shift to D2D1. This is a common distractor for students who confuse movements along curves with shifts of curves. Therefore, C is incorrect. -
Option D: The quality of public transport declines.
The quality of a good is a non-price determinant of demand, as it affects consumer tastes and preferences and the utility the individual gets from consuming the good. If the quality of public transport falls (for example, due to less frequent services, more crowded vehicles, or longer journey times), the individual gets less benefit from using it, so their willingness to pay for any given quantity of public transport falls. This reduces the maximum price they are willing to pay for the first unit (the vertical intercept falls from D1 to D2), but the maximum quantity they would demand if public transport were free stays the same, as they would still use it for all necessary journeys even if it is low quality and free. This exactly matches the inward pivot from D1D1 to D2D1 shown in the diagram. Therefore, D is the correct answer.
Key Takeaways
- The key distinction to master is between a movement along a demand curve (caused only by a change in the good's own price) and a shift of the demand curve (caused by changes in non-price determinants of demand).
- A pivot of the demand curve (rather than a parallel shift) indicates that the change in the determinant affects either the maximum willingness to pay or the maximum quantity demanded, but not both.
- The quality of a good is a core non-price determinant of demand: a fall in quality reduces demand at every price, shifting the curve leftward or pivoting it inward from the vertical axis.
Common Mistakes
- Confusing movements along the curve with shifts: Many students select Option C, incorrectly believing that a price change shifts the demand curve. Remember that price changes only cause movements along the existing curve.
- Ignoring the shape of the curve change: The diagram shows a pivot, not a parallel shift. Students who do not notice that the horizontal intercept is unchanged may select an option that would cause a parallel shift (such as a change in income) which is not present here.
- Misidentifying the direction of the shift: Options A and B would increase demand for public transport, shifting the curve right. Students who misread the diagram as a rightward shift may select one of these incorrect options.
Things to Be Careful About
- Always check whether the change in the question is a change in the price of the good itself (movement along) or a change in another factor (shift).
- When interpreting a pivoted demand curve, note which axis intercept is fixed: in this case, the horizontal intercept is fixed, so the change affects willingness to pay but not the maximum possible quantity demanded.
- For transport goods like public transport, private car use is a key substitute, so changes in car costs or access to cars will shift the demand curve for public transport in the opposite direction.
Which government action would be identified as the direct provision of goods and services?
Options
A increasing road maintenance because of poor weather conditions
B making payments to low-income families with elderly dependents
C subsidising firms in order to encourage them to increase their output
D taxing firms because they have been emitting damaging fumes
Direct provision of goods and services means that the government itself produces or provides the good or service, rather than using subsidies, transfers, or taxes to influence private provision. Road maintenance is a service provided directly by the government, making option A correct. Option B is a transfer payment to households, not direct provision. Option C is a subsidy to firms, which encourages private output but is not direct provision. Option D is a tax, which is a revenue-raising measure, not a provision of goods or services.
Answer
A
A
Background Concept
Direct provision of goods and services is one of the methods governments use to intervene in markets. It occurs when the government itself produces or supplies a good or service, often because the private market would under-provide it (e.g., public goods, merit goods). Examples include state-funded healthcare, education, infrastructure, and road maintenance. This is distinct from other interventions such as subsidies (which lower production costs for private firms), transfer payments (cash payments to individuals), or taxation (which raises revenue or discourages negative externalities).
Understanding the Question
The question asks which government action is an example of direct provision of goods and services. It presents four options, each describing a different type of government intervention. The correct answer is the one where the government is directly providing the service, rather than influencing behaviour through money or regulation.
Approach
Consider each option in turn and determine whether the action involves the government producing or providing a good/service itself, or whether it involves some other mechanism (transfer, subsidy, tax).
Step-by-Step Reasoning
- Option A: Increasing road maintenance because of poor weather conditions. Road maintenance is a service that the government (usually local or national) directly provides. The government employs workers, purchases materials, and carries out the work. This is a clear example of direct provision.
- Option B: Making payments to low-income families with elderly dependents. This is a transfer payment – the government gives money to households, but does not provide any goods or services directly. The household uses the money to buy goods or services from private providers. So it is not direct provision.
- Option C: Subsidising firms in order to encourage them to increase their output. A subsidy is a payment to firms to reduce their production costs, thereby encouraging them to produce more. The government does not produce the goods itself; it simply reduces the cost of private production. This is not direct provision.
- Option D: Taxing firms because they have been emitting damaging fumes. This is a tax, which is a revenue-raising measure or a means to internalise negative externalities. It does not involve the government providing any goods or services. It is a regulatory/fiscal tool, not direct provision.
Therefore, only option A qualifies as direct provision of a service.
Key Takeaways
- Direct provision means the government itself produces or supplies the good/service.
- It is different from subsidies, transfer payments, taxes, and regulations.
- Common examples include roads, public schools, hospitals, police, and defence.
Common Mistakes
- Confusing direct provision with subsidies: subsidies encourage private production but do not involve the government producing.
- Thinking transfer payments are direct provision: transfers are just cash, not goods/services.
- Assuming any government spending is direct provision: but spending on transfers or subsidies is not direct provision.
Things to Be Careful About
- Read each option carefully: the question asks for 'direct provision', so look for the government actually doing the producing or providing.
- Remember that 'goods and services' includes services like road maintenance, not just physical goods.
- In some contexts, the government may contract out provision to private firms, but that is still considered direct provision if the government ultimately funds and oversees the service. However, the simplest cases (like road maintenance by government employees) are clear examples.
A specific tax is imposed on a product for which the elasticity of supply is zero.
Which statement is correct?
Options
A The burden of this tax will fall entirely on consumers.
B The burden of this tax will fall entirely on suppliers.
C The burden of this tax will fall mainly on consumers.
D The burden of this tax will fall mainly on suppliers.
Answer
When the elasticity of supply is zero, the supply curve is perfectly inelastic (vertical). A specific tax shifts the supply curve vertically upward by the amount of the tax. Because the quantity supplied is fixed, producers cannot reduce output to pass the tax on to consumers. The price paid by consumers remains unchanged, and producers receive the market price minus the tax. Hence, the entire burden of the tax falls on the suppliers. The correct statement is B.
B
Background Concept
Tax incidence refers to the division of the burden of a tax between buyers and sellers. The incidence depends on the price elasticities of demand and supply. The more inelastic side of the market bears a larger share of the tax. If supply is perfectly inelastic (elasticity = 0), the supply curve is vertical, meaning the quantity supplied is fixed regardless of price. Under such conditions, producers cannot adjust their output in response to the tax, so they must absorb the entire tax.
Understanding the Question
The question asks which statement is correct about the incidence of a specific tax when the elasticity of supply is zero. It tests the understanding of how tax burden is allocated based on relative elasticities.
Approach
Recall the rule: the more inelastic side bears more of the tax. Since supply is perfectly inelastic, the entire tax burden falls on suppliers. This can be derived by considering the supply curve shift and the inability of producers to pass on the tax.
Step-by-Step Reasoning
- A specific tax is a fixed amount per unit of the good.
- With zero elasticity of supply, the supply curve is vertical.
- The tax shifts the supply curve vertically upward by the amount of the tax.
- Because the supply curve is vertical, the quantity supplied cannot change.
- The demand curve determines the price consumers are willing to pay for that fixed quantity.
- Producers cannot raise the price because any increase would lead to a surplus (since quantity would not adjust), but the quantity is fixed, so the market would not clear.
- Thus, the price consumers pay remains the same as before the tax.
- Producers receive the market price minus the tax, so their net revenue per unit falls by the full amount of the tax.
- Therefore, the entire burden falls on suppliers.
Key Takeaways
- Tax incidence depends on elasticities.
- Perfectly inelastic supply leads to the full burden on producers.
- Perfectly inelastic demand leads to the full burden on consumers.
- The more elastic side escapes the tax.
Common Mistakes
- Confusing the direction: some students think that if supply is inelastic, producers can pass the tax on because they have to produce the same amount, but actually the opposite is true.
- Forgetting that the tax shifts the supply curve, not the demand curve.
- Misapplying the rule: 'if supply is inelastic, sellers bear more of the tax' is correct.
Things to Be Careful About
- The specific wording: 'elasticity of supply is zero' means perfectly inelastic.
- A specific tax is a per-unit tax, not an ad valorem tax.
- The burden is measured by the change in consumer price and producer price relative to the original equilibrium.
A government wishes to intervene in a free market to allocate healthcare at the socially optimal level.
Which combination correctly identifies the reason for government intervention in the healthcare market?
Options
| healthcare consumption in a free market | healthcare production in a free market | provision of information in a free market | |
|---|---|---|---|
| A | overconsumption | overproduction | too little |
| B | overconsumption | underproduction | too much |
| C | underconsumption | underproduction | too little |
| D | underconsumption | overproduction | too much |
Healthcare is a merit good. Merit goods are under-consumed in a free market because consumers have imperfect information about the full benefits. This under-consumption leads to under-production by the market. The government can address this by providing information about the benefits of healthcare, which is too little in the free market. Hence the correct combination is underconsumption, underproduction, and too little provision of information.
Answer
C
C
Background Concept
Merit goods are goods or services that are considered to be beneficial for individuals and society, but which tend to be under-consumed if left to the free market. This under-consumption arises because consumers have imperfect information about the true private benefits of consumption. Healthcare is a classic example of a merit good: individuals may not fully appreciate the long-term health benefits of regular check-ups or preventative care, leading them to consume less than what is socially optimal.
In a free market, under-consumption of a merit good also leads to under-production, because producers respond to the lower effective demand. The government often intervenes to correct this market failure, for example by subsidising healthcare, providing it directly, or by providing information to raise awareness of the benefits.
Understanding the Question
This multiple-choice question asks you to identify the correct combination of outcomes in a free market for healthcare, specifically regarding consumption, production, and the provision of information. The table presents options with words like 'overconsumption', 'underconsumption', 'overproduction', 'underproduction', and 'too little' or 'too much' for information provision. You need to recall the characteristics of a merit good and apply them to each column.
The question stem states that the government wishes to intervene to allocate healthcare at the socially optimal level. This sets the context: the free market is not achieving the socially optimal outcome, so there must be a market failure. The correct combination should reflect the nature of that market failure for a merit good.
Approach
First, identify the type of good: healthcare is a merit good. Next, recall the free-market outcome for a merit good: due to imperfect information, consumers underestimate benefits, so consumption is below the socially optimal level (underconsumption). Because demand is lower than it should be, the quantity produced by firms is also below the socially optimal level (underproduction). The reason for this market failure is partly due to a lack of information – if consumers knew the true benefits, they would demand more. Therefore, the provision of information by the government is too little in the free market. Finally, match these three pieces to the correct row in the table.
Step-by-Step Reasoning
- Identify the nature of healthcare: It is a classic merit good. Merit goods are under-consumed because consumers have incomplete information about the benefits. Therefore, in a free market, healthcare consumption is below the socially optimal level – i.e., underconsumption.
- Since consumption is low, the demand signal to producers is weak. Firms produce the quantity demanded, so they will also produce less than what is socially optimal – i.e., underproduction.
- The fundamental cause of underconsumption is a lack of information. In a free market, the provision of information about the benefits of healthcare is insufficient – the market does not naturally generate enough information to correct the misperception. Hence information provision is 'too little'.
- Now look at the options:
- Option A: overconsumption, overproduction, too little – incorrect for a merit good.
- Option B: overconsumption, underproduction, too much – incorrect.
- Option C: underconsumption, underproduction, too little – matches our reasoning.
- Option D: underconsumption, overproduction, too much – incorrect.
- Therefore, the correct answer is C.
Key Takeaways
- Merit goods are under-consumed and under-produced in a free market due to imperfect information.
- Government intervention often involves providing information, subsidising, or directly providing the good to achieve the socially optimal level.
- In multiple-choice questions, it is important to read the entire table and match each column individually with your knowledge of the market failure.
- This question tests the understanding that the under-consumption of a merit good leads to under-production, and that information provision is the root cause that the government can address.
Common Mistakes
- Confusing merit goods with demerit goods: demerit goods (e.g., cigarettes) are over-consumed and over-produced. Some students might incorrectly associate healthcare with overconsumption (like demerit goods) because they think 'healthcare is important, so people consume too much'. But the theory says merit goods are under-consumed because the benefits are underestimated.
- Misinterpreting the columns: the question has three columns – consumption, production, and information. A common mistake is to answer based on only one column (e.g., only thinking about underconsumption) and guessing the rest.
- Forgetting that underconsumption leads to underproduction in a market context – if demand is low, supply follows.
Things to Be Careful About
- Read each column carefully and check that the combination is consistent. For a merit good, all three should indicate a shortfall: underconsumption, underproduction, too little information.
- Remember that the question asks for the 'reason' for government intervention – the combination that correctly identifies the free-market outcome. This is different from a question about the method of intervention.
- Keep in mind that the socially optimal level is the level where marginal social benefit equals marginal social cost. For merit goods, the free market fails to reach this due to imperfect information.
- In multiple-choice, once you have the correct row, verify that no other row could be correct. C is the only row with all three 'under' or 'too little'.
The table shows the Consumer Prices Index (CPI) for a country.
| year | CPI |
|---|---|
| 2008 | 100 |
| 2009 | 104 |
| 2010 | 102 |
| 2011 | 105 |
| 2012 | 108 |
| 2013 | 111 |
Which statement about the period 2008 to 2013 is correct?
Options
A Prices increased each year.
B Prices increased fastest in 2011.
C The rate of inflation was 2% in 2010.
D The smallest rise in prices was in 2013.
Working
Calculate the annual percentage change in the CPI (inflation rate):
2009: ((104 - 100) / 100) x 100 = 4.0%
2010: ((102 - 104) / 104) x 100 = -1.92% (deflation)
2011: ((105 - 102) / 102) x 100 = 2.94%
2012: ((108 - 105) / 105) x 100 = 2.86%
2013: ((111 - 108) / 108) x 100 = 2.78%
Now evaluate each statement:
A - Prices increased each year. False: prices fell in 2010 (CPI dropped from 104 to 102).
B - Prices increased fastest in 2011. False: the highest inflation rate was 4.0% in 2009, not 2011.
C - The rate of inflation was 2% in 2010. False: the inflation rate in 2010 was approximately -1.92% (deflation), not 2% inflation.
D - The smallest rise in prices was in 2013. True: among the years where prices rose (2009, 2011, 2012, 2013), the smallest increase was 2.78% in 2013. (2010 had a fall, so no rise.)
Therefore the correct answer is D.
Answer
D
D
Background Concept
The Consumer Prices Index (CPI) measures the average change over time in the prices paid by households for a representative basket of goods and services. It is expressed as an index number, typically set to 100 in a selected base year (here 2008). The inflation rate is the percentage change in the CPI from one year to the next. A positive change indicates rising prices (inflation); a negative change indicates falling prices (deflation). It is important to distinguish between the price level (the CPI value itself) and the rate of change (inflation).
Understanding the Question
The table provides CPI values for a country from 2008 to 2013. Four statements (A–D) about the period are given, and exactly one is correct. To determine which is correct, we must compute the annual inflation rate for each year and then test each statement against the data. The statements involve checking whether prices rose every year, which year had the fastest increase, the specific inflation rate in 2010, and which year saw the smallest rise in prices (interpreting "rise" as an increase in the CPI level).
Approach
- Calculate the year-on-year percentage change in CPI for each pair of consecutive years using the formula: ((CPI_t - CPI_{t-1}) / CPI_{t-1}) x 100.
- Examine each statement:
- A: Is the CPI strictly greater each year than the previous year? (i.e., is there no year with a drop?)
- B: Which year has the highest positive inflation rate? Is it 2011?
- C: Is the 2010 inflation rate exactly 2%?
- D: Among years where CPI increased, which year recorded the smallest positive percentage increase? (The year 2010 recorded a fall, so it is not a rise.)
Step-by-Step Reasoning
Step 1: Calculate inflation rates
2009: (104 - 100)/100 = 0.04 = 4.0%
2010: (102 - 104)/104 = -0.01923... ≈ -1.92%
2011: (105 - 102)/102 = 0.02941... ≈ 2.94%
2012: (108 - 105)/105 = 0.02857... ≈ 2.86%
2013: (111 - 108)/108 = 0.02777... ≈ 2.78%
Step 2: Evaluate A
"Prices increased each year." This means the CPI value rose every year without exception. However, in 2010 the CPI fell from 104 to 102, so prices did not increase. Statement A is false.
Step 3: Evaluate B
"Prices increased fastest in 2011." The phrase "increased fastest" refers to the highest rate of inflation (largest positive percentage change). From our calculations, the highest inflation rate was 4.0% in 2009, not in 2011 (2.94%). Therefore statement B is false.
Step 4: Evaluate C
"The rate of inflation was 2% in 2010." The actual inflation rate in 2010 was approximately -1.92% (deflation). An inflation rate of 2% would imply prices rose by 2%, but prices actually fell, so statement C is false.
Step 5: Evaluate D
"The smallest rise in prices was in 2013." A "rise in prices" means an increase in the CPI (i.e., positive inflation). The years with positive inflation are 2009 (4.0%), 2011 (2.94%), 2012 (2.86%), and 2013 (2.78%). Among these, the smallest increase is 2.78% in 2013. The year 2010 had a fall, not a rise, so it does not qualify. Therefore statement D is correct.
Conclusion: The correct answer is D.
Key Takeaways
- The CPI is an index of the price level; the inflation rate is the percentage change in the CPI.
- To determine whether prices rose or fell, compare CPI values between years; to assess how fast they changed, compute percentage changes.
- Always use the previous year's CPI as the denominator when calculating percentage changes.
- Read each statement carefully: "rise in prices" means an increase in the price level (CPI), not a positive inflation rate (though the two coincide in years with inflation). A year with deflation sees a fall in prices, so it cannot be a "rise".
Common Mistakes
- Confusing the CPI level with the inflation rate: a statement about prices increasing each year (A) is about the level, not the rate.
- Miscalculating percentage changes by using the base year 2008 as denominator for all years (e.g., computing (102-100)/100 = 2% for 2010). This leads to incorrectly thinking statement C is correct. The correct denominator is the previous year's CPI.
- Thinking that the "fastest increase" refers to the largest absolute change in index points (e.g., 108-105=3 points in 2012 vs 104-100=4 points in 2009) rather than the percentage. The index points are dependent on the base and can be misleading.
- Overlooking that 2010 is a fall, not a rise, and incorrectly considering it as a very small rise (or assuming it had 2% inflation).
Things to Be Careful About
- When calculating percentage change, use the correct base (previous period).
- Double-check arithmetic: rounding may cause small variations but the relative sizes remain clear.
- For statement D, note that "smallest rise" necessarily applies only to years where prices actually rose. If prices fell, it is not a rise, not even a negative rise.
- Ensure that all four statements are tested systematically; only one should be correct.
What is most likely to cause the price level to rise?
An increase in
Options
A productivity of labour.
B raw material prices.
C income taxes.
D subsidies paid to producers.
Answer
An increase in raw material prices raises firms' costs of production, shifting the short-run aggregate supply (SRAS) curve leftwards. This increases the price level, a classic case of cost-push inflation. The other options would not cause a rise in the price level: an increase in productivity lowers costs, an increase in income taxes reduces aggregate demand, and an increase in subsidies lowers costs. Therefore, the correct answer is B.
B
Background Concept
In macroeconomics, the price level is determined by the interaction of aggregate demand (AD) and aggregate supply (AS). A rise in the price level is called inflation. Inflation can be caused by factors that increase AD (demand-pull inflation) or factors that decrease AS (cost-push inflation). Cost-push inflation occurs when the costs of production increase, shifting the SRAS curve to the left, leading to a higher price level and lower real output. Common causes include increases in wages, raw material prices, or energy costs.
Understanding the Question
The question asks: "What is most likely to cause the price level to rise?" It presents four options, each being an increase in something. We need to identify which of these increases would typically lead to a higher price level. The key is to think about the effect of each change on either aggregate demand or aggregate supply, and then determine the impact on the price level.
Approach
For each option, consider the economic mechanism:
- A: Productivity of labour – Higher productivity means more output per worker, which reduces unit costs. This tends to increase SRAS (shift right), lowering the price level.
- B: Raw material prices – Raw materials are inputs. Higher raw material prices increase production costs, reducing SRAS (shift left), raising the price level.
- C: Income taxes – Higher income taxes reduce disposable income, leading to lower consumption and lower aggregate demand (AD shifts left), which reduces the price level.
- D: Subsidies paid to producers – Subsidies lower production costs, increasing SRAS (shift right), lowering the price level.
Only option B has a clear effect that raises the price level. The question uses "most likely," so we choose the option that unambiguously causes a rise under typical conditions.
Step-by-Step Reasoning
-
Option A: Increase in productivity of labour. When labour becomes more productive, firms can produce the same output with fewer inputs, or more output with the same inputs. This reduces average costs. The SRAS curve shifts to the right. At the new equilibrium, the price level is lower and real output is higher. So this does not cause a rise in the price level.
-
Option B: Increase in raw material prices. Raw materials are a key input in production. Higher raw material prices increase firms' costs. The SRAS curve shifts to the left. At the new equilibrium, the price level is higher and real output is lower. This is a classic example of cost-push inflation. Therefore, this option is correct.
-
Option C: Increase in income taxes. Income taxes reduce households' disposable income. With less income to spend, consumption falls, leading to a decrease in aggregate demand. The AD curve shifts to the left. At the new equilibrium, the price level is lower and real output is lower. So this does not cause a rise in the price level (it could cause deflationary pressure).
-
Option D: Increase in subsidies paid to producers. Subsidies are payments from the government to firms, effectively reducing production costs. This shifts the SRAS curve to the right. The price level falls and real output rises. So this also does not cause a rise in the price level.
Thus, only option B raises the price level.
Key Takeaways
- The price level rises when AD increases or AS decreases (shifts left).
- Cost-push inflation is caused by increases in input prices, such as raw materials, wages, or energy.
- When evaluating the impact of an economic change, always trace the effect on either AD or AS first, then determine the effect on the price level and output.
- This question tests the ability to distinguish between factors that affect costs (supply side) and factors that affect spending (demand side).
Common Mistakes
- Confusing the effect of productivity: higher productivity is often thought to be good for the economy, but it actually lowers costs and reduces the price level, not raises it.
- Thinking that income taxes affect the price level directly: they affect AD through consumption, so they lower the price level, not raise it.
- Misunderstanding the role of subsidies: subsidies are a cost reduction, so they lower the price level, not raise it.
- Failing to consider the direction of the shift: a leftward shift of SRAS raises the price level; a rightward shift lowers it.
Things to Be Careful About
- The question says "most likely," implying that we consider the typical effect. In some unusual circumstances, other factors could interact, but under standard ceteris paribus assumptions, the effect is clear.
- Remember that changes in raw material prices are a common source of cost-push inflation, especially in commodity-dependent economies.
- In multiple-choice questions, eliminate options systematically: identify which ones would lower the price level, and which would raise it.
What is most likely to increase a country's circular flow of income?
Options
A Its budget deficit increases.
B Its imports increase.
C Its interest rates increase.
D Its exchange rate increases.
Reasoning
An increase in a country's circular flow of income requires net injections to rise or net leakages to fall. A budget deficit (G > T) means government spending (an injection) exceeds taxes (a leakage); a larger deficit raises net injections, increasing national income. In contrast: B imports are a leakage, so increasing them reduces the circular flow. C higher interest rates reduce investment (an injection) and consumption, and increase savings (a leakage). D an exchange rate appreciation reduces exports (an injection) and increases imports (a leakage). Therefore A is correct.
Answer
A
A
Background Concept
The circular flow of income model illustrates the movement of spending and income between households, firms, the government and the rest of the world. The key distinction is between injections – spending that enters the circular flow from outside the household–firm loop: investment (I), government spending (G) and exports (X) – and leakages – withdrawals from the flow: savings (S), taxes (T) and imports (M). Equilibrium occurs when total injections equal total leakages. An increase in injections or a decrease in leakages raises the level of national income.
Understanding the Question
The question asks which of the four options is most likely to increase a country's circular flow of income. Each option must be evaluated for its effect on injections and leakages. The correct answer is the one that unambiguously raises net injections (injections minus leakages).
Approach
For each option, identify whether it increases injections or reduces leakages, or whether it does the opposite. The option that clearly raises net injections is the answer.
Step-by-Step Reasoning
Option A: Budget deficit increases. A budget deficit occurs when government spending (G) exceeds tax revenue (T). An increase in the deficit means either G rises, T falls, or both. G is a direct injection; T is a leakage. So a larger deficit unambiguously raises net injections, thereby increasing the circular flow of income.
Option B: Imports increase. Imports (M) are a leakage – money flows abroad to pay for foreign goods. An increase in imports raises leakages, reducing the circular flow.
Option C: Interest rates increase. Higher interest rates discourage consumption and investment: consumption expenditure (part of the core flow) falls, and investment (an injection) falls. They also encourage saving (a leakage). So net injections fall, reducing the circular flow.
Option D: Exchange rate increases (appreciation). An appreciation makes exports more expensive abroad and imports cheaper at home. Exports (an injection) are likely to fall, while imports (a leakage) are likely to rise. Net injections therefore fall, reducing the circular flow.
Only option A increases the circular flow.
Key Takeaways
- The circular flow model distinguishes injections (I, G, X) from leakages (S, T, M).
- A government budget deficit (G > T) is a net injection into the economy.
- Changes in government fiscal position directly affect the level of national income through the injection–leakage mechanism.
Common Mistakes
- Mistaking imports as an injection because they bring goods into the country – in the circular flow, the money payment for imports leaves the economy, making imports a leakage.
- Assuming a higher interest rate attracts capital inflows and thus raises the circular flow – while capital inflows affect the financial account, the circular flow model focuses on current flows of income and spending; higher interest rates typically reduce domestic spending more than they add.
- Forgetting that a budget deficit is the difference between two flows: thinking only about the spending side without considering taxes.
Things to Be Careful About
- The question asks what is most likely to increase the circular flow. In all other options, the effect is clearly negative. Option A is unambiguous once you recognise that deficit = G – T, and G is an injection.
- Ensure you are clear on the definitions: a budget deficit is not just an increase in government spending; it can also come from a tax cut. Both act to raise net injections.
- Do not confuse the circular flow of income with other macroeconomic concepts such as the balance of payments or monetary policy transmission.
A country with a constant population experiences a 5% increase in its nominal GDP during a year.
In which situation will average living standards be most likely to have increased during the year?
Options
A if government takes action to ensure there is no increase in unemployment
B if inflation during the year is 3%
C if there is no increase in real national income
D if there is no redistribution of income
Reason
Average living standards are typically measured by real GDP per capita. With a constant population, an increase in average living standards requires real GDP to rise.
Real GDP is nominal GDP adjusted for inflation:
Real GDP growth ≈ Nominal GDP growth – Inflation rate
Nominal GDP rose by 5%. For real GDP to increase, inflation must be less than 5%.
- Option A does not guarantee an increase in real GDP; unemployment could remain unchanged while inflation is high, leaving real GDP unchanged or even falling.
- Option B (inflation 3%) would give real GDP growth of approximately 2%, so real GDP per capita rises → living standards increase.
- Option C (no increase in real national income) means real GDP is unchanged, so per capita living standards do not increase.
- Option D (no redistribution of income) does not affect the average; even without redistribution, average living standards rise only if real GDP rises.
Therefore, the most likely situation is B.
Answer
B
B
Background Concept
Living standards refer to the material well-being of the average person in an economy. The most common measure is real GDP per capita – the total value of goods and services produced, adjusted for changes in the price level (inflation), divided by the population. For living standards to rise, real GDP must grow faster than the population. In this question, population is constant, so the condition simplifies to real GDP growth > 0.
Nominal GDP is the value of output at current prices, so it can increase due to either higher output or higher prices (inflation). Real GDP removes the effect of price changes, reflecting only changes in the volume of production.
The relationship between them is: Real GDP = (Nominal GDP / Price Index) × 100, or approximately: Real GDP growth ≈ Nominal GDP growth – Inflation rate.
Understanding the Question
The question presents a fact: nominal GDP increased by 5% over the year, and population stayed constant. It asks: under which of the four given conditions are average living standards most likely to have increased? This requires you to identify which option ensures (or at least makes probable) an increase in real GDP per capita.
Each option represents a different economic condition:
- A: government action prevents unemployment from rising.
- B: the inflation rate during the year is 3%.
- C: there is no increase in real national income.
- D: there is no redistribution of income.
We must evaluate each against the fundamental condition: real GDP must increase.
Approach
- Recall that average living standards depend on real GDP per capita.
- With constant population, this reduces to real GDP growth.
- Real GDP growth = nominal GDP growth minus inflation (approximately).
- For living standards to increase, real GDP growth must be positive → inflation must be less than 5%.
- Check each option:
- Option A does not guarantee inflation <5%.
- Option B directly provides an inflation rate <5%, so real GDP rises.
- Option C explicitly says real GDP is unchanged → no increase.
- Option D does not affect the average; real GDP could be unchanged even with no redistribution.
- Hence B is the only option that ensures real GDP per capita rises.
Step-by-Step Reasoning
-
Step 1: Define the goal. The question asks when average living standards are most likely to have increased. The word 'likely' suggests we need the situation that makes it probable, not certain – but in this multiple-choice context, we are to choose the option that is sufficient for the increase.
-
Step 2: Recall that with constant population, average living standards rise if and only if real GDP rises. So we need to identify which option guarantees (or strongly implies) an increase in real GDP.
-
Step 3: Analyse each option:
Option A: 'if government takes action to ensure there is no increase in unemployment'
- Unemployment not rising does not mean employment is rising – it could stay constant.
- Even if employment rises, productivity might fall or inflation could be so high that real output does not increase.
- This condition alone does not guarantee real GDP growth. For instance, if inflation is 10%, nominal GDP might still rise 5% (so real GDP falls by about 5%). The government action to avoid higher unemployment does not control inflation. So this option does not ensure living standards increase.
Option B: 'if inflation during the year is 3%'
- Nominal GDP growth = 5%, inflation = 3% → approximate real GDP growth = 5% - 3% = 2%.
- Since population constant, real GDP per capita rises by about 2%.
- This directly leads to an increase in average living standards.
Option C: 'if there is no increase in real national income'
- Real national income is the same as real GDP. 'No increase' means real GDP is unchanged.
- With population constant, real GDP per capita is unchanged – living standards do not increase.
Option D: 'if there is no redistribution of income'
- Redistribution changes the distribution of income among households but does not affect total real GDP. If real GDP is unchanged (or even if it rises), redistribution does not alter the average. For example, average real income could rise while the distribution becomes more unequal; average living standards would still rise. Conversely, if real GDP falls, average living standards fall regardless of redistribution. This option does not ensure or prevent an increase.
-
Step 4: Conclude that only option B provides a condition that guarantees an increase in real GDP per capita, so it is the correct answer.
Key Takeaways
- Real GDP per capita is the key measure of average living standards.
- Nominal vs real: always adjust for inflation to see if output has actually increased.
- Population growth matters; if population grows, real GDP must grow faster to raise per capita figures.
- When evaluating multiple-choice questions, translate each option into its effect on real GDP per capita.
Common Mistakes
- Confusing nominal and real: Some students pick A, thinking that low unemployment implies higher output, but they forget that inflation can erode real output. Without inflation data, we cannot be sure.
- Ignoring the word 'average': Option D about redistribution might tempt students because they associate inequality with lower living standards, but the average is unchanged by redistribution alone.
- Incorrect approximation: The formula real growth ≈ nominal growth – inflation is an approximation but works for small percentages; for the purpose of this question it is fine.
- Reading 'no increase in real national income' as meaning nominal national income: Option C explicitly says real national income, so it directly contradicts an increase in living standards.
Things to Be Careful About
- Population constant is given – if it were not constant, we would need to account for per capita changes.
- Living standards are multi-dimensional, but in economics problems ‘average living standards’ almost always refers to real GDP per capita.
- Inflation measurement: The approximation real growth ≈ nominal growth – inflation holds when inflation is measured as the percentage change in the GDP deflator; CPI inflation might be slightly different but conceptually the same.
- Other options: Always check why the distractors are wrong – this strengthens understanding and prevents careless errors.
Which combination correctly identifies the necessary information to construct an accurately labelled graph of a normal short-run aggregate supply curve (SRAS)?
Options
| gradient of the SRAS curve | horizontal x-axis | vertical y-axis | |
|---|---|---|---|
| A | negative | quantity | price level |
| B | positive | real output | price level |
| C | positive | real output | price |
| D | positive | price level | real output |
Reasoning
A normal short-run aggregate supply (SRAS) curve slopes upward, meaning it has a positive gradient. The horizontal x-axis must measure real output (real GDP), and the vertical y-axis must measure the price level. Option B is the only combination that gives all three correctly: positive gradient, real output on the x-axis, and price level on the y-axis. Option A reverses the gradient, Option C uses 'price' instead of 'price level' (imprecise), and Option D swaps the axes.
Answer
B
B
Background Concept
The short-run aggregate supply (SRAS) curve shows the relationship between the total quantity of real output (real GDP) that firms are willing to produce and the overall price level, holding other factors (such as wage rates, raw material prices, and productivity) constant. In the short run, nominal wages are sticky – they do not adjust fully to changes in the price level. As the price level rises, firms' revenues increase while many input costs (especially wages) remain fixed in the short run, so profit margins widen and firms increase output. This gives the SRAS curve a positive (upward) slope. The curve is typically drawn as upward-sloping but not necessarily a straight line. To construct an accurately labelled graph of this relationship, you must place the correct variable on each axis and draw the curve with the correct gradient.
Understanding the Question
This is a straightforward multiple-choice question that tests your knowledge of the standard labelling conventions for the SRAS diagram. The question asks which combination among four options correctly identifies three features: the gradient of the curve, the label for the horizontal axis (x-axis), and the label for the vertical axis (y-axis). The options are given in a table format. You need to recall that:
- The SRAS curve slopes upward (positive gradient).
- The x-axis measures real output (sometimes called real GDP or national output).
- The y-axis measures the price level (a broad index such as the CPI or GDP deflator, not just 'price' of one good).
Any option that deviates from these is incorrect. The command word is 'identifies' – essentially recall and match.
Approach
Scan the table row by row, checking each column against the known correct specifications.
- Check gradient: SRAS has a positive gradient. Eliminate any option that says 'negative' – that would be Option A.
- Check x-axis: must be real output (quantity of real output). Option D has 'price level' on the x-axis, which is wrong – eliminate D.
- Check y-axis: must be price level. Option C has 'price' – that is ambiguous and not the standard label 'price level'; also, Option C has positive gradient and real output on x, but 'price' is not sufficiently precise. In A-Level economics, the y-axis is explicitly 'price level', not just 'price'. So Option C is less precise and likely considered incorrect. Option B has 'price level' exactly.
Thus, only Option B satisfies all three requirements correctly.
Step-by-Step Reasoning
- Recall the textbook diagram for SRAS: the vertical axis is labelled 'Price Level' (or sometimes 'Average Price Level'), and the horizontal axis is labelled 'Real Output' (or 'Real GDP' / 'National Output').
- The SRAS curve is upward-sloping from left to right, so its gradient is positive.
- Option A: negative gradient – wrong.
- Option B: positive gradient, x-axis = real output, y-axis = price level – correct.
- Option C: positive gradient, x-axis = real output, y-axis = price – 'price' could be mistaken for the price of a single good; the macro diagram always uses 'price level'. Also, the mark scheme likely expects the exact term 'price level'. Therefore, Option C is incorrect.
- Option D: positive gradient (but that's the only correct part), x-axis = price level, y-axis = real output – axes swapped, completely wrong.
Thus the only fully correct combination is Option B.
Key Takeaways
- Always use the precise and standard labels: 'Price Level' for the vertical axis and 'Real Output' (or 'Real GDP') for the horizontal axis in AD/AS diagrams.
- The SRAS curve is upward-sloping (positive gradient) in the short run because of sticky nominal wages.
- In multiple-choice questions that test diagram conventions, pay close attention to the exact wording of axis labels; 'price' is not the same as 'price level'.
Common Mistakes
- Choosing Option C because 'price' is close enough to 'price level'. In Cambridge A-Level Economics, the distinction matters – 'price level' is the aggregate index, while 'price' suggests a single product's price. The exam expects the macro-economic terminology.
- Forgetting the gradient: a common error is to think SRAS is vertical (like LRAS) or downward-sloping. SRAS is upward-sloping; only the Keynesian extreme has a horizontal portion, but the 'normal' SRAS is positively sloped.
- Confusing axes: putting price level on the horizontal and real output on the vertical is a frequent careless mistake illustrated by Option D.
Things to Be Careful About
- Read the table carefully – each row gives three attributes. Check all three, not just one or two.
- The word 'normal' in the question means the typical upward-sloping SRAS, not the extreme Keynesian flat portion or the vertical classical long-run curve.
- The question uses 'quantity' in Option A for the x-axis; 'quantity' is too vague (quantity of what?) – real output is the precise term.
- In the exam, if you are unsure, eliminate obviously wrong options first (negative gradient, swapped axes) and then decide between the remaining two by checking the exact terminology.
A government makes two changes to income tax.
1 The individual tax-free income allowance is increased.
2 The marginal rate of income tax is decreased.
How will these changes affect aggregate demand and aggregate supply in the economy?
Options
| aggregate demand | aggregate supply | |
|---|---|---|
| A | decrease | increase |
| B | decrease | unchanged |
| C | increase | increase |
| D | increase | unchanged |
Reasoning
Increasing the individual tax-free income allowance and decreasing the marginal rate of income tax both increase households' disposable income. A rise in disposable income increases consumption, which is a component of aggregate demand (AD = C + I + G + X – M). Therefore, the AD curve shifts to the right.
A lower marginal rate of income tax also improves the incentive to work, as workers keep a larger share of each additional pound earned. This can increase the quantity of labour supplied, raising the economy's productive capacity and shifting the short-run aggregate supply (SRAS) curve to the right. Over time, it may also shift the long-run aggregate supply (LRAS) curve if labour productivity and labour force participation rise permanently.
Thus both aggregate demand and aggregate supply increase.
Answer
C
C
Background Concept
Fiscal policy refers to changes in government spending and taxation to influence the economy. The government's budget can be used to affect both aggregate demand (AD) and aggregate supply (AS).
In the AD/AS model, AD represents total planned spending in the economy: AD = C + I + G + (X – M). Changes in taxation influence disposable income, which directly affects consumption (C). A reduction in tax liability increases disposable income, leading to higher consumption and a rightward shift of the AD curve. This is an expansionary fiscal policy stance.
Aggregate supply, on the other hand, reflects the economy's productive capacity. Supply-side policies — including changes to marginal tax rates — can shift the SRAS and LRAS curves by altering incentives to work, invest, and produce.
This question combines two distinct income tax changes, each affecting different aspects of the economy.
Understanding the Question
The government makes two simultaneous changes:
- Increase the tax-free allowance — the amount of income that is not subject to income tax. This raises the net income of all taxpayers, particularly lower- and middle-income earners.
- Decrease the marginal rate of income tax — the percentage of tax paid on the next pound earned. This increases the reward for earning additional income, primarily benefiting those earning above the tax-free threshold.
We are asked how these changes affect aggregate demand and aggregate supply. The answer requires thinking through both channels.
Approach
Break the effects down:
-
Effect on aggregate demand: Both changes raise disposable income for households. More disposable income means higher consumption spending, the largest component of AD. Therefore AD increases.
-
Effect on aggregate supply: A lower marginal tax rate increases the incentive to work, as workers keep more of each extra pound earned. This can raise labour supply, leading to higher output and shifting SRAS to the right. Over time, if the higher labour supply boosts investment in human capital, LRAS may also shift right.
There is no reason to believe AD or AS would decrease or remain unchanged, so the correct option is C: both increase.
Step-by-Step Reasoning
-
Increase in tax-free allowance:
- All individuals earning above the old tax-free allowance now have a larger portion of their income untaxed. For a worker earning £30,000, if the allowance rises from £12,500 to £13,000, their taxable income falls by £500, saving them (at the basic 20% rate) £100. Their disposable income is £100 higher.
- Higher disposable income -> higher consumption -> AD rises (shift right).
-
Decrease in marginal tax rate:
- For a worker considering overtime or a promotion, a lower marginal tax rate means they retain more of the additional earnings. The opportunity cost of leisure falls relative to work, so the substitution effect encourages more work. The income effect is ambiguous (higher net income from existing work might reduce desire for extra work), but the substitution effect dominates for most workers, especially if the rate cut is significant.
- Higher labour supply increases the quantity of labour, which is a factor of production. With more labour input, the economy can produce more goods and services at any given price level. This shifts SRAS to the right.
- Over time, higher post-tax wages may also encourage investment in skills, shifting LRAS.
-
Combined effect:
- AD shifts right due to higher consumption.
- SRAS shifts right due to higher labour supply and improved work incentives.
- The new equilibrium will have higher real output, while the effect on the price level depends on the relative magnitudes of the shifts. The question simply asks for the direction of change, so both increase.
Key Takeaways
- Tax policy can affect the economy through both demand-side and supply-side channels.
- Expansionary fiscal policy that reduces tax liabilities boosts AD by increasing disposable income.
- Supply-side tax policy (lower marginal rates) can shift AS by improving work incentives and productive capacity.
- In the AD/AS framework, always consider which curves shift and why.
Common Mistakes
- Only considering AD: Many students incorrectly think changes to income tax only affect consumption. They forget the supply-side effect of marginal rate changes.
- Confusing average and marginal rates: The tax-free allowance affects the average tax rate, while the marginal rate affects the incentive to earn extra income. Both affect disposable income but through different mechanisms.
- Thinking a reduction in tax revenue always reduces AD: Lower tax rates may reduce government revenue, but the direct effect on household disposable income increases private spending, which raises AD. The government can finance any shortfall through borrowing or spending cuts, so the net effect on AD is typically positive.
Things to Be Careful About
- The question asks about both AD and AS separately. Make sure to distinguish the two effects.
- The effect on AS is more indirect; it works through incentives rather than immediate spending. But it is a valid economic effect.
- If the question were about a decrease in the average rate of income tax (e.g., a flat rate cut), the supply-side effect would still exist, but it would be stronger for a marginal rate cut because it targets the reward from extra work.
- Watch out for option D: 'increase AD, AS unchanged'. That would imply the marginal rate cut has no supply-side effect, which is incorrect in most economic models.
Which supply-side policy is most likely to decrease a government's budget deficit?
Options
A cutting tax rates on company profits
B cutting unemployment benefits
C raising spending on education and training
D raising tax-free income tax allowances
Answer
A budget deficit occurs when government spending exceeds tax revenue. Cutting unemployment benefits (B) reduces government spending, directly narrowing the deficit, while also incentivising work — a supply-side benefit. The other options either reduce revenue (A, D) or increase spending (C), worsening the deficit.
B
B
Background Concept
Supply-side policies aim to increase the productive capacity of the economy by shifting the LRAS curve to the right. They include measures to improve labour supply, such as reducing unemployment benefits to increase the incentive to work. A government's budget deficit is the shortfall when its total spending exceeds its total revenue from taxes and other sources. The deficit can be reduced by increasing revenue (raising taxes) or decreasing spending (cutting expenditure). Supply-side policies can affect both sides of the budget: some involve government spending (e.g., training) while others change tax revenue (e.g., tax cuts). The question asks which of the listed supply-side policies is most likely to decrease the deficit.
Understanding the Question
The question presents four supply-side policy options. The task is to identify which one is most likely to reduce a government's budget deficit. This requires understanding the direct effect of each policy on the government's fiscal position. The budget deficit is the difference between government spending and government revenue. A policy that reduces spending or increases revenue will decrease the deficit; a policy that increases spending or reduces revenue will increase the deficit. Each option must be evaluated on this basis.
Approach
Evaluate each option in turn:
- A: Cutting tax rates on company profits — reduces government revenue from corporation tax. Though it may stimulate investment and growth, the direct effect is lower revenue, likely increasing the deficit.
- B: Cutting unemployment benefits — reduces government spending on welfare. The direct effect is lower spending, decreasing the deficit. It also incentivises work, potentially increasing tax revenue in the long run, but the immediate effect is a reduction in expenditure.
- C: Raising spending on education and training — increases government spending. While it may boost long-run productivity, the immediate effect is a higher deficit.
- D: Raising tax-free income tax allowances — reduces the tax base, lowering income tax revenue. This increases the deficit.
The only option that directly reduces government spending is B.
Step-by-Step Reasoning
-
Define budget deficit: Budget deficit = Government spending - Government revenue. A decrease in spending or an increase in revenue reduces the deficit.
-
Option A: Cut tax rates on company profits.
- Effect on revenue: Lower tax rates reduce corporation tax revenue (assuming no Laffer curve effect that would increase revenue from higher economic activity). The direct effect is a decrease in revenue.
- Effect on spending: No direct effect.
- Net effect on deficit: Revenue falls, so deficit increases (or surplus decreases). Not correct.
-
Option B: Cut unemployment benefits.
- Effect on spending: Unemployment benefits are a government transfer payment. Cutting them directly reduces government spending.
- Effect on revenue: By strengthening work incentives, more people may enter employment, increasing income tax revenue and reducing further benefit claims. This is a secondary effect that also helps reduce the deficit.
- Net effect on deficit: Spending falls, and revenue may rise. Both decrease the deficit. This is the correct answer.
-
Option C: Raise spending on education and training.
- Effect on spending: Increased government expenditure on education and training. This directly increases spending.
- Effect on revenue: Improved human capital may raise future productivity and tax revenue, but this is long-term and uncertain.
- Net effect on deficit: Spending rises, so deficit increases. Not correct.
-
Option D: Raise tax-free income tax allowances.
- Effect on revenue: Increasing the tax-free allowance reduces the amount of income subject to tax, thereby reducing income tax revenue.
- Effect on spending: No direct effect on spending (though may increase disposable income, but not government spending).
- Net effect on deficit: Revenue falls, deficit increases. Not correct.
-
Conclusion: Only cutting unemployment benefits (B) directly reduces government spending and thus decreases the budget deficit. The other options either cut revenue or raise spending, worsening the deficit.
Key Takeaways
- Supply-side policies can have significant fiscal implications. Some reduce government revenue (tax cuts), some increase spending (training), and some reduce spending (benefit cuts).
- A policy that aims to increase long-run productivity does not necessarily improve the budget deficit in the short run.
- The budget deficit is directly affected by changes in government spending and revenue. When evaluating policies for their effect on the deficit, consider the immediate impact on these flows.
Common Mistakes
- Assuming that any policy that promotes economic growth will automatically reduce the deficit. Growth can increase tax revenue, but if the policy initially raises spending (e.g., infrastructure) or cuts taxes, the deficit may worsen in the short run.
- Confusing a policy's effect on the economy (e.g., cutting taxes may stimulate growth) with its effect on the government budget. The question specifically asks about the budget deficit, not overall economic performance.
- Not considering the direct fiscal impact of each option. Some students might think cutting taxes can increase revenue via the Laffer curve, but the question asks for the 'most likely' effect, and for standard assumptions, tax cuts reduce revenue.
- Overlooking that cutting unemployment benefits is both a supply-side policy (improving labour supply) and a fiscal contraction (reducing spending).
Things to Be Careful About
- Distinguish between government spending (which includes transfer payments like benefits) and other types of spending.
- Remember that a budget deficit is a flow concept measured over a period (usually a year). The question asks which policy is 'most likely' to decrease the deficit, so consider the most direct and predictable effect.
- Do not overcomplicate with long-run dynamics unless they are clearly relevant; the direct effect is sufficient for this question.
- Be precise with terminology: 'budget deficit' vs 'national debt'. The deficit is the annual shortfall; the debt is the accumulation.
Which combination of fiscal and monetary policies would certainly be expansionary?
Options
| government spending | taxes | money supply | |
|---|---|---|---|
| A | decrease | decrease | decrease |
| B | decrease | increase | decrease |
| C | increase | decrease | increase |
| D | increase | increase | increase |
Answer
Expansionary fiscal policy involves increasing government spending and/or decreasing taxes. Expansionary monetary policy involves increasing the money supply. Therefore, the combination that is certainly expansionary is option C: increase government spending, decrease taxes, and increase the money supply.
C
Background Concept
Fiscal policy refers to the government's use of its spending and taxation to influence the economy. Expansionary fiscal policy is designed to increase aggregate demand (AD) and is implemented by increasing government spending or decreasing taxes. Monetary policy refers to the central bank's control of the money supply and interest rates. Expansionary monetary policy increases the money supply (or reduces interest rates) to stimulate AD.
Understanding the Question
This multiple-choice question asks which combination of changes in government spending, taxes, and the money supply would certainly be expansionary. The word "certainly" is important: it means that all three changes must be individually expansionary, so that the combined effect is unambiguously expansionary. If any one change is contractionary, the overall effect is uncertain.
Approach
Identify the direction of each policy action:
- Government spending: expansionary if increased, contractionary if decreased.
- Taxes: expansionary if decreased, contractionary if increased.
- Money supply: expansionary if increased, contractionary if decreased.
Then find the row in the table where all three actions are expansionary.
Step-by-Step Reasoning
-
Expansionary fiscal policy: increases AD through higher government spending (G) or lower taxes (which boost consumption and investment). Therefore, to be expansionary, government spending should increase and taxes should decrease.
-
Expansionary monetary policy: increases the money supply, which lowers interest rates, encourages borrowing and spending, and shifts AD to the right. Therefore, to be expansionary, the money supply should increase.
-
Now examine each option:
- Option A: government spending decreases (contractionary), taxes decrease (expansionary), money supply decreases (contractionary). Not all expansionary.
- Option B: government spending decreases (contractionary), taxes increase (contractionary), money supply decreases (contractionary). All contractionary.
- Option C: government spending increases (expansionary), taxes decrease (expansionary), money supply increases (expansionary). All expansionary. This is the correct answer.
- Option D: government spending increases (expansionary), taxes increase (contractionary), money supply increases (expansionary). Not all expansionary because taxes increase is contractionary.
-
Therefore, only option C has all three components expansionary, so it would certainly be expansionary.
Key Takeaways
- Expansionary fiscal policy: increase government spending, decrease taxes.
- Expansionary monetary policy: increase money supply, decrease interest rates.
- When evaluating policy combinations, each component must be considered individually.
Common Mistakes
- Confusing the direction of tax changes: a tax decrease is expansionary, not contractionary.
- Thinking that any combination with at least one expansionary component is enough; the question asks for "certainly expansionary", meaning all components must be expansionary.
- Misreading the table: some students might think increasing taxes is expansionary because it raises government revenue, but that is incorrect for AD stimulation.
Things to Be Careful About
- Pay attention to the word "certainly" – it implies that the outcome must be unambiguous.
- Remember that expansionary monetary policy increases the money supply; contractionary monetary policy decreases it.
- Fiscal policy expansion requires both higher spending and/or lower taxes, but not both necessarily; however, here the question asks for a combination where all three are expansionary.
The central bank of a country raises interest rates to reduce the general price level.
When is this policy likely to have the biggest impact?
Options
| position of the economy on its production possibility curve (PPC) diagram | responsiveness of aggregate demand to interest rate changes | |
|---|---|---|
| A | below the PPC | high |
| B | below the PPC | low |
| C | on the PPC | high |
| D | on the PPC | low |
Answer
Raising interest rates reduces aggregate demand (AD) by lowering consumption and investment. The biggest impact on the general price level occurs when the economy is on its PPC (no spare capacity) and the responsiveness of AD to interest rate changes is high. On the PPC, the economy is at full employment, so a fall in AD reduces the price level significantly rather than output. High responsiveness means a given interest rate rise causes a large fall in AD. Therefore, the correct answer is C.
C
Background Concept
This question tests two key ideas from macroeconomics: the transmission mechanism of monetary policy and the significance of an economy's position on its production possibility curve (PPC).
Monetary policy transmission: When a central bank raises interest rates, it makes borrowing more expensive and saving more attractive. This reduces consumption (especially on durable goods bought on credit) and investment (as the cost of capital rises). The fall in these components of aggregate demand (AD) shifts the AD curve leftwards. In AD/AS analysis, this leftward shift reduces both the price level and real output in the short run, but the split between the two effects depends on the slope of the short-run aggregate supply (SRAS) curve.
PPC position and spare capacity: A point on the PPC means the economy is using all its resources efficiently — there is no spare capacity. The SRAS curve is steep or vertical in this region. A point below the PPC means there is spare capacity (unemployed resources), so the SRAS curve is relatively flat. When AD falls, the impact on the price level versus output depends on this slope: with spare capacity (below PPC), the fall in AD mainly reduces output; without spare capacity (on PPC), the fall in AD mainly reduces the price level.
Responsiveness of AD to interest rates: This is the interest elasticity of AD. If AD is highly responsive (high elasticity), a given rise in interest rates causes a large leftward shift of AD. If responsiveness is low, the shift is small.
Understanding the Question
The question asks: when is a rise in interest rates likely to have the biggest impact on reducing the general price level? It presents a 2x2 matrix of conditions: the economy's position on its PPC (below or on) and the responsiveness of AD to interest rate changes (high or low). We need to identify which combination produces the largest fall in the price level.
The key is to recognise that the policy's goal is to reduce the price level, not output. Therefore, we want conditions where the leftward shift of AD translates mostly into a lower price level rather than a fall in real output, and where the shift itself is large.
Approach
- Identify the effect of higher interest rates: A rise in interest rates reduces AD (leftward shift of AD curve).
- Consider the PPC position: On the PPC = no spare capacity = steep SRAS. Below the PPC = spare capacity = flat SRAS. A leftward AD shift with steep SRAS reduces the price level more; with flat SRAS it reduces output more.
- Consider responsiveness: High responsiveness means a large leftward shift of AD for a given interest rate rise; low responsiveness means a small shift.
- Combine: The biggest price level reduction requires both a large AD shift (high responsiveness) and a steep SRAS (on the PPC). This is option C.
Step-by-Step Reasoning
Step 1: The policy action and its immediate effect
The central bank raises interest rates. This increases the cost of borrowing and the return on saving. Consumers reduce spending on credit-financed goods (cars, houses, etc.) and increase saving. Firms postpone investment projects because the cost of capital rises. Net exports may also fall if higher domestic interest rates attract foreign capital, causing the currency to appreciate. All these reduce AD.
Step 2: The AD/AS framework
The economy is initially in equilibrium at the intersection of AD and SRAS. A leftward shift of AD moves the equilibrium. The new equilibrium has a lower price level and lower real output. The relative sizes of these two changes depend on the slope of the SRAS curve.
Step 3: PPC position and SRAS slope
- On the PPC: The economy is at full employment. The SRAS curve is steep (or vertical in the classical long run). A leftward shift of AD causes a large fall in the price level and a small fall in real output. This is because firms cannot easily reduce output when already at capacity; instead, they cut prices to clear markets.
- Below the PPC: There is spare capacity (unemployed labour and capital). The SRAS curve is relatively flat. A leftward shift of AD causes a large fall in real output and a small fall in the price level. Firms respond to falling demand by reducing production rather than cutting prices, because they have idle resources.
Step 4: Responsiveness of AD
- High responsiveness: The interest elasticity of AD is high. A 1% rise in interest rates causes a large percentage fall in AD. The AD curve shifts leftwards by a large distance.
- Low responsiveness: The interest elasticity is low. The same 1% rise causes only a small fall in AD. The AD curve shifts leftwards by a small distance.
Step 5: Combining the two conditions
The biggest impact on the price level requires:
- A large leftward shift of AD (high responsiveness) — to maximise the fall in the price level.
- A steep SRAS (on the PPC) — so that the fall in AD translates mostly into a lower price level rather than lower output.
Option C gives both: on the PPC and high responsiveness. Option A (below PPC, high responsiveness) gives a large AD shift but most of it reduces output, not the price level. Option B (below PPC, low responsiveness) gives a small AD shift that mostly reduces output. Option D (on PPC, low responsiveness) gives a small AD shift that mostly reduces the price level, but the shift is too small for a big impact.
Therefore, C is correct.
Key Takeaways
- The effectiveness of monetary policy in reducing inflation depends on the state of the economy (spare capacity) and the responsiveness of AD to interest rates.
- A position on the PPC (full employment) makes demand-side policies more effective at reducing the price level because the SRAS is steep.
- The interest elasticity of AD determines the size of the AD shift for a given interest rate change.
- This question illustrates the importance of combining macroeconomic concepts (monetary policy, AD/AS, PPC) to evaluate policy effectiveness.
Common Mistakes
- Confusing PPC position with the slope of SRAS: Some students think being below the PPC means the economy is 'weak' and therefore more responsive to policy. In fact, below the PPC means spare capacity and a flat SRAS, which makes demand-side policy less effective at reducing the price level.
- Ignoring the goal: The question asks about reducing the price level, not output. Students who focus on reducing output might incorrectly choose A (below PPC, high responsiveness) because that gives a large output fall.
- Misunderstanding 'responsiveness': Some might think low responsiveness is better because it means the policy is 'targeted'. But 'biggest impact' means the largest fall in the price level, which requires a large AD shift.
Things to Be Careful About
- Read the question carefully: it asks when the policy is 'likely to have the biggest impact' on reducing the general price level. The answer must maximise the price level effect, not the output effect.
- Remember that the PPC shows potential output, not actual output. A point on the PPC means the economy is producing at its maximum sustainable level.
- The responsiveness of AD to interest rates is not the same as the slope of the AD curve. It refers to the size of the shift of the AD curve in response to an interest rate change.
The table shows the trade in goods and services for an economy between 2019 and 2021.
| year | trade in goods and services ($ millions) |
|---|---|
| 2019 | -1000 |
| 2020 | -3000 |
| 2021 | -4000 |
What would have most likely caused the change from 2019 to 2021?
Options
A increasing domestic unemployment
B increasing domestic rate of income tax
C increasing domestic inflation
D increasing import tariffs
Answer
Increasing domestic inflation makes exports relatively more expensive and imports relatively cheaper, reducing net exports (X-M) and worsening the current account deficit. The trade deficit moved from -1000 to -4000, consistent with a loss of competitiveness due to inflation.
C
Background Concept
The balance of trade in goods and services is the difference between exports and imports. A trade deficit (negative balance) means imports exceed exports. The current account balance is affected by factors that influence the competitiveness of a country's exports and the attractiveness of imports. One key factor is the relative inflation rate: if a country's inflation rate is higher than that of its trading partners, its goods become relatively more expensive abroad, reducing export demand. At the same time, foreign goods become relatively cheaper for domestic consumers, increasing imports. This leads to a worsening of the trade balance. Other factors include domestic income, exchange rates, tariffs, and productivity.
Understanding the Question
The table shows the trade balance moving from -1000 (deficit) in 2019 to -4000 in 2021, a worsening of 3000. The question asks what would most likely have caused this change. The four options are all domestic economic conditions. The candidate must identify which of these would directly lead to a larger trade deficit. It is crucial to think about the mechanism: which of these changes would reduce exports or increase imports?
Approach
We need to evaluate each option in terms of its likely effect on the trade balance. Option A: increasing domestic unemployment. Higher unemployment typically reduces domestic income and spending, which might reduce imports, potentially improving the trade balance. Option B: increasing domestic rate of income tax. This reduces disposable income, leading to lower consumption expenditure, including on imports, which could improve the trade balance. Option D: increasing import tariffs. Tariffs raise the price of imports, discouraging imports, which could improve the trade balance. Option C: increasing domestic inflation. This makes exports less competitive and imports more attractive, worsening the trade deficit. Therefore, C is the most likely cause.
Step-by-Step Reasoning
- The trade deficit worsened from -1000 to -4000, meaning net exports fell by 3000.
- Option A: Increasing domestic unemployment. Unemployment reduces income and demand. Lower demand would reduce imports, improving the trade balance (or at least not worsening it). So this is unlikely to cause a larger deficit.
- Option B: Increasing domestic rate of income tax. Higher tax reduces disposable income, leading to lower consumption, including imports. Again, this would tend to reduce the deficit, not increase it.
- Option D: Increasing import tariffs. Tariffs make imports more expensive, so the quantity of imports falls. This would improve the trade balance (if the price effect is not too large). The trade deficit would likely shrink, not grow.
- Option C: Increasing domestic inflation. If domestic prices rise faster than foreign prices, exports become more expensive for foreign buyers, reducing export quantity. Imports become cheaper relative to domestic goods, increasing import quantity. The net effect is a worsening of the trade balance. This matches the observed change.
Thus, the most likely cause is increasing domestic inflation.
Key Takeaways
- Inflation erodes competitiveness and worsens the trade balance.
- Higher unemployment or income taxes reduce domestic demand, including imports, improving the trade balance.
- Tariffs discourage imports and improve the trade balance (in the short run, ignoring retaliation).
- The trade balance is influenced by relative prices, income levels, and trade policies.
Common Mistakes
- Confusing the effect of inflation on the trade balance: some might think inflation reduces purchasing power and thus reduces imports, but the key is the relative price effect on competitiveness.
- Thinking that higher unemployment increases the trade deficit because it indicates a struggling economy, but in fact it reduces imports.
- Overlooking that tariffs reduce imports, so they would improve the trade balance, not worsen it.
Things to Be Careful About
- The question asks for the 'most likely' cause, so we need to consider the direct effect of each option.
- The magnitude of the deficit change is large, but that does not affect the reasoning; the direction is what matters.
- In the real world, multiple factors might interact, but for this question we assume ceteris paribus for each option.
A government subsidises training to improve the skills of workers in the industrial sector of an economy.
What is the most likely effect on the current account of the balance of payments?
Options
A exports fall
B exports rise
C imports fall
D imports rise
Answer
Subsidising training improves the skills of workers, increasing labour productivity and reducing production costs for firms in the industrial sector. This makes domestically produced goods more competitive in international markets, leading to higher export volumes. Therefore, the most likely effect on the current account is that exports rise. The correct answer is Option B.
B
Background Concept
Supply-side policies aim to increase the productive capacity of the economy by improving the quantity or quality of factors of production. Training is a key supply-side tool that enhances human capital, raising labour productivity. Higher productivity reduces unit costs, making domestic firms more competitive internationally. The current account of the balance of payments records trade in goods and services, primary income, and secondary income. An improvement in competitiveness tends to increase exports and may also reduce imports, improving the current account balance.
Understanding the Question
The question describes a government subsidy for training workers in the industrial sector. It asks for the most likely effect on the current account, with four options: exports fall, exports rise, imports fall, imports rise. The subsidy is a supply-side policy intended to improve skills and productivity. The key is to trace the chain of effects: training -> higher productivity -> lower costs -> greater international competitiveness -> increased exports. Imports might also fall if domestic goods become more competitive against imports, but the most direct and likely effect is on exports.
Approach
Consider the initial impact of the subsidy. It reduces the cost to firms of training workers, so they invest more in human capital. As workers become more skilled, productivity rises, lowering unit costs. Lower costs allow firms to reduce prices or improve quality, making their products more attractive to foreign buyers. This leads to higher export sales. The effect on imports is less direct: if domestic goods become more competitive, some consumers may switch from imports to domestic products, but the question asks for the 'most likely' effect, and the direct link to exports is stronger. Therefore, the answer is that exports rise.
Step-by-Step Reasoning
- The government subsidises training, reducing the cost to firms of upskilling workers.
- Firms respond by providing more training, improving the skills of the workforce.
- Skilled workers are more productive, meaning they can produce more output per hour.
- Higher productivity reduces the average cost of production for firms.
- Lower costs allow firms to lower their prices or improve product quality without increasing prices.
- This makes domestically produced goods more competitive in international markets.
- Foreign buyers increase demand for these goods, leading to a rise in export volumes.
- The current account records exports as a credit; an increase in exports improves the current account balance.
- Option B is the correct choice.
Key Takeaways
- Supply-side policies such as training can improve productivity and international competitiveness.
- The current account is affected by changes in export and import volumes.
- A direct causal chain from policy to export performance is crucial for analysis.
- In multiple-choice questions, focus on the most direct and likely effect, not secondary possibilities.
Common Mistakes
- Confusing supply-side policy with demand-side policy: training is supply-side, not fiscal or monetary policy.
- Thinking that the subsidy directly increases exports without considering the intermediate steps of productivity and cost reduction.
- Selecting 'imports fall' because domestic goods become more competitive, but this is a secondary effect; the question asks for the most likely effect, and the primary effect is on exports.
- Ignoring the distinction between the current account and the capital/financial account.
Things to Be Careful About
- Ensure the causal chain is logical and complete: subsidy -> training -> productivity -> costs -> competitiveness -> exports.
- Remember that the current account includes trade in goods and services, not just goods.
- The question specifies 'most likely effect', so choose the option that is most direct and certain.
- Be aware that the subsidy is for training, not for production directly, so the effect operates through productivity.
Using all their resources efficiently, country X can produce 6 million tonnes of wheat or 2 million tonnes of steel whilst country Y can produce 4 million tonnes of wheat or 1 million tonnes of steel.
Based on this information, what does the theory of comparative advantage suggest?
Options
A Country X should produce only steel.
B Country X will not gain from international trade.
C Country Y has no comparative advantage.
D Country Y will not gain from international trade.
Answer
Country X can produce 6 million tonnes of wheat or 2 million tonnes of steel. Therefore, the opportunity cost of producing 1 tonne of steel is 3 tonnes of wheat (6/2). Country Y can produce 4 million tonnes of wheat or 1 million tonnes of steel, so its opportunity cost of 1 tonne of steel is 4 tonnes of wheat (4/1). Since 3 < 4, country X has a lower opportunity cost in steel production and thus a comparative advantage in steel. The theory of comparative advantage suggests that each country should specialise in the good in which it has the lower opportunity cost. Therefore, country X should specialise in and produce only steel. Option A is correct.
A
Background Concept
Comparative advantage is the ability of a country to produce a good at a lower opportunity cost than another country. Opportunity cost is the value of the next best alternative foregone. The theory of comparative advantage, developed by David Ricardo, states that countries can gain from trade if they specialise in producing the goods in which they have a comparative advantage and then trade with each other. Even if one country has an absolute advantage in both goods (can produce more of both with the same resources), trade can still benefit both if their opportunity costs differ. The key is to compare the opportunity costs of producing each good across countries.
Understanding the Question
This question provides production possibilities for two countries, X and Y, when using all their resources efficiently. Country X can produce 6 million tonnes of wheat or 2 million tonnes of steel. Country Y can produce 4 million tonnes of wheat or 1 million tonnes of steel. The question asks: "Based on this information, what does the theory of comparative advantage suggest?" The answer choices are about which country should produce which good, and whether there are gains from trade. We need to determine the opportunity costs and then apply the principle of comparative advantage.
Approach
First, calculate the opportunity cost of producing steel in terms of wheat for each country. The opportunity cost of 1 tonne of steel is the amount of wheat that could have been produced with the same resources. For country X, producing 2 million tonnes of steel uses resources that could have produced 6 million tonnes of wheat, so the opportunity cost of 1 tonne of steel is 6/2 = 3 tonnes of wheat. For country Y, producing 1 million tonnes of steel uses resources that could have produced 4 million tonnes of wheat, so the opportunity cost of 1 tonne of steel is 4/1 = 4 tonnes of wheat. Since country X has a lower opportunity cost in steel (3 < 4), it has a comparative advantage in steel production. Conversely, country Y has a lower opportunity cost in wheat production (1/4 = 0.25 tonnes of steel per tonne of wheat) compared to country X (1/3 ≈ 0.33 tonnes of steel per tonne of wheat), so country Y has a comparative advantage in wheat. The theory suggests that country X should specialise in steel and country Y should specialise in wheat, and they can trade to mutual benefit. Therefore, the correct answer is A: "Country X should produce only steel."
Step-by-Step Reasoning
- Identify the production possibilities: Country X: 6 million tonnes wheat OR 2 million tonnes steel. Country Y: 4 million tonnes wheat OR 1 million tonnes steel.
- Calculate opportunity cost of steel in each country:
- Country X: Forgone wheat per unit of steel = 6/2 = 3 tonnes of wheat per tonne of steel.
- Country Y: Forgone wheat per unit of steel = 4/1 = 4 tonnes of wheat per tonne of steel.
- Compare opportunity costs: Country X has a lower opportunity cost in steel (3 < 4). Therefore, Country X has a comparative advantage in steel.
- Calculate opportunity cost of wheat in each country:
- Country X: Forgone steel per unit of wheat = 2/6 = 1/3 ≈ 0.333 tonnes of steel per tonne of wheat.
- Country Y: Forgone steel per unit of wheat = 1/4 = 0.25 tonnes of steel per tonne of wheat.
- Compare: Country Y has a lower opportunity cost in wheat (0.25 < 0.333). Therefore, Country Y has a comparative advantage in wheat.
- Application of theory: Each country should specialise in the good in which it has a comparative advantage. Thus, Country X should specialise in steel (produce only steel, i.e., 2 million tonnes) and Country Y should specialise in wheat (produce only wheat, i.e., 4 million tonnes). They can then trade to consume both goods. Both countries can gain from trade because they can obtain the other good at a lower opportunity cost than if they produced it domestically.
- Evaluate options:
- A: "Country X should produce only steel." This is correct because Country X has comparative advantage in steel.
- B: "Country X will not gain from international trade." This is false. As long as the terms of trade are between the two opportunity costs, both gain.
- C: "Country Y has no comparative advantage." This is false. Country Y has comparative advantage in wheat.
- D: "Country Y will not gain from international trade." This is false; both gain.
Thus, A is correct.
Key Takeaways
- Comparative advantage is about lower opportunity cost, not absolute advantage.
- To determine comparative advantage, calculate opportunity cost for each good in each country.
- Specialisation according to comparative advantage allows both countries to gain from trade.
- Even if one country is less efficient in both goods, trade can still be beneficial if opportunity costs differ.
- The terms of trade must lie between the two autarky opportunity cost ratios for gains to be realised.
Common Mistakes
- Confusing absolute advantage with comparative advantage. An absolute advantage means producing more with the same resources, but trade is based on comparative advantage.
- Failing to calculate opportunity cost correctly. For example, some might think that because Country X can produce more of both goods, it should produce both, missing the gains from specialisation.
- Misinterpreting the opportunity cost ratio: For steel, it is wheat given up per steel, not steel per wheat.
- Assuming that if one country has absolute advantage in both, the other cannot gain from trade. This is a classic error; comparative advantage shows that trade can still benefit both.
Things to Be Careful About
- Always calculate opportunity cost from the perspective of the good being produced. For steel, the opportunity cost is the amount of wheat forgone.
- Ensure the units are consistent: here, both are in millions of tonnes, so the ratio is valid.
- The question only asks for what the theory suggests; the answer correctly identifies the specialisation pattern for Country X.
- Remember that the theory suggests specialisation, but in reality, complete specialisation may not occur due to transport costs, diminishing returns, or non-traded goods. However, for the basic model, the answer is A.
Countries X and Y are trade partners.
An increase in which economic indicator in country Y is most likely to cause a fall in the exchange rate of country X?
Options
A economic growth
B inflation rate
C money supply
D trade barriers
An increase in trade barriers in country Y (e.g., higher tariffs on imports from X) reduces the quantity of imports from X. This reduces the demand for country X's currency on the foreign exchange market, causing its exchange rate to fall. In contrast, economic growth, inflation, and money supply changes in Y would not unambiguously reduce demand for X's currency.
Answer
D
D
Background Concept
In a floating exchange rate system, the exchange rate of a currency is determined by the demand for and supply of that currency on the foreign exchange market. The demand for a country's currency comes from foreigners wishing to buy its exports, invest in its assets, or hold its currency. The supply of a country's currency comes from its residents wishing to buy imports, invest abroad, or hold foreign currency. Any factor that alters the demand for or supply of a currency will cause its exchange rate to change. This question examines how changes in a trading partner's economy can affect the demand for a country's currency.
Understanding the Question
We are told that countries X and Y are trade partners. We need to determine which of four economic indicators in country Y, if increased, is most likely to cause a fall in the exchange rate of country X. A fall in the exchange rate of X means X's currency depreciates (i.e., becomes cheaper relative to other currencies). The four options are: economic growth, inflation rate, money supply, and trade barriers. The correct answer is trade barriers.
Approach
We will analyze each option in turn, using the demand-and-supply framework for exchange rates. For each change in Y, we consider its effect on the demand for X's currency (or the supply of X's currency) and thus on X's exchange rate. The option that most clearly and directly reduces the demand for X's currency will be the correct answer.
Step-by-Step Reasoning
Option A: Economic growth in Y
If Y experiences economic growth, its national income rises. With higher income, Y's consumers are likely to increase their spending on imports, including imports from X. This increases the demand for X's currency (as Y's importers need to buy X's currency to pay for the imports). An increase in demand for X's currency causes X's exchange rate to appreciate, not fall. Therefore, economic growth in Y is not the answer.
Option B: Inflation rate in Y
If Y's inflation rate rises, goods and services produced in Y become relatively more expensive compared to those in X. This encourages Y's consumers to switch to cheaper imports from X, again increasing Y's demand for imports from X. This raises the demand for X's currency, leading to an appreciation of X's currency. Hence, inflation in Y is not the answer.
Option C: Money supply in Y
An increase in Y's money supply could lead to inflation in Y (as more money chases the same goods) and possibly lower interest rates. The inflation effect, as above, would tend to increase demand for X's currency. The lower interest rates might cause capital outflow from Y, but this primarily affects Y's own currency (depreciating Y's currency) and has an indirect and ambiguous effect on X's currency. It is not as direct or likely to cause a fall in X's exchange rate as trade barriers. Thus, option C is not the best answer.
Option D: Trade barriers in Y
If Y increases trade barriers (e.g., imposes higher tariffs or quotas on imports from X), Y's imports from X will fall because the barriers make them more expensive or restrict their quantity. With fewer imports from X, Y's demand for X's currency decreases. A decrease in demand for X's currency, with supply unchanged, causes X's exchange rate to fall (depreciate). This is a direct and unambiguous effect. Therefore, an increase in trade barriers in Y is most likely to cause a fall in the exchange rate of X.
Key Takeaways
- Trade barriers imposed by a trading partner directly reduce the demand for the other country's exports and therefore its currency, causing depreciation.
- Economic growth and inflation in a trading partner typically increase demand for imports and thus appreciate the other country's currency.
- Changes in money supply have more complex and indirect effects on exchange rates, often working through inflation and interest rates, and are not as directly linked to the trade channel.
Common Mistakes
- Thinking that economic growth in a trading partner is always beneficial for the other country's currency. In fact, it tends to appreciate the currency because higher income boosts imports.
- Confusing the effect on the currency of the country imposing the barrier (Y) with the effect on the target country (X). The question asks about X's currency, not Y's.
- Assuming that an increase in money supply in Y will automatically cause X's currency to fall. The effect is ambiguous and depends on relative inflation and interest rates.
Things to Be Careful About
- Always identify which currency's exchange rate is being asked about. In this case, it is X's exchange rate, so we focus on factors affecting demand for X's currency.
- Trade barriers reduce imports, so they reduce the demand for the exporting country's currency. This is a key point to remember.
- In MCQs, the correct answer is often the one that has a direct and unambiguous causal link, rather than a possible but indirect effect.
Which transaction is not recorded in the current account?
Options
A aid received from the government of another country
B exports of raw materials
C investments by a foreign company
D payments of dividends to an overseas investor
Reasoning
The current account of the balance of payments is divided into four components: trade in goods (visible trade), trade in services (invisible trade), primary income (income from investments, dividends, interest, profits), and secondary income (transfers, such as aid, remittances, and gifts).
Investments by a foreign company, such as foreign direct investment (FDI) or portfolio investment, are recorded in the financial account of the capital and financial account, not in the current account.
Therefore, the transaction not recorded in the current account is investments by a foreign company.
Answer
C
C
Background Concept
The balance of payments is a record of all economic transactions between residents of a country and the rest of the world over a period. It is divided into two main accounts: the current account and the capital and financial account. The current account records transactions related to the exchange of goods, services, income, and transfers. The capital and financial account records transactions involving financial assets and liabilities, such as foreign direct investment, portfolio investment, and loans.
The current account consists of:
- Trade in goods: exports and imports of physical goods.
- Trade in services: exports and imports of services like tourism, banking, transport.
- Primary income: income from investments (dividends, interest, profits) and compensation of employees.
- Secondary income: transfers of money without a quid pro quo, such as foreign aid, remittances, gifts.
The financial account records transactions that change the ownership of financial assets and liabilities, including foreign direct investment (buying or building companies abroad), portfolio investment (buying shares or bonds), and other investments (loans, deposits).
Understanding the Question
The question asks which of the four listed transactions is NOT recorded in the current account. To answer, we need to know which account each transaction belongs to. The options are:
A: aid received from the government of another country – this is a transfer, thus secondary income, so recorded in current account.
B: exports of raw materials – this is trade in goods, so recorded in current account.
C: investments by a foreign company – this is a financial investment, so recorded in the financial account, not current account.
D: payments of dividends to an overseas investor – this is primary income (investment income), so recorded in current account.
Thus, the transaction not recorded in the current account is C.
Approach
Identify the nature of each transaction and classify it according to the balance of payments categories. For each option, determine whether it falls under the current account components (goods, services, primary income, secondary income) or under the capital/financial account. The correct answer is the one that does not belong to the current account.
Step-by-Step Reasoning
- Option A: Aid received from the government of another country. This is a transfer of money from one government to another, typically without any goods or services exchanged in return. It is classified as secondary income in the current account. Therefore, it is recorded in the current account.
- Option B: Exports of raw materials. This is a sale of physical goods to another country. It is part of trade in goods, a main component of the current account. So it is recorded in the current account.
- Option C: Investments by a foreign company. This refers to a foreign company investing in the domestic economy, for example, by building a factory (foreign direct investment) or buying shares (portfolio investment). Such transactions involve the acquisition of assets and are recorded in the financial account (capital and financial account) of the balance of payments, not in the current account. Therefore, this is the transaction not recorded in the current account.
- Option D: Payments of dividends to an overseas investor. Dividends are payments made to shareholders from profits. They are considered investment income and are recorded as primary income in the current account. Hence, this is recorded in the current account.
Thus, the correct answer is C.
Key Takeaways
- The current account includes trade in goods, trade in services, primary income, and secondary income.
- The financial account records investment flows, such as foreign direct investment, portfolio investment, and other capital flows.
- Distinguishing between current account and financial account transactions is crucial for understanding the balance of payments.
- Transfers (aid, remittances) are secondary income; investment income (dividends, interest) is primary income; exports/imports of goods and services are trade items.
Common Mistakes
- Thinking that all foreign investments are recorded in the current account. Actually, investments (FDI, portfolio) are in the financial account.
- Confusing primary income (investment income) with foreign investment (the investment itself). The income from the investment is current account, but the investment flow is capital/financial account.
- Assuming that aid is not recorded because it is a gift, but it is recorded as a transfer in the current account.
Things to Be Careful About
- The current account only records flows of goods, services, income, and transfers. Capital flows (investment, loans) are in the capital and financial account.
- Dividends are primary income, not a capital transaction.
- The classification can be confusing because the term "investment" appears in both contexts: "foreign investment" is a capital flow, but "investment income" is a current account flow.
A government decides to place a tariff on imports of raw materials.
Which statement about the impact of the tariff is correct?
Options
A It will increase costs of production for domestic firms.
B It will increase consumer surplus for domestic consumers.
C It will reduce government revenue.
D There will be a fall in the price of imports and a rise in the demand.
Answer
A tariff on imports of raw materials raises the price of those imports. Domestic firms that use these raw materials as inputs face higher costs of production. Therefore, option A is correct.
Answer
A
A
Background Concept
A tariff is a tax on imported goods. It raises the price of the imported product in the domestic market, making it more expensive relative to domestically produced goods. The purpose of a tariff is often to protect domestic industries from foreign competition, but it can also be used to raise government revenue. In this case, the tariff is imposed on raw materials, which are inputs used by domestic firms in their production processes.
Understanding the Question
This is a multiple-choice question testing the economic impact of a tariff on imports of raw materials. The question asks which statement is correct. We need to evaluate each option:
- A: It will increase costs of production for domestic firms.
- B: It will increase consumer surplus for domestic consumers.
- C: It will reduce government revenue.
- D: There will be a fall in the price of imports and a rise in the demand.
The correct answer must be the one that accurately describes the direct effect of the tariff.
Approach
First, recall the basic effect of a tariff: it raises the price of imports. Then trace through the consequences for each stakeholder mentioned. For domestic firms using raw materials, higher input prices mean higher costs. For consumers, higher costs may lead to higher final goods prices, reducing consumer surplus. For the government, a tariff generates revenue, so revenue increases. For the import market, the tariff raises the price, so quantity demanded falls. This eliminates all options except A.
Step-by-Step Reasoning
- Option A: A tariff on raw materials adds to the cost of importing them. Domestic firms that rely on these imports must pay the higher price, so their production costs increase. This is a direct and correct consequence.
- Option B: Consumer surplus is the benefit consumers receive when they pay less than they are willing to pay. With higher input costs, firms may raise prices of final goods, reducing consumer surplus, not increasing it. Also, the tariff does not directly affect consumer surplus from raw materials (consumers of raw materials are firms, not final consumers). So B is incorrect.
- Option C: Government revenue from tariffs is the tariff rate multiplied by the quantity of imports. Imposing a tariff increases government revenue (unless the tariff is so high that it eliminates imports entirely, but that is not implied). Therefore, revenue rises, not reduces. C is incorrect.
- Option D: A tariff increases the price of imports (by the amount of the tariff), so the domestic price of imports rises. When the price rises, the quantity demanded of imports falls (law of demand). So D is incorrect.
Thus, only A is correct.
Key Takeaways
- A tariff on inputs raises production costs for domestic firms that use those inputs.
- Tariffs increase government revenue (unless they are prohibitive).
- Tariffs generally reduce consumer surplus because they lead to higher prices.
- The price of imports rises, and quantity demanded falls.
Common Mistakes
- Confusing the effect on government revenue: a tariff typically increases revenue, not decreases.
- Thinking that a tariff lowers the price of imports (it raises the domestic price).
- Assuming that a tariff on raw materials benefits consumers (it harms them indirectly through higher final goods prices).
Things to Be Careful About
- Read the question carefully: the tariff is on raw materials, not on finished goods. The impact on firms is direct (cost increase), while the impact on consumers is indirect.
- Distinguish between the price of imports (which rises) and the demand for imports (which falls).
- Remember that government revenue from tariffs is the tariff revenue, not the overall government budget.
In which situation will a country's terms of trade improve?
Options
A Its imports rise in value less than its exports.
B Its imports rise in volume less than its exports.
C The price of its imports rises by less than the prices of its exports.
D The value of its external payments rises by less than the value of its external receipts.
Answer
The terms of trade are defined as the ratio of an index of export prices to an index of import prices (often multiplied by 100). An improvement occurs when this ratio rises, i.e., export prices rise relative to import prices. Option C states that import prices rise by less than export prices, so the ratio increases – an improvement. Options A and B refer to value and volume, not price, and D refers to the balance of payments, not the terms of trade.
Answer
C
C
Background Concept
A country’s terms of trade measure the relative price of its exports compared to its imports. The standard formula is:
Terms of trade = (Index of export prices / Index of import prices) × 100
If the index rises, the country can buy more imports for a given volume of exports – an improvement. If it falls, the country must export more to buy the same imports – a deterioration.
It is a price measure, not a value or volume measure. Value is price times quantity. Volume is quantity. The terms of trade are unaffected by changes in the quantity traded unless those changes alter the prices themselves.
Understanding the Question
The question asks: “In which situation will a country’s terms of trade improve?” We are given four options, each describing a change. We must identify the one that matches the definition of an improvement: a rise in the ratio of export prices to import prices.
Approach
- Recall the definition of terms of trade as a price ratio.
- Evaluate each option: does it describe a change in the price ratio in the correct direction?
- A: “Its imports rise in value less than its exports.” Value = price × quantity. Could be due to price or quantity changes. Not necessarily a price ratio improvement.
- B: “Its imports rise in volume less than its exports.” Volume is quantity, not price. Irrelevant.
- C: “The price of its imports rises by less than the prices of its exports.” This directly compares price changes. Export prices rise more than import prices, so the ratio increases. Improvement.
- D: “The value of its external payments rises by less than the value of its external receipts.” This describes the current account balance (value of exports vs value of imports), not prices.
- Select the option that unambiguously indicates an improvement in the price ratio.
Step-by-Step Reasoning
- The terms of trade equation: TOT = (P_x / P_m) × 100.
- An improvement requires TOT to increase.
- For TOT to increase, either P_x rises, P_m falls, or P_x rises more than P_m, or P_m falls more than P_x.
- Option C: “The price of its imports rises by less than the prices of its exports.”
- Let percentage change in P_x = +a%, and in P_m = +b%, with a > b.
- Then new TOT = (100 + a)/(100 + b) × 100. Since numerator increases more than denominator, the ratio > 100. So improvement.
- Option A: “Its imports rise in value less than its exports.”
- Value = P × Q. If import value rises less than export value, it could be because P_x rose more than P_m, OR because Q_x rose more than Q_m, or a combination. Not a pure price comparison. So not necessarily an improvement in terms of trade.
- Option B: “Its imports rise in volume less than its exports.”
- Volume is quantity. No price information. Irrelevant.
- Option D: “The value of its external payments rises by less than the value of its external receipts.”
- External payments = imports (value of goods and services bought). External receipts = exports (value sold). This is about the current account balance. Not the terms of trade.
Thus, only C directly and correctly describes an improvement in the terms of trade.
Key Takeaways
- The terms of trade are a price ratio, not a value or volume ratio.
- Always distinguish between price, value, and volume in international trade.
- An improvement in the terms of trade means export prices rise relative to import prices, or import prices fall relative to export prices.
Common Mistakes
- Confusing terms of trade with the balance of trade (value of exports minus imports). Option D is a common distractor.
- Assuming that “imports rise in value less than exports” automatically means terms of trade improve, ignoring quantity changes.
- Thinking that a rise in export value (even if due to higher volume) is an improvement in terms of trade.
Things to Be Careful About
- Read the question carefully: it asks for an improvement in terms of trade, not in the current account.
- Remember the definition: terms of trade index = (export price index / import price index) × 100.
- When comparing percentage changes, the direction matters: a larger rise in export prices than in import prices improves the ratio; a smaller rise in export prices than in import prices worsens it.
Your score so far
Answer a question to start scoring
Your marks add up here as you work through the paper.