Economics 9708/23 — May/June 2024
Cambridge AS Level · AS Level Data Response and Essays · worked solutions for every part, with the mark scheme
Topics Supply-Side Policy · Monetary Policy · Exchange Rates · Fiscal Policy · Demand and Supply · Elasticities of Demand · +7 more
Turkey’s unconventional way of managing its economy
The relationship between interest rates and the general price level is one that is central to macroeconomic theory; namely that an increase in the rate of interest produces a reduction in the rate of inflation in an economy. Most economists agree on this relationship. Not so, according to President Erdoğan of Turkey, who has defied conventional economic theory in tackling his country’s fundamental economic challenges.
Two economic challenges stand out. There is spiralling inflation and a collapse in the external value of Turkey’s currency (the lira) in the foreign exchange market, as shown in Fig. 1.1.
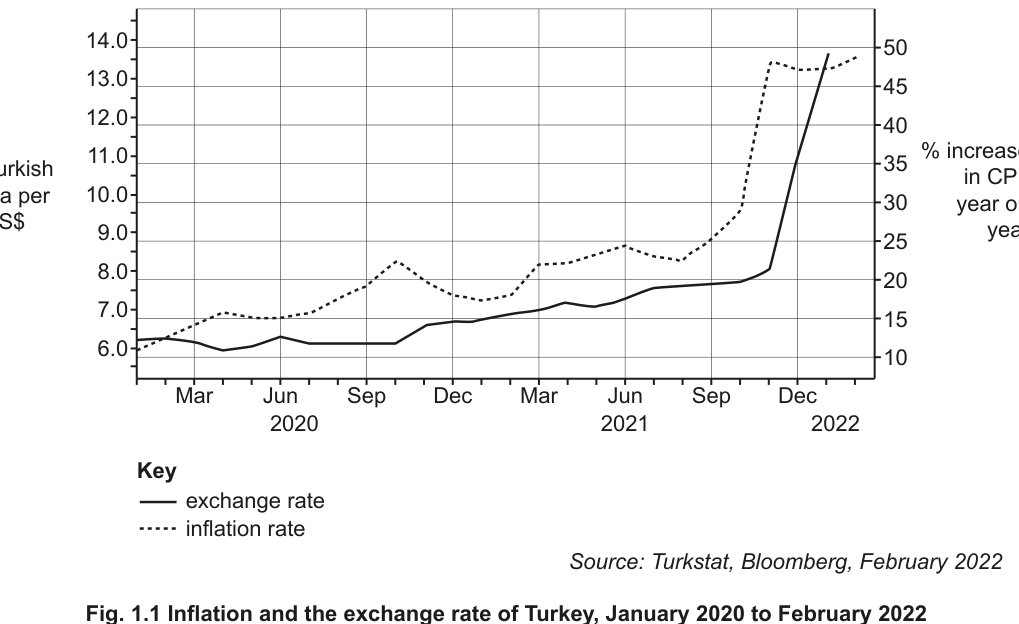
Fig. 1.1 Inflation and the exchange rate of Turkey, January 2020 to February 2022
Source: Turkstat, Bloomberg, February 2022
In January 2022, the year-on-year rise in consumer prices was 48.7%, against a 36.1% year-on-year increase for December 2021. Much higher food prices and transport and energy costs accounted for most of the increase. Despite this rise, the country’s Monetary Policy Committee (MPC) held the short-term interest rate at 14%. This was the rate set in September 2021 when the MPC cut the rate substantially from 19%. In short, the President had used his influence over the MPC to reduce interest rates in an attempt to reduce the increasing rate of inflation.
The President’s unconventional approach has had a dramatic effect on the external value of the lira. The rapid depreciation in the value of the lira from September 2021 has had serious repercussions for Turkey’s economy as Mr Erdoğan has sought to prioritise exports over currency stability. Consumer and producer confidence are low; many who can, have converted their lira deposits into US dollars or euros, fearing a collapse of the banking system.
Despite these problems, the President remains adamant that his economics is right for Turkey. Moreover, he is convinced that when exports increase and international tourists return after the COVID-19 pandemic, employment will increase and the current account deficit on the balance of payments will be reduced. If true, this unconventional approach to Turkey’s economic problems will be proved to be a success.
Use the information provided to calculate the real interest rate for Turkey in January 2022.
Working
Real interest rate = nominal interest rate - inflation rate
= 14% - 48.7%
= -34.7%
Answer
-34.7%
-34.7%
Background Concept
The real interest rate measures the true cost of borrowing or the true return to saving after adjusting for inflation. While the nominal interest rate is the stated rate on a loan or savings account, the real interest rate reflects the change in purchasing power of money over time. The approximate relationship is given by the Fisher equation: real interest rate ≈ nominal interest rate - inflation rate. If inflation exceeds the nominal interest rate, the real interest rate is negative, meaning savers lose purchasing power and borrowers effectively pay back less in real terms.
Understanding the Question
The question asks for the real interest rate in Turkey in January 2022. The extract provides the short-term interest rate set by the MPC (14%) and the year-on-year consumer price inflation (48.7%). The task is a straightforward calculation applying the formula, followed by interpreting the sign of the result.
Approach
Subtract the inflation rate from the nominal interest rate. The result will be negative because inflation (48.7%) exceeds the nominal rate (14%). This indicates that the real interest rate was deeply negative, which has important implications for saving, investment and the transmission of monetary policy.
Step-by-Step Reasoning
- Identify the nominal interest rate: 14% (the rate set by the MPC in September 2021 and held in January 2022).
- Identify the inflation rate: 48.7% (year-on-year CPI increase in January 2022).
- Apply the formula: Real interest rate = 14% - 48.7% = -34.7%.
- Interpret the result: The negative sign indicates that the real interest rate was -34.7%. This means that after accounting for inflation, the effective return to saving was negative 34.7%, or savers lost 34.7% of their purchasing power over the year. For borrowers, the real cost of borrowing was negative, effectively subsidising borrowing.
Key Takeaways
- The real interest rate is the nominal rate adjusted for inflation.
- A negative real interest rate occurs when inflation exceeds the nominal rate.
- Real interest rates are more relevant than nominal rates for decisions about saving and investment.
- Turkey's monetary policy in early 2022 resulted in deeply negative real rates, which is unusual and typically associated with economic instability.
Common Mistakes
- Adding instead of subtracting the inflation rate.
- Forgetting to include the negative sign, which is crucial because it indicates the direction of the real rate.
- Using the wrong inflation figure (e.g., December 2021's 36.1% instead of January 2022's 48.7%).
- Omitting the unit (percent).
Things to Be Careful About
- Always use the most recent data provided (January 2022 figures).
- The sign of the real interest rate is economically significant: negative real rates discourage saving and can fuel further inflation and currency depreciation.
- The question asks for the real interest rate, not the nominal rate or the inflation rate itself.
Answer
The Turkish lira depreciated because the Monetary Policy Committee cut the short-term interest rate from 19% to 14% in September 2021. Lower interest rates reduce the return on Turkish financial assets, making them less attractive to foreign investors. This reduces demand for the lira in the foreign exchange market (and/or increases its supply), causing its value to fall relative to the US dollar. Alternatively, the rapid rise in inflation to 48.7% reduced confidence in the lira, further lowering demand for the currency.
The lira depreciated due to the interest rate cut from 19% to 14% in September 2021, which reduced demand for the lira in the foreign exchange market as Turkish assets became less attractive to foreign investors.
Background Concept
Exchange rates are determined by the demand for and supply of a currency in the foreign exchange market. Demand for a currency comes from those wanting to buy the country's exports, invest in its assets, or speculate on its future value. Supply comes from those wanting to buy imports, invest abroad, or convert the currency. Interest rates and inflation are key determinants: higher interest rates attract capital inflows, increasing demand and causing appreciation; higher inflation reduces demand for the currency because it erodes purchasing power and expected returns.
Understanding the Question
The question asks why the Turkish lira depreciated from September 2021. The extract provides several clues: the MPC cut interest rates from 19% to 14% in September 2021; inflation accelerated from 36.1% to 48.7%; consumer and producer confidence were low; and there were fears of banking system collapse. The task is to identify one likely reason and explain the mechanism linking it to depreciation.
Approach
Select the most direct cause from the extract (the interest rate cut is the most prominent policy change coinciding with the depreciation shown in Fig 1.1). Explain that lower interest rates reduce the attractiveness of Turkish assets to foreign investors, reducing demand for the lira in the forex market. Alternatively, explain that high inflation reduces confidence and the purchasing power of the lira, reducing demand. Either path leads to a fall in the exchange rate (depreciation).
Step-by-Step Reasoning
- Identify the cause: In September 2021, the MPC cut the short-term interest rate from 19% to 14%.
- Explain the mechanism: Lower interest rates reduce the return on Turkish bonds and savings accounts relative to other countries. This makes Turkish financial assets less attractive to foreign investors.
- Forex market effect: Reduced foreign investment means lower demand for lira (and/or higher supply as investors sell lira to buy foreign assets).
- Result: With lower demand (or higher supply), the value of the lira falls relative to the US dollar, i.e., it depreciates. Fig 1.1 confirms this: from September 2021, the exchange rate rises sharply from around 7.5-8.0 to nearly 14.0 lira per US$.
- Alternative cause: The rapid increase in inflation to 48.7% reduced the purchasing power of the lira and likely eroded confidence, further reducing demand for the currency.
Key Takeaways
- Interest rate cuts typically lead to currency depreciation through capital flow effects.
- High inflation also contributes to depreciation by reducing confidence and relative purchasing power.
- The timing of the interest rate cut (September 2021) matches the start of the sharp depreciation in Fig 1.1.
Common Mistakes
- Claiming that higher interest rates cause depreciation (the opposite is normally true).
- Describing the trend without explaining the mechanism (e.g., just saying "the lira fell because of the rate cut" without linking to forex demand/supply).
- Confusing depreciation with devaluation (depreciation is market-determined; devaluation is a policy decision under a fixed exchange rate).
- Using data from the wrong time period.
Things to Be Careful About
- The question asks about depreciation from September 2021 specifically, so focus on causes that changed around that time.
- The extract explicitly links the President's influence over the MPC to the rate cut, making this the primary causal factor.
- Always explain the mechanism through the foreign exchange market (demand/supply of the currency).
Consider the extent to which producers in Turkey are likely to have been affected by the depreciation of the lira on the foreign exchange market from September 2021.
Answer
Producers in Turkey faced higher costs because the depreciation increased the lira price of imported raw materials and energy. This raised production costs and reduced price competitiveness, potentially lowering demand for their output. The associated uncertainty may also have discouraged investment, harming future competitiveness. However, depreciation made Turkish exports cheaper in foreign markets, benefiting export-oriented producers by increasing foreign demand. The extent of the effect depends on whether producers rely on imported inputs or are focused on export markets. Given Turkey's reliance on energy imports, the negative cost effects were likely significant for many producers, though export sectors gained.
Producers were affected through higher import costs (negative) and cheaper exports (positive), with the net effect depending on their reliance on imports versus exports; given Turkey's energy import dependence, the negative effects were likely significant for many.
Background Concept
Exchange rate depreciation affects domestic producers through two main channels: the cost of imported inputs and the price of exports in foreign markets. When a currency depreciates, imports become more expensive in domestic currency terms, raising costs for firms that rely on imported raw materials, components or energy. This can reduce profit margins and price competitiveness. Conversely, depreciation makes exports cheaper in foreign currency terms, potentially increasing foreign demand for domestically produced goods and benefiting export-oriented firms. The net effect depends on the structure of the economy and the relative importance of imports versus exports for individual producers.
Understanding the Question
The question asks to consider the extent to which Turkish producers were affected by the lira's depreciation from September 2021. This requires analysing both the negative effects (higher import costs) and positive effects (cheaper exports), and then evaluating how significant these effects were likely to be.
Approach
Structure the answer in three parts: (1) negative effects on producers via higher import costs and reduced investment; (2) positive effects via improved export competitiveness; (3) evaluation of the extent, considering Turkey's economic structure (import dependence versus export orientation).
Step-by-Step Reasoning
- Negative effect - imported inputs: The lira depreciation from approximately 7.5 to 13.5 lira per US$ meant that the lira cost of imported raw materials, energy and machinery roughly doubled. For producers relying on these imports, production costs rose sharply. If they cannot fully pass these costs onto consumers (due to price elasticity or weak domestic demand), profit margins fall. Higher costs also reduce price competitiveness relative to foreign producers who have not faced currency depreciation.
- Negative effect - uncertainty and investment: The volatile exchange rate and high inflation created uncertainty. The extract mentions low producer confidence and fear of banking system collapse. This uncertainty discourages firms from investing in new capital or expansion, which harms long-term productivity and competitiveness.
- Positive effect - export competitiveness: Depreciation makes Turkish goods cheaper in foreign markets. For example, a Turkish exporter selling goods for US$100 would have received approximately 750 lira before depreciation but 1350 lira after (at the peak). Even if foreign currency prices are unchanged, the lira revenue rises, or firms can lower foreign prices to gain market share. This increases demand for exports and benefits producers in export sectors such as textiles, agriculture or tourism-related goods.
- Evaluation of extent: The net effect depends on the structure of production. Turkey is a significant importer of energy and intermediate goods, so many manufacturers face higher costs. However, Turkey also has a large export sector. The extract notes the President's priority was exports over currency stability, suggesting the government accepted the cost to producers in import-intensive sectors in exchange for export gains. Given the severity of the lira collapse (nearly halving in value), the negative effects on import-dependent producers were likely substantial, while export producers benefited significantly.
Key Takeaways
- Exchange rate depreciation creates winners and losers among producers depending on their trade orientation.
- Cost-push inflation from imported inputs is a major channel of transmission.
- Policy trade-offs exist: supporting exports via depreciation harms import-dependent industries.
Common Mistakes
- Only mentioning one side (either only the cost increase or only the export boost).
- Failing to evaluate the extent, which is required for the fourth mark.
- Not linking the analysis to the specific context of Turkey (e.g., mentioning energy imports).
- Describing the depreciation without explaining its effect on producers.
Things to Be Careful About
- The mark scheme awards marks for specific causal chains: imported raw materials -> higher costs -> reduced competitiveness -> lower demand. Ensure each link is stated.
- The evaluation mark requires a judgement on the extent, such as "it depends on the reliance on imported inputs" or "the effect was significant because Turkey imports most of its energy".
- Use evidence from the extract where relevant (e.g., low producer confidence, banking fears).
Assess whether Mr Erdoğan’s economic policies have had a beneficial impact on Turkey’s economy since 2020.
Answer
Mr Erdoğan's policies have had both positive and negative effects, but the negative effects appear to dominate.
On the positive side, the reduction in interest rates was intended to stimulate economic activity. The resulting lira depreciation made Turkish exports cheaper, potentially increasing demand for domestically produced goods and supporting employment in export sectors. The President anticipated that higher exports and returning tourists would boost national income and reduce the current account deficit.
On the negative side, inflation accelerated sharply from around 15% in early 2021 to 48.7% by January 2022, severely eroding living standards. The lira collapsed from approximately 7.5-8.0 lira per US$ before September 2021 to nearly 14.0 by December 2021, increasing import prices and causing capital flight as residents converted savings to foreign currency. Consumer and producer confidence fell, and fears of banking system instability emerged. These outcomes suggest the policies have been largely detrimental, creating severe economic instability rather than sustainable growth.
Overall, while the policies may have supported export volumes, the costs in terms of hyperinflation, currency collapse and lost confidence outweigh the uncertain and delayed benefits. The policies have not proved beneficial for the Turkish economy.
The policies have not been beneficial; the costs of high inflation, currency collapse and financial instability outweigh the uncertain benefits of export growth and employment.
Background Concept
Monetary policy involves the manipulation of interest rates and the money supply to influence macroeconomic objectives such as inflation, growth and employment. In conventional theory, higher interest rates reduce inflation by decreasing aggregate demand (reducing consumption and investment) and by attracting capital inflows that appreciate the currency and reduce import prices. Conversely, lower interest rates stimulate demand but risk higher inflation and currency depreciation. The AD/AS model shows that a cut in interest rates shifts the AD curve rightward, increasing real output and the price level in the short run. However, if the economy is near full capacity or facing supply-side inflation, the output gains may be limited while inflation rises sharply.
Understanding the Question
The question asks to assess whether Mr Erdoğan's economic policies have had a beneficial impact on Turkey's economy since 2020. The "unconventional" policy is the reduction of interest rates from 19% to 14% in September 2021 despite rapidly rising inflation, justified by a belief that low rates would boost exports, employment and the current account. The assessment must weigh the evidence of high inflation, currency collapse and lost confidence against the potential benefits of export growth and employment.
Approach
Present two sides: (1) the potential benefits of the low-interest-rate policy (export competitiveness, employment, current account improvement); (2) the actual or likely costs (high inflation, currency instability, reduced confidence, banking fears). Use data from the extract (inflation rate, exchange rate movement, interest rate change) to support both sides. Evaluate which effects dominate and reach a justified conclusion.
Step-by-Step Reasoning
Positive effects:
- The interest rate cut from 19% to 14% was expansionary. Lower borrowing costs should stimulate consumption and investment, shifting AD right and increasing real output and employment in the short run.
- The lira depreciation made Turkish exports cheaper in foreign markets. The extract states the President sought to "prioritise exports over currency stability". If export volumes rose, this would increase aggregate demand, national income and employment, particularly in export sectors.
- The President anticipated that returning tourists after COVID-19 would further boost employment and the current account. Tourism is a major source of foreign exchange and employment in Turkey.
Negative effects:
- Inflation accelerated from around 15% in early 2021 to 48.7% by January 2022. High inflation erodes real living standards, reduces the purchasing power of wages and savings, and creates uncertainty that discourages long-term planning.
- The lira collapsed from approximately 7.5-8.0 lira per US$ before September 2021 to nearly 14.0 by December 2021. This currency crisis increased the cost of imports (food, energy, machinery), contributing to cost-push inflation and reducing living standards. It also triggered capital flight as residents converted lira deposits to US dollars or euros, fearing banking system collapse.
- Consumer and producer confidence fell, which reduces consumption and investment, potentially offsetting any stimulus from lower interest rates.
- The real interest rate became deeply negative (-34.7%), which discourages saving and can lead to financial instability.
Evaluation:
The negative effects appear more severe and immediate than the positive effects. While the policy aimed to boost exports and employment, the outcome has been hyperinflation, a currency crisis and financial instability. The extract suggests that "many who can, have converted their lira deposits into US dollars or euros, fearing a collapse of the banking system" - this indicates a loss of confidence that undermines the financial sector. The anticipated benefits in employment and the current account are described as future possibilities ("when exports increase and international tourists return"), whereas the costs are current and quantifiable. Conventional economic theory would suggest that raising interest rates would have been more effective in stabilising the currency and reducing inflation, even at the cost of short-run output.
Conclusion: Mr Erdoğan's economic policies have not had a beneficial impact. The costs in terms of high inflation, currency collapse and financial instability outweigh the uncertain and delayed benefits of export growth and tourism recovery.
Key Takeaways
- Unconventional monetary policy (low rates during high inflation) can lead to currency collapse and hyperinflation.
- The relationship between interest rates and inflation is central to macroeconomic stability.
- Confidence and credibility are crucial for monetary policy effectiveness.
- Data from the extract (inflation at 48.7%, exchange rate near 14.0) demonstrates the severity of the outcome.
Common Mistakes
- One-sided analysis: only discussing benefits or only costs. This forfeits evaluation marks.
- Asserting benefits without evidence from the extract (e.g., claiming exports rose without noting the extract only says this was hoped for).
- No conclusion or a vague conclusion that merely restates both sides.
- Confusing the direction of causality (e.g., claiming low rates caused inflation without explaining the mechanism).
- Using generic knowledge without linking to the Turkish context.
Things to Be Careful About
- The question asks about impact "since 2020", but the interest rate cut happened in September 2021. Note that inflation was already rising before the cut, but the sharp depreciation and acceleration occurred after.
- The extract presents the President's views as convictions ("he is convinced that..."), not established facts. Distinguish between intended effects and actual outcomes.
- Use specific figures from Fig 1.1 and the text (48.7% inflation, 14% interest rate, exchange rate movement from ~7.5 to ~14.0) to support points.
- The conclusion must be justified, not just "it depends" or a summary of both sides.
Excluding interest rate changes, assess what alternative policies might be used to reduce Turkey’s rate of inflation.
Answer
Alternative policies include tighter monetary policy through reducing the money supply or restricting credit, and contractionary fiscal policy through higher taxation or reduced government spending.
Reducing the money supply would lower aggregate demand by restricting consumers' and firms' ability to borrow and spend. This would reduce demand-pull inflation. However, it would also likely reduce economic growth and increase unemployment. Similarly, higher taxes or lower government spending would directly reduce aggregate demand, lowering inflation, but at the cost of reduced disposable income and potential long-term damage to growth incentives.
Supply-side policies, such as improving infrastructure, training or technology, could address the underlying cost-push factors (food, transport, energy costs) by increasing productive capacity. However, these policies take years to implement and cannot tackle the immediate inflation crisis.
In conclusion, while supply-side policies are desirable for long-term price stability, demand-reduction policies (monetary or fiscal) are necessary to curb the current high inflation quickly, despite their short-run costs to output and employment.
Demand-reduction policies (monetary or fiscal) are necessary in the short term to curb inflation despite recession risks, while supply-side policies are needed for long-term cost-push reduction.
Background Concept
When inflation is high, governments and central banks can use various policy tools to reduce it, aside from changing interest rates. Contractionary monetary policy includes reducing the money supply or imposing credit restrictions, which lowers aggregate demand by making borrowing more difficult and reducing the money available for spending. Contractionary fiscal policy involves increasing taxation or reducing government spending, which directly reduces aggregate demand by lowering disposable income and public expenditure. Supply-side policies aim to increase the productive capacity of the economy (shifting LRAS rightward) by improving productivity, infrastructure, competition or market flexibility, which can reduce cost-push inflation and increase non-inflationary growth. Each policy has different time lags, effectiveness and side effects.
Understanding the Question
The question asks to assess alternative policies to reduce Turkey's inflation, explicitly excluding interest rate changes. Given that Turkey's inflation is driven by food, transport and energy costs (cost-push elements) as well as possibly demand factors, the assessment should consider both demand-reduction policies (monetary and fiscal) and supply-side policies, weighing their advantages and disadvantages in the Turkish context.
Approach
Analyse two main alternative policies: (1) tighter monetary policy via money supply reduction or credit controls; (2) contractionary fiscal policy (higher taxes, lower spending). Optionally mention supply-side policy. For each, explain the mechanism by which it reduces inflation, an advantage, and a disadvantage. Then evaluate which is most appropriate given Turkey's situation (high inflation with cost-push elements, need for quick results versus long-term stability).
Step-by-Step Reasoning
Policy 1: Contractionary monetary policy (money supply/credit)
- Mechanism: Reducing the money supply or restricting credit availability lowers aggregate demand. With less money available for consumption and investment, spending falls, reducing demand-pull pressures on prices.
- Advantage: Can reduce inflation relatively quickly compared to supply-side policies. Central banks have direct control over monetary instruments.
- Disadvantage: Reduces economic growth and increases unemployment in the short run. May not effectively address cost-push inflation from food and energy prices, which is a major component of Turkey's inflation.
Policy 2: Contractionary fiscal policy
- Mechanism: Increasing taxes (direct or indirect) or reducing government spending directly reduces aggregate demand. Lower disposable income and reduced public expenditure lower consumption and investment.
- Advantage: Direct and certain impact on demand. Can be targeted (e.g., reducing subsidies that fuel demand).
- Disadvantage: Politically difficult and may reduce incentives to work and invest. Like monetary policy, it risks recession and may not solve cost-push inflation.
Policy 3: Supply-side policy
- Mechanism: Improving productivity in key sectors (agriculture, energy, transport) increases aggregate supply, shifting LRAS rightward. This reduces costs and prices while increasing output.
- Advantage: Addresses the root causes of cost-push inflation (food, transport, energy costs) and increases long-term growth potential without the recessionary costs of demand reduction.
- Disadvantage: Takes years to implement and affect the economy. Not suitable for tackling immediate hyperinflation.
Evaluation:
Given that Turkey's inflation is 48.7% and driven significantly by food, transport and energy costs, demand-side policies (monetary or fiscal) may reduce overall demand but will not eliminate the cost-push elements. They risk causing a deep recession without fully solving the inflation problem. However, some demand reduction may be necessary to break inflationary expectations and stabilise the currency. Supply-side policies are essential for a sustainable solution but cannot act quickly enough. Therefore, a combination of short-term demand management (to stabilise the situation) and long-term supply-side reforms (to address structural cost pressures) is likely needed. Between monetary and fiscal options, monetary policy via money supply control may be preferable as it avoids the distortionary effects of tax increases, though both carry recession risks.
Conclusion: While supply-side policies are ultimately necessary to address Turkey's cost-push inflation, demand-reduction policies (monetary or fiscal) are required in the short term to bring down the extremely high inflation, despite their costs to growth and employment.
Key Takeaways
- Inflation can be tackled through demand-side (monetary/fiscal) or supply-side policies.
- Demand-side policies work through AD shifts and are faster but cause recession.
- Supply-side policies work through LRAS shifts and are slower but increase productive capacity.
- The nature of inflation (demand-pull versus cost-push) should guide policy choice.
- Turkey's inflation has significant cost-push elements (food, energy), making supply-side measures important alongside demand management.
Common Mistakes
- Describing policies without explaining how they reduce inflation.
- Forgetting that interest rate changes are excluded.
- One-sided evaluation (only discussing one policy or only advantages).
- Claiming supply-side policies can solve immediate inflation (they have long lags).
- Not reaching a justified conclusion.
Things to Be Careful About
- The extract identifies food, transport and energy costs as the main drivers of inflation. This suggests cost-push factors are dominant, which should inform the evaluation.
- The mark scheme reserves 1 mark for a conclusion in both part (c) and (d), so a clear justified judgement is essential.
- When discussing monetary policy alternatives, be specific about tools (money supply, credit controls) rather than just saying "monetary policy".
- Compare the policies explicitly in the evaluation section, not just describe them separately.
From 2030, most new car production in the United Kingdom (UK) will be of electric cars.
Excluding the price of electric cars, explain the determinants of demand for electric cars and consider which of these determinants is likely to be of greatest significance at the present time.
Answer
The non-price determinants of demand for electric cars include consumers' income, tastes and preferences, the price of substitute goods (petrol and diesel cars), the price of complementary goods (charging infrastructure, electricity), and expectations about future prices and availability.
Income: Electric cars are relatively expensive, so demand is likely to be income-elastic. In the present UK context, real incomes have been squeezed by inflation, which may limit demand. However, as incomes recover, demand should rise.
Tastes and preferences: There has been a significant shift in attitudes towards environmental sustainability. Government policies (e.g., the 2030 ban on new petrol/diesel car sales) and increased awareness of climate change have made electric cars more desirable. This is likely a powerful determinant at present.
Price of substitutes: The price of petrol and diesel cars and the cost of fuel affect demand. High petrol prices make electric cars more attractive due to lower running costs. However, the initial purchase price of electric cars remains higher.
Price of complements: The availability and cost of charging points influence demand. Expansion of the charging network reduces a key barrier.
Evaluation: At the present time, changing tastes and preferences are likely the most significant determinant. The combination of government mandates, environmental concerns, and technological improvements is fundamentally shifting consumer attitudes. While income remains a constraint, the direction of change is strongly driven by non-income factors. Therefore, attitudes are the greatest driver of demand for electric cars currently.
At the present time, changing attitudes and environmental awareness are likely to be the most significant determinant of demand for electric cars, as they drive consumer preferences despite income constraints.
Background Concept
The demand for a good or service is determined by factors other than its own price. These non-price determinants include income, tastes and preferences, prices of related goods (substitutes and complements), expectations, and the number of buyers. Understanding these helps explain shifts in the demand curve.
Understanding the Question
The question asks you to explain the determinants of demand for electric cars (excluding the price of electric cars themselves) and then consider which determinant is most significant at the present time. The context is the UK, where from 2030 most new car production will be electric. The command word "explain" requires you to define and describe each determinant, while "consider" requires evaluation. The mark scheme allocates 3 marks for knowledge (AO1), 3 for analysis (AO2), and 2 for evaluation (AO3).
Approach
First, list the main non-price determinants: income, tastes/preferences, price of substitutes, price of complements, expectations. Then, for each, explain how it affects demand for electric cars, using the UK context. Finally, weigh them against each other to decide which is most significant, and justify your conclusion.
Step-by-Step Reasoning
-
Income: Electric cars are luxury goods with high income elasticity. In the UK, real incomes have been stagnant or falling due to inflation, which could reduce demand. However, as the economy recovers, rising incomes will boost demand. This is a medium-term factor.
-
Tastes and preferences: Environmental awareness has grown significantly. Government policies (2030 ban, subsidies) and media coverage have shifted consumer attitudes. This is a powerful, ongoing change that directly increases demand regardless of income.
-
Price of substitutes: Petrol and diesel cars are close substitutes. If petrol prices rise, the running cost of petrol cars increases, making electric cars more attractive. However, the initial purchase price of electric cars is still higher, so the substitution effect may be limited in the short run.
-
Price of complements: Charging infrastructure is a complement. As more charging points are installed, the convenience of owning an electric car increases, boosting demand. Government investment in charging networks is accelerating this.
-
Expectations: If consumers expect future price falls or improved technology, they may delay purchase. But the 2030 mandate creates urgency.
Evaluation: Compare the strength and immediacy of each. Tastes and preferences are currently being transformed by policy and social norms, making them the most dynamic driver. Income is a constraint but not a driver of change. Substitutes and complements are important but secondary. Therefore, attitudes are most significant.
Key Takeaways
- Non-price determinants shift the demand curve.
- In a specific context, some determinants are more influential than others.
- Evaluation requires weighing factors and justifying a conclusion.
Common Mistakes
- Discussing price of electric cars (excluded).
- Listing determinants without analysis.
- Failing to reach a conclusion or giving an unjustified one.
Things to Be Careful About
- Use the UK context and the 2030 deadline.
- Develop each point fully (chain of reasoning).
- Reserve one mark for a justified conclusion.
Assess whether cross elasticity of demand is likely to be more important in determining the demand for electric cars than income elasticity of demand.
Introduction
Cross elasticity of demand (XED) measures the responsiveness of demand for one good to a change in the price of another good. Income elasticity of demand (YED) measures the responsiveness of demand to a change in consumers' income. This essay assesses which is likely to be more important in determining the demand for electric cars.
The case for cross elasticity of demand being more important
Electric cars have close substitutes: petrol and diesel cars. The XED between electric cars and petrol cars is likely to be positive and high, as they are substitutes. A rise in the price of petrol cars (due to taxes or supply constraints) will significantly increase demand for electric cars. Similarly, complements such as charging points have a negative XED; a fall in the price of charging infrastructure boosts demand. In the short run, consumers compare running costs and purchase prices, making XED highly relevant. For example, if petrol prices rise sharply, consumers may switch to electric cars, demonstrating the importance of XED.
The case for income elasticity of demand being more important
Electric cars are expensive, so they are likely to be luxury goods with a high positive YED. As incomes rise, demand for electric cars increases more than proportionately. In the UK, economic growth and rising real incomes could significantly boost electric car sales. Moreover, YED captures the long-term trend: as economies grow, demand for luxury goods like electric cars expands. Government subsidies and tax incentives also affect effective income, further strengthening the role of YED.
Evaluation
Both elasticities are important, but their relative significance depends on the time horizon and market conditions. In the short run, XED may be more important because consumers respond quickly to changes in petrol prices or subsidies for petrol cars. However, in the long run, YED is likely to dominate as income growth determines the overall market size. Additionally, the limitations of each concept must be considered: XED assumes other factors constant, but in reality, many factors change simultaneously; YED may be unstable over time. Furthermore, the demand for electric cars is also influenced by non-price factors like government policy and environmental attitudes, which are not captured by either elasticity.
Conclusion
While both cross elasticity and income elasticity are relevant, cross elasticity of demand is likely to be more important in determining the demand for electric cars at the present time. This is because the immediate substitution effect from petrol cars and the availability of complements (charging infrastructure) are key drivers of consumer choice. However, as electric cars become the norm and incomes rise, income elasticity will become increasingly significant. Therefore, XED is more important in the short term, but YED gains importance over the longer term.
Cross elasticity of demand is likely to be more important in the short run due to substitution effects, but income elasticity becomes more significant in the long run as incomes grow; overall, XED is currently more important.
Background Concept
Cross elasticity of demand (XED) = % change in quantity demanded of good A / % change in price of good B. It measures the relationship between two goods: positive for substitutes, negative for complements. Income elasticity of demand (YED) = % change in quantity demanded / % change in income. It indicates whether a good is normal (positive YED) or inferior (negative YED), and whether it is a luxury (YED > 1) or necessity (0 < YED < 1).
Understanding the Question
The question asks you to assess whether XED is likely to be more important than YED in determining the demand for electric cars. "Assess" requires a balanced discussion and a justified conclusion. The mark scheme uses levels: Level 3 (6-8 marks) for detailed knowledge and developed analysis, Level 2 (3-5) for limited development, Level 1 (1-2) for descriptive. Evaluation (AO3) is marked separately (Level 2: 3-4 marks for justified conclusion, Level 1: 1-2 for vague). A one-sided response cannot gain evaluation marks.
Approach
First, define both elasticities. Then present arguments for XED being more important: electric cars have close substitutes and complements, so price changes in related goods significantly affect demand. Then present arguments for YED being more important: electric cars are luxury goods, so income changes have a large effect. Then evaluate: compare time horizons, limitations of each concept, and other factors. Conclude with a justified judgement.
Step-by-Step Reasoning
- Define XED and YED with formulae and interpretation.
- XED argument: Petrol cars are substitutes; if petrol prices rise, demand for electric cars increases. Charging points are complements; if charging becomes cheaper, demand rises. In the short run, consumers are sensitive to running costs, so XED is high.
- YED argument: Electric cars are expensive, so YED > 1. As UK incomes grow, demand rises more than proportionately. Government subsidies effectively increase disposable income, boosting demand.
- Evaluation:
- Time period: XED matters in short run (immediate substitution), YED in long run (income trends).
- Limitations: XED assumes ceteris paribus, but many factors change; YED may vary with economic cycle.
- Other factors: Government policy, environmental attitudes are not captured by elasticities.
- Conclusion: XED is more important currently due to substitution effects, but YED will grow in importance. Therefore, XED is more important in the short term.
Key Takeaways
- Elasticities measure responsiveness to different factors.
- In a specific market, the relative importance depends on context and time horizon.
- Evaluation requires considering limitations and reaching a justified conclusion.
Common Mistakes
- One-sided answer (only discussing one elasticity).
- Failing to define terms clearly.
- No conclusion or a vague conclusion.
- Ignoring the context of electric cars.
Things to Be Careful About
- Use the UK context and the 2030 deadline.
- Develop each point with chains of reasoning.
- Ensure evaluation is balanced and leads to a clear judgement.
Use a production possibility curve (PPC) diagram to explain how a government in a mixed economy might allocate more resources to consumption and fewer resources to investment and consider a limitation of this approach to resource allocation.
Answer
Diagram: A production possibility curve (PPC) is drawn with consumer goods on the horizontal axis and capital goods on the vertical axis. The curve is concave to the origin. Initially, the economy is at point A, producing a combination with a high quantity of capital goods and a low quantity of consumer goods. An arrow shows a movement along the curve to point B, where more consumer goods and fewer capital goods are produced. This movement represents a reallocation of resources from investment (capital goods) to consumption (consumer goods), without any change in the economy's productive capacity.
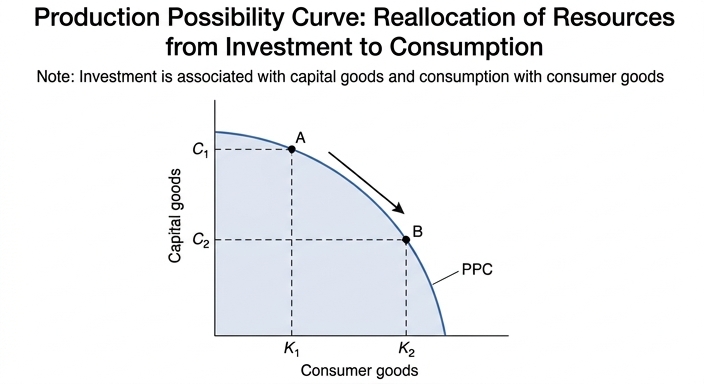
How the government can achieve this: In a mixed economy, the government can use fiscal policy to influence the allocation of resources. For example:
- Reducing taxes on income or consumer expenditure increases households' disposable income, encouraging higher consumption.
- Increasing government spending on subsidies for consumer goods makes them cheaper, boosting demand.
- Reducing government support for business investment (e.g., cutting investment grants or tax allowances) makes investment less attractive, freeing resources for consumption.
These policies shift the economy's point of operation along the PPC from A to B.
Limitation: This approach assumes that the economy is operating on its PPC (full employment and efficient resource use). In reality, there may be unemployment or inefficiency, so the economy could be inside the PPC. Moreover, time lags exist: consumers may save rather than spend tax cuts, and businesses may respond to reduced investment incentives by cutting back more than intended, potentially causing a larger fall in investment than desired. Additionally, if the government cuts taxes and increases spending, it may run a budget deficit, leading to higher national debt and possible crowding out of private investment in the long run. Therefore, while the government can influence resource allocation, the actual outcome depends on the responsiveness of consumers and businesses, and there may be unintended consequences such as reduced long-term economic growth if investment falls too much. Conclusion: The government can reallocate resources towards consumption, but the effectiveness is limited by behavioural responses and potential negative effects on future productive capacity.
The government can reallocate resources towards consumption through fiscal policy, but the effectiveness is limited by time lags, behavioural responses, and potential negative effects on long-term growth.
Background Concept
A production possibility curve (PPC) shows the maximum combinations of two goods or services that an economy can produce given its resources and technology, assuming full and efficient use of resources. The curve is typically concave to the origin due to increasing opportunity cost: as more of one good is produced, the opportunity cost in terms of the other good rises. A point on the curve represents an efficient allocation; a point inside the curve indicates underutilisation of resources. A movement along the curve represents a reallocation of resources between the two goods, while a shift of the curve represents a change in productive capacity (e.g., through investment or technological progress).
In this question, the two goods are consumer goods (representing consumption) and capital goods (representing investment). The government in a mixed economy can use policy tools to influence the allocation of resources between these two categories.
Understanding the Question
The question asks you to use a PPC diagram to explain how a government in a mixed economy might allocate more resources to consumption and fewer to investment. It also asks you to consider a limitation of this approach. The command word "explain" requires you to describe the mechanism (the diagram and the policies), and "consider" requires a short evaluation. The mark scheme allocates 3 marks for AO1 (knowledge and understanding: the diagram and its interpretation), 3 marks for AO2 (analysis: how the government can achieve the reallocation), and 2 marks for AO3 (evaluation: a limitation and a justified conclusion).
You must draw a PPC diagram with consumer goods and capital goods, show a movement along the curve from a point with more capital goods to a point with more consumer goods, and explain that this represents a reallocation of resources. Then, you need to suggest specific government policies (e.g., tax cuts, subsidies, reduced investment incentives) that would cause this reallocation. Finally, you must identify a limitation (e.g., time lags, behavioural responses, budget deficits, crowding out) and provide a justified conclusion.
Approach
- Draw the PPC diagram with correct labels and show the movement along the curve. Explain that the economy moves from a point with more capital goods to one with more consumer goods.
- Explain government policies that can shift the economy's point along the PPC. Focus on fiscal policy: tax cuts to boost consumption, subsidies for consumer goods, and reduced support for investment.
- Evaluate a limitation of this approach. Choose one or two limitations and develop them briefly. Then provide a conclusion that judges the overall effectiveness.
Step-by-Step Reasoning
Step 1: The Diagram
- Draw a PPC with consumer goods on the horizontal axis and capital goods on the vertical axis. The curve should be concave to the origin.
- Mark an initial point A on the curve near the vertical axis, indicating a high quantity of capital goods and a low quantity of consumer goods.
- Mark a second point B on the curve further to the right, indicating more consumer goods and fewer capital goods.
- Draw an arrow from A to B along the curve to show the movement.
- Explain that this movement represents a reallocation of resources from investment (capital goods) to consumption (consumer goods). The economy is still on its PPC, so it is using all resources efficiently; it is just producing a different mix.
Step 2: Government Policies
- The government can use fiscal policy to influence the allocation. For example:
- Reduce taxes on income or consumer expenditure: This increases households' disposable income, leading to higher consumption. As consumption rises, firms shift resources to produce more consumer goods.
- Increase subsidies for consumer goods: Subsidies lower the price of consumer goods, increasing demand and encouraging production.
- Reduce support for investment: The government might cut investment grants, tax allowances for capital spending, or subsidies for research and development. This makes investment less attractive, so firms allocate fewer resources to capital goods.
- These policies shift the economy's point of operation along the PPC from A to B.
Step 3: Limitation
- One limitation is time lags: Consumers may not immediately increase consumption after a tax cut; they might save the extra income, especially if they expect future tax increases. Similarly, businesses may not immediately reduce investment; they may have long-term plans. This means the reallocation may be slower or smaller than intended.
- Another limitation is behavioural responses: If the government reduces investment incentives, businesses might cut investment more than expected, leading to a larger fall in capital goods production. This could harm long-term growth.
- Also, budget deficits: Tax cuts and increased spending may lead to a budget deficit, which could crowd out private investment in the long run, offsetting the intended reallocation.
- Conclusion: While the government can influence resource allocation, the actual outcome depends on the responsiveness of consumers and businesses. The approach may have unintended consequences, such as reduced long-term growth if investment falls too much. Therefore, the government must carefully design policies and consider the time horizon.
Key Takeaways
- A PPC diagram is a powerful tool to illustrate resource allocation and opportunity cost.
- Governments can use fiscal policy to influence the mix of output between consumption and investment.
- Any policy intervention has limitations, including time lags, behavioural responses, and potential negative side effects.
- A justified conclusion is essential for evaluation marks.
Common Mistakes
- Drawing a PPC without labelling axes correctly (consumer goods and capital goods).
- Showing a shift of the PPC instead of a movement along it. The question is about reallocation, not growth.
- Forgetting to include an arrow to show the direction of movement.
- Listing policies without explaining how they affect the allocation.
- Providing a limitation without a conclusion, or a conclusion that is not justified.
- Writing a one-sided evaluation (only positive or only negative).
Things to Be Careful About
- Ensure the diagram is fully labelled: axes, curve, points, arrow.
- Use economic terminology: "reallocation of resources", "opportunity cost", "fiscal policy", "disposable income", "crowding out".
- The evaluation should be brief but developed: mention a specific limitation and explain why it matters.
- The conclusion should directly answer the "consider" part: state whether the approach is effective or not, and why.
Assess whether producers are the only ones to benefit when an economy decides to allocate additional resources to investment.
Introduction
When an economy allocates additional resources to investment, it increases its capital stock, which can boost productivity and long-run economic growth. While producers directly benefit from lower costs and higher profits, consumers and the government also gain in various ways. This essay assesses whether producers are the only beneficiaries.
Benefits to producers
Investment in new machinery, technology, and infrastructure reduces firms' costs of production, making them more price-competitive domestically and internationally. Higher productivity leads to increased profits, which can be reinvested or distributed to shareholders. Producers also benefit from improved efficiency and the ability to innovate. For example, a manufacturing firm that invests in automation can produce more output with fewer workers, lowering average costs and increasing profit margins.
Benefits to consumers
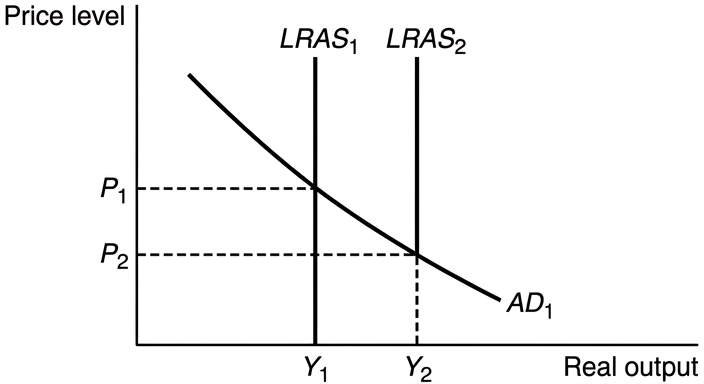
In the long run, increased investment expands the economy's productive capacity, shifting the LRAS curve to the right. This leads to higher output and lower prices, benefiting consumers through greater choice and cheaper goods. However, in the short run, the reallocation of resources towards investment may reduce the availability of consumer goods, potentially raising prices. Additionally, if the government funds investment through higher taxes, consumers face reduced disposable income. The net benefit to consumers depends on the time horizon: short-run costs are offset by long-run gains.
Benefits to government
Higher investment boosts economic growth, increasing tax revenues from corporate profits and personal incomes without raising tax rates. This allows the government to improve public services or reduce the budget deficit. However, in the short term, the government may need to increase spending on infrastructure or provide incentives for private investment, which could worsen the fiscal position. Over time, the higher tax base can more than compensate for initial outlays.
Evaluation
The extent to which each group benefits depends on several factors. The time horizon is crucial: in the short run, consumers may bear costs, while in the long run they gain from lower prices and higher incomes. The type of investment matters: investment in export-oriented industries may benefit producers more than those focused on the domestic market. The level of government involvement also affects distribution: if the government directly invests in public goods, consumers and the government benefit more directly. Moreover, if the economy is operating below full capacity, additional investment may not immediately shift the LRAS but could reduce unemployment, benefiting workers and consumers. The elasticity of demand for the final goods also influences how much of the cost reduction is passed on to consumers.
Conclusion
Producers are not the only beneficiaries of additional investment. While they gain directly from cost reductions and higher profits, consumers benefit from long-term lower prices and greater choice, and the government benefits from higher tax revenues and improved economic performance. The net distribution of benefits depends on the time period, the nature of the investment, and government policies. Therefore, the statement that producers are the only ones to benefit is an oversimplification; all major stakeholders can gain, though the timing and magnitude vary.
Producers are not the only beneficiaries; consumers and the government also benefit, especially in the long run, though the distribution depends on the type of investment and time horizon.
Background Concept
Investment refers to spending on capital goods such as machinery, factories, infrastructure, and technology. It increases the economy's capital stock, which enhances productive capacity and can lead to economic growth. In the AD/AS model, increased investment shifts the long-run aggregate supply (LRAS) curve to the right, indicating that the economy can produce more goods and services at any given price level. This growth can benefit various stakeholders: producers (through lower costs and higher profits), consumers (through lower prices and greater choice), and the government (through higher tax revenues). However, there are also short-run costs, such as reduced consumption in the present and possible higher taxes to fund investment.
Understanding the Question
The question asks you to assess whether producers are the only ones to benefit when an economy allocates additional resources to investment. The command word "assess" requires a balanced analysis of both sides (benefits to producers vs. benefits to others) and a justified conclusion. The mark scheme allocates 8 marks for AO1/AO2 (knowledge, understanding, and analysis) and 4 marks for AO3 (evaluation). The top band for AO1/AO2 requires detailed knowledge, fully developed explanations, accurate use of analytical tools (such as diagrams), and a well-organised response. The top band for AO3 requires a justified conclusion and developed evaluative comments.
You must consider the benefits and costs to producers, consumers, and the government. The indicative content suggests that producers benefit from lower costs and higher profits, but also face costs such as higher taxes. Consumers benefit in the long run from lower prices and wider choice, but may face higher prices and fewer goods in the short run. The government benefits from higher tax revenues in the long run but may incur higher expenditure in the short run. The evaluation should weigh these factors and reach a judgement on whether producers are the only beneficiaries.
Approach
- Introduction: Define investment and state the purpose of the essay.
- Benefits to producers: Explain how investment reduces costs, increases competitiveness, and raises profits. Use an example.
- Benefits to consumers: Explain the long-run gains (lower prices, more choice) and short-run costs (higher prices, fewer goods). Use an AD/AS diagram to illustrate the shift in LRAS.
- Benefits to government: Explain the long-run increase in tax revenue and short-run increase in spending.
- Evaluation: Discuss factors that affect the distribution of benefits: time horizon, type of investment, government involvement, state of the economy, elasticity of demand.
- Conclusion: Provide a justified judgement that producers are not the only beneficiaries; all stakeholders can gain, but the extent varies.
Step-by-Step Reasoning
Step 1: Introduction
- Define investment as spending on capital goods that increases productive capacity.
- State that the essay will assess whether producers are the only beneficiaries by examining the effects on producers, consumers, and the government.
Step 2: Benefits to producers
- Investment reduces costs of production through improved technology and efficiency. For example, a firm that buys new machinery can produce more output per worker, lowering average costs.
- Lower costs allow firms to reduce prices and become more competitive, both domestically and internationally, potentially increasing market share.
- Higher productivity leads to higher profits, which can be reinvested or distributed to shareholders.
- However, if the government funds investment through higher taxes on businesses, this could offset some of the profit gains.
Step 3: Benefits to consumers
- In the long run, increased investment shifts the LRAS curve to the right, as shown in the diagram. This leads to a higher level of real output and a lower price level (assuming AD remains constant). Consumers benefit from lower prices and a wider variety of goods.
- In the short run, however, resources are diverted from consumption to investment, so the output of consumer goods may fall, leading to higher prices. Also, if the government raises taxes to fund investment, consumers have less disposable income.
- The net effect on consumers depends on the time horizon: short-run costs are outweighed by long-run gains if the investment is productive.
Step 4: Benefits to government
- Higher economic growth increases the tax base: corporate profits rise, personal incomes rise, and consumption increases, all generating more tax revenue without raising tax rates.
- This allows the government to improve public services, reduce the budget deficit, or cut taxes in the future.
- In the short run, the government may need to increase spending on infrastructure or provide subsidies for private investment, which could worsen the fiscal position. However, the long-run revenue gains can compensate.
Step 5: Evaluation
- Time horizon: Short-run costs to consumers and government may be significant, but long-run benefits are substantial. The assessment depends on whether the question focuses on the short run or long run.
- Type of investment: Investment in export-oriented industries may benefit producers more than those serving the domestic market. Investment in public goods (e.g., roads, schools) benefits consumers and government more directly.
- Government involvement: If the government directly invests, it may bear more of the short-run cost but also capture more of the long-run benefit through higher tax revenue. If the private sector invests, producers capture more of the profit.
- State of the economy: If the economy is in a recession with unemployed resources, additional investment can reduce unemployment and increase output without sacrificing current consumption, benefiting all stakeholders immediately.
- Elasticity of demand: If demand for the final goods is elastic, cost reductions are passed on to consumers in the form of lower prices, benefiting them more. If demand is inelastic, producers may keep prices high and capture more profit.
Step 6: Conclusion
- Producers are not the only beneficiaries. Consumers and the government also gain, especially in the long run. The distribution of benefits depends on the specific circumstances. Therefore, the statement that producers are the only ones to benefit is an oversimplification.
Key Takeaways
- Investment is a key driver of economic growth and benefits multiple stakeholders.
- The AD/AS model is useful for illustrating the long-run effects of investment on output and prices.
- Evaluation requires considering different perspectives and factors such as time horizon, type of investment, and market conditions.
- A justified conclusion must weigh the evidence and provide a clear judgement.
Common Mistakes
- Writing a one-sided answer that only discusses benefits to producers, which would score zero for evaluation.
- Failing to include a diagram when it would strengthen the analysis (though not required, it helps achieve top band).
- Providing a conclusion that simply summarises both sides without a clear judgement.
- Ignoring the short-run costs to consumers and government, leading to an unbalanced analysis.
- Using vague terms like "it depends" without explaining what it depends on and how.
Things to Be Careful About
- Ensure the AD/AS diagram is correctly labelled: axes (price level and real output), LRAS curves, AD curve, equilibrium points.
- Explain the diagram in the text: what shifts, why, and what the new equilibrium implies.
- Use economic terminology: "productive capacity", "long-run aggregate supply", "tax base", "crowding out", "opportunity cost".
- The conclusion should directly answer the question: are producers the only ones to benefit? No, but explain why.
- Keep the essay well-organised with clear paragraphs and logical flow.
With the help of a diagram, explain how increases in aggregate demand affect the level of real output and the price level in an economy and consider when such increases may become a problem.
Answer
AO1 Knowledge and understanding
Aggregate demand (AD) is the total planned spending on goods and services produced in an economy over a period of time. Its components are consumption (C), investment (I), government spending (G), and net exports (X – M).
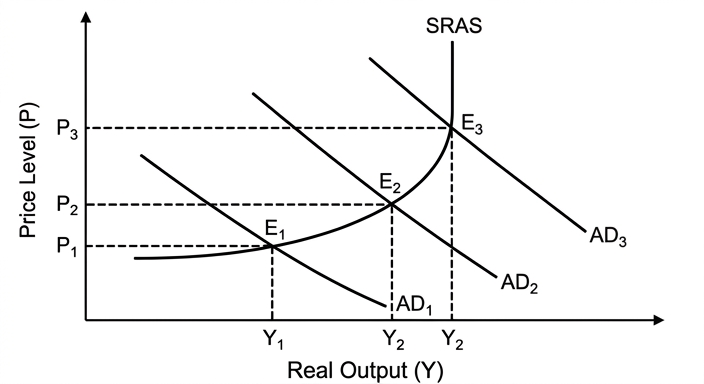
The diagram shows an initial equilibrium at point E1, where AD1 intersects SRAS, giving real output Y1 and price level P1. An increase in AD shifts the AD curve rightwards to AD2.
AO2 Analysis
An increase in AD could be caused by a rise in any of its components, for example a cut in direct taxes raising disposable income and consumption, or a reduction in interest rates stimulating investment.
The effect on real output and the price level depends on the shape of the short-run aggregate supply (SRAS) curve. On the horizontal (Keynesian) portion of SRAS, where there is spare capacity, the increase in AD from AD1 to AD2 raises real output from Y1 to Y2 with little or no increase in the price level (P1 remains unchanged). On the upward-sloping portion, as the economy approaches full capacity, the same increase in AD raises both real output (to Y3) and the price level (to P2).
AO3 Evaluation
Increases in AD become a problem when the economy is at or beyond full employment. On the vertical (classical) portion of SRAS, an increase in AD from AD3 to AD4 raises only the price level (from P3 to P4), causing demand-pull inflation, with no increase in real output. This is particularly damaging if inflation erodes the real value of savings, creates uncertainty for investment, and reduces international competitiveness. Therefore, increases in AD are beneficial when there is spare capacity but become a problem when the economy is at full capacity, as they generate inflation without raising output.
Increases in AD raise real output when there is spare capacity but cause demand-pull inflation without raising output when the economy is at full capacity.
Background Concept
Aggregate demand (AD) represents the total demand for goods and services within an economy at a given price level and over a given time period. The AD curve slopes downward because of the real balance effect (a lower price level increases the real value of money, boosting spending), the interest rate effect (a lower price level reduces demand for money, lowering interest rates and stimulating investment), and the international trade effect (a lower price level makes exports cheaper and imports more expensive, raising net exports).
Aggregate supply (AS) represents the total quantity of goods and services that firms are willing and able to produce at a given price level. The short-run aggregate supply (SRAS) curve is upward-sloping because, in the short run, at least one factor price (usually wages) is sticky. As the price level rises, firms' profit margins increase, so they expand output. The shape of the SRAS curve is crucial: it is relatively flat at low levels of output (Keynesian range, with high spare capacity) and becomes increasingly steep as the economy approaches full capacity, eventually becoming vertical at full employment (classical range).
Understanding the Question
This is an 8-mark, point-based question with three assessment objectives. The question has two parts: (1) "explain how increases in aggregate demand affect the level of real output and the price level" — this requires AO1 (knowledge, including a diagram) and AO2 (analysis, building the chain of reasoning). (2) "and consider when such increases may become a problem" — this is the AO3 evaluation element, requiring a short judgement. The command word "explain" demands a developed causal chain, and "consider" signals a brief but genuine evaluation. The question explicitly requires a diagram, so one must be included and fully explained in the prose.
Approach
- AO1 (3 marks): Define AD and its components. Draw an AD/AS diagram with correctly labelled axes (price level on the vertical, real output on the horizontal), an initial AD curve (AD1), an SRAS curve, and an initial equilibrium. Then show a rightward shift of AD to AD2.
- AO2 (3 marks): Give a concrete cause for the AD increase (e.g., a tax cut). Explain the chain of reasoning: the cause raises a component of AD -> AD shifts right -> at the initial price level, there is excess demand -> firms increase output and raise prices -> a new equilibrium is reached. Crucially, explain that the outcome depends on the shape of the SRAS curve: on the flat portion, output rises with little inflation; on the steep portion, both output and the price level rise; on the vertical portion, only the price level rises.
- AO3 (2 marks): Identify the condition under which AD increases become a problem — when the economy is at full capacity. Explain why this is a problem (demand-pull inflation with no output gain). The mark scheme reserves 1 mark for a justified conclusion, so the final sentence must deliver a clear judgement.
Step-by-Step Reasoning
Step 1: Define AD and its components (AO1).
AD = C + I + G + (X – M). A candidate should state this formula and briefly explain each component. This establishes the knowledge base.
Step 2: Draw and label the AD/AS diagram (AO1).
The diagram must have:
- Vertical axis: Price Level (P)
- Horizontal axis: Real Output (Y) or Real GDP
- A downward-sloping AD curve (AD1)
- An upward-sloping SRAS curve (which is flat at low output and steep at high output)
- Initial equilibrium at the intersection of AD1 and SRAS, labelled E1, with corresponding P1 and Y1.
- A rightward shift of AD to AD2, with a new equilibrium E2, showing the new P2 and Y2.
- Optionally, a further shift to AD3 on the vertical portion to show the problem case.
Step 3: Explain a cause of the AD increase (AO2).
For example: "The government cuts income tax, increasing households' disposable income. This raises consumption (C), a component of AD. The AD curve shifts rightwards from AD1 to AD2."
Step 4: Explain the effect on output and the price level (AO2).
"At the initial price level P1, the increase in AD creates excess demand. Firms respond by increasing output and raising prices. The new equilibrium is at a higher real output (Y2) and a higher price level (P2). The extent of the change depends on the elasticity of SRAS. If the economy has significant spare capacity, SRAS is relatively elastic (flat), so the increase in output is large and the increase in the price level is small. As the economy approaches full capacity, SRAS becomes inelastic (steep), so the same increase in AD causes a smaller increase in output and a larger increase in the price level."
Step 5: Evaluate when AD increases become a problem (AO3).
"Increases in AD become a problem when the economy is at full employment. On the vertical portion of the SRAS curve, an increase in AD cannot raise output because all factors of production are fully utilised. The entire increase in AD is dissipated in a higher price level, causing demand-pull inflation. This inflation can be harmful: it erodes the real value of savings, creates uncertainty that discourages investment, and reduces international competitiveness if the inflation rate is higher than that of trading partners. Therefore, while AD increases are beneficial for reducing unemployment when there is spare capacity, they are problematic at full capacity because they generate inflation without any increase in real output."
Key Takeaways
- The effect of an AD shift depends critically on the shape of the SRAS curve, which reflects the amount of spare capacity in the economy.
- A diagram is essential when requested; it must be fully labelled and explained in the text.
- The command word "consider" in a point-based question signals a short evaluation, not a full essay. A one-sentence justified conclusion is sufficient to earn the reserved mark.
- The distinction between the Keynesian (flat) and classical (vertical) ranges of SRAS is a core concept for this topic.
Common Mistakes
- Omitting the diagram: The question explicitly requires a diagram. A candidate who writes only prose cannot access the full AO1 marks.
- Drawing an inaccurate diagram: Common errors include labelling the axes incorrectly (e.g., "Price" instead of "Price Level"), drawing a vertical LRAS instead of an upward-sloping SRAS, or failing to show the shift of the AD curve.
- Not explaining the diagram: A diagram alone earns no analysis marks. The candidate must explain what the diagram shows and why.
- One-sided evaluation: The "consider" clause requires a judgement. Simply stating that AD increases raise output is insufficient; the candidate must identify the condition under which it becomes a problem.
- Confusing a movement along AD with a shift of AD: An increase in AD is a shift of the curve, not a movement along it. A movement along AD is caused by a change in the price level.
- Generic answer: Answering the general theme of AD/AS without addressing the specific question about when increases become a problem.
Things to Be Careful About
- Label everything on the diagram: Axes (Price Level, Real Output), curves (AD1, AD2, SRAS), equilibrium points (E1, E2), and the corresponding price levels (P1, P2) and output levels (Y1, Y2).
- Use the correct terminology: "Aggregate demand," "short-run aggregate supply," "price level," "real output," "demand-pull inflation."
- Distinguish between nominal and real: The question asks about "real output" — ensure the answer consistently refers to real, not nominal, values.
- The evaluation must be a judgement, not a summary: The final sentence should state a clear position (e.g., "AD increases are beneficial when there is spare capacity but become a problem at full capacity").
- Keep the evaluation concise: This is a 2-mark evaluation, so a few well-chosen sentences are sufficient. Do not write an essay.
Assess whether increases in aggregate demand are the best way of reducing unemployment in a high-income country.
Introduction
Unemployment refers to individuals who are willing and able to work but cannot find a job. In a high-income country, the main types are cyclical unemployment, caused by a deficiency of aggregate demand (AD), and structural unemployment, caused by a mismatch between workers' skills and the jobs available. This essay assesses whether increasing AD is the best way to reduce unemployment, comparing it with supply-side policies.
The case for increasing AD to reduce unemployment
Cyclical unemployment arises when AD is insufficient to purchase the economy's potential output, leaving firms with unsold goods and causing them to lay off workers. An increase in AD — achieved through expansionary fiscal policy (e.g., higher government spending or tax cuts) or expansionary monetary policy (e.g., lower interest rates) — shifts the AD curve rightwards. This raises real output and, through the derived demand for labour, reduces cyclical unemployment.
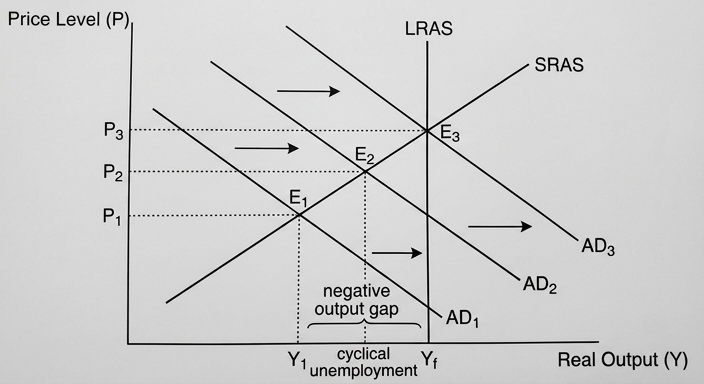
In the diagram, the economy is initially at equilibrium E1, with real output Y1 below the full-employment level Yf, indicating a negative output gap and cyclical unemployment. An increase in AD shifts the curve to AD2, moving the economy to E2 at Yf, eliminating the output gap and reducing cyclical unemployment. This policy can be effective relatively quickly, especially if implemented through automatic stabilisers or rapid discretionary action.
The limitations of AD-based policies
However, increasing AD is ineffective against structural unemployment. Structural unemployment arises from long-term changes in the structure of the economy, such as the decline of manufacturing industries or technological change, which leave workers with obsolete skills. Boosting AD will not create jobs for these workers if they lack the skills employers need; it may simply cause demand-pull inflation as the economy approaches full capacity, as shown by a further shift to AD3 raising only the price level to P3. Furthermore, in a high-income country with a mature economy, the natural rate of unemployment may be relatively high due to generous welfare benefits creating a disincentive to work (a 'replacement ratio' effect), which AD policy cannot address. Expansionary policies can also create side effects such as higher inflation, a budget deficit, or a current account deficit if the increased demand is met by imports.
The case for supply-side policies
Supply-side policies aim to increase the productive capacity of the economy by shifting the long-run aggregate supply (LRAS) curve rightwards. Policies such as education and training programmes directly tackle structural unemployment by equipping workers with the skills demanded by growing industries. Deregulation of labour markets (e.g., reducing minimum wages or employment protection laws) can make it easier and cheaper for firms to hire workers, reducing both structural and frictional unemployment. Investment in infrastructure improves the economy's productive potential and can attract new industries. These policies address the root causes of unemployment that are immune to demand management.
Limitations of supply-side policies
Supply-side policies are typically long-term and slow to take effect. Training programmes take years to complete, and their impact on unemployment may not be felt for a decade. They can also be expensive, requiring significant government spending at a time when budgets may be constrained. Moreover, they do not address cyclical unemployment caused by a sudden fall in AD; during a recession, even a well-trained workforce will be unemployed if there is no demand for its output.
Evaluation
The best approach depends on the type of unemployment that is dominant. In a high-income country experiencing a recession with high cyclical unemployment (e.g., the 2008 financial crisis), increasing AD is the most direct and effective short-term solution. However, if the country suffers from high structural unemployment due to deindustrialisation or rapid technological change (e.g., the 'rust belt' regions of the US or UK), supply-side policies are essential. The two policies are not mutually exclusive; a combination is often most effective. For example, expansionary fiscal policy can be used to boost AD in the short run while simultaneously funding training programmes to reduce structural unemployment in the long run.
Conclusion
Increases in AD are not the best way to reduce unemployment in a high-income country if the unemployment is primarily structural. They are highly effective against cyclical unemployment but are ineffective and potentially inflationary when applied to structural unemployment. The best policy mix is a targeted one: use AD management to stabilise the economy during downturns and supply-side policies to address the underlying structural issues. Therefore, the statement is only partially true — AD increases are the best way to reduce cyclical unemployment, but not the best way to reduce unemployment overall.
Increases in AD are the best way to reduce cyclical unemployment in a high-income country, but they are ineffective against structural unemployment. A combination of AD management for short-term cyclical issues and supply-side policies for long-term structural issues is the most effective overall strategy.
Background Concept
Unemployment is a key macroeconomic objective. The main types relevant to this question are:
- Cyclical (demand-deficient) unemployment: Occurs when there is insufficient AD in the economy. It is associated with a negative output gap and is temporary, typically rising during recessions and falling during booms.
- Structural unemployment: Occurs when there is a mismatch between the skills of the workforce and the skills demanded by employers. It is often caused by long-term changes in the economy, such as deindustrialisation, technological change, or globalisation. It is more persistent and requires different policy responses.
- Frictional unemployment: Short-term unemployment arising from the time it takes for workers to find new jobs. It is a natural part of a dynamic economy.
Aggregate demand (AD) is the total spending in the economy. Policies to increase AD are called expansionary demand-side policies. They include:
- Expansionary fiscal policy: Increasing government spending (G) or cutting taxes (which raises consumption, C, and investment, I).
- Expansionary monetary policy: Lowering interest rates (which stimulates C and I) or increasing the money supply.
Supply-side policies aim to increase the economy's productive capacity (LRAS). They include:
- Interventionist policies: Government spending on education, training, and infrastructure.
- Market-based policies: Deregulation, privatisation, tax reforms to incentivise work and investment, and reducing the power of trade unions.
Understanding the Question
This is a 12-mark, levels-marked essay (AO1+AO2 out of 8, AO3 out of 4). The command word is "Assess whether," which demands a two-sided evaluation and a justified conclusion. The question specifies "in a high-income country," which is a crucial contextual constraint. The mark scheme explicitly states: "L2 max if no reference to high-income countries" and "if no reference to a high-income country, no evaluation marks may be awarded." This means the answer must consider the specific characteristics of a high-income economy, such as a mature industrial base, a high natural rate of unemployment possibly due to generous welfare, and a service-sector-dominated economy.
The top band (Level 3 for AO1/AO2) requires: detailed knowledge, fully developed explanations, accurate use of analytical tools (a diagram is expected), and a well-organised, logical response. The top band for AO3 (Level 2) requires: a justified conclusion addressing the specific requirements of the question, with developed, reasoned, and well-supported evaluative comments.
Approach
- Introduction: Define unemployment and its key types (cyclical and structural). State the two policy approaches to be compared: demand-side (increasing AD) and supply-side. Set up the essay's structure.
- First side (The case for increasing AD): Explain how AD increases reduce cyclical unemployment. Use an AD/AS diagram to illustrate the process. Give examples of policies (fiscal and monetary). Emphasise the speed and directness of this approach.
- Counter-argument (Limitations of AD): Explain why AD increases are ineffective against structural unemployment. Discuss the risk of demand-pull inflation. Mention side effects (budget deficit, current account deficit). Link to the context of a high-income country (e.g., high natural rate of unemployment, welfare disincentives).
- Second side (The case for supply-side policies): Explain how supply-side policies reduce structural and frictional unemployment. Give specific examples (training, deregulation, infrastructure). Explain the mechanism (shifting LRAS rightwards, increasing the economy's capacity to employ workers).
- Counter-argument (Limitations of supply-side): Discuss the long time lags, high cost, and ineffectiveness against cyclical unemployment.
- Evaluation: Weigh the two approaches against each other. The key criterion is the type of unemployment that is dominant. A second criterion is the time horizon (short-run vs. long-run). Argue that the policies are complementary, not mutually exclusive. A high-income country with a mix of cyclical and structural unemployment needs a combination approach.
- Conclusion: Deliver a justified judgement that directly answers the question. The conclusion should state that AD increases are not the best way overall, but are the best for cyclical unemployment. The best overall strategy is a targeted mix.
Step-by-Step Reasoning
Step 1: Define the key terms and set the context.
Start by defining unemployment and distinguishing between cyclical and structural unemployment. Explain that a high-income country typically has a mature, service-based economy, a well-developed welfare state, and a higher natural rate of unemployment compared to developing countries. This context is essential for the evaluation.
Step 2: Explain how increasing AD reduces unemployment (the 'for' side).
"Cyclical unemployment is caused by a deficiency of AD. For example, during a recession, consumer confidence falls, reducing consumption (C). Firms see falling demand and reduce production, laying off workers. The government can intervene with expansionary fiscal policy (e.g., a cut in income tax, which raises disposable income and C) or expansionary monetary policy (e.g., a cut in the central bank interest rate, which reduces the cost of borrowing for consumption and investment). These policies increase AD, shifting the AD curve rightwards. Firms respond by increasing output, which requires more labour, thus reducing cyclical unemployment."
Step 3: Draw and explain the AD/AS diagram.
The diagram should show:
- An initial AD curve (AD1) intersecting SRAS at a point below the full-employment level of output (Yf). This represents a negative output gap and cyclical unemployment.
- A rightward shift of AD to AD2, intersecting SRAS at Yf. This shows the elimination of the output gap and the reduction of cyclical unemployment.
- A further shift to AD3, showing that beyond Yf, the increase in AD only raises the price level (demand-pull inflation).
Explain the diagram in the text: "The diagram shows that an increase in AD from AD1 to AD2 moves the economy from a below-full-employment equilibrium to the full-employment level of output Yf, reducing cyclical unemployment. However, any further increase in AD beyond this point, to AD3, is purely inflationary."
Step 4: Explain the limitations of AD-based policies (the 'against' side).
"Increasing AD is ineffective against structural unemployment. Structural unemployment arises from a mismatch between the skills of the workforce and the skills demanded by employers. For example, in a high-income country, the decline of manufacturing may leave former factory workers without the skills needed for jobs in the growing service or technology sectors. Boosting AD will not create jobs for these workers because they are not qualified for the available vacancies. Instead, the increased demand may simply bid up wages for skilled workers and cause demand-pull inflation. Furthermore, in a high-income country with generous unemployment benefits, the 'replacement ratio' (the ratio of benefits to potential wages) may be high, reducing the incentive for the unemployed to seek work. AD policy cannot address this supply-side disincentive. Expansionary policies also carry side effects: higher inflation, a larger budget deficit (if using fiscal policy), and a worsening current account deficit (if the increased demand is met by imports)."
Step 5: Explain the case for supply-side policies.
"Supply-side policies directly address the causes of structural unemployment. For example, government-funded training programmes can retrain former manufacturing workers for jobs in IT or healthcare. Deregulation of the labour market, such as reducing the minimum wage or making it easier to hire and fire workers, can reduce the cost of labour for firms, encouraging them to hire more workers. Investment in infrastructure (transport, broadband) can attract new industries and create jobs. These policies shift the LRAS curve rightwards, increasing the economy's potential output and its capacity to employ workers at any given price level. They address the root cause of structural unemployment, which AD policy cannot."
Step 6: Explain the limitations of supply-side policies.
"Supply-side policies are long-term. Training programmes take years to complete, and their impact on unemployment may not be felt for a decade. They are also expensive, requiring significant government spending at a time when budgets may be constrained. Most importantly, they do not address cyclical unemployment. During a recession, even a well-trained workforce will be unemployed if there is no demand for its output. A supply-side policy cannot prevent a rise in cyclical unemployment caused by a sudden fall in AD."
Step 7: Evaluate and conclude.
"The best approach depends on the dominant type of unemployment. In a high-income country experiencing a recession (e.g., the 2008 financial crisis or the COVID-19 pandemic), cyclical unemployment is the main problem, and increasing AD is the most direct and effective short-term solution. However, if the country suffers from high structural unemployment due to deindustrialisation (e.g., the UK's 'rust belt' or the US's 'Rust Belt'), supply-side policies are essential. The two policies are not mutually exclusive; a combination is often most effective. For example, expansionary fiscal policy can be used to boost AD in the short run while simultaneously funding training programmes to reduce structural unemployment in the long run. Therefore, increases in AD are not the 'best' way to reduce unemployment overall; they are the best way to reduce cyclical unemployment, but supply-side policies are necessary to address structural unemployment. A targeted, mixed approach is superior to relying on either policy alone."
Key Takeaways
- The type of unemployment matters: AD policy works for cyclical unemployment; supply-side policy works for structural unemployment.
- Context is crucial: The question specifies "high-income country," so the answer must reference its characteristics (mature economy, welfare state, service sector, higher natural rate of unemployment).
- A diagram is expected for a top-band answer. It must be fully explained in the text.
- Evaluation must be two-sided and lead to a justified conclusion. A one-sided answer scores zero for evaluation.
- The best answer recognises that the two policy approaches are complementary, not competing.
Common Mistakes
- One-sided answer: Only arguing for AD increases or only against them. This forfeits all evaluation marks.
- Ignoring the context: Failing to mention "high-income country" at all. This caps the answer at Level 2 for AO1/AO2 and awards zero for AO3.
- No diagram: A top-band answer requires a diagram. Omitting it limits the analysis marks.
- Confusing types of unemployment: Treating all unemployment as cyclical and assuming AD policy is a universal solution.
- No conclusion or a vague conclusion: The top band requires a justified conclusion. A summary of both sides without a judgement is insufficient.
- Listing policies without analysis: Simply stating that the government can cut taxes or increase spending is not enough. The answer must explain the chain of reasoning from the policy to the reduction in unemployment.
- Ignoring side effects: A strong evaluation considers the negative consequences of each policy (inflation, budget deficit, time lags, cost).
Things to Be Careful About
- Use the correct terminology: "Cyclical unemployment," "structural unemployment," "demand-deficient unemployment," "aggregate demand," "supply-side policy," "long-run aggregate supply."
- Structure the essay logically: Introduction -> Case for AD -> Limitations of AD -> Case for supply-side -> Limitations of supply-side -> Evaluation -> Conclusion.
- The diagram must be integrated: Refer to it in the text and explain what it shows. Do not just draw it and move on.
- The conclusion must be a judgement: State which policy is better and under what conditions. "It depends" is acceptable only if you explain what it depends on and reach a clear verdict.
- Keep the answer focused on the question: The question is about reducing unemployment, not about achieving other macroeconomic objectives. While side effects like inflation are relevant, the primary focus must remain on unemployment.
Explain two possible causes of a change in the terms of trade in an economy and consider which of these causes is likely to be more important for low-income countries.
Answer
AO1 Knowledge and understanding
The terms of trade measure the ratio of a country's export price index to its import price index: (Index of export prices / Index of import prices) x 100. An improvement in the terms of trade means that export prices have risen relative to import prices, so fewer exports are needed to buy a given quantity of imports. A deterioration means the opposite.
AO2 Analysis
Two possible causes of a change in the terms of trade are:
-
A change in export prices. For example, if a country's main export (e.g., oil) experiences a rise in world demand, its export price index increases. With import prices unchanged, the terms of trade improve.
-
A change in import prices. For example, if the price of imported manufactured goods falls due to increased global competition, the import price index falls. With export prices unchanged, the terms of trade improve.
Low-income countries typically export primary products (e.g., agricultural goods, minerals) and import manufactured goods. The demand for primary products is often income-inelastic, so as world income rises, the relative price of primary exports may fall, causing a deterioration in the terms of trade. However, some low-income countries export commodities with inelastic demand (e.g., oil), so rising commodity prices can improve their terms of trade.
AO3 Evaluation
For low-income countries, changes in export prices are likely to be more important than changes in import prices. This is because the prices of primary exports are highly volatile (due to supply shocks and fluctuating demand), and these countries rely heavily on export revenues for income and foreign exchange. A fall in export prices can significantly worsen their terms of trade and reduce real income. In contrast, import prices of manufactured goods tend to be more stable. Therefore, the volatility of export prices makes them the dominant cause of terms-of-trade changes for low-income countries.
Changes in export prices are likely to be more important for low-income countries because primary export prices are more volatile and have a larger impact on real income.
Background Concept
The terms of trade (ToT) is a key concept in international economics. It measures the relative price of a country's exports compared to its imports. The formula is:
ToT = (Index of export prices / Index of import prices) x 100
If the index rises, the terms of trade improve – the country can buy more imports for the same quantity of exports. If it falls, the terms of trade deteriorate – the country must export more to buy the same imports. Changes in the terms of trade affect a country's real income and standard of living.
Understanding the Question
This question asks you to explain two possible causes of a change in the terms of trade and then consider which cause is likely to be more important for low-income countries. The command word "explain" requires you to define and develop the causes, while "consider" introduces evaluation – you must weigh the two causes and reach a judgement. The question is point-based, with marks allocated to AO1 (knowledge), AO2 (analysis), and AO3 (evaluation).
Approach
Start by defining the terms of trade (AO1). Then identify two distinct causes: changes in export prices and changes in import prices. For each, explain how they affect the ratio (AO2). Use examples relevant to low-income countries – they typically export primary goods and import manufactured goods. Finally, evaluate which cause is more important (AO3). The evaluation should consider the volatility of primary export prices, the income inelasticity of demand for primary goods, and the stability of manufactured import prices. Conclude with a justified judgement.
Step-by-Step Reasoning
-
Define the terms of trade. State the formula and explain that an improvement means export prices rise relative to import prices, and a deterioration means the opposite. This earns AO1 marks.
-
Cause 1: Change in export prices. If export prices rise (e.g., due to increased global demand for a country's exports), the terms of trade improve. If export prices fall (e.g., due to a bumper harvest of agricultural goods), the terms of trade deteriorate. For low-income countries, export prices of primary commodities are often volatile.
-
Cause 2: Change in import prices. If import prices fall (e.g., due to cheaper manufactured goods from emerging economies), the terms of trade improve. If import prices rise (e.g., due to oil price shocks), the terms of trade deteriorate. Low-income countries import manufactured goods, whose prices tend to be more stable.
-
Apply to low-income countries. Explain that low-income countries export primary products (agricultural goods, minerals) and import manufactured goods. The demand for primary products is income-inelastic, so as world income grows, the relative price of primary exports may fall (Prebisch-Singer hypothesis). This causes a long-run deterioration in their terms of trade. However, some low-income countries export commodities with inelastic demand (e.g., oil), so rising commodity prices can improve their terms of trade.
-
Evaluate which cause is more important. Consider that export prices are more volatile due to supply shocks (weather, political instability) and demand fluctuations. A sharp fall in export prices can devastate export revenues and real income. Import prices of manufactured goods are relatively stable. Therefore, changes in export prices are likely to have a larger and more immediate impact on low-income countries' terms of trade and economic welfare. Conclude that changes in export prices are more important.
Key Takeaways
- The terms of trade measure the relative price of exports to imports.
- Changes can be caused by shifts in export prices or import prices.
- For low-income countries, export price volatility is often the dominant factor.
- The Prebisch-Singer hypothesis suggests a long-run deterioration in the terms of trade for primary exporters.
Common Mistakes
- Confusing the terms of trade with the balance of trade (the difference between export and import values).
- Stating that an improvement in the terms of trade is always good – it can reduce export competitiveness if export prices rise too much.
- Not distinguishing between price changes and quantity changes – the terms of trade only consider prices.
- Providing only one cause instead of two.
- Failing to include a conclusion for the evaluation marks.
Things to Be Careful About
- Use the correct formula and explain what an increase or decrease means.
- Ensure the two causes are distinct (export prices vs import prices).
- When evaluating, explicitly state which cause is more important and why.
- Use examples relevant to low-income countries (e.g., coffee, oil, textiles).
- Reserve one mark for a justified conclusion – do not just list both sides without a verdict.
Assess the extent to which different tools of protection can impact on the terms of trade in an economy.
Introduction
The terms of trade measure the ratio of export prices to import prices. Tools of protection, such as tariffs, import quotas, and export subsidies, are government policies that restrict or distort international trade. This essay assesses the extent to which these tools can impact a country's terms of trade.
Analysis of tools of protection and their impact on the terms of trade
Tariffs: A tariff is a tax on imports, which raises the domestic price of imported goods. If a large country imposes a tariff, it can reduce world demand for the good, potentially lowering the world price of imports. This would improve the country's terms of trade because import prices fall relative to export prices. However, if the country is small, the tariff does not affect world prices, so the terms of trade remain unchanged. Additionally, retaliation by trading partners (e.g., they impose tariffs on the country's exports) can reduce export prices, worsening the terms of trade.
Import quotas: A quota limits the quantity of imports, which raises domestic import prices. Similar to a tariff, if the country is large, the quota can reduce world demand and lower world import prices, improving the terms of trade. However, quotas often lead to higher domestic prices without the government revenue effect, and retaliation can again offset any gain.
Export subsidies: An export subsidy is a payment to domestic firms to encourage exports. This lowers the world price of the exported good, worsening the terms of trade because export prices fall relative to import prices. The subsidy also imposes a cost on taxpayers and may provoke retaliation from trading partners.
Evaluation
The extent to which protection tools impact the terms of trade depends on several factors:
- Country size: Large countries can influence world prices, so their protection policies can improve their terms of trade (e.g., a tariff by a large economy). Small countries have no such power.
- Price elasticities: If the demand for imports is inelastic, a tariff may not reduce world prices much, limiting the terms-of-trade improvement. Similarly, if export demand is elastic, an export subsidy will cause a large fall in export prices, worsening the terms of trade significantly.
- Retaliation: Trading partners are likely to retaliate, which can negate any initial improvement. For example, if Country A imposes a tariff on Country B's exports, Country B may retaliate with its own tariffs, reducing Country A's export prices and worsening its terms of trade. This is a common outcome in trade wars.
- Long-run effects: Protection may encourage domestic industries to become more efficient (infant industry argument), potentially raising export prices in the future and improving the terms of trade. However, protection can also lead to inefficiency and higher costs, worsening the terms of trade over time.
Conclusion
Protection tools can impact the terms of trade, but the extent is limited. For large economies, tariffs and quotas can improve the terms of trade in the short run, but retaliation often erodes these gains. Export subsidies unambiguously worsen the terms of trade. For small economies, protection has little direct impact on the terms of trade because they cannot influence world prices. Overall, the impact of protection on the terms of trade is generally small and often negative when retaliation is considered, so the extent is limited.
The impact of protection tools on the terms of trade is limited: large countries may achieve short-run improvements via tariffs or quotas, but retaliation and the negative effect of export subsidies mean the overall extent is small, especially for small countries.
Background Concept
The terms of trade (ToT) = (export price index / import price index) x 100. An improvement means export prices rise relative to import prices, so the country can buy more imports per export. Tools of protection are government policies that restrict or distort international trade. Common tools include tariffs (taxes on imports), import quotas (quantity limits on imports), and export subsidies (payments to exporters). These tools affect the prices of traded goods and therefore can alter the terms of trade.
Understanding the Question
The question asks you to "assess the extent to which different tools of protection can impact on the terms of trade in an economy." The command word "assess" requires you to evaluate the impact, considering both sides (how tools can improve or worsen the terms of trade) and to reach a justified conclusion about the extent of that impact. The question is levels-marked, so you need a well-organised essay with developed analysis and evaluation.
Approach
Start by defining the terms of trade and briefly introducing the tools of protection. Then analyse each tool separately: tariffs, import quotas, and export subsidies. For each, explain the mechanism by which they affect import or export prices and thus the terms of trade. Include the distinction between large and small countries. Then evaluate the extent of the impact by considering factors like retaliation, price elasticities, and long-run effects. Finally, conclude with a judgement on the overall extent.
Step-by-Step Reasoning
-
Define key concepts. Terms of trade: ratio of export to import prices. Tools of protection: tariffs, quotas, subsidies.
-
Analyse tariffs. A tariff raises the domestic price of imports. If the country is large (its demand affects world prices), the tariff reduces world demand for the imported good, lowering its world price. This improves the terms of trade because import prices fall relative to export prices. If the country is small, world prices are unchanged, so the terms of trade are unaffected. However, retaliation (other countries imposing tariffs on the country's exports) can reduce export prices, worsening the terms of trade.
-
Analyse import quotas. A quota restricts the quantity of imports, raising domestic prices. Similar to a tariff, if the country is large, the quota can reduce world demand and lower world import prices, improving the terms of trade. But quotas often lead to higher domestic prices without government revenue, and retaliation can offset gains.
-
Analyse export subsidies. An export subsidy lowers the world price of the exported good because it encourages more supply. This reduces export prices, worsening the terms of trade. The subsidy also imposes a fiscal cost and may provoke retaliation.
-
Evaluate the extent of impact. Consider:
- Country size: Only large countries can influence world prices; small countries cannot.
- Price elasticities: If import demand is inelastic, a tariff may not reduce world prices much. If export demand is elastic, an export subsidy causes a large fall in export prices.
- Retaliation: Trade partners often retaliate, which can reverse any initial improvement. Trade wars can leave both countries worse off.
- Long-run effects: Protection might help infant industries become competitive, raising export prices later, but it can also lead to inefficiency and higher costs.
-
Reach a justified conclusion. The extent is limited because retaliation often negates gains, small countries have no impact, and export subsidies always worsen the terms of trade. Therefore, protection tools have a small and often negative net impact on the terms of trade.
Key Takeaways
- Protection tools affect the terms of trade by altering import or export prices.
- Large countries can potentially improve their terms of trade with tariffs or quotas, but retaliation limits this.
- Export subsidies unambiguously worsen the terms of trade.
- The overall extent of impact is limited, especially for small economies.
Common Mistakes
- Writing a one-sided answer (e.g., only discussing how tariffs improve the terms of trade without considering retaliation or export subsidies). This loses all evaluation marks.
- Confusing the terms of trade with the balance of trade or the current account.
- Not distinguishing between large and small countries.
- Failing to include a justified conclusion – a summary without a judgement is not enough for top band.
- Ignoring the requirement to discuss at least two tools (tariffs plus one other).
Things to Be Careful About
- Clearly define the terms of trade at the start.
- Use specific examples (e.g., US steel tariffs, EU agricultural subsidies) to support analysis.
- Ensure evaluation is developed – do not just list factors; explain how they affect the extent.
- The conclusion must directly answer the question: "to what extent" – state whether the impact is large or small and why.
- Avoid vague statements like "it depends" without specifying on what and with what outcome.