Economics 9708/22 — May/June 2024
Cambridge AS Level · AS Level Data Response and Essays · worked solutions for every part, with the mark scheme
Topics Price Stability · Aggregate Demand and Aggregate Supply · Elasticities of Demand · Monetary Policy · Income and Wealth Inequality · Classification of Goods and Services · +6 more
Dilemma for the European Central Bank (ECB)
The Eurozone consists of 19 European Union (EU) states that have agreed to use a common currency (the euro) and monetary policy, both of which are governed by the ECB. The ECB sets interest rates for all 19 members of the Eurozone and since July 2021 has aimed to maintain the rate of inflation at 2% in the medium term. Interest rates have been held at 0% since March 2016.
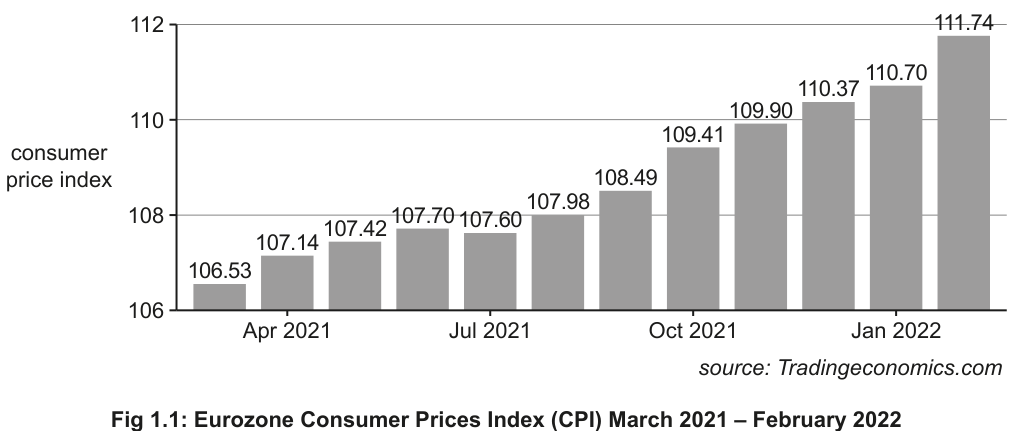
Fig 1.1: Eurozone Consumer Prices Index (CPI) March 2021 – February 2022
In March 2022, the annual rate of inflation hit a record high for the Eurozone of 7.5% and is forecast to continue to rise throughout 2022. Additionally, according to the ECB vice president, annual economic growth is expected to fall from 4.6% at the end of 2021 to around 0% at the end of 2022. Most of the impact of these changes is expected to fall on consumers. Much higher energy costs and rising food prices tend to have a more severe effect on poorer households and those on fixed incomes.
The main causes of the rapid increase in the inflation rate are supply-side factors. The rise in energy prices result from a combination of the Covid-19 pandemic and the conflict between Russia and Ukraine which have reduced supplies of oil and gas. Additionally, the Eurozone labour market is increasingly suffering from a shortage of supply as unemployment has fallen to a record low of 6.8% in February 2022 with further falls predicted. Because the rise in the rate of inflation is almost exclusively supply-side driven, the ECB fears that this will lead to further falls in economic growth leading to a period of ‘stagflation’, where an economy experiences high inflation and low economic growth at the same time.
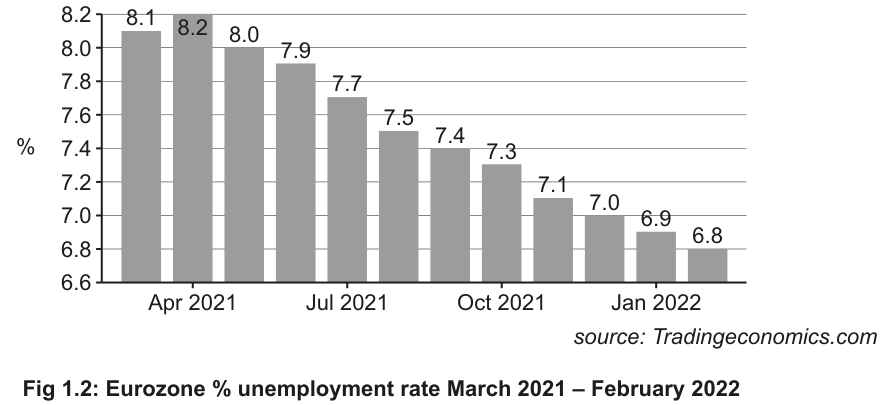
Fig 1.2: Eurozone % unemployment rate March 2021 – February 2022
All this leaves the ECB with a dilemma. Should it:
- increase interest rates substantially now to control the increasing rate of inflation and risk weakening economic growth even further, or
- increase them slightly in the hope that supply pressure will ease soon (this runs the risk of making high inflation more permanent if the pressure does not ease), or
- leave interest rates unchanged?
Sources, adapted from: reuters.com 31 March 2022 and reporting by Balazs Koranyi 1 April 2022
Describe what has happened to consumer prices in the Eurozone between March 2021 and February 2022.
Answer
Consumer prices in the Eurozone rose consistently between March 2021 and February 2022. The CPI increased from 106.53 in March 2021 to 111.74 in February 2022, a rise of approximately 4.9% over the period. There was only a very small dip in the CPI in July 2021, when it fell slightly from 107.70 in June 2021 to 107.60.
Consumer prices rose consistently from 106.53 in March 2021 to 111.74 in February 2022, an increase of around 4.9%, with only a minor dip in July 2021.
Background Concept
The consumer price index (CPI) is the most common measure of inflation, tracking changes over time in the average price of a basket of goods and services typically purchased by households. Describing a trend in CPI involves identifying the overall direction of change over a period, supported by specific data points from the relevant time series.
Understanding the Question
This part asks you to describe what happened to Eurozone consumer prices between March 2021 and February 2022, using the data provided in Fig 1.1. It is a 2-mark point-based question, so you need to provide two distinct, valid observations about the trend, supported by data from the chart where possible. The command word is "describe", so no analysis or evaluation is required — just factual observations about the data.
Approach
First, identify the overall trend in the CPI over the period. Then, select specific data points to support this trend, and note any exceptions or notable features (such as the small dip in July 2021). Each valid observation earns 1 mark, so two clear, accurate points are sufficient for full marks.
Step-by-Step Reasoning
- First, look at the start and end values of the CPI: March 2021 is 106.53, February 2022 is 111.74. This shows an overall upward trend, with a total rise of around 4.9% over the 11-month period. This is one valid mark.
- Next, note the monthly pattern: the CPI rises in almost every month, with only a very small dip between June 2021 (107.70) and July 2021 (107.60). This is a second valid mark.
- Other valid observations could include noting that the rate of increase accelerated after October 2021, or that the largest monthly increase was between January 2022 (110.70) and February 2022 (111.74).
Key Takeaways
- When describing a time-series trend, always state the overall direction first, then support it with specific data points.
- Exceptions to the overall trend (like the small July 2021 dip) are creditworthy observations.
- For 2-mark description questions, two distinct, accurate points are sufficient for full marks.
Common Mistakes
- Stating the overall trend without any supporting data: this may earn only 1 mark, as the mark scheme notes that simply saying prices rose from 106.53 to 111.74 is worth a maximum of 1 mark.
- Calculating the percentage change incorrectly: the correct calculation is (111.74 - 106.53)/106.53 * 100 ≈ 4.89%, so answers between 4.8% and 4.9% are accepted.
- Listing every single data point: this is unnecessary and takes up time, as only two valid points are needed.
Things to Be Careful About
- Use the exact values from the chart, and state the units (CPI points, or percentage change) if you calculate a percentage.
- Do not add analysis or evaluation to a "describe" question, as this is not required and wastes time.
- Note that the mark scheme accepts observations without figures, but including figures strengthens your answer and ensures you get the mark.
With the help of an aggregate demand and aggregate supply diagram, identify the main type of inflation in the Eurozone.
Answer
The main type of inflation in the Eurozone is cost-push inflation.
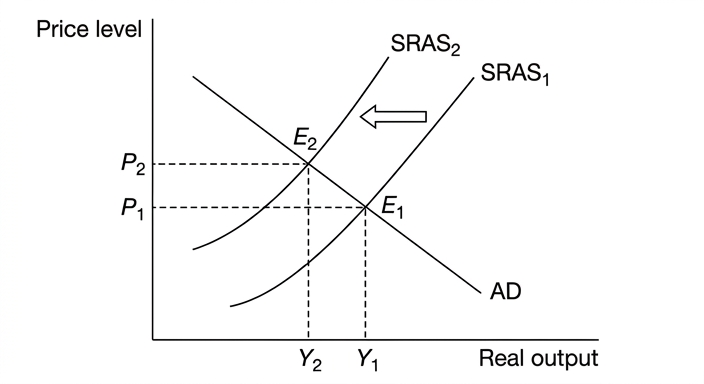
The diagram shows the AD curve unchanged and the SRAS curve shifting leftward from SRAS1 to SRAS2. This leftward shift raises the price level from P1 to P2 and reduces real output from Y1 to Y2, which is characteristic of cost-push inflation caused by increased production costs such as higher energy and labour costs.
Cost-push inflation
Background Concept
Cost-push inflation occurs when the general price level rises due to increased costs of production, which shift the short-run aggregate supply (SRAS) curve to the left. This is distinct from demand-pull inflation, which is caused by increases in aggregate demand shifting the AD curve rightward. The AD/AS model is used to illustrate both types of inflation: cost-push inflation results in a higher price level and lower real output, while demand-pull inflation results in a higher price level and higher real output.
Understanding the Question
This 2-mark part asks you to identify the main type of inflation in the Eurozone, using an AD/AS diagram to support your answer. The extract states that the main causes of inflation are supply-side factors: higher energy prices from the Russia-Ukraine conflict and pandemic supply disruptions, plus labour shortages pushing up wages. The command words are "with the help of a diagram" and "identify", so you need to both state the inflation type and provide a correctly labelled diagram to illustrate it.
Approach
First, identify the inflation type from the extract's description of supply-side causes: this is cost-push inflation. Then, draw an AD/AS diagram that shows the SRAS curve shifting left (due to higher production costs) with AD unchanged, leading to a higher price level and lower output. Label all axes, curves, and equilibrium points clearly to earn the diagram mark.
Step-by-Step Reasoning
- The extract explicitly states that the main causes of inflation are supply-side: higher energy costs and labour shortages increasing wage costs. Both of these are increases in firms' costs of production, which define cost-push inflation. So the first mark is for correctly identifying cost-push inflation.
- For the diagram mark, you need to show the AD curve (downward sloping) and two SRAS curves: the initial SRAS1 and the new SRAS2 shifted leftward. The initial equilibrium E1 is at the intersection of AD and SRAS1, with price level P1 and real output Y1. The new equilibrium E2 is at the intersection of AD and SRAS2, with higher price level P2 and lower real output Y2. The leftward shift of SRAS shows the reduction in aggregate supply due to higher production costs, which is the mechanism of cost-push inflation.
- It is important to note that the AD curve does not shift here, because the inflation is not driven by increased demand. If you incorrectly shifted AD rightward, you would not earn the diagram mark, as that would illustrate demand-pull inflation.
Key Takeaways
- Cost-push inflation is caused by increases in production costs, which shift SRAS leftward, leading to higher prices and lower output.
- When asked to use a diagram to identify a concept, the diagram must directly illustrate the concept you have identified.
- Always label all axes, curves, and equilibrium points in AD/AS diagrams to earn full marks for the diagram.
Common Mistakes
- Identifying the inflation as demand-pull: this is incorrect, as the extract clearly states the causes are supply-side. Demand-pull inflation would be caused by rising consumer spending, investment, or government spending, which is not the case here.
- Drawing a diagram with a rightward shift in AD: this would illustrate demand-pull inflation, not cost-push, so you would lose the diagram mark.
- Failing to label the diagram: unlabelled axes, curves, or equilibrium points may lose the diagram mark, as the mark scheme requires a "correctly labelled diagram".
Things to Be Careful About
- Ensure the SRAS curve shifts left, not right, to show the reduction in aggregate supply.
- Make sure the AD curve is unchanged, as the inflation is not demand-driven.
- Clearly mark the change in the price level (P1 to P2) to show the inflation outcome.
Consider the extent to which the shortage of supply of labour in the Eurozone may have contributed towards the increasing rate of inflation.
Answer
A shortage of labour supply in the Eurozone is likely to push up wage rates as firms compete for a smaller pool of workers. Higher wages increase firms' costs of production, which shifts the short-run aggregate supply (SRAS) curve to the left, leading to cost-push inflation and a higher price level. However, the extract also notes that rising energy costs from the Russia-Ukraine conflict and pandemic-related supply disruptions are a major driver of higher production costs. The extent to which labour shortages contributed to inflation therefore depends on the relative size of wage increases compared to energy cost increases over the period.
Conclusion: Labour shortages contributed to rising inflation via higher wage costs, but their relative contribution is likely smaller than energy cost increases, so their extent of contribution is limited.
Labour shortages contributed to inflation via higher wage costs, but their relative contribution is limited compared to other supply-side factors such as energy price increases.
Background Concept
Cost-push inflation can be caused by any increase in the costs of production faced by firms, including higher wages, higher raw material prices (such as energy), higher taxes, or lower productivity. Labour shortages can push up wage rates, as firms compete for a limited pool of workers by offering higher pay. Higher wages increase firms' unit labour costs, which are a major component of total production costs, leading to higher prices and cost-push inflation. However, cost-push inflation is often caused by multiple factors simultaneously, so the contribution of any single factor depends on its relative size compared to other cost increases.
Understanding the Question
This 4-mark part asks you to consider the extent to which Eurozone labour shortages contributed to the rising inflation rate. The command word "consider the extent" requires both analysis of how labour shortages cause inflation, and evaluation of how large that contribution is relative to other factors. The mark scheme allocates 2 marks for analysis, 1 mark for evaluation, and 1 mark for a justified conclusion on the extent of contribution.
Approach
First, build the causal chain from labour shortage to inflation: labour shortage -> higher wage rates -> higher production costs -> leftward shift in SRAS -> higher price level (cost-push inflation). Then, evaluate the extent of this contribution by comparing it to other identified causes of inflation in the extract (higher energy prices). Finally, reach a conclusion on how much labour shortages contributed, relative to other factors.
Step-by-Step Reasoning
- Analysis point 1: The extract states that Eurozone unemployment has fallen to a record low of 6.8%, indicating a shortage of labour supply. When labour is scarce, firms must compete for workers by offering higher wages, so wage rates rise. (1 mark)
- Analysis point 2: Higher wages increase firms' costs of production (unit labour costs). When production costs rise, firms will raise prices to maintain profit margins, which is cost-push inflation. In the AD/AS model, this is shown by a leftward shift of the SRAS curve, leading to a higher price level. (1 mark)
- Analysis point 3: The extract also identifies rising energy prices from the Russia-Ukraine conflict and pandemic supply disruptions as a major cause of inflation. Higher energy costs also increase firms' production costs (for transport, heating, manufacturing, etc.), adding to cost-push inflation. (1 mark)
- Evaluation point: The extent to which labour shortages contributed to inflation depends on the relative size of wage increases compared to energy cost increases over the period. If energy costs rose much more than wages, then labour shortages were a minor contributor; if wage rises were similar in magnitude to energy cost rises, then labour shortages were a major contributor. (1 mark)
- Conclusion: Labour shortages did contribute to rising inflation via higher wage costs, but their relative contribution is likely smaller than energy cost increases, given that the extract highlights energy prices as the main driver of the record 7.5% inflation rate.
Key Takeaways
- Labour shortages are a supply-side factor that can cause cost-push inflation via higher wage costs.
- When asked to "consider the extent" of a contribution, you must compare the factor in question to other relevant factors to judge its relative importance.
- A justified conclusion must directly answer the "extent" part of the question, not just restate the analysis.
Common Mistakes
- Only explaining how labour shortages cause inflation, with no evaluation of extent: this would lose the evaluation and conclusion marks, capping the answer at 2 marks.
- Claiming labour shortages were the main cause without justification: the extract explicitly states energy costs are the main cause, so you must use the extract's evidence to support your evaluation.
- Confusing cost-push inflation with demand-pull inflation: labour shortages cause cost-push, not demand-pull, as they affect production costs rather than aggregate demand.
Things to Be Careful About
- Use the extract's evidence to support your evaluation: the extract highlights energy costs as the main cause, so your conclusion should reflect that.
- Make sure your evaluation explicitly addresses the "extent" of the contribution, not just whether there was a contribution.
- Link the causal chain clearly: labour shortage -> higher wages -> higher costs -> SRAS left shift -> higher prices.
Using the concept of price elasticity of demand, assess the relative impact on poorer households, including those on fixed incomes, of rising prices of food and energy.
Answer
Price elasticity of demand (PED) measures the responsiveness of the quantity demanded of a good to a change in its price, calculated as the percentage change in quantity demanded divided by the percentage change in price. Food and energy are essential necessity goods, so their demand is price inelastic (PED value between 0 and -1). This means that when the prices of these goods rise, the percentage fall in quantity demanded is smaller than the percentage rise in price, so households spend more on them overall.
Poorer households, including those on fixed incomes, spend a larger proportion of their income on food and energy than higher-income households. Because their incomes do not rise in line with inflation and they have limited ability to negotiate higher wages, they are unable to offset the higher prices, so they suffer a larger negative impact on their living standards. Higher-income households, by contrast, can more easily absorb the price rises or negotiate wage increases to match inflation, so their impact is smaller.
The extent of the impact on poorer households therefore depends on the degree of government support available to offset the price rises, and the proportion of their income that is spent on food and energy.
Conclusion: Poorer households and those on fixed incomes are disproportionately affected by rising food and energy prices because of the price inelastic demand for these essential goods and their limited ability to increase income.
Poorer households and those on fixed incomes are disproportionately affected by rising food and energy prices compared to higher-income households, due to the price inelastic demand for these essential goods and their limited ability to increase income to offset higher costs.
Background Concept
Price elasticity of demand (PED) measures the responsiveness of the quantity demanded of a good to a change in its price, calculated as:
PED = (% change in quantity demanded) / (% change in price)
PED is negative for most goods (due to the inverse relationship between price and quantity demanded), and its absolute value determines elasticity: if |PED| < 1, demand is price inelastic; if |PED| > 1, demand is price elastic. Necessity goods (such as food and energy) tend to have price inelastic demand, because consumers cannot easily reduce their consumption of these goods when prices rise. The impact of a price rise on a household's welfare depends on two factors: the price elasticity of demand for the goods they buy, and the proportion of their income they spend on those goods.
Understanding the Question
This 6-mark part asks you to use PED to assess the relative impact of rising food and energy prices on poorer households (including those on fixed incomes) compared to other households. The command word "assess" requires you to analyse the impact using PED theory, evaluate the relative impact on different household groups, and reach a justified conclusion. The mark scheme allocates up to 4 marks for analysis, up to 1 mark for evaluation, and 1 reserved mark for a justified conclusion.
Approach
First, define PED and explain that food and energy are price inelastic. Then, explain why poorer households are more affected: they spend a larger share of their income on these inelastic goods, and have limited ability to increase their income to offset price rises. Next, evaluate the relative impact by comparing poorer households to higher-income households, considering factors such as the proportion of income spent on food/energy and ability to negotiate higher wages. Finally, reach a conclusion on the relative impact.
Step-by-Step Reasoning
- Analysis point 1 (PED definition): PED measures the percentage change in quantity demanded of a good in response to a 1% change in its price. For price inelastic goods, the percentage fall in quantity demanded is smaller than the percentage rise in price, so total expenditure on the good rises when price increases. (1 mark)
- Analysis point 2 (PED of food and energy): Food and energy are essential necessity goods, so consumers cannot easily reduce their consumption when prices rise. Their demand is therefore price inelastic (|PED| < 1). (1 mark)
- Analysis point 3 (impact on poorer households): Poorer households, including those on fixed incomes (such as pensions), spend a much larger proportion of their income on food and energy than higher-income households. Because their incomes do not automatically rise with inflation, and they have little bargaining power to negotiate higher wages, they cannot offset the higher prices. As a result, the rise in expenditure on these inelastic goods takes up a larger share of their limited income, reducing their living standards significantly. (1 mark)
- Analysis point 4 (comparison to higher-income households): Higher-income households spend a smaller proportion of their income on food and energy, and are more likely to be able to negotiate wage increases in line with inflation, or to absorb the price rises without a significant fall in living standards. (1 mark, alternative to point 3 if comparing)
- Evaluation point: The extent of the impact on poorer households depends on two key factors: first, the proportion of their income that is spent on food and energy (which varies by country and household composition), and second, the availability of government support (such as energy bill caps or welfare payments) to offset the price rises. If government support is generous, the negative impact on poorer households can be reduced significantly. (1 mark)
- Conclusion: Poorer households and those on fixed incomes are disproportionately affected by rising food and energy prices compared to higher-income households, because of the price inelastic demand for these essential goods and their limited ability to increase their income to offset the higher costs.
Key Takeaways
- PED determines how much quantity demanded falls when price rises, and whether total expenditure on the good rises or falls.
- Necessity goods have price inelastic demand, so price rises lead to higher total expenditure on them.
- The impact of price rises on households depends on both the elasticity of the goods they buy and the share of their income spent on those goods.
- When assessing relative impact, you must compare the groups in question, using relevant criteria such as income share and ability to adjust to price changes.
Common Mistakes
- Defining PED incorrectly, or forgetting to note that it is negative for most goods: this would lose the first analysis mark.
- Only explaining the impact on poorer households, with no comparison to other households: the question asks for "relative impact", so you must compare to higher-income households to earn full evaluation marks.
- Ending with a summary of both sides instead of a justified conclusion: the final mark is reserved for a conclusion that states which group is more affected and why, not a restatement of the analysis.
- Forgetting to link PED to the impact: you must explain that because food and energy are price inelastic, quantity demanded falls very little, so households have to spend more on them, which is the source of the negative impact.
Things to Be Careful About
- Always state the sign of PED (negative for normal goods) and the elasticity range (|PED| < 1 for inelastic demand) when defining it.
- Use the extract's context: the extract notes that poorer households and those on fixed incomes are more affected, so your answer should align with this context.
- Ensure your conclusion directly answers the "relative impact" part of the question, stating which group is more affected and the reason why.
Assess the advantages and disadvantages of the ECB ‘substantially’ increasing the interest rate to control rising inflation.
Answer
Advantages of a substantial interest rate increase: Higher interest rates reduce consumer spending (by raising the cost of borrowing and encouraging saving) and reduce business investment, shifting the aggregate demand (AD) curve leftward. This reduces the price level, helping to control inflation. Interest rate changes are also a relatively quick and straightforward policy for the ECB to implement, with effects felt faster than supply-side policies. (2 marks)
Disadvantages of a substantial interest rate increase: The current inflation in the Eurozone is primarily cost-push, driven by supply-side factors such as higher energy costs and labour shortages. Reducing AD will have little effect on these supply-driven price rises, and may even worsen the situation by increasing firms' borrowing costs, further pushing up production costs and shifting SRAS leftward. A substantial interest rate rise would also reduce economic output and increase unemployment, which is particularly harmful given that growth is already forecast to fall to 0% in 2022, risking a deeper recession or stagflation. (2 marks)
Evaluation: The disadvantages of a substantial interest rate rise outweigh the advantages in this context. Because the inflation is supply-side, demand-reducing monetary policy is ineffective at tackling its root cause, and instead risks deepening the economic slowdown and raising unemployment. A more appropriate policy mix would include targeted supply-side measures to address energy supply and labour shortages, and targeted fiscal support for households worst affected by higher prices. (1 mark)
Conclusion: The ECB should not substantially increase interest rates, as this policy would be ineffective against supply-push inflation and would risk worsening the slowdown in growth and increasing unemployment. (1 mark)
The ECB should not substantially increase interest rates, as this policy is ineffective against supply-push inflation and would risk worsening the slowdown in economic growth and increasing unemployment, leading to stagflation.
Background Concept
Contractionary monetary policy, such as increasing interest rates, is used by central banks to reduce inflation by lowering aggregate demand. Higher interest rates increase the cost of borrowing for consumers and businesses, and increase the reward for saving, so consumer spending and business investment fall. This shifts the AD curve leftward, reducing the price level and real output. However, the effectiveness of monetary policy depends on the cause of inflation: it is very effective against demand-pull inflation (caused by excessive AD), but much less effective against cost-push inflation (caused by supply-side factors that shift SRAS leftward). In a situation of stagflation (high inflation and low/negative growth), using contractionary monetary policy risks worsening the slowdown in growth and increasing unemployment, without effectively reducing inflation.
Understanding the Question
This 6-mark part asks you to assess the advantages and disadvantages of the ECB substantially increasing interest rates to control rising inflation. The command word "assess" requires a two-sided analysis, evaluation of the relative merits of the policy, and a justified conclusion. The mark scheme allocates 2 marks for advantages analysis, 2 marks for disadvantages analysis, and 2 marks for evaluation (including a reserved 1 mark for a justified conclusion). The context is critical here: the inflation is supply-side (cost-push), and growth is already forecast to fall to 0% in 2022, so the ECB faces a stagflation risk.
Approach
First, analyse the advantages of a substantial interest rate rise: how it reduces AD to lower inflation, and its speed of implementation. Then, analyse the disadvantages: its ineffectiveness against supply-push inflation, and its negative effects on output and employment in a context of already slowing growth. Next, evaluate the relative weight of advantages and disadvantages, considering the supply-side nature of inflation and the risk of stagflation. Finally, reach a justified conclusion on whether the policy is advisable.
Step-by-Step Reasoning
- Advantage 1: A substantial increase in interest rates reduces consumer spending (by raising mortgage, loan, and credit card costs, and encouraging saving) and reduces business investment (by raising the cost of borrowing for capital projects). This shifts the AD curve leftward, reducing the price level and bringing inflation down towards the ECB's 2% target. (1 mark)
- Advantage 2: Interest rate changes are a relatively quick and easy monetary policy tool for the ECB to implement, with effects on spending and inflation felt within 6-18 months, faster than most supply-side policies. (1 mark)
- Disadvantage 1: The current inflation in the Eurozone is primarily cost-push, driven by supply-side factors (higher energy costs, labour shortages) that shift SRAS leftward. Reducing AD will have little effect on these supply-driven price rises, as it does not address the root cause of higher production costs. (1 mark)
- Disadvantage 2: A substantial interest rate rise would reduce real output and increase unemployment, which is particularly harmful given that economic growth is already forecast to fall to 0% in 2022. This could push the Eurozone into a recession or stagflation (high inflation plus low/negative growth), worsening living standards and increasing government spending on welfare. Higher interest rates also increase firms' borrowing costs, which could further push up production costs and shift SRAS leftward, making inflation worse. (1 mark)
- Evaluation: The disadvantages of a substantial interest rate rise outweigh the advantages in this specific context. Because the inflation is supply-side, demand-reducing monetary policy is ineffective at tackling its root cause, and instead risks deepening the economic slowdown and raising unemployment. A more effective policy mix would include targeted supply-side measures to address energy supply and labour shortages, and targeted fiscal support for households most affected by higher prices. The ECB's decision to keep interest rates at 0% until mid-2022 reflects this logic, as it prioritises supporting growth while supply-side pressures ease. (1 mark)
- Conclusion: The ECB should not substantially increase interest rates, as this policy is ineffective against supply-push inflation and would risk worsening the slowdown in growth and increasing unemployment.
Key Takeaways
- Contractionary monetary policy (higher interest rates) works by reducing aggregate demand, so it is effective against demand-pull inflation but not cost-push inflation.
- In a stagflation scenario (high inflation + low growth), using demand-reducing policy creates a policy dilemma: reducing inflation worsens growth, while supporting growth keeps inflation high.
- When assessing a policy, you must always consider the specific context (the cause of inflation, the state of the economy) to judge its effectiveness.
- A justified conclusion must directly answer the question, stating whether the advantages outweigh the disadvantages (or vice versa) and why, based on the analysis.
Common Mistakes
- Only discussing advantages or only discussing disadvantages: the mark scheme explicitly states that no evaluation marks can be awarded if only one side is considered, as a one-sided response cannot gain evaluation marks.
- Ignoring the context of supply-side inflation: if you treat the inflation as demand-pull, your analysis of the policy's effects will be incorrect, as higher interest rates would be effective against demand-pull inflation but not cost-push.
- Ending with a summary of advantages and disadvantages instead of a justified conclusion: the final mark is reserved for a conclusion that states which side is stronger and why, not a restatement of the points.
- Forgetting that the question specifies a "substantial" interest rate rise: a small rise may have different effects, so you must address the scale of the policy change as specified in the question.
Things to Be Careful About
- Always link the policy to the AD/AS model: explain how higher interest rates shift AD leftward, leading to lower prices and lower output.
- Use the extract's context: the inflation is supply-side, growth is slowing, and there is a risk of stagflation, so your evaluation must address these specific conditions.
- Ensure your conclusion is justified: do not just say "it depends" — state clearly whether the policy is advisable, and under what conditions, based on your analysis.
Explain how the Gini coefficient is used to measure income inequality and consider the relative strength of two economic reasons suggested for such inequality in a low-income country.
Answer
The Gini coefficient is a numerical measure of income inequality. It ranges from 0 (perfect equality, where everyone has the same income) to 1 (perfect inequality, where one person earns all income). The closer the coefficient is to 0, the more equal the income distribution; the closer to 1, the more unequal.
Two economic reasons for income inequality in a low-income country are:
-
Lack of employment opportunities: In low-income countries, the industrial and service sectors are often underdeveloped, so formal employment is scarce. Many people rely on subsistence agriculture or informal work with low and unstable incomes. This creates a large gap between the few with formal jobs and the majority without, driving high inequality.
-
Poor access to education and health: Low government budgets limit investment in education and healthcare. Those who can afford private education and healthcare can secure higher-skilled, higher-paid jobs, while others remain in low-skilled, low-paid work. This perpetuates inequality across generations.
Evaluation: Both reasons are significant, but lack of employment opportunities is likely the stronger reason in a low-income country. Without sufficient jobs, even education cannot translate into income, and the informal sector offers little upward mobility. Poor education worsens the problem over time, but the immediate driver of inequality is the scarcity of formal employment. Therefore, addressing employment creation is more fundamental.
Lack of employment opportunities is likely the stronger reason for income inequality in a low-income country.
Background Concept
Income inequality refers to the uneven distribution of income among individuals or households in an economy. The Gini coefficient is a standard measure of this inequality. It is derived from the Lorenz curve, which plots the cumulative share of income against the cumulative share of the population. The coefficient is the ratio of the area between the Lorenz curve and the line of perfect equality to the total area under the line of perfect equality. A value of 0 means everyone has the same income; a value of 1 means one person has all the income. In practice, values range from about 0.25 (e.g., some Nordic countries) to over 0.6 (e.g., some African countries).
Understanding the Question
The question asks you to first explain how the Gini coefficient measures income inequality (AO1), then explain two economic reasons for inequality specifically in a low-income country (AO2), and finally consider which of those two reasons is relatively stronger (AO3). The command word "explain" for the Gini coefficient requires a clear definition and interpretation. The command "consider" for the reasons implies a short evaluation. The mark scheme allocates up to 3 marks for AO1, 3 for AO2 (with a maximum of 2 if only one reason is given), and 2 for AO3 (with 1 mark reserved for a balanced judgement).
Approach
Start by defining the Gini coefficient, its range, and what the values mean. Then select two distinct economic reasons for inequality that are particularly relevant to low-income countries. For each reason, explain the causal mechanism and why it is more pronounced in a low-income context. Finally, compare the two reasons: which is more fundamental or has a greater impact? Justify your choice with reasoning, not just assertion.
Step-by-Step Reasoning
Step 1: Define the Gini coefficient.
- It is a number between 0 and 1.
- 0 = perfect equality (everyone has same income).
- 1 = perfect inequality (one person has all income).
- The nearer to 0, the more equal; nearer to 1, the more unequal.
- It is calculated from the Lorenz curve.
Step 2: Choose two reasons for inequality in a low-income country.
- Reason 1: Lack of employment opportunities. In low-income countries, the economy is often dominated by agriculture and informal activities. Formal sector jobs are limited due to low investment, weak industrial base, and poor infrastructure. This means a large portion of the population has low or no income, while a small elite may have high incomes from government, natural resources, or foreign investment. The gap is large.
- Reason 2: Poor access to education and health. Low government revenue means underfunded public services. Those who can afford private education and healthcare can acquire skills and stay healthy, earning higher incomes. Others are trapped in low-productivity work. This creates a cycle of inequality.
Step 3: Evaluate which reason is stronger.
- Consider that without employment, even education cannot generate income. In many low-income countries, educated individuals also face unemployment or underemployment. So lack of jobs is a more immediate constraint.
- However, poor education and health perpetuate inequality across generations, making it a deeper structural issue.
- A balanced judgement: In the short run, lack of employment opportunities is the stronger reason because it directly determines current income. In the long run, poor education and health may be more fundamental, but the question asks for the relative strength in a low-income country, where the immediate crisis is often joblessness. Therefore, lack of employment opportunities is likely the stronger reason.
Key Takeaways
- The Gini coefficient is a key tool for measuring inequality.
- Inequality in low-income countries is driven by structural factors like limited formal employment and poor human capital investment.
- Evaluation requires comparing reasons on a criterion (e.g., immediacy, depth, causality) and reaching a justified conclusion.
Common Mistakes
- Only giving one reason (max 2 marks for AO2).
- Not linking reasons to the low-income country context (e.g., discussing reasons that apply to all countries without specific relevance).
- Failing to provide a balanced judgement (just stating both are important without choosing one).
- Confusing the Gini coefficient with other measures (e.g., poverty rate).
Things to Be Careful About
- Ensure the definition of the Gini coefficient includes both extremes (0 and 1) and their interpretation.
- Use economic terminology: "formal sector", "informal sector", "human capital", "productivity".
- The evaluation must be a short paragraph that explicitly compares the two reasons and states which is stronger and why.
Assess the extent to which government policies to redistribute income and wealth are likely to be successful.
Introduction
Income and wealth inequality are persistent issues that governments attempt to address through redistribution policies. This essay assesses the extent to which such policies are likely to be successful, focusing on progressive taxation and minimum wage legislation.
Progressive Income Tax
A progressive income tax takes a higher percentage of income from higher earners. This directly reduces post-tax income inequality by transferring purchasing power from the rich to the government, which can then fund public services or transfers. However, it may reduce incentives to work and invest, potentially lowering economic output. High earners may engage in tax avoidance or move to lower-tax jurisdictions, limiting revenue. In low-income countries, weak tax administration and a large informal sector further reduce effectiveness. Thus, while progressive taxation can reduce inequality, its success is constrained by behavioural responses and administrative capacity.
Minimum Wage
A minimum wage sets a floor on wages, raising the income of low-paid workers. This can reduce poverty and narrow the gap between low and high earners. However, if set above the market-clearing wage, it may cause unemployment, especially among the least skilled, as firms reduce labour demand. This could worsen inequality if the newly unemployed lose income. Moreover, many workers in the informal sector are not covered. Therefore, the success of a minimum wage depends on its level, enforcement, and labour market conditions.
Evaluation
Both policies have merits and drawbacks. Progressive taxation is more direct in redistributing income but faces evasion and disincentive issues. Minimum wage helps those in work but may harm employment. The success of redistribution policies also depends on complementary measures: effective tax collection, strong enforcement, investment in education and infrastructure to boost productivity, and economic growth that creates jobs. In low-income countries, institutional weaknesses limit success. Furthermore, redistribution policies may address income inequality but have less impact on wealth inequality, which is often more concentrated.
Conclusion
Government policies can reduce income inequality to a moderate extent, but their success is limited by unintended consequences, administrative constraints, and the underlying structure of the economy. A combination of policies, tailored to the specific context, is more likely to be successful than any single policy. However, without broader economic development and institutional strengthening, the extent of success will remain partial.
Government policies to redistribute income and wealth are partially successful, but their effectiveness is limited by behavioural responses, administrative capacity, and structural economic factors; a comprehensive approach is needed for greater success.
Background Concept
Income redistribution refers to policies that transfer income from higher-income groups to lower-income groups to reduce inequality. Wealth redistribution targets accumulated assets. Common policies include progressive taxation (taxing higher incomes at higher rates), transfer payments (welfare benefits, pensions), minimum wage laws, and state provision of essential services (education, healthcare). The success of these policies is measured by their ability to reduce inequality without causing significant economic inefficiencies or unintended negative consequences.
Understanding the Question
The question asks you to "assess the extent to which government policies to redistribute income and wealth are likely to be successful." This is an evaluative command requiring a balanced discussion of both the potential successes and limitations of such policies. The mark scheme uses level descriptors: for AO1+AO2 (8 marks), a top-level response requires detailed knowledge, developed analysis, and a well-organised argument. For AO3 (4 marks), a top-level response requires a justified conclusion and developed evaluative comments. The indicative content lists several policies; you should discuss at least two to avoid being capped at Level 2.
Approach
Select two or three key redistribution policies. For each, explain how it works (AO1) and analyse its advantages and disadvantages (AO2). Then evaluate the overall success by weighing the strengths against the weaknesses, considering context (e.g., low-income vs. high-income country), and addressing the extent to which success is achieved. Conclude with a justified judgement that answers the question directly.
Step-by-Step Reasoning
Step 1: Introduce the topic and state the policies to be discussed.
Step 2: Analyse progressive income tax.
- How it works: higher marginal tax rates for higher income brackets.
- Success: reduces post-tax inequality, funds public services.
- Limitations: may reduce work incentives (Laffer curve effect), tax avoidance/evasion, capital flight. In low-income countries, tax base is narrow and collection is weak.
Step 3: Analyse minimum wage.
- How it works: legal floor on wages.
- Success: raises incomes of low-paid workers, reduces poverty.
- Limitations: potential unemployment (if above equilibrium), not covering informal sector, may increase prices. The net effect on inequality depends on labour demand elasticity.
Step 4: Evaluate overall success.
- Consider that both policies have trade-offs. Success is not guaranteed; it depends on design, enforcement, and complementary policies.
- For example, a minimum wage combined with training and job creation can be more successful.
- Also consider wealth redistribution: policies like inheritance tax or capital gains tax may be more effective for wealth inequality but face political opposition.
- The extent of success is partial: inequality can be reduced but not eliminated, and unintended consequences may offset gains.
Step 5: Conclude with a justified judgement.
- State that policies can be moderately successful, but their effectiveness is limited by economic and institutional factors. A multi-pronged approach is necessary for greater success.
Key Takeaways
- Redistribution policies have both intended and unintended effects.
- Evaluation requires considering trade-offs and context.
- A justified conclusion must address the "extent" and give a clear verdict.
Common Mistakes
- Discussing only one policy (capped at Level 2).
- Providing a one-sided argument (no marks for evaluation).
- Failing to reach a conclusion or giving a vague conclusion.
- Not using economic theory (e.g., supply and demand for labour, Laffer curve).
- Ignoring the distinction between income and wealth redistribution.
Things to Be Careful About
- Use specific economic terminology: "marginal tax rate", "labour demand elasticity", "informal sector", "tax base".
- Ensure the conclusion is justified by the preceding analysis, not just a summary.
- Address the "extent" explicitly: e.g., "to a moderate extent", "partially successful".
- Consider both short-run and long-run effects.
With the help of an example of each, explain the difference between a merit good and a demerit good and consider whether a subsidy given to a merit good will always be effective in increasing its consumption.
Answer
A merit good is a good that is under‑consumed and under‑provided by the market because consumers have imperfect information about its full benefits – for example, education or health screenings. A demerit good is a good that is over‑consumed because consumers have imperfect information about its long‑term harm – for example, cigarettes or alcohol.
A subsidy lowers the price of the merit good. This makes it more affordable, so there is a movement along the demand curve and quantity demanded rises. However, if demand for the merit good is price inelastic, the increase in quantity will be proportionally smaller than the price fall. More importantly, if the reason for under‑consumption is information failure – consumers are unaware of the benefits – reducing the price does not address that ignorance and consumption may not increase at all. For example, a subsidy on gym memberships may not raise usage if people do not value the health benefits.
Therefore, a subsidy alone will not always be effective. It works best when affordability is the main barrier, especially for lower‑income households. Where the core problem is lack of awareness, a subsidy should be combined with information provision. The answer is that a subsidy is not always effective; its success depends on the cause of under‑consumption.
A subsidy alone is not always effective; it works best when affordability, not information failure, is the main barrier.
Background Concept
Merit goods and demerit goods are types of goods where the market fails to allocate resources efficiently because consumers lack perfect information about the benefits or harms. For a merit good, the private benefit is lower than the social benefit – consumers under‑value the good, leading to under‑consumption. For a demerit good, the private benefit is higher than the social benefit – consumers under‑estimate the harm, leading to over‑consumption. Government intervention, such as subsidies for merit goods or taxes for demerit goods, aims to correct these market failures.
Understanding the Question
The question asks you to (i) define and distinguish merit and demerit goods, providing an example of each (AO1), (ii) explain how a subsidy could affect consumption of a merit good (AO2), and (iii) evaluate whether this policy always works – i.e., is it effective in all circumstances? (AO3). The word “consider” signals the need for a two‑sided evaluation and a justified conclusion.
Approach
Start by giving clear definitions and examples. Then analyse the mechanism: a subsidy shifts the supply curve down, lowering price and raising quantity demanded. Then introduce limitations: price inelastic demand dampens the quantity response, and information failure is not addressed by a subsidy. Finally, weigh these limitations against the possibility that affordability is the real barrier, and conclude that the policy is not always effective but can be under certain conditions.
Step‑by‑Step Reasoning
-
Definitions (AO1): A merit good is under‑consumed because consumers underestimate its future benefits (e.g., education). A demerit good is over‑consumed because consumers underestimate its future costs (e.g., cigarettes). Give one example of each.
-
How a subsidy might increase consumption (AO2): A subsidy reduces the producer’s cost, shifting the supply curve rightwards. The market price falls, and quantity demanded rises along the demand curve. This works through the price mechanism – cheaper price encourages more purchases.
-
Limitations (AO2):
- If demand is price inelastic (PED < 1), a given percentage fall in price leads to a smaller percentage increase in quantity.
- If the root cause is information failure, price reduction does not change awareness – consumers still do not recognise the benefit and may not increase consumption even at a lower price.
-
Evaluation (AO3): The subsidy may be highly effective for low‑income households where the barrier is purely affordability – they do understand the value but cannot afford it. In such cases, the subsidy directly increases consumption and improves welfare. However, where ignorance is the barrier, the subsidy alone fails. Therefore, the most effective approach combines a subsidy with public information campaigns. Conclusion: a subsidy is not always effective; its success depends on the specific cause of under‑consumption.
Key Takeaways
- Distinguish merit/demerit goods by the nature of information failure.
- Understand that a subsidy changes price, but consumption response depends on PED and the underlying cause of market failure.
- Evaluation must be two‑sided and reach a conclusion that answers “always” – show that it is not always effective.
Common Mistakes
- Confusing merit and demerit goods – e.g., saying a demerit good is over‑consumed because it is “bad” without linking to information failure.
- Providing only one example or none.
- Describing the subsidy only as price reduction without discussing elasticity or information failure.
- Giving a one‑sided evaluation (only saying it works or it doesn’t) without a conclusion.
Things to Be Careful About
- Use the correct economic terminology: “information failure”, “price elasticity of demand”, “under‑consumption”.
- Ensure the conclusion directly responds to the word “always” – it is an absolute claim, so you must show it is not always true.
- Keep the answer concise – this is only 8 marks, so do not over‑develop any single point at the expense of others.
Assess whether fixing a minimum price is likely to be the best policy to reduce the consumption of a demerit good.
Introduction
A minimum price is a legally imposed price floor set above the free‑market equilibrium. A demerit good, such as cigarettes or alcohol, is over‑consumed because consumers have imperfect information about its long‑term harm. The question is whether a minimum price is the best policy to reduce its consumption – i.e., more effective or efficient than alternatives such as indirect taxes, information campaigns, or bans.
Analysis of a Minimum Price Policy
Setting a minimum price above the equilibrium raises the price paid by consumers. This reduces the quantity demanded along the demand curve.
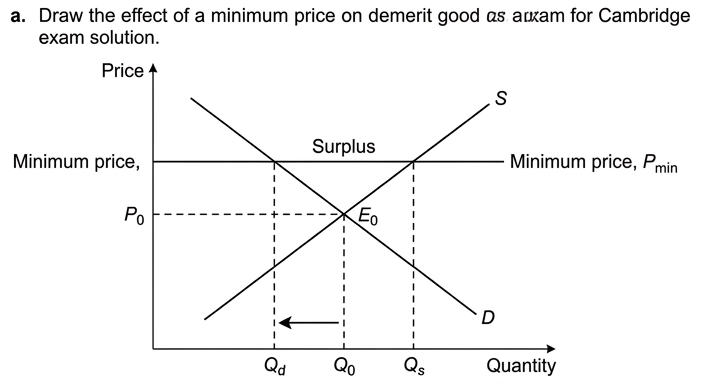
As the diagram shows, the free‑market equilibrium is at P0, Q0. A minimum price at Pmin forces price up and quantity demanded falls to Qd. The effectiveness depends on the price elasticity of demand. For many demerit goods (e.g., cigarettes) demand is relatively inelastic in the short run, so the reduction in quantity may be modest. Over time, as habits change and substitutes appear, demand may become more elastic, increasing the effectiveness.
A minimum price has the advantage of being relatively simple to enforce if the good is legally sold through licensed outlets. It can also generate government revenue if licenses are auctioned. However, it does not address the underlying information failure – consumers may still be unaware of the harm and resent the higher price, potentially turning to informal/black markets. If enforcement is weak, consumption may not fall significantly.
Alternative Policies
Indirect taxes: A specific tax increases the price similarly to a minimum price, but the government collects revenue that can be used to fund education or health campaigns. Taxation can be more flexible (e.g., adjusted easily) and is often more acceptable politically. However, taxes also face inelastic demand and black market issues.
Education and information provision: This directly tackles the root cause – information failure. Campaigns can reduce consumption over the long term by changing preferences. However, they are slow, expensive, and their impact is difficult to measure. They may be ineffective for addictive goods.
Bans and quantity restrictions: An outright ban eliminates legal consumption but can create a large illegal market with no quality control and high enforcement costs.
Evaluation
No single policy is universally “best”. The choice depends on the specific demerit good, the price elasticity of demand, the strength of enforcement institutions, and the political and social context. For example, minimum alcohol pricing in Scotland has been effective in reducing consumption without creating a large black market, because alcohol is not easily smuggled. For cigarettes, high taxes have been very effective in many countries, combined with smoking bans and health warnings.
A minimum price is likely to be more effective when demand is not highly inelastic and when the good is legally supplied through a regulated market. It is less appropriate for goods with strong addiction (where demand is very inelastic) or where black markets are easy to establish. Indirect taxes may be preferable because they raise revenue and can be fine‑tuned, and they can be combined with education to address information failure.
Conclusion
Fixing a minimum price can reduce consumption of a demerit good, but it is not always the best policy. The most effective approach is usually a combination of policies: a tax to raise price and revenue, and education to address information failure. A minimum price should be used where it can be enforced and where the good is price‑sensitive. Therefore, while a minimum price can be a useful tool, better outcomes are often achieved through a mix of interventions tailored to the specific good.
A minimum price can reduce consumption but is not always the best policy; the best approach is usually a combination of policies tailored to the specific demerit good.
Background Concept
A demerit good is over‑consumed because consumers have imperfect information about its true social costs. The market equilibrium quantity (Qm) is greater than the socially efficient quantity (Q*). Government intervention aims to reduce consumption towards Q*. Policy tools include price‑based measures (minimum prices, taxes), information‑based measures (education, advertising), and quantity restrictions (bans, quotas). Each tool has different strengths and weaknesses depending on the nature of the good and the market.
Understanding the Question
The question asks you to “assess whether fixing a minimum price is likely to be the best policy to reduce the consumption of a demerit good.” This is a comparative evaluation: you must consider minimum price alongside at least one alternative policy, weigh their advantages and disadvantages, and reach a justified conclusion. The word “best” implies a judgement on criteria such as effectiveness, cost, ease of implementation, and unintended consequences. A one‑sided answer cannot score any evaluation marks (AO3).
Approach
Start by defining a minimum price and explaining how it works for a demerit good, using a diagram. Then discuss its limitations (inelastic demand, black markets, information failure not addressed). Next, introduce one or two alternative policies (e.g., indirect tax, education) and analyse them. Finally, evaluate which policy is “best” by comparing them on chosen criteria (e.g., effectiveness in reducing consumption, revenue generation, acceptability, long‑run impact) and draw a conclusion that answers the question directly.
Step‑by‑Step Reasoning
-
Diagram: Draw a standard demand and supply diagram. Label axes Price and Quantity. Show upward‑sloping supply S and downward‑sloping demand D. Mark the free‑market equilibrium at P0, Q0. Then draw a horizontal line at a higher price Pmin (the minimum price). The new quantity demanded is Qd (where Pmin hits the demand curve); the quantity supplied is Qs (where Pmin hits the supply curve), creating a surplus of Qs – Qd. The actual consumption falls from Q0 to Qd. Explain that this reduction is desired for a demerit good.
-
Effectiveness depends on elasticity: If demand is price inelastic (e.g., addictive goods), the fall in quantity is proportionally small. Over time, elasticity may rise as consumers adapt.
-
Limitations: The minimum price does not solve information failure – consumers may still not realise the harm, so they resent the price rise and may seek illegal sources. Black markets undermine the policy and create other problems (lower quality, crime). Also, the minimum price may be regressive, hitting lower‑income consumers harder.
-
Alternative – Indirect Tax: A specific tax per unit shifts the supply curve leftwards (increases cost). Price rises, consumption falls, but the government collects tax revenue. This revenue can be used to fund health education or compensate affected groups. Tax is flexible (can be adjusted frequently) and can be set high enough to achieve the desired reduction. However, it also faces inelastic demand and black market issues. Tax evasion (e.g., smuggling) can reduce effectiveness.
-
Alternative – Education: Information campaigns address the root cause – lack of awareness. They can shift the demand curve leftwards as consumers internalise the harm. This is a long‑run solution that avoids black markets and regressive impacts. But it is slow, costly, and its impact is hard to measure. It may be ineffective for addictive goods where consumers ignore information.
-
Evaluation criteria: Compare policies on:
- Short‑run effectiveness: minimum price and tax can reduce consumption quickly; education takes time.
- Cost to government: minimum price costs little to enforce (if well‑regulated); education is expensive; tax raises revenue (net benefit).
- Side effects: black markets, regressive burden, political unpopularity.
- Long‑run impact: education can change preferences permanently; price‑based policies may lose effectiveness if demand becomes more inelastic over time.
-
Conclusion: No single policy is best for all demerit goods. For goods with inelastic demand, a combination of tax and education works well. A minimum price is best when enforcement is strong and the good is legally supplied through licensed outlets (e.g., alcohol). For highly addictive goods, a ban may be necessary but carries black‑market risks. Therefore, the best policy is context‑dependent; a mix of policies is usually superior.
Key Takeaways
- Understand how a minimum price works in a market and its welfare implications.
- Always compare policies when a question asks “best”.
- Use relevant diagrams to support analysis.
- Evaluation must be two‑sided and end with a justified conclusion that answers the specific question.
Common Mistakes
- Writing a one‑sided answer that only argues for or against minimum price, losing all AO3 marks.
- Failing to include any alternative policy and just discussing minimum price in isolation.
- No diagram or a diagram that is not explained.
- Ending with a summary instead of a judgement (e.g., “both sides have merits”).
- Not using economic terminology consistently.
Things to Be Careful About
- Ensure the diagram is fully labelled (axes, curves, equilibrium points, minimum price line, new quantity).
- Explain the diagram in the text – do not just draw it.
- Be specific about which demerit good you are using as an example – it makes the analysis more concrete.
- The conclusion must state whether minimum price is the best policy, and under what conditions.
- Keep the essay well‑structured with clear paragraphs for analysis, evaluation, and conclusion.
With the help of a diagram, explain what is meant by the circular flow of income in an open economy and consider the extent to which it can explain economic growth in such an economy.
Answer
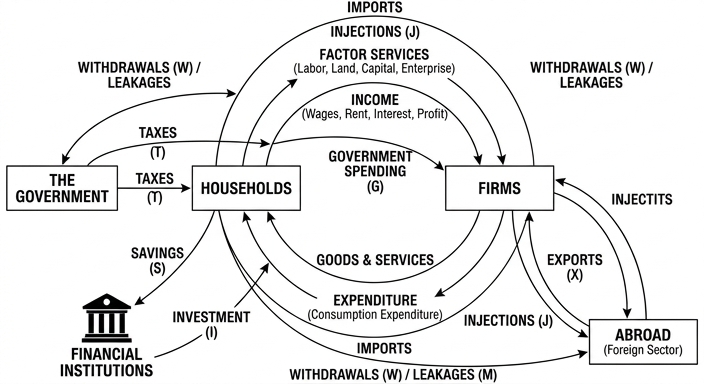
The circular flow of income shows the flow of expenditure and income between households and firms. In an open economy, injections include investment (I), government spending (G), and exports (X). Withdrawals include savings (S), taxes (T), and imports (M). When injections exceed withdrawals (J > W), national income rises, leading to economic growth. When withdrawals exceed injections (W > J), national income falls, leading to a contraction.
However, the circular flow model only explains growth in terms of aggregate demand. It does not account for increases in aggregate supply, which are necessary for long-run economic growth. Therefore, while the model can explain short-run fluctuations in output driven by changes in AD, it is limited in explaining sustained long-run economic growth, which requires growth in productive capacity. Thus, the circular flow model can explain economic growth only to a limited extent, primarily in the short run.
The circular flow model can explain short-run economic growth through increases in injections relative to withdrawals, but it is limited in explaining long-run growth as it ignores supply-side factors.
Background Concept
The circular flow of income is a model that illustrates the flow of money between different sectors of the economy. In its simplest form, it shows households providing factors of production to firms and receiving income (wages, rent, interest, profit), and firms producing goods and services that households buy with their income. This creates a circular flow of income and expenditure. In an open economy, we add the government, financial, and foreign sectors. Injections are additions to the circular flow that increase national income: investment (I), government spending (G), and exports (X). Withdrawals (leakages) are reductions: savings (S), taxes (T), and imports (M). When injections exceed withdrawals, national income rises; when withdrawals exceed injections, national income falls. Economic growth is typically measured as an increase in real GDP, which can be caused by increases in aggregate demand or aggregate supply. The circular flow model focuses on demand-side changes.
Understanding the Question
The question asks you to first explain the circular flow of income in an open economy with the help of a diagram. This is the AO1 and AO2 part: you need to draw and explain the diagram, showing the flows and the concepts of injections and withdrawals. Then you must "consider the extent to which it can explain economic growth". This is the AO3 evaluation part: you need to assess how useful the circular flow model is in explaining economic growth. The command word "consider the extent" requires a judgement: to what extent does the model explain growth? You should identify that the model can explain short-run growth driven by changes in aggregate demand (when injections > withdrawals), but it cannot explain long-run growth which requires increases in aggregate supply. So the extent is limited.
Approach
First, draw a clear circular flow diagram for an open economy, showing households, firms, government, financial sector, and foreign sector. Label the flows: factor incomes from firms to households, expenditure from households to firms, and the injections and withdrawals. Explain that the circular flow shows how national income is determined by the balance between injections and withdrawals. Then, for the evaluation, explain that the model can explain growth when injections exceed withdrawals, leading to an increase in national income. However, this growth is demand-driven and may be inflationary if the economy is at full capacity. The model does not account for supply-side factors such as improvements in productivity or technology, which are necessary for sustained long-run economic growth. Therefore, the model is limited in explaining long-run growth. Conclude with a justified judgement on the extent.
Step-by-Step Reasoning
- Draw the diagram: Start with households and firms. Show the flow of factor services from households to firms and the flow of income (wages, rent, interest, profit) from firms to households. Then show the flow of expenditure on goods and services from households to firms. Add the government sector: taxes flow from households and firms to government, and government spending flows from government to firms (for goods and services) and to households (transfer payments). Add the financial sector: savings flow from households and firms to financial institutions, and investment flows from financial institutions to firms. Add the foreign sector: exports from firms to abroad bring in income (injection), imports from abroad to households and firms represent spending on foreign goods (withdrawal). Label all injections (I, G, X) and withdrawals (S, T, M).
- Explain the equilibrium condition: National income is in equilibrium when injections = withdrawals. If injections > withdrawals, national income rises; if withdrawals > injections, national income falls.
- Apply to economic growth: Economic growth is an increase in real GDP. In the circular flow model, an increase in injections (e.g., a rise in exports) or a decrease in withdrawals (e.g., a fall in savings) will increase national income. This can explain short-run growth driven by demand.
- Evaluate the limitations: The model assumes that the only way to increase national income is through changes in aggregate demand. It does not consider increases in productive capacity. Long-run economic growth requires an increase in aggregate supply, which comes from factors like technological progress, capital accumulation, and improved labour productivity. The circular flow model cannot explain these supply-side changes. Therefore, the model is useful for understanding short-run fluctuations but not for explaining sustained long-run growth.
- Conclusion: The circular flow model can explain economic growth to a limited extent, primarily in the short run when demand changes. For a full explanation of long-run growth, we need to consider supply-side factors.
Key Takeaways
- The circular flow model shows the interdependence of households, firms, government, financial sector, and foreign sector.
- Injections and withdrawals determine changes in national income.
- The model is useful for understanding demand-side effects on output.
- It is limited in explaining long-run economic growth because it ignores supply-side factors.
- Diagrams must be fully labelled and explained to earn marks.
Common Mistakes
- Drawing a diagram without labels or with missing sectors (e.g., omitting government or foreign sector).
- Confusing injections and withdrawals (e.g., thinking imports are an injection).
- Only describing the diagram without explaining how it relates to economic growth.
- Providing a one-sided evaluation (e.g., only saying the model can explain growth without mentioning its limitations).
- Not reaching a justified conclusion.
Things to Be Careful About
- Ensure the diagram is clearly drawn and all flows are labelled.
- In the evaluation, explicitly state the extent (e.g., "to a limited extent" or "only in the short run").
- Use economic terminology: injections, withdrawals, national income, aggregate demand, aggregate supply.
- The conclusion should be a judgement, not a summary.
Assess whether supply-side policy is the most effective way to achieve long-run economic growth.
Introduction
Long-run economic growth refers to an increase in the economy's productive capacity, shown by a rightward shift of the LRAS curve. Supply-side policy aims to increase LRAS directly, but its effectiveness must be compared with demand-side policies such as fiscal and monetary policy.
The case for supply-side policy
Supply-side policies, such as education and training, infrastructure investment, and deregulation, increase the quantity and quality of factors of production, shifting LRAS to the right. This leads to a higher level of potential output without causing inflation. For example, improved training increases labour productivity, raising output per worker. The diagram below shows the effect: LRAS shifts from LRAS1 to LRAS2, increasing real output from Y1 to Y2 at a stable price level P1.
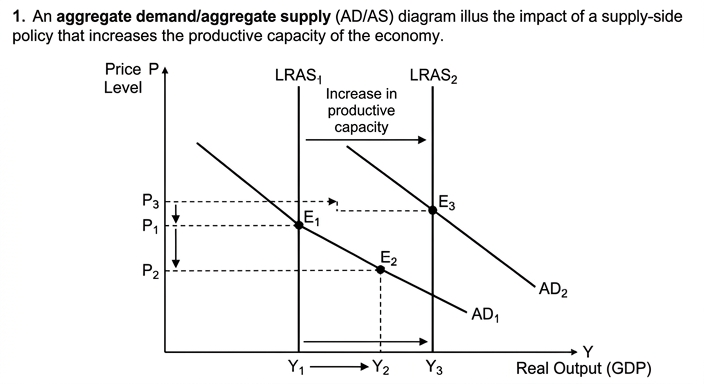
Moreover, supply-side policies can also boost AD indirectly. Higher incomes from increased productivity lead to higher consumer spending, shifting AD to the right. This can reinforce growth without inflationary pressure if AS increases sufficiently.
The case against supply-side policy
However, supply-side policies take time to implement and are costly. Their effects on LRAS may only be seen in the long run. In the short run, they may not stimulate AD enough to avoid recessions. Alternative policies, such as expansionary fiscal policy (e.g., tax cuts or increased government spending) or monetary policy (e.g., lower interest rates), can increase AD more quickly. These demand-side policies can lead to short-run growth, but if AS does not increase, they may cause demand-pull inflation. For example, a reduction in income tax increases disposable income and consumption, shifting AD right, but if the economy is near full capacity, the price level rises with little increase in output.
Evaluation
The effectiveness of supply-side policy depends on the time horizon and the state of the economy. In the long run, supply-side policy is essential for sustainable growth because it expands productive capacity. Demand-side policies alone cannot achieve long-run growth without supply-side improvements. However, in the short run, demand-side policies may be necessary to boost AD and utilise spare capacity. A combination of policies is often most effective: supply-side policies to increase potential output and demand-side policies to ensure that aggregate demand grows in line with aggregate supply.
Conclusion
Supply-side policy is the most effective way to achieve long-run economic growth because it directly increases the economy's productive capacity. However, it is not sufficient on its own; it should be complemented by appropriate demand-side policies to maintain full employment and avoid recessions. Therefore, while supply-side policy is crucial, it is most effective when used in combination with other policies.
Supply-side policy is the most effective way to achieve long-run economic growth as it directly increases productive capacity, but it is most effective when combined with demand-side policies to manage short-run fluctuations.
Background Concept
Long-run economic growth refers to an increase in the economy's potential output, shown by a rightward shift of the long-run aggregate supply (LRAS) curve. It is driven by increases in the quantity and quality of factors of production (land, labour, capital, enterprise) and improvements in technology. Supply-side policy aims to increase the productive capacity of the economy by improving the efficiency and quantity of factors. Examples include education and training, infrastructure investment, deregulation, tax reforms to incentivise work and investment, and policies to promote competition. Demand-side policies, such as fiscal policy (changes in government spending and taxation) and monetary policy (changes in interest rates and money supply), primarily affect aggregate demand (AD). While they can stimulate short-run growth, they may lead to inflation if the economy is at full capacity. For sustainable long-run growth, both AD and AS must increase.
Understanding the Question
The question asks you to "assess whether supply-side policy is the most effective way to achieve long-run economic growth." This is an evaluative question requiring a balanced analysis and a justified conclusion. You need to consider the advantages and disadvantages of supply-side policy compared to alternative policies (fiscal and monetary policy). The command word "assess" means you must weigh up the arguments and reach a judgement. The mark scheme indicates that a one-sided response cannot gain marks for evaluation. Therefore, you must discuss both sides: the strengths of supply-side policy and its limitations, and also consider the strengths and weaknesses of alternative policies. Your conclusion should state whether supply-side policy is the most effective, and under what conditions.
Approach
Start by defining long-run economic growth and supply-side policy. Then present the case for supply-side policy: it directly increases LRAS, leading to non-inflationary growth. Use an AD/AS diagram to illustrate. Also note that supply-side policy can indirectly boost AD through higher incomes. Then present the case against: supply-side policy is costly and takes time to implement; it may not be effective in the short run; alternative policies like fiscal and monetary policy can stimulate AD more quickly and may also have supply-side effects (e.g., tax cuts can increase labour supply). Evaluate the relative effectiveness: supply-side policy is essential for long-run growth, but demand-side policies are needed to manage short-run fluctuations and ensure that AD grows in line with AS. Conclude that supply-side policy is the most effective for long-run growth, but it is most effective when combined with appropriate demand-side policies.
Step-by-Step Reasoning
- Define long-run economic growth: an increase in the economy's potential output, shown by a rightward shift of LRAS.
- Define supply-side policy: policies aimed at increasing the productive capacity of the economy.
- Explain how supply-side policy works: e.g., training increases labour productivity, infrastructure reduces costs, deregulation encourages competition and innovation. These shift LRAS to the right.
- Draw the AD/AS diagram: initial equilibrium at Y1, P1. Supply-side policy shifts LRAS to LRAS2, increasing potential output to Y2. If AD remains constant, the price level falls to P2. If AD also increases (due to higher incomes), the new equilibrium is at a higher output and possibly a slightly higher price level, but less inflationary than if only AD increased.
- Discuss advantages: non-inflationary growth, sustainable, improves competitiveness, can attract foreign investment.
- Discuss disadvantages: time lags, high cost, uncertain effectiveness, may not address short-run demand deficiencies.
- Consider alternative policies: expansionary fiscal policy (e.g., tax cuts, increased government spending) increases AD, leading to short-run growth. However, if AS does not increase, it may cause inflation. Some fiscal policies can also have supply-side effects (e.g., tax cuts on income can increase labour supply). Monetary policy (lower interest rates) stimulates investment and consumption, increasing AD. It can be implemented quickly but may also lead to inflation if the economy is at full capacity.
- Evaluate: For long-run growth, increasing AS is crucial. Supply-side policy directly targets AS, making it more effective in the long run. Demand-side policies are better for short-run stabilisation. Therefore, the most effective approach is a combination: supply-side policies to increase potential output and demand-side policies to ensure that AD grows sufficiently to utilise the increased capacity without causing inflation or recession.
- Conclusion: Supply-side policy is the most effective way to achieve long-run economic growth because it directly expands productive capacity. However, it is not sufficient on its own; it should be complemented by demand-side policies to manage the economic cycle.
Key Takeaways
- Long-run growth requires increases in aggregate supply.
- Supply-side policy directly increases LRAS.
- Demand-side policies affect AD and can cause inflation if not matched by AS growth.
- Evaluation requires comparing policies and reaching a justified conclusion.
- Diagrams help illustrate the effects and are expected in top-band answers.
Common Mistakes
- One-sided answer: only discussing supply-side policy without considering alternatives.
- Not using a diagram when it would strengthen the analysis.
- Confusing short-run and long-run growth.
- Providing a conclusion that is vague or simply says "it depends" without justification.
- Not addressing the "most effective" part of the question.
Things to Be Careful About
- Clearly distinguish between short-run and long-run effects.
- Use AD/AS analysis correctly: shifts of LRAS vs SRAS.
- In evaluation, compare policies on criteria such as time lag, cost, inflationary impact, and sustainability.
- The conclusion must be justified and address the specific question: is supply-side policy the most effective?
- Avoid making unsupported claims; use economic reasoning.
Explain what is meant by protectionism and consider the effectiveness of using tariffs as a method of protectionism.
Answer
AO1 Knowledge and understanding
Protectionism refers to government policies designed to restrict or discourage international trade in order to protect domestic industries from foreign competition. It aims to reduce the impact of free trade by making imported goods relatively more expensive or less available, thereby improving the price competitiveness of domestic producers.
AO2 Analysis
A tariff is a tax imposed on imported goods. It raises the price of imports, making them more expensive for domestic consumers. This increases the price competitiveness of domestically produced goods, as they are now relatively cheaper than the tariff-inclusive imports. As a result, domestic consumers switch their demand towards domestic products, protecting domestic industries and employment.
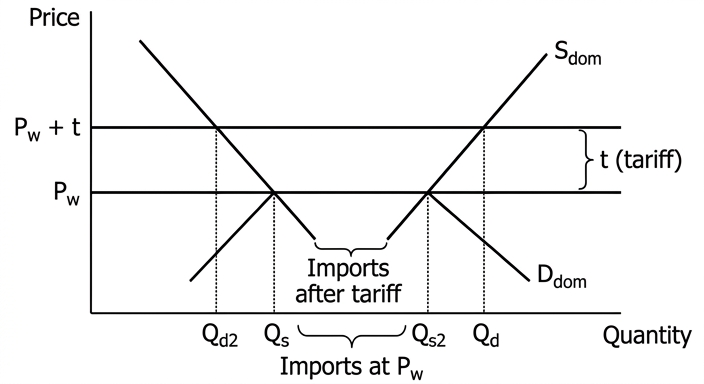
The diagram shows the domestic market for a good. The world price (Pw) is below the domestic equilibrium. At Pw, domestic demand is Qd, domestic supply is Qs, and imports are Qd - Qs. A tariff (t) is added, raising the domestic price to Pw + t. Domestic supply expands to Qs2, domestic demand contracts to Qd2, and imports fall to Qd2 - Qs2. The domestic industry is protected as it can now sell a larger quantity at a higher price.
However, the effectiveness of tariffs is limited by several problems. Retaliation by other countries could reduce exports, offsetting any domestic gains. If the demand for imports is price inelastic, the tariff will not significantly reduce import volumes, and domestic businesses will not benefit. If the tariff is on imported raw materials, it raises costs for domestic firms that rely on them, leading to cost-push inflation and harming their competitiveness.
AO3 Evaluation
Tariffs can be effective in the short term for protecting specific infant industries or addressing a temporary surge in imports. However, their effectiveness is significantly undermined by the risk of retaliation, the potential for cost-push inflation, and the inefficiency they create by sheltering domestic firms from competition. Therefore, while tariffs can offer temporary protection, they are generally an ineffective long-term strategy for improving a country's overall economic welfare, as the costs to consumers and the risk of trade wars often outweigh the benefits to protected industries.
Tariffs can offer short-term protection for specific industries but are generally ineffective as a long-term strategy due to the risks of retaliation, cost-push inflation, and the inefficiency they create.
Background Concept
Protectionism is the economic policy of restricting imports from other countries to shield domestic industries from foreign competition. The core rationale is that without protection, cheaper or better foreign goods could drive domestic firms out of business, leading to job losses and a loss of productive capacity. A tariff is a specific type of protectionist measure: a tax levied on imported goods. Its immediate effect is to raise the price of the imported good in the domestic market. This makes domestically produced substitutes more attractive on a price basis, increasing their market share and allowing domestic firms to survive or expand. The analysis of a tariff's impact is best understood using a standard demand and supply diagram for the domestic market, showing the world price and the effect of the tariff on price, quantity supplied, quantity demanded, and the volume of imports.
Understanding the Question
This question has two distinct parts linked by the command words "Explain" and "consider". First, you must define protectionism (AO1). Second, you must explain how a tariff works as a method of protectionism (AO2). The mark scheme explicitly allows for a diagram to aid this explanation. Third, you must "consider the effectiveness" of tariffs (AO3). This requires you to not just list problems but to weigh the benefits of protection against the costs and problems, and to reach a short, justified conclusion about how effective tariffs actually are. The mark scheme allocates 3 marks for AO1, 3 marks for AO2, and 2 marks for AO3, with 1 of those 2 AO3 marks reserved for a justified conclusion.
Approach
The answer should be structured to clearly hit each assessment objective. Start with a clear definition of protectionism (AO1). Then, explain the mechanism of a tariff. A diagram is very helpful here to show the shift from the world price to the higher tariff-inclusive price, and the resulting fall in imports and increase in domestic production. The explanation must link the diagram to the concept of protecting domestic businesses (AO2). Finally, for the evaluation (AO3), you must present both sides: the potential benefits (effectiveness in protecting an industry) and the significant drawbacks (retaliation, inelastic demand, cost-push inflation). The conclusion must weigh these and state a clear judgement on the overall effectiveness of tariffs.
Step-by-Step Reasoning
-
AO1: Define Protectionism. Start by stating that protectionism is a government policy to protect domestic industries from foreign competition. Mention that it restricts free trade and aims to improve the price competitiveness of domestic firms. This directly answers the "Explain what is meant by protectionism" part.
-
AO2: Explain How a Tariff Works.
- A tariff is a tax on imports. This increases the cost of importing a good.
- The importer passes this cost on to consumers, raising the domestic price of the imported good above the world price.
- This makes domestically produced goods relatively cheaper.
- Consumers, responding to the price change, switch some of their demand from the now more expensive imports to domestic substitutes.
- This increased demand for domestic goods allows domestic firms to sell more, potentially increase production, and maintain or increase employment. This is how the tariff "protects" them.
- The Diagram: Draw a standard demand and supply diagram for a domestic market. Label the axes 'Price' and 'Quantity'. Draw a downward-sloping domestic demand curve (Ddom) and an upward-sloping domestic supply curve (Sdom). Draw a horizontal line at the world price (Pw). At Pw, domestic demand is Qd, domestic supply is Qs, and imports are Qd - Qs. Now, add a tariff (t) on top of Pw, creating a new, higher domestic price line (Pw + t). At this new price, domestic demand falls to Qd2, domestic supply rises to Qs2, and imports fall to Qd2 - Qs2. The domestic industry is protected because it can now sell Qs2 units at a higher price (Pw + t) instead of Qs units at the lower price (Pw).
-
AO3: Evaluate the Effectiveness.
- Arguments for effectiveness: Tariffs can be effective in the short run to protect an infant industry until it can achieve economies of scale and become competitive. They can also protect jobs in industries facing a sudden surge of cheap imports.
- Arguments against effectiveness (the problems):
- Retaliation: The country's trading partners may impose their own tariffs on its exports, harming its export industries. This can offset any domestic gains.
- Price Inelastic Demand: If the demand for the imported good is price inelastic (e.g., a necessity with no domestic substitute), the tariff will not significantly reduce the quantity demanded. Consumers will just pay the higher price, and domestic firms will not see a significant increase in demand.
- Cost-Push Inflation: If the tariff is on imported raw materials or intermediate goods, it raises production costs for domestic firms that use them. This can lead to cost-push inflation and make those domestic firms less competitive, defeating the purpose of protection.
- Inefficiency: By shielding domestic firms from competition, tariffs remove the incentive for them to be efficient, innovative, and reduce costs. This leads to higher prices and lower quality for consumers in the long run.
- Conclusion: The conclusion must be justified. State that while tariffs can provide temporary, targeted protection, their overall effectiveness is low due to the significant negative consequences. The costs to consumers, the risk of trade wars, and the creation of long-term inefficiency usually outweigh the short-term benefits to the protected industry.
Key Takeaways
- Protectionism is a broad term; a tariff is one specific method.
- A tariff works by raising the price of imports, making domestic goods more price-competitive.
- A diagram is a powerful tool to show the impact of a tariff on price, quantity, and imports.
- Evaluation requires a balanced view. You must discuss both the potential benefits and the significant drawbacks of a policy.
- A justified conclusion is a crucial part of the evaluation. It must weigh the arguments and state a clear judgement.
Common Mistakes
- One-sided answer: Only explaining how tariffs work without considering the problems, or only listing problems without acknowledging any potential benefits. This would lose the AO3 marks.
- No conclusion: Failing to provide a final judgement on effectiveness. The mark scheme explicitly reserves 1 mark for a justified conclusion.
- Diagram without explanation: Drawing a tariff diagram but not using it in the text to explain the impact on imports and domestic businesses. The mark scheme states "no marks for a diagram unless it is used to explain the impact."
- Confusing a tariff with a quota: A tariff is a tax; a quota is a physical limit on quantity. The question specifically asks about tariffs.
- Generic evaluation: Making vague statements like "it depends" without explaining on what it depends and reaching a conclusion.
Things to Be Careful About
- Command words: "Explain" requires a detailed mechanism. "Consider" requires a balanced evaluation.
- Mark allocation: The split is 3 (AO1) + 3 (AO2) + 2 (AO3). Ensure your answer has the right balance of depth. The AO3 section should be concise but must include a conclusion.
- Diagram labels: If you use a diagram, ensure all axes, curves, and price lines are clearly labelled (Price, Quantity, Ddom, Sdom, Pw, Pw+t, etc.).
- Context: The question is general, so you can use a generic example. However, making it specific (e.g., "a tariff on imported steel") can strengthen the explanation.
Assess whether free trade is always better than a policy of protectionism for a developing economy that wishes to trade internationally.
Introduction
Free trade is the policy of allowing goods and services to move between countries without government-imposed restrictions. Protectionism involves using barriers like tariffs and quotas to shield domestic industries. For a developing economy seeking to trade internationally, the choice between these policies is critical, as it affects its path to industrialisation, growth, and development. This essay will assess whether free trade is always superior, or whether protectionism can be a more suitable strategy.
The Case for Free Trade
The theory of comparative advantage suggests that countries should specialise in producing goods where they have a lower opportunity cost. For a developing economy, this often means specialising in primary commodities or labour-intensive manufactured goods. Free trade allows it to export these goods and import capital goods and technology that it cannot produce efficiently. This leads to a more efficient allocation of global resources and higher global output.
Furthermore, exposure to international competition forces domestic firms to become more efficient, reduce costs, and innovate. This competitive pressure can help overcome the inefficiencies that often plague protected industries in developing countries. Consumers also benefit from lower prices and a greater variety of goods. Free trade can also facilitate the transfer of technology and knowledge from more advanced economies, which is crucial for long-term development.
The Case for Protectionism
Despite the theoretical benefits, free trade can pose significant problems for a developing economy. The most prominent argument is the infant industry argument. New industries in a developing country may be unable to compete with established, large-scale foreign firms. Without temporary protection, these industries would fail before they can achieve the economies of scale and learning-by-doing necessary to become competitive. Protectionism, through tariffs or quotas, can give these industries a chance to grow.
Free trade can also lead to over-specialisation in primary products, making the economy vulnerable to volatile commodity prices and deteriorating terms of trade. It can cause the decline of traditional manufacturing sectors, leading to structural unemployment, as workers may lack the skills to move to new industries. Furthermore, developing economies may face unfair competition from developed countries that provide massive agricultural subsidies to their own farmers, a practice known as dumping. Protectionism can level the playing field against such practices.
Evaluation
The choice between free trade and protectionism is not absolute; it depends on the specific circumstances of the developing economy. The infant industry argument is theoretically sound, but it is notoriously difficult to implement in practice. Governments often fail to remove protection once the industry is mature, leading to permanently inefficient and uncompetitive firms that rely on state support. This can create a culture of rent-seeking rather than innovation.
The key evaluative criterion is the time period and the stage of development. In the short to medium term, selective, temporary protectionism can be a useful tool to nurture strategic industries and diversify the economy away from primary commodity dependence. This was the strategy successfully employed by many East Asian economies (e.g., South Korea). However, in the long term, a fully protectionist stance is unsustainable. It denies the economy the benefits of competition, technology transfer, and access to larger markets. The best policy is likely a pragmatic, mixed approach: strategic, time-bound protection for specific infant industries combined with a gradual opening up to free trade to ensure long-term competitiveness.
Conclusion
Free trade is not always better than protectionism for a developing economy. While free trade offers significant long-term benefits in terms of efficiency and growth, it can be detrimental in the short run by destroying nascent industries and causing structural unemployment. A blanket policy of either extreme is unlikely to be optimal. The most effective strategy for a developing economy is a managed and selective approach to protectionism, used as a temporary tool to build industrial capacity, with a clear plan for eventual integration into the global free trade system. Therefore, the superiority of one policy over the other is contingent on the specific context and the quality of government implementation.
Free trade is not always better than protectionism for a developing economy. While free trade offers long-term efficiency gains, protectionism can be a necessary short-to-medium-term tool to protect infant industries and diversify the economy. The optimal strategy is a pragmatic, mixed approach with selective, time-bound protectionism, not a blanket commitment to either extreme.
Background Concept
The core of this question is the classic debate in development economics between free trade and protectionism. The theoretical case for free trade rests on the law of comparative advantage, which states that countries benefit from specialising in what they do relatively best and trading for the rest. This leads to a more efficient global allocation of resources and higher total output. However, this model assumes perfect competition, full employment, and that resources can move costlessly between industries—assumptions that rarely hold in a developing economy. The case for protectionism is largely built on the market failures and structural problems that developing economies face, such as the infant industry argument, the need to diversify away from primary products, and the presence of unfair trade practices by developed nations. The question asks you to assess which policy is "always better," which is an absolute claim. A strong answer will challenge this absolute by showing that the optimal policy is context-dependent.
Understanding the Question
This is a 12-mark, levels-marked essay question. The command word is "Assess whether...", which requires a balanced, two-sided analysis and a final, justified judgement. The specific context is crucial: "for a developing economy that wishes to trade internationally." The mark scheme explicitly states that if the analysis is not in the context of a developing economy, the maximum level for AO1/AO2 is Level 2 (3-5 marks). Furthermore, if the evaluation is not in this context, no evaluation marks can be awarded. The top band (Table A, Level 3) requires a detailed, developed, and well-organised response. Table B (Level 2) requires a justified conclusion with developed evaluative comments. A one-sided response cannot gain any marks for evaluation.
Approach
The essay must be structured to present both sides of the argument, firmly rooted in the context of a developing economy.
- Introduction: Define free trade and protectionism. State the specific context (a developing economy) and the central tension of the question. Briefly outline the essay's structure.
- The Case for Free Trade (The 'Yes' side): Develop the arguments for free trade specifically for a developing country. Focus on comparative advantage, access to capital goods and technology, competitive pressure to increase efficiency, and the benefits for consumers.
- The Case for Protectionism (The 'No' side): Develop the counter-arguments. This is the heart of the essay. Focus on the infant industry argument, the dangers of over-specialisation in primary products, structural unemployment, and the need to counter dumping and subsidies from developed countries. Use specific examples where possible (e.g., South Korea's protection of its steel industry, or the struggle of African textile industries against Chinese imports).
- Evaluation: This is where you weigh the two sides. The key is to move beyond a simple list of pros and cons. Use evaluative criteria:
- Time Period: Protectionism may be necessary in the short run, but free trade is better in the long run.
- Implementation: The infant industry argument is strong in theory but weak in practice due to government failure.
- Selectivity: The best approach is not a blanket policy but a selective, strategic one.
- Examples: Reference the success of East Asian 'developmental states' that used protectionism strategically, versus the struggles of countries that pursued import substitution industrialisation (ISI) for too long.
- Conclusion: Provide a clear, justified judgement that directly answers the question. The answer should be that free trade is NOT always better. The optimal policy is a nuanced, context-dependent mix. State the conditions under which protectionism is justified and the conditions under which free trade is superior.
Step-by-Step Reasoning
-
Introduction: Start by defining the two key terms. Immediately establish the context: "For a developing economy..." State the essay's purpose: to assess the absolute claim that free trade is "always better." Foreshadow the conclusion that the answer is nuanced.
-
Developing the Case for Free Trade:
- Comparative Advantage: Explain how a developing economy can benefit from specialising in labour-intensive goods or primary products where it has a comparative advantage. It can then export these to earn foreign exchange to import capital goods, machinery, and technology necessary for industrialisation.
- Efficiency and Competition: Explain that exposure to international competition forces domestic firms to be more efficient, reducing the 'X-inefficiency' common in protected markets. This leads to lower prices and higher quality for consumers.
- Technology Transfer: Free trade and foreign direct investment (FDI) that often accompanies it can bring new technologies, management techniques, and skills to the developing economy, boosting its long-run productive capacity.
-
Developing the Case for Protectionism:
- Infant Industry Argument: This is the strongest argument. Explain that new industries in a developing country face high initial costs and cannot compete with established foreign giants. Temporary protection (a tariff or quota) allows them to grow, achieve economies of scale, and become competitive. Once mature, the protection should be removed.
- Over-Specialisation and Volatility: Explain that free trade can trap a developing economy in the production of primary commodities (e.g., coffee, copper, oil). These markets are subject to volatile prices and deteriorating terms of trade (the price of exports falls relative to the price of imports). This creates economic instability and hinders development.
- Structural Unemployment: If free trade leads to the collapse of domestic manufacturing, workers may not have the skills to move to other sectors, leading to long-term structural unemployment.
- Unfair Competition: Developed countries often provide huge subsidies to their agricultural sectors. This allows them to 'dump' cheap food on world markets, undercutting farmers in developing countries. Protectionism can be a defensive measure against this unfair practice.
-
Evaluation and Weighing the Arguments:
- The 'Infant Industry' Trap: Acknowledge that the infant industry argument is powerful but has a major flaw: government failure. It is very difficult for governments to pick 'winning' industries, and once protection is granted, it is politically difficult to remove. This can lead to permanently inefficient, protected industries that are a drain on the economy (e.g., the import substitution industrialisation (ISI) policies in many Latin American countries in the mid-20th century).
- The Success of East Asia: Contrast this with the success of countries like South Korea and Taiwan. They used selective, performance-based protectionism. They protected certain industries but also forced them to export, exposing them to international competition. This shows that protectionism can work if implemented strategically and with a clear exit strategy.
- The Criterion of Time: The key evaluative point is the time horizon. In the short to medium term, protectionism can be a vital tool for structural transformation. In the long term, an economy must integrate into the global market to benefit from competition, scale, and innovation. A purely protectionist economy will stagnate.
- The Criterion of Selectivity: A blanket policy of protectionism is bad. A blanket policy of free trade can also be bad for a developing economy. The best policy is a selective, strategic, and time-bound approach to protectionism.
-
Conclusion: The conclusion must be a direct answer to the question. State clearly: "Free trade is not always better for a developing economy." Justify this by summarising the key evaluative point: the optimal policy depends on the country's stage of development, the quality of its institutions, and its ability to implement selective, time-bound protectionism. Conclude that a pragmatic, mixed approach is superior to a dogmatic commitment to either extreme.
Key Takeaways
- Context is everything: For a question about a developing economy, every point must be framed in that context. Generic arguments about free trade will not score highly.
- Challenge absolutes: The word "always" in the question is a signal to argue that the answer is conditional and context-dependent.
- Two-sided analysis is mandatory: An 'assess' question requires a balanced discussion of both sides. A one-sided answer cannot get evaluation marks.
- The conclusion must be justified: It is not enough to say "it depends." You must explain what it depends on and, based on that, state which policy is likely better and under what conditions.
- Use real-world examples: Referencing the East Asian 'Tigers' (successful strategic protectionism) versus the ISI failures in Latin America or Africa provides powerful, concrete support for your evaluative points.
Common Mistakes
- Ignoring the context: Writing a generic essay about free trade vs. protectionism without specifically applying it to a developing economy. This caps the mark at Level 2 for analysis and 0 for evaluation.
- One-sided argument: Only arguing for free trade or only for protectionism. This loses all evaluation marks.
- No conclusion or a vague conclusion: Ending with a summary of points rather than a clear, justified judgement. The top band for evaluation requires a conclusion that "addresses the specific requirements of the question."
- Assertion without development: Stating that "free trade is good because of comparative advantage" without explaining the mechanism or its relevance to a developing country.
- Descriptive rather than analytical: Simply listing the pros and cons of each policy without weighing them against each other or using evaluative criteria.
Things to Be Careful About
- Command word: "Assess whether" requires a judgement. The entire essay must build towards that judgement.
- Level descriptors: The top band (Level 3) for analysis requires a "detailed," "developed," and "well-organised" response. This means you need to explain your points fully, not just state them.
- Evaluation marks: The 4 marks for evaluation are separate and crucial. You must have a dedicated evaluation section and a clear conclusion.
- Balance: Ensure the two sides are given roughly equal weight and depth of development. A token paragraph against one side will not be enough for a top-band evaluation.
- Specificity: Use specific economic terminology (comparative advantage, infant industry, terms of trade, structural unemployment, economies of scale, government failure, rent-seeking).