Economics 9708/21 — May/June 2024
Cambridge AS Level · AS Level Data Response and Essays · worked solutions for every part, with the mark scheme
Topics Supply-Side Policy · Elasticities of Demand · Fiscal Policy · Monetary Policy · Balance of Payments · International Trade and Comparative Advantage · +10 more
Will an increase in exports lead Sri Lanka back into economic growth?
In May 2022, Sri Lanka had to admit that it was unable to pay its debts to other countries for the first time in its history. As a result, in February 2023 it was forced to obtain a loan of US$3bn from the International Monetary Fund (IMF). The question is now, can Sri Lanka trade its way out of trouble?
The main problem faced by Sri Lanka for many years has been a lack of international competitiveness. Despite a growth in exports between 2000 and 2018, over the same period, they fell as a share of the economy from 39% to 23% of Gross Domestic Product (GDP). As a result, the country has found itself unable to earn enough foreign currency to pay for essential imports of food and fuel.
Table 1.1: Sri Lanka balance of trade in goods and services, US$ million, January 2022 to January 2023.
| January 2022 | March 2022 | May 2022 | July 2022 | September 2022 | November 2022 | January 2023 |
|---|---|---|---|---|---|---|
| -858 | -762 | -404 | -123 | -205 | -450 | -410 |
For many years, Sri Lanka has enjoyed a comparative advantage in growing and exporting tea. However, the ban on imports of fertilisers in 2021 which cut yields by a fifth and an overreliance on outdated methods of production have had a disastrous impact. Another major export is textiles, but these rely heavily on imported raw materials that have rapidly increased in price following the COVID-19 pandemic and the conflict in Ukraine. So, what alternatives exist for Sri Lanka?
Unlike in other Asian nations, Sri Lanka does not appear to have a plan to develop any new comparative advantage. Probably the most likely option would appear to be to take full use of its position at the centre of Indian Ocean shipping lanes by developing its ports. Sri Lanka could become a major shipping hub which would extend opportunities for exports. For example, approximately a third of the world's oil is transported across the Indian Ocean.
Other options include allowing the Sri Lankan rupee to depreciate to boost exports because it is felt that the currency is overvalued. There are also suggestions that all import tariffs should be removed. Sri Lanka is currently one of the most protected economies in the World and removing tariffs may help attract much needed foreign investment and encourage local industries to become more efficient.
The question now is, could the introduction of these options lead Sri Lanka back into economic growth?
Source: Adapted from Ben Chu, Economics Editor, BBC Newsnight article and tradingeconomics.com, February 2023
Using Table 1.1:
Identify the overall trend in Sri Lanka's balance of trade in goods and services between January 2022 and January 2023.
Answer
The trade deficit has fallen over the period.
The trade deficit has fallen.
Background Concept
A balance of trade deficit occurs when the value of a country's imports of goods and services exceeds the value of its exports. The data in Table 1.1 shows the monthly trade balance in US$ million. A negative number indicates a deficit.
Understanding the Question
The question asks to identify the overall trend in Sri Lanka's balance of trade between January 2022 and January 2023. The data shows the deficit values: -858, -762, -404, -123, -205, -450, -410. The overall movement is from a larger deficit (-858) to a smaller deficit (-410), so the deficit has fallen (improved).
Approach
Look at the first and last data points to determine the direction of change. The trend is that the deficit has decreased over the year.
Step-by-Step Reasoning
- January 2022: deficit of US$858 million.
- January 2023: deficit of US$410 million.
- The deficit has fallen by US$448 million.
- Therefore, the overall trend is a decline in the trade deficit.
Key Takeaways
- A trade deficit is a negative balance.
- A falling deficit means the gap between imports and exports is narrowing.
Common Mistakes
- Stating that the trade balance has improved without specifying that it is the deficit that has fallen.
- Confusing a fall in the deficit with a surplus.
Things to Be Careful About
- Use the term 'deficit' correctly.
- The trend is over the whole period, not month-to-month fluctuations.
Calculate the percentage change in Sri Lanka's balance of trade in goods and services between January 2022 and January 2023.
Working
Percentage change = (Value in Jan 2023 - Value in Jan 2022) / Value in Jan 2022 * 100
= (-410 - (-858)) / (-858) * 100
= 448 / (-858) * 100
= -52.2%
Answer
The deficit fell by 52%.
52% decrease
Background Concept
Percentage change measures the relative change between two values. For a deficit, a negative percentage change indicates a reduction in the deficit.
Understanding the Question
Calculate the percentage change in the balance of trade from January 2022 to January 2023. Use the values: Jan 2022 = -858, Jan 2023 = -410.
Approach
Use the formula: ((new value - old value) / old value) * 100. Note that both values are negative, so careful with signs.
Step-by-Step Reasoning
- Old value = -858
- New value = -410
- Change = -410 - (-858) = 448
- Percentage change = (448 / -858) * 100 = -52.2%
- The negative sign indicates a fall in the deficit (improvement).
Key Takeaways
- Percentage change formula works for negative numbers.
- A 52% fall in the deficit means the deficit is now about half its original size.
Common Mistakes
- Forgetting to include the negative sign in the denominator.
- Calculating percentage change as (new - old)/old without considering the sign of the deficit.
Things to Be Careful About
- Use the exact values from the table.
- The answer should be given as a percentage, and the mark scheme accepts 51% to 53%.
Explain what is meant by 'Sri Lanka has enjoyed a comparative advantage in growing and exporting tea.'
Answer
Comparative advantage means that Sri Lanka can produce tea at a lower opportunity cost than other countries. This means it gives up less of other goods to produce a unit of tea compared to its trading partners.
Sri Lanka can produce tea at a lower opportunity cost than other countries.
Background Concept
Comparative advantage is a key concept in international trade. A country has a comparative advantage in producing a good if it can produce it at a lower opportunity cost than another country. Opportunity cost is the value of the next best alternative forgone.
Understanding the Question
The question asks to explain what it means for Sri Lanka to have a comparative advantage in tea. The answer must include the idea of lower opportunity cost relative to another country.
Approach
Define comparative advantage clearly, using the term 'opportunity cost' and specifying that it is lower than in other countries.
Step-by-Step Reasoning
- Comparative advantage is about relative efficiency, not absolute efficiency.
- Sri Lanka can produce tea with a lower opportunity cost than, say, its trading partners.
- For example, to produce one unit of tea, Sri Lanka gives up fewer units of other goods than another country would.
- This makes it beneficial for Sri Lanka to specialise in tea and trade.
Key Takeaways
- Comparative advantage is based on opportunity cost differences.
- It is the basis for gains from trade.
Common Mistakes
- Confusing comparative advantage with absolute advantage (producing more with same resources).
- Omitting the phrase 'lower opportunity cost'.
- Not mentioning that it is relative to another country.
Things to Be Careful About
- The definition must be precise: 'lower opportunity cost than another country'.
- Do not just say 'can produce tea efficiently' – that is absolute advantage.
Consider the extent to which depreciation of the Sri Lankan rupee could improve the country's balance of trade in goods and services.
Answer
A depreciation of the Sri Lankan rupee means that the currency becomes cheaper relative to other currencies. This makes Sri Lankan exports cheaper in foreign currency and imports more expensive in domestic currency. As a result, the quantity of exports is likely to rise and the quantity of imports is likely to fall, which could improve the balance of trade.
However, the extent of the improvement depends on the price elasticity of demand (PED) for exports and imports. If the sum of the PED for exports and imports is greater than 1 (the Marshall-Lerner condition), the trade balance will improve. If the PED is low, the trade balance may worsen initially (J-curve effect). Given Sri Lanka's reliance on essential imports like food and fuel, demand may be inelastic, limiting the improvement. Therefore, depreciation may help but is not guaranteed to significantly reduce the deficit.
Depreciation could improve the trade balance if the Marshall-Lerner condition holds, but low PED for essential imports may limit the effect.
Background Concept
Depreciation is a fall in the value of a currency in a floating exchange rate system. It makes exports cheaper abroad and imports dearer at home. The impact on the trade balance depends on the price elasticity of demand for exports and imports, as summarised by the Marshall-Lerner condition.
Understanding the Question
The question asks to consider the extent to which depreciation could improve Sri Lanka's balance of trade. It requires explanation of the mechanism and evaluation using PED.
Approach
First, explain what depreciation is and how it affects relative prices. Then, explain the expected effect on export and import volumes. Finally, evaluate using the Marshall-Lerner condition and the specific context of Sri Lanka (essential imports).
Step-by-Step Reasoning
- Depreciation: rupee becomes cheaper, so foreign buyers need less of their currency to buy Sri Lankan goods (exports cheaper). Sri Lankans need more rupees to buy foreign goods (imports more expensive).
- This should increase export quantity and decrease import quantity, improving the trade balance.
- However, the value effect: if demand is inelastic, the price change may not lead to a proportional quantity change. For example, if import demand is inelastic (essential goods), the quantity falls little but the price rises, so the import bill may actually increase, worsening the deficit.
- The Marshall-Lerner condition states that the trade balance improves if the sum of the absolute values of PED for exports and imports > 1.
- Sri Lanka imports essential food and fuel, likely inelastic. Exports like tea may have some elasticity but not high. So condition may not hold, or only in the long run.
- Also, J-curve effect: in the short run, the deficit may worsen before improving.
Key Takeaways
- Depreciation is not a guaranteed cure for a trade deficit.
- Elasticities are crucial.
- Context matters: essential imports reduce effectiveness.
Common Mistakes
- Ignoring the role of PED.
- Assuming depreciation always improves the trade balance.
- Not mentioning the Marshall-Lerner condition or J-curve.
Things to Be Careful About
- Use correct terminology: depreciation (not devaluation) for floating rate.
- Explain the condition clearly.
- Provide a balanced conclusion.
Assess whether the removal of all protectionism is likely to reduce the balance of trade deficit.
Answer
Removing all protectionism, such as import tariffs, could reduce the trade deficit in several ways. It may attract foreign investment, encourage domestic industries to become more efficient, and reduce the cost of imported inputs, boosting export competitiveness. It also avoids retaliation from trading partners.
However, removing protection could also worsen the deficit in the short run. Domestic industries may struggle to compete with imports, leading to a rise in imports and a fall in exports if inefficient firms close. Infant industries may be harmed. Given Sri Lanka's current lack of competitiveness, the immediate effect might be a larger deficit.
On balance, while removal of protectionism could improve efficiency and attract investment in the long run, it is unlikely to reduce the deficit quickly and may initially increase it. Therefore, a gradual approach may be more effective.
Removal of all protectionism is unlikely to reduce the deficit in the short run and may worsen it, but could improve it in the long run through increased efficiency and investment.
Background Concept
Protectionism includes tariffs, quotas, and other barriers to trade. They protect domestic industries from foreign competition. Removing them can have both positive and negative effects on the trade balance.
Understanding the Question
The question asks to assess whether removing all protectionism is likely to reduce the trade deficit. It requires analysis of both sides and a conclusion.
Approach
First, explain how removing tariffs could help reduce the deficit (e.g., cheaper inputs, efficiency gains, investment). Then, explain how it could worsen the deficit (e.g., import surge, loss of domestic output). Finally, evaluate the net effect considering Sri Lanka's situation.
Step-by-Step Reasoning
- Benefits of removal:
- Cheaper imported raw materials (e.g., for textiles) reduce costs and improve export competitiveness.
- Foreign investment may increase as barriers are lowered.
- Domestic firms face competition, incentivising efficiency, which could boost exports.
- Avoids retaliation from trade partners.
- Drawbacks of removal:
- Immediate increase in imports as tariffs are lifted, worsening the deficit.
- Inefficient domestic industries may collapse, reducing exports and increasing unemployment.
- Infant industries may never develop.
- Sri Lanka is already uncompetitive; sudden opening may cause a trade shock.
- Evaluation: The short-run effect is likely a larger deficit. Long-run benefits depend on the response of domestic firms and investment. Given the urgency of Sri Lanka's debt crisis, the short-run pain may be too high. A gradual reduction may be better.
Key Takeaways
- Protectionism removal has trade-offs.
- Time horizon matters: short run vs long run.
- Context (competitiveness, fiscal position) is crucial.
Common Mistakes
- Only discussing one side.
- Not reaching a conclusion.
- Ignoring the specific context of Sri Lanka.
Things to Be Careful About
- Focus on the trade balance, not just general economic effects.
- Reserve one mark for a justified conclusion.
- Use evidence from the extract (e.g., lack of competitiveness).
Assess the extent to which supply-side policies will be able to 'lead Sri Lanka back into economic growth'.
Answer
Supply-side policies aim to increase the productive capacity of the economy, shifting the LRAS curve to the right. For Sri Lanka, policies such as improving education and training, investing in infrastructure (e.g., ports), and supporting technological innovation could boost productivity and export competitiveness. This could lead to higher output and employment, promoting economic growth.
However, supply-side policies take time to have an effect. The benefits may not be seen for several years. They are also costly, and Sri Lanka's fiscal position is weak. Additionally, the success depends on the receptiveness of the workforce and businesses. Without complementary policies to address immediate demand-side issues, growth may be slow.
Overall, supply-side policies are essential for long-term sustainable growth, but they are unlikely to lead Sri Lanka back into growth quickly. They need to be combined with other measures to address the immediate crisis.
Supply-side policies can contribute to long-term economic growth but are unlikely to lead Sri Lanka back into growth in the short term due to time lags and fiscal constraints.
Background Concept
Supply-side policies are designed to increase the economy's productive potential by improving the quantity or quality of factors of production. They shift the LRAS curve right, leading to higher real GDP without causing inflation. Economic growth is measured by the increase in real GDP.
Understanding the Question
The question asks to assess the extent to which supply-side policies will be able to lead Sri Lanka back into economic growth. It requires analysis of both potential benefits and drawbacks, and a conclusion on their effectiveness.
Approach
First, explain how supply-side policies can promote growth (e.g., better workforce, infrastructure, innovation). Then, discuss limitations (time lags, cost, need for demand). Finally, evaluate the extent to which they can restore growth given Sri Lanka's situation.
Step-by-Step Reasoning
- Benefits:
- Training and education improve human capital, increasing productivity.
- Infrastructure investment (e.g., ports) reduces costs and boosts export capacity.
- Technological support can create new comparative advantages.
- These shift LRAS right, increasing potential output.
- Drawbacks:
- Time lags: benefits take years to materialise.
- High cost: Sri Lanka is in debt and may not afford large investments.
- Requires complementary demand-side policies; if AD is low, increased capacity may not be used.
- Workforce may resist change or lack basic skills.
- Evaluation: Supply-side policies are necessary for long-term growth, but they cannot solve the immediate crisis. They should be part of a broader strategy including IMF support and demand management. The extent is limited in the short run but significant in the long run.
Key Takeaways
- Supply-side policies address the root causes of low growth.
- They are not quick fixes.
- A combination of policies is usually needed.
Common Mistakes
- Only discussing benefits, ignoring drawbacks.
- Not linking to the specific context of Sri Lanka (debt, lack of competitiveness).
- No clear conclusion on the extent.
Things to Be Careful About
- Use AD/AS analysis to show the effect on real output.
- Reserve one mark for a justified conclusion.
- Mention the need for time and complementary policies.
With the use of examples, explain the difference between public goods and merit goods and consider whether markets will always provide enough of both goods.
Answer
Public goods are goods that are non-rivalrous (one person's consumption does not reduce availability for others) and non-excludable (it is impossible or very costly to prevent anyone from consuming them). Example: street lighting.
Merit goods are goods that are under-consumed because consumers have imperfect information about their long-term benefits; they are considered better for people than people realise. Example: education.
The free-rider problem means that in a pure market economy, profit-seeking firms will not supply public goods because they cannot charge consumers. Therefore, markets will not provide enough public goods without government provision.
For merit goods, imperfect information leads consumers to underestimate the private benefits (e.g. better future earnings from education). Markets do provide some merit goods (private schools exist), but they will be under-consumed relative to the socially optimal level. Government intervention (e.g. subsidies, direct provision) is needed to raise consumption.
Evaluation: While markets fail to provide public goods at all without government, the statement 'markets will always provide enough of both goods' is false for public goods. For merit goods, markets can provide some, but not the socially optimal amount. With appropriate government intervention (subsidies, state provision, information campaigns) a mixed economy can achieve adequate provision. Therefore, markets alone will not always provide enough; it depends on the extent of government involvement.
Markets alone will not always provide enough public goods or merit goods; public goods require government provision due to the free-rider problem, and merit goods need intervention to overcome under-consumption caused by imperfect information.
Background Concept
Public goods are a category of goods that have two key characteristics: non-rivalry in consumption and non-excludability. Non-rivalry means that one person's consumption does not reduce the amount available for others; non-excludability means that once the good is provided, it is impossible (or too costly) to prevent anyone from using it. The classic example is street lighting: the light from one street lamp can be enjoyed by everyone, and it is impractical to charge passers-by individually. Because of non-excludability, private firms cannot make a profit by selling the good – anyone can 'free ride' and consume without paying. This leads to the free-rider problem, where the market fails to provide the good at all, or severely under-provides it.
Merit goods are goods that are considered to be under-consumed because consumers have imperfect information about their true benefits. They are goods that society believes people should consume more of, but individuals, left to themselves, consume less than the socially optimal level. Education and healthcare are standard examples. Consumers may underestimate the long-term private benefits (e.g. higher future income from education) or may have short-term preferences that lead to under-consumption. Unlike public goods, merit goods are often rivalrous and excludable (e.g. private schools charge fees), so markets can provide them. However, the level of consumption is below what is socially desirable, constituting a market failure.
Market failure occurs when the free market fails to allocate resources efficiently (allocative efficiency is not achieved). Both public goods and merit goods are examples of market failure, but for different reasons.
Government intervention can address these failures: for public goods, direct provision is common (government pays through tax revenue); for merit goods, subsidies, state provision, or information campaigns can raise consumption towards the optimum.
Understanding the Question
The question asks you to do three things: (1) explain the difference between public goods and merit goods, using examples; (2) consider whether markets will always provide enough of both goods. The command 'consider' implies you need to evaluate the claim – it is an absolute statement ("always"), so you need to test it against the characteristics of each type of good. The question carries 8 marks, split: up to 3 for knowledge (definitions and examples), up to 3 for analysis (explaining why markets may or may not provide enough), and up to 2 for evaluation (a justified conclusion). This is a point-based question, so you need to make your points clearly and separately.
Approach
- Start by defining and giving a clear example for public goods, emphasising the two key features and the free-rider problem. This scores AO1 knowledge.
- Do the same for merit goods, emphasising under-consumption due to imperfect information. Use an example like education or healthcare.
- Then analyse (AO2) why a pure market economy will not produce enough of either. For public goods: no profit motive, free-rider problem leads to zero or negligible provision. For merit goods: despite markets providing some, imperfect information leads to under-consumption; the socially optimal quantity is higher.
- The evaluation (AO3) must address the 'always' absolute. Challenge it: is it always true for both? For public goods, yes – without government, the market will almost certainly fail. For merit goods, markets can provide some, but not the socially optimal amount. Also consider that government intervention (subsidies, provision) can correct the failure, so the final sentence 'always' depends on whether the economy is purely market or mixed. Conclude that markets alone will not always provide enough; with appropriate intervention, a mixed economy can.
Make sure to cover both markets (public goods and merit goods), as the mark scheme penalises only analysing one.
Step-by-Step Reasoning
Definition of public goods: Start by stating the two characteristics: non-rivalry and non-excludability. Example: street lighting or national defence. Emphasise that these features create a free-rider problem: because no one can be excluded, no one has an incentive to pay, so firms cannot recover costs; hence the market fails.
Definition of merit goods: Explain that these are goods that are under-consumed because consumers lack full information about the benefit. Example: education – individuals might not fully realise the long-term gains in earnings and well-being. They are often rivalrous and excludable, so markets can supply them, but at a quantity below the socially optimal.
Analysis of market provision:
- Public goods: In a pure market economy, without government, the quantity provided will be zero (or negligible if charitable). The profit motive is absent because of non-excludability. Thus, markets will definitely not provide enough.
- Merit goods: Markets will provide some (private schools, private healthcare), but due to imperfect information, demand is lower than socially optimal. The market equilibrium quantity Qm is less than the socially optimal Qs. So even though the market provides some, it does not provide enough relative to what society would want if consumers had perfect information.
Evaluation of the 'always' claim:
- Consider that 'enough' is defined relative to social optimum. For public goods, the market alone provides none, so it always fails to provide enough. So the statement is true for public goods.
- For merit goods, the market provides some but less than optimal. So it does not 'always' provide enough; it fails in a different way.
- However, if the question is about 'both goods together', the answer is that markets will not always provide enough of either if left purely to themselves.
- But now consider a mixed economy: government can provide public goods directly, and can subsidise or directly provide merit goods. In such an economy, it is possible to achieve adequate provision. So the statement 'markets will always provide enough' is false because without government they fail; but with government, they might. The conclusion should state that in a pure market, the answer is no; in a mixed economy with appropriate intervention, it can be yes.
The final judgement should be concise and justified: 'Markets alone will not always provide enough; government intervention is necessary to achieve socially optimal provision.'
Key Takeaways
- Public goods are non-rival and non-excludable; merit goods are under-consumed due to information failure.
- The free-rider problem is specific to public goods; merit goods suffer from misperception of benefits.
- Market failure exists for both, but in different forms.
- Evaluative questions often contain an absolute word ('always','never') – challenge it with conditions.
- Use examples to illustrate definitions; they are specifically credited.
- Cover both markets; a one-sided answer loses evaluation marks.
Common Mistakes
- Confusing merit goods with public goods: they are different. Some students mistakenly say merit goods are non-rivalrous etc.
- Giving only one example; the question asks for examples (plural) and at least one for each good.
- Not addressing the 'always' part: just describing the goods without evaluating the claim.
- Only discussing public goods or only merit goods; mark scheme caps analysis at 2 marks if only one market is analysed.
- Forgetting to reach a conclusion; evaluation marks explicitly require a conclusion.
- Using vague examples without explaining why they fit the definition.
Things to Be Careful About
- Clearly state the characteristics for each type.
- Ensure examples are accurate: street lighting, national defence for public goods; education, preventive healthcare for merit goods.
- In analysis, explain the mechanism of market failure: for public goods, free-rider; for merit goods, information failure.
- In evaluation, the conclusion must be justified, not just a 'yes/no'. Explain the condition under which the statement holds.
- The mark scheme notes 'if only 1 market is analysed, then 2 marks maximum for analysis and 0 for evaluation'. So explicitly cover both.
Introduction
A planned economy is one in which the government makes all decisions about what, how, and for whom to produce, typically through a central planning authority. A mixed economy combines elements of both market and planned systems, with private and public sectors coexisting. This essay assesses whether a planned economy should always switch to a mixed economy.
Advantages of a planned economy
Planning can achieve an equitable distribution of income and ensure the provision of public goods and merit goods, such as education and healthcare, which markets might under-provide. It can also direct resources towards long-term infrastructure projects without being constrained by short-term profit motives. During rapid industrialisation, central planning can coordinate investment on a large scale, as seen in the early Soviet Union.
Disadvantages of a planned economy
However, planned economies suffer from severe information problems: the central planner lacks the decentralised knowledge of consumer preferences that prices convey in a market. This leads to misallocation of resources, shortages, and surpluses. There is also a lack of profit incentive, which can dampen innovation and efficiency. Bureaucratic decision-making is slow and costly. The historical record of centrally planned economies, such as the USSR and Eastern Bloc, shows persistent inefficiency and low living standards relative to market economies.
Advantages of a mixed economy
A mixed economy can combine the efficiency of markets with the ability of government to correct market failures. Markets allocate resources efficiently through the price mechanism, incentivising innovation and responding to consumer demand. Government can provide public goods, regulate externalities, and redistribute income. This balance often yields higher growth and stability than a pure plan. Most successful economies today are mixed (e.g., Western European social market economies).
Disadvantages and challenges of switching
However, a mixed economy is not a panacea. Government failure can occur, where intervention distorts incentives or is captured by interest groups. The switch itself is costly and disruptive: transition involves privatising state-owned enterprises, creating legal and financial institutions, and managing social costs like unemployment. The success of a mixed economy depends on the quality of institutions, the rule of law, and the extent of corruption. In some contexts, a planned system may have served basic needs reasonably well and a hasty switch could cause chaos (e.g., Russia in the 1990s).
Evaluation
The statement that a planned economy should always switch to a mixed economy is too absolute. The optimal economic system depends on a country's stage of development, institutional capacity, and cultural context. For a very poor country with weak market institutions, a gradual shift may be preferable to rapid reform. Moreover, some planned elements may be retained to ensure equity and stability. However, the overwhelming evidence suggests that economies with a substantial market component perform better over time. Therefore, while a switch is generally beneficial, it should not be 'always' unconditional – it depends on how the transition is managed and what type of mixed economy is created.
Conclusion
Planned economies face serious inefficiencies that markets can help resolve, but the transition to a mixed economy carries risks. A well-managed shift that introduces markets gradually, supported by strong institutions, is likely to improve outcomes. Thus, a planned economy should usually, but not always, switch to a mixed economy; the decision must be context-specific.
A planned economy should not always switch to a mixed economy; while a mixed economy generally offers better efficiency and resource allocation, the optimal decision depends on a country's institutional capacity, the risk of government failure, and the management of the transition. In most cases a move towards a mixed economy is beneficial, but it is not an unconditional imperative.
Background Concept
Economic systems are the frameworks by which societies organise the production, distribution, and consumption of goods and services. The three main types are:
- Market economy: resources are allocated through the price mechanism based on supply and demand; private ownership; profit motive; consumer sovereignty.
- Planned economy (command economy): the government or central authority makes all decisions; state ownership of productive resources; allocation by central planning.
- Mixed economy: a blend of market and planned elements; both private and public sectors exist; the government intervenes to correct market failures and provide welfare.
The transition from a planned to a mixed economy involves privatisation, liberalisation of prices, establishment of market institutions, and often significant social upheaval.
Market failure (public goods, externalities, inequality) justifies government intervention, but government failure (bureaucratic inefficiency, rent-seeking, information problems) can make intervention counterproductive.
Understanding the Question
The question is: "Assess whether a planned economic system should always switch to a mixed economy." This is a levels-based essay worth 12 marks. The command 'assess' requires evaluation: you must present arguments for and against the proposition, and then reach a justified conclusion. The word 'always' makes the statement absolute; you need to test it against real-world examples and theoretical reasoning. The top band (AO1/AO2) requires detailed knowledge, fully developed analysis, and a balanced response. The AO3 evaluation requires a justified conclusion with developed evaluative comments.
Approach
- Define the two systems clearly in the introduction.
- Present the case for switching: discuss the inefficiencies of planning and the benefits of markets (allocative efficiency, innovation, choice).
- Present the case against switching: note that a planned economy can achieve equity and public goods, and that the transition is risky and costly. Also consider that a mixed economy is not automatically superior – it depends on the quality of government intervention.
- Evaluate the arguments: weigh the empirical evidence (e.g., collapse of planned economies vs. success of mixed economies). Discuss the conditions under which a switch is beneficial or harmful.
- Conclude by answering the question directly: no, it should not 'always' switch; the decision should be context-dependent, but in most cases a mixed economy is better.
You do not need diagrams for this question; focus on textual analysis.
Step-by-Step Reasoning
Introduction: State the definitions and signal that you will assess both sides.
Arguments for switching:
- Efficiency: Markets allocate resources efficiently through prices. Planned economies suffer from rational ignorance and the calculation problem (Hayek).
- Innovation: Profit incentive drives innovation; central planning often stifles entrepreneurial activity.
- Consumer choice: Mixed economies offer variety; planned economies often have shortages and low-quality goods.
- Empirical evidence: The collapse of the Soviet bloc and the success of China (post-1978 reform) suggest that moving towards markets improves living standards.
Arguments against switching:
- Equity and welfare: Planned economies can provide universal access to healthcare, education, and housing. A mixed economy may still leave inequality.
- Government provision of public goods: A planned economy can directly allocate resources to infrastructure without the distortions of private provision.
- Transition costs: Privatisation can lead to corruption, unemployment, and social dislocation (e.g., Russia's 'shock therapy' in the 1990s).
- Not all mixed economies are successful: Some mixed economies suffer from heavy bureaucracy and inefficiency (e.g., India before 1991 reforms). The success depends on the quality of institutions.
Evaluation:
- Weigh the evidence: most countries that have introduced more market orientation have experienced growth (e.g., China, Vietnam, Eastern Europe). However, the process must be managed carefully.
- The 'always' is too strong. A planned economy with strong institutional capacity might not need a full switch; it could adopt market mechanisms gradually. Also, some sectors (health, education) may be better left to the state.
- The type of mixed economy matters: a social market economy (like Germany) combines market discipline with strong welfare state; a laissez-faire approach might increase inequality.
Conclusion: A planned economy should generally move towards a mixed economy to improve efficiency, but the transition should be context-specific and gradual. It is not an absolute imperative.
Key Takeaways
- Economic systems are compared on efficiency, equity, and ability to adapt.
- The absolute word 'always' in a question invites you to discuss exceptions and conditions.
- Balanced analysis of both sides is essential for top bands.
- Use real-world examples to support arguments (USSR vs. China, Russia's transition).
- The conclusion must be justified and address the specific wording.
Common Mistakes
- One-sided answer: only discussing the benefits of mixed economies and ignoring the downsides of transition or the merits of planning. This forfeits evaluation marks.
- No conclusion: or a vague conclusion that 'it depends' without saying what it depends on.
- Insufficient development: just listing advantages and disadvantages without explaining the mechanisms or providing context.
- Confusing planned economy with just 'government intervention' – a planned economy is centrally controlled; a mixed economy has both sectors.
- Not engaging with the word 'always'.
Things to Be Careful About
- Keep the focus on the switch from planned to mixed; do not drift into general discussion of market failure.
- Use precise economic terminology: allocative efficiency, calculation problem, privatisation, transition.
- Ensure that the evaluation is explicit: weigh the arguments and state your reasoning for the conclusion.
- The conclusion should not simply repeat the points; it should make a judgement based on the analysis.
- The mark scheme allows for a range of responses; accept that some planned economies may have succeeded (e.g., Cuba in healthcare) but discuss trade-offs.
With the help of a formula, explain what is meant by the income elasticity of demand for a product and consider the extent to which demand for the product will always rise at the same rate as the income of its consumers.
Answer
Income elasticity of demand (YED) measures the responsiveness of quantity demanded to a change in consumers' income. The formula is:
YED = % change in quantity demanded / % change in income
A positive YED indicates a normal good; a negative YED indicates an inferior good. For normal goods, if YED > 1, the good is a luxury (demand rises more than proportionally to income); if 0 < YED < 1, it is a necessity (demand rises less than proportionally).
The statement that demand will always rise at the same rate as income is not correct. For a necessity, demand rises slower than income; for a luxury, it rises faster; for an inferior good, demand falls as income rises. Additionally, YED may not be constant across all income levels; for example, a good may be a luxury at low incomes but become a necessity at higher incomes. Therefore, the extent to which demand rises at the same rate depends on the type of good and the income level. In conclusion, demand does not always rise at the same rate as income.
No, demand does not always rise at the same rate as income; it depends on the YED coefficient: for necessities (0<YED<1) demand rises slower, for luxuries (YED>1) faster, and for inferior goods (YED<0) demand falls as income rises.
Background Concept
Income elasticity of demand (YED) is a measure of how sensitive the quantity demanded of a good is to changes in consumers' income. It is calculated as the percentage change in quantity demanded divided by the percentage change in income. The sign and size of YED classify goods: positive YED for normal goods (demand rises as income rises), negative YED for inferior goods (demand falls as income rises). Among normal goods, if YED > 1, the good is a luxury (e.g., designer clothes); if 0 < YED < 1, it is a necessity (e.g., basic food). The Engel curve illustrates the relationship between income and quantity demanded.
Understanding the Question
The question asks you to explain YED using its formula and then evaluate the claim that demand for a product will always rise at the same rate as consumers' income. The command "consider the extent to which" requires you to assess whether this statement is always true. You need to show that the relationship depends on the type of good and that YED is not necessarily constant.
Approach
First, define YED and provide the formula. Then explain that the coefficient determines the nature of the good. Next, evaluate the statement by considering different YED values: for necessities, demand rises slower; for luxuries, faster; for inferior goods, demand falls. Also note that YED can change with income level. Conclude that the statement is not always true.
Step-by-Step Reasoning
- State the formula: YED = %ΔQd / %ΔY.
- Explain that a positive YED means normal good, negative means inferior.
- For normal goods, if YED > 1, demand rises more than proportionally; if 0<YED<1, less than proportionally.
- Evaluate the statement: If YED = 1, demand rises at same rate; but this is rare. Most goods have YED ≠ 1. For necessities, YED < 1; for luxuries, YED > 1; for inferior, YED < 0. So demand does not always rise at same rate.
- Additionally, YED may vary with income: a good may be a luxury at low income but become a necessity at high income, so the rate changes.
- Conclusion: The statement is not always correct; it depends on the good and income level.
Key Takeaways
- YED measures income sensitivity.
- Goods are classified as normal (positive YED) or inferior (negative YED).
- Normal goods can be necessities (0<YED<1) or luxuries (YED>1).
- Demand does not always rise proportionally with income; the rate depends on YED.
- Businesses use YED to forecast demand changes as the economy grows or contracts.
Common Mistakes
- Forgetting to include the formula when asked.
- Confusing YED with PED.
- Assuming YED is always positive (ignoring inferior goods).
- Not evaluating the statement; just describing YED.
- Giving a one-sided answer without a conclusion.
Things to Be Careful About
- Use the correct formula and explain it.
- Clearly distinguish between normal and inferior goods.
- For evaluation, provide a clear conclusion that addresses the "extent to which".
- Mention that YED can change over time or with income level.
- Use examples to illustrate (e.g., bread as necessity, luxury car as luxury).
Assess the extent to which price elasticity of supply or cross elasticity of demand is more useful to businesses.
Introduction
Price elasticity of supply (PES) measures the responsiveness of quantity supplied to a change in price, calculated as % change in quantity supplied / % change in price. Cross elasticity of demand (XED) measures the responsiveness of demand for one good to a change in the price of another good, calculated as % change in quantity demanded of good A / % change in price of good B. Both elasticities provide valuable information to businesses, but their usefulness varies.
Usefulness of PES to businesses
PES helps businesses plan production and manage inventory. A high PES indicates that the firm can quickly increase supply in response to a price rise, allowing it to capture additional revenue. For example, a manufacturer with spare capacity can ramp up output. Conversely, a low PES means supply is constrained, so the firm may need to hold larger stocks to meet demand. PES also informs investment decisions: if supply is inelastic, the firm may invest in capacity expansion. However, PES is an estimate and can change over time due to technological improvements or input availability.
Usefulness of XED to businesses
XED helps businesses understand their competitive environment. A positive XED indicates substitutes; a high positive value means close substitutes, so the firm must be sensitive to competitors' pricing. A negative XED indicates complements, so the firm can benefit from joint promotions or bundling. For example, a coffee shop with a high positive XED with a rival must match price cuts to avoid losing customers. XED also helps in pricing strategy, product differentiation, and identifying potential threats from new entrants.
Evaluation
Both elasticities are useful, but their relative importance depends on the business context. For a firm in a highly competitive market with many substitutes, XED is crucial for strategic pricing and marketing. For a firm with significant supply constraints, PES is more important for operational efficiency. XED may be more useful for long-term strategic decisions, while PES is more useful for short-term production planning. Additionally, both have limitations: PES may be difficult to calculate accurately, and XED may change rapidly as markets evolve.
Conclusion
Overall, cross elasticity of demand is arguably more useful to businesses because it provides insights into market structure and competitive dynamics, which are fundamental to pricing and product strategy. However, price elasticity of supply remains essential for production and inventory decisions. The extent to which one is more useful depends on the specific business and market conditions. In many cases, XED offers greater strategic value, but PES is indispensable for operational planning.
Cross elasticity of demand is generally more useful to businesses for strategic decision-making as it helps identify competitors and complements, but price elasticity of supply is more useful for operational planning; the relative importance depends on the market structure and the firm's objectives.
Background Concept
Price elasticity of supply (PES) measures how responsive the quantity supplied of a good is to a change in its price. It is calculated as the percentage change in quantity supplied divided by the percentage change in price. PES is positive (law of supply). A high PES (elastic) means supply can adjust quickly; a low PES (inelastic) means supply is relatively fixed in the short run. Factors affecting PES include time period, availability of inputs, spare capacity, and ease of storage.
Cross elasticity of demand (XED) measures how responsive the quantity demanded of one good is to a change in the price of another good. It is calculated as the percentage change in quantity demanded of good A divided by the percentage change in price of good B. A positive XED indicates substitutes; a negative XED indicates complements. The magnitude indicates the strength of the relationship.
Understanding the Question
The question asks you to assess which of PES or XED is more useful to businesses. The command "assess the extent to which" requires you to compare both concepts, evaluate their usefulness, and reach a justified conclusion. You need to discuss how each elasticity informs business decisions and then weigh their relative importance.
Approach
First, define both PES and XED. Then discuss the usefulness of PES: how it helps with production planning, inventory management, and investment. Then discuss the usefulness of XED: how it helps with pricing strategy, competitor analysis, and product positioning. Then evaluate: compare the two, noting that XED is more strategic while PES is more operational. Consider limitations. Conclude with a justified judgement on which is more useful overall, acknowledging that it depends on context.
Step-by-Step Reasoning
- Define PES and give formula: PES = %ΔQs / %ΔP. Explain that PES > 1 is elastic, PES < 1 is inelastic.
- Explain how PES is useful: a firm with elastic supply can respond quickly to price changes, increasing revenue. Inelastic supply may require holding stocks. PES helps in deciding whether to invest in capacity.
- Define XED and give formula: XED = %ΔQdA / %ΔPB. Explain that positive XED means substitutes, negative means complements.
- Explain how XED is useful: a firm can identify its main competitors (high positive XED) and adjust pricing accordingly. For complements, it can engage in joint promotions. XED helps in assessing the impact of competitors' price changes.
- Evaluate: Compare the two. XED is more useful for strategic decisions because it reveals market relationships. PES is more useful for operational decisions. In a competitive market, XED is critical; in a monopolistic market, PES may be more relevant. Both have limitations: PES may be hard to estimate, XED may change quickly.
- Conclusion: XED is generally more useful for strategic business decisions, but PES is essential for production planning. The answer depends on the firm's specific circumstances.
Key Takeaways
- PES measures supply responsiveness; XED measures cross-price responsiveness.
- Both elasticities inform different aspects of business decision-making.
- XED is key for understanding competition and market positioning.
- PES is key for production and inventory management.
- The relative usefulness depends on market structure and firm objectives.
Common Mistakes
- Writing a one-sided answer that only discusses one elasticity.
- Not comparing the two; just describing each separately.
- Failing to provide a conclusion or providing a vague conclusion.
- Not using examples to illustrate points.
- Confusing XED with PED or YED.
Things to Be Careful About
- Ensure balanced discussion of both PES and XED.
- Use specific examples (e.g., agricultural products for PES, Coca-Cola and Pepsi for XED).
- Clearly state which is more useful and justify why.
- Acknowledge that the answer may depend on context.
- Structure the essay logically with introduction, body, evaluation, and conclusion.
Explain three of the components of aggregate demand and consider the extent to which they may be increased without leading to inflation.
Answer
AO1: Three components of aggregate demand
Aggregate demand (AD) is the total planned spending on goods and services in an economy. Three components are:
- Consumption (C): spending by households on goods and services.
- Investment (I): spending by firms on capital goods and changes in stocks.
- Government spending (G): spending by the government on goods and services (excluding transfer payments).
AO2: Analysis of whether increases may lead to inflation
An increase in any component of AD shifts the AD curve to the right. Whether this causes inflation depends on the position of the economy on the aggregate supply (AS) curve.
- If the economy is operating below full capacity (on the Keynesian range of AS), an increase in AD leads to a rise in real output with little or no increase in the price level. Firms can increase production without raising wages or prices because there is spare capacity and unemployed resources.
- If the economy is at or near full capacity (on the classical range of AS), an increase in AD leads mainly to a rise in the price level (demand-pull inflation) because firms cannot increase output further and compete for scarce resources, driving up costs and prices.
Additionally, some components, particularly investment, may also increase aggregate supply in the long run by expanding productive capacity, which can offset inflationary pressure.
AO3: Evaluation and conclusion
The extent to which increases in AD components cause inflation depends crucially on the state of the economy. In a recession with high unemployment, increases in C, I, or G can boost output without inflation. However, if the economy is already at full employment, such increases are likely to be inflationary. Therefore, it is not possible to generalise; the impact varies with economic conditions. A justified conclusion is that increases in AD components can be achieved without inflation only when there is sufficient spare capacity; otherwise, they risk demand-pull inflation.
Increases in AD components can avoid inflation only when the economy has spare capacity; at full capacity they cause demand-pull inflation.
Background Concept
Aggregate demand (AD) is the total planned expenditure in an economy at a given price level. Its components are consumption (C), investment (I), government spending (G), and net exports (X-M). An increase in any component shifts the AD curve rightwards. The effect on the price level and real output depends on the shape of the aggregate supply (AS) curve. The AS curve is typically drawn with three ranges: Keynesian (horizontal at low output), intermediate (upward sloping), and classical (vertical at full capacity). In the Keynesian range, there is spare capacity, so increased AD raises output without inflation. In the classical range, the economy is at full capacity, so increased AD only raises prices (demand-pull inflation).
Understanding the Question
This question asks you to explain three components of AD and then consider the extent to which increases in these components may be achieved without causing inflation. The command word "explain" requires you to define and describe the components (AO1). The phrase "consider the extent to which" requires analysis (AO2) and evaluation (AO3). You must present both sides: when increases do not cause inflation (spare capacity) and when they do (full capacity). The mark scheme explicitly says that one-sided answers can only get 1 mark for AO2, so you must cover both scenarios.
Approach
First, select three components from C, I, G, X-M. Define each clearly. Then, explain the mechanism linking an increase in AD to inflation: a rightward shift of AD raises the price level if AS is inelastic. However, if AS is elastic (spare capacity), output rises instead. Also note that some components, like investment, can increase AS over time, reducing inflationary pressure. Finally, evaluate by comparing the two scenarios and reach a conclusion that the outcome depends on the state of the economy.
Step-by-Step Reasoning
-
Define AD and its components: Start by stating that AD = C + I + G + (X-M). Choose three components. For each, give a brief definition. For example, consumption is household spending on goods and services; investment is firm spending on capital; government spending is spending on goods and services by the government.
-
Explain the link to inflation: An increase in any component shifts AD right. Use an AD/AS diagram (in your mind) to illustrate. If the economy is in a recession (left of full employment), the AS curve is flat, so the price level stays constant and output rises. If the economy is at full employment, AS is vertical, so the price level rises and output stays constant. This is demand-pull inflation.
-
Consider the special case of investment: Investment not only increases AD but also adds to the capital stock, shifting LRAS right. This can increase productive capacity and allow non-inflationary growth. So investment may be less inflationary than consumption or government spending.
-
Evaluate: The key factor is the output gap. If there is a negative output gap (actual GDP < potential GDP), increases in AD are likely to be non-inflationary. If there is a positive output gap or full employment, they are inflationary. Also consider time lags and expectations. A justified conclusion: it is possible to increase AD without inflation only when there is spare capacity; otherwise, inflation is likely.
Key Takeaways
- AD components are C, I, G, X-M.
- The effect of an AD shift on inflation depends on the slope of AS.
- Spare capacity allows non-inflationary growth; full capacity leads to demand-pull inflation.
- Investment can also increase AS, reducing inflationary pressure.
- Evaluation requires considering both scenarios and reaching a conclusion based on economic conditions.
Common Mistakes
- Only explaining one scenario (e.g., only saying increases cause inflation) – this loses marks for AO2 and AO3.
- Not defining the components clearly – AO1 marks require accurate definitions.
- Confusing demand-pull with cost-push inflation – the question is about AD increases, so focus on demand-pull.
- Forgetting to mention that investment can increase AS – this is a key point for analysis.
- Providing a conclusion that is vague or not justified – the conclusion must state under what conditions inflation occurs.
Things to Be Careful About
- Use correct terminology: "aggregate demand", "spare capacity", "full employment", "demand-pull inflation".
- Ensure you cover exactly three components – do not list all four unless you explain three in detail.
- The mark scheme awards up to 3 marks for AO1 (one per component explained), so give a clear definition for each.
- For AO2, you need to explain both scenarios (spare capacity and full capacity) to get full marks.
- For AO3, you need a conclusion that is justified by the analysis – not just a summary.
- Do not include irrelevant information about cost-push inflation or other types of inflation.
The Chinese government has re-emphasised its commitment to rebalancing the economy from one focused mainly on investment and exports to one aiming to increase the proportion spent on domestic consumption.
Assess the extent to which it would be possible to achieve this by fiscal policy alone.
Introduction
The Chinese government aims to rebalance the economy from investment and export-led growth towards domestic consumption. Fiscal policy involves changes in government spending and taxation to influence aggregate demand. This essay assesses the extent to which fiscal policy alone can achieve this rebalancing.
Analysis of fiscal policy to boost consumption
Fiscal policy can increase domestic consumption through:
- Reducing direct taxes (e.g., income tax) to increase disposable income, thereby raising consumption.
- Increasing transfer payments (e.g., welfare benefits) to boost the incomes of lower-income households, who have a higher marginal propensity to consume.
- Increasing government spending on public services and infrastructure, which can directly create jobs and income, and indirectly raise consumption through the multiplier effect.
These policies shift the AD curve to the right, increasing real output and potentially raising consumption as a share of GDP.
Limitations of fiscal policy alone
However, fiscal policy alone faces several constraints:
- Crowding out: Increased government borrowing to finance tax cuts or spending may raise interest rates, reducing private investment and net exports, offsetting some of the increase in consumption.
- Time lags: Recognition, implementation, and impact lags mean that fiscal policy may take time to affect consumption, and by then economic conditions may have changed.
- Leakages: In an open economy like China, a significant portion of increased income may be saved or spent on imports, reducing the domestic consumption multiplier.
- Political constraints: Tax cuts may be politically difficult, and increased spending may lead to unsustainable budget deficits.
- Supply-side constraints: If the economy is at full capacity, increased AD may cause inflation rather than real output growth, and consumption may not rise in real terms.
Alternative policies
Monetary policy (e.g., lower interest rates) can stimulate consumption by reducing the cost of borrowing and encouraging spending. However, in China, monetary policy may be less effective if households are credit-constrained or if banks are reluctant to lend.
Supply-side policies (e.g., improving education, healthcare, and social safety nets) can reduce precautionary saving and increase the propensity to consume. They also increase productive capacity, allowing non-inflationary growth. Such policies address the root causes of low consumption, such as high saving rates due to inadequate social security.
Evaluation
Fiscal policy can provide a short-term boost to consumption, but its effectiveness is limited by crowding out, leakages, and time lags. Moreover, rebalancing requires a structural shift in the composition of demand, not just a temporary increase. Supply-side policies that improve social welfare and reduce uncertainty are likely to be more effective in raising the long-run propensity to consume. Monetary policy can complement fiscal policy but may be insufficient alone.
Conclusion
Fiscal policy alone is unlikely to achieve a sustainable rebalancing towards domestic consumption. While it can stimulate consumption in the short run, structural reforms (supply-side policies) are necessary to address the underlying causes of low consumption, such as high precautionary saving. A combination of fiscal, monetary, and supply-side policies is required to successfully rebalance the Chinese economy.
Fiscal policy alone is insufficient to rebalance the Chinese economy towards domestic consumption; a combination of fiscal, monetary, and supply-side policies is necessary.
Background Concept
Fiscal policy refers to the use of government spending and taxation to influence the economy. Expansionary fiscal policy (tax cuts or spending increases) shifts AD right, raising output and potentially the price level. However, its effectiveness depends on the multiplier, crowding out, and the state of the economy. Rebalancing an economy from investment/exports to consumption requires not just a temporary boost to AD but a structural change in the composition of demand. Supply-side policies aim to increase productive capacity and efficiency, while monetary policy influences AD through interest rates and credit conditions.
Understanding the Question
The question asks you to assess the extent to which fiscal policy alone can achieve rebalancing in China. The command word "assess" requires you to consider both the potential and the limitations of fiscal policy, compare it with other policies, and reach a justified conclusion. The mark scheme's top band requires detailed knowledge, developed analysis, and a justified conclusion. You must address the specific context of China: an economy with high saving rates, a large export sector, and a history of investment-led growth.
Approach
First, explain how fiscal policy can boost consumption (tax cuts, transfers, spending). Then, discuss the limitations (crowding out, lags, leakages, political constraints, supply-side constraints). Next, compare with alternative policies: monetary policy (interest rates) and supply-side policies (social safety nets, education). Finally, evaluate by weighing the strengths and weaknesses, and conclude that fiscal policy alone is insufficient; a mix is needed.
Step-by-Step Reasoning
-
Fiscal policy tools: Tax cuts increase disposable income, raising consumption. Transfer payments target low-income households with high MPC. Government spending creates jobs and income, with multiplier effects. These shift AD right, increasing output and potentially consumption's share.
-
Limitations:
- Crowding out: Government borrowing raises interest rates, reducing private investment and net exports, offsetting some AD increase.
- Time lags: Fiscal policy takes time to implement and affect the economy; by then, conditions may change.
- Leakages: In an open economy, increased income may be saved or spent on imports, reducing the domestic multiplier.
- Political constraints: Tax cuts may be unpopular or lead to deficits; spending increases may be inefficient.
- Supply-side constraints: If the economy is at full capacity, increased AD causes inflation, not real growth.
-
Alternative policies:
- Monetary policy: Lower interest rates reduce the cost of borrowing, encouraging consumption and investment. However, if households are credit-constrained or banks are risk-averse, the effect may be weak.
- Supply-side policies: Improving social security reduces precautionary saving, raising the MPC. Education and training increase productivity and wages, boosting consumption. These policies shift LRAS right, allowing non-inflationary growth.
-
Evaluation: Fiscal policy can provide a short-term boost, but structural change requires addressing the root causes of low consumption (high saving due to inadequate safety nets). Supply-side policies are more effective in the long run. Monetary policy can complement but is not sufficient alone. Therefore, fiscal policy alone is unlikely to achieve sustainable rebalancing.
Key Takeaways
- Fiscal policy can boost consumption in the short run but has limitations.
- Crowding out, lags, and leakages reduce its effectiveness.
- Supply-side policies address structural issues and are crucial for long-term rebalancing.
- A combination of policies is usually more effective than any single policy.
- The conclusion must be justified by the analysis.
Common Mistakes
- Only discussing fiscal policy without considering alternatives – the question asks "by fiscal policy alone", so you must compare with other policies.
- Ignoring the specific context of China (high saving, export-led growth).
- Providing a one-sided answer (only advantages or only disadvantages) – evaluation requires both sides.
- Failing to reach a clear conclusion – the top band requires a justified conclusion.
- Using vague terms like "it depends" without specifying on what.
Things to Be Careful About
- Use correct terminology: "crowding out", "multiplier", "leakages", "supply-side policies".
- Ensure the analysis is developed: explain the mechanisms, not just state them.
- The conclusion must address the specific question: "the extent to which it would be possible to achieve this by fiscal policy alone".
- Use examples from China if possible (e.g., high saving rate, large current account surplus).
- Organise the essay logically: introduction, analysis of fiscal policy, limitations, alternatives, evaluation, conclusion.
Explain three causes of unemployment and consider which cause is likely to be most damaging to a high-income economy.
Answer
AO1 Knowledge and understanding
- Cyclical (demand-deficient) unemployment occurs when there is a fall in aggregate demand (AD) in the economy, leading to a fall in the derived demand for labour. It is associated with the downturn of the economic cycle.
- Structural unemployment arises from a long-term change in the structure of the economy, such as the decline of a major industry or a mismatch between the skills workers have and those demanded by expanding industries. It involves occupational or geographical immobility of labour.
- Frictional unemployment is short-term unemployment that occurs when workers are between jobs, moving from one job to another, or entering the labour market for the first time. It is a natural feature of a dynamic labour market.
AO2 Analysis
- Cyclical unemployment can be very damaging in the short to medium term because it affects a large number of workers across many sectors simultaneously. It leads to a loss of output (negative output gap), a fall in household incomes, and a decline in aggregate demand, which can create a downward spiral. However, it is temporary and will typically fall as the economy recovers and AD increases.
- Structural unemployment is likely to be more damaging in the long term because it is persistent. Workers may lack the skills for growing industries or live in regions with few job opportunities. This leads to long-term unemployment, skill erosion, and social problems such as poverty and social exclusion. It reduces the economy's productive potential (LRAS) and is difficult to solve without significant retraining or relocation.
- Frictional unemployment is generally the least damaging. It is short-term and often reflects a healthy, dynamic economy where workers are seeking better matches for their skills. It can even be beneficial if it leads to higher productivity. It imposes low costs on the individual and the economy.
AO3 Evaluation
While cyclical unemployment can cause severe short-term hardship, it is a temporary feature of the business cycle and can be addressed by expansionary macroeconomic policy. Frictional unemployment is a low-cost, natural part of a functioning labour market. Structural unemployment is likely to be the most damaging to a high-income economy because it represents a permanent loss of human capital and productive capacity. It is difficult and costly to resolve, requiring long-term supply-side policies, and it can lead to persistent regional disparities and social decay, which are more damaging to long-run economic welfare than the temporary effects of a recession.
Structural unemployment is likely to be the most damaging to a high-income economy because it is persistent, reduces long-run productive capacity, and is difficult and costly to resolve, leading to long-term social and economic costs.
Background Concept
Unemployment refers to the number of people of working age who are actively seeking work but are not currently employed. The labour force includes both the employed and the unemployed. Economists classify unemployment by its cause, as the appropriate policy response depends on the type. The main types are:
- Cyclical (Demand-Deficient) Unemployment: This is caused by a lack of aggregate demand in the economy. When the economy is in a recession, firms face falling sales and reduce their output. As a result, they need fewer workers, so they lay off staff or stop hiring. This type of unemployment is directly linked to the economic cycle.
- Structural Unemployment: This occurs when there is a fundamental mismatch between the skills and location of workers and the requirements of available jobs. This can be caused by technological change (e.g., automation replacing manual jobs), the decline of a major industry (e.g., coal mining in the UK), or globalisation (e.g., manufacturing moving to lower-cost countries). It is often long-term and requires workers to retrain or relocate.
- Frictional Unemployment: This is the short-term unemployment that occurs when workers are between jobs. It includes new graduates looking for their first job, people who have quit a job to find a better one, and those who have been laid off but quickly find new work. It is a natural and inevitable part of a dynamic labour market.
- Seasonal Unemployment: This is a predictable change in employment that occurs at certain times of the year, such as ski instructors in winter or farm workers during harvest.
- Technological Unemployment: This is a form of structural unemployment where workers are displaced by technological advancements, such as automation or AI.
Understanding the Question
This is a point-based 8-mark question with a clear split: 3 marks for AO1 (knowledge), 3 marks for AO2 (analysis), and 2 marks for AO3 (evaluation). The question has two parts. First, you must 'explain three causes of unemployment'. This is the AO1 and AO2 component. You need to define and describe three distinct types. Second, you must 'consider which cause is likely to be most damaging to a high-income economy'. This is the AO3 component. You must compare the three types you have chosen and reach a justified conclusion about which is the most damaging. The phrase 'most damaging' requires you to establish a criterion for 'damage' (e.g., persistence, impact on long-run output, social cost) and then weigh the types against each other.
Approach
- Select three types: Choose three distinct types from the list. Cyclical, structural, and frictional are the most common and easiest to contrast. Avoid choosing two that are very similar (e.g., structural and technological).
- Structure for AO1/AO2: For each type, provide a clear definition (AO1) and then a brief analysis of why it is damaging (AO2). The analysis should be a short chain of reasoning. For example, for structural unemployment: 'Structural unemployment arises from a mismatch of skills -> workers cannot find jobs in growing sectors -> they become long-term unemployed -> their skills erode -> they become even harder to employ -> the economy's productive capacity falls.'
- Structure for AO3: The evaluation must be a comparative assessment. Do not just list the damage each causes. You must weigh them against each other. The mark scheme explicitly says 'in comparison with each other' and 'a justified conclusion as to which may be the most damaging'. Your conclusion must be a clear statement of which is most damaging and, crucially, WHY it is more damaging than the others.
Step-by-Step Reasoning
Step 1: Define and Analyse Cyclical Unemployment
- Definition: Cyclical unemployment is caused by a fall in aggregate demand (AD). In a recession, firms produce less, so they demand fewer workers. It is a symptom of a negative output gap.
- Analysis of Damage: It is damaging because it affects a large number of people at once, leading to a sharp fall in household income and consumption. This can create a negative multiplier effect, deepening the recession. It also represents a waste of the economy's resources (labour) and a loss of potential output. However, its key feature is that it is temporary. As the economy recovers and AD rises, cyclical unemployment will naturally fall.
Step 2: Define and Analyse Structural Unemployment
- Definition: Structural unemployment is caused by a long-term change in the structure of the economy. It is a mismatch between the supply of labour and the demand for labour, often due to a lack of relevant skills (occupational immobility) or living in the wrong place (geographical immobility).
- Analysis of Damage: This is highly damaging because it is persistent. Workers who lose their jobs in a declining industry may never find work in their local area again without significant retraining or relocation. Long-term unemployment leads to a loss of skills (hysteresis), making workers even less employable. It reduces the economy's productive capacity (shifts LRAS left) and leads to social problems like poverty, crime, and social exclusion. It is very difficult and costly for the government to solve.
Step 3: Define and Analyse Frictional Unemployment
- Definition: Frictional unemployment is the short-term unemployment that occurs when workers are between jobs. It is a natural part of a dynamic labour market.
- Analysis of Damage: This is the least damaging type. It is short-term, so the costs to the individual and the economy are low. In fact, it can be seen as a positive sign of a healthy economy, as workers are seeking better job matches, which can lead to higher productivity in the long run. The main cost is the small amount of output lost during the job search.
Step 4: Evaluate and Conclude (AO3)
- Comparison: Cyclical unemployment is severe but temporary. Frictional unemployment is minor and often beneficial. Structural unemployment is severe AND permanent (or very long-lasting).
- Criterion for 'most damaging': The most appropriate criterion for a high-income economy is the long-term impact on the economy's productive potential and the welfare of its citizens.
- Justified Conclusion: On this basis, structural unemployment is the most damaging. While a recession (cyclical) causes immediate pain, the economy will eventually recover. Structural unemployment, however, represents a permanent loss of human capital and a reduction in the economy's ability to grow. It creates 'hysteresis' where the long-term unemployed become detached from the labour force, permanently reducing the potential output. The costs of retraining and regional regeneration are high and take a long time to bear fruit. Therefore, for a high-income economy seeking to maintain its standard of living, structural unemployment poses the greatest long-term threat.
Key Takeaways
- You must be able to define and distinguish between the main types of unemployment.
- For an 'explain' question, you need to provide a definition (AO1) and a causal chain of reasoning (AO2).
- For a 'consider' or 'evaluate' component, you must compare the options and reach a justified conclusion. A simple list of pros and cons is not enough.
- The quality of your conclusion depends on the criterion you use to make your judgement. State the criterion explicitly.
Common Mistakes
- Listing four types: The question asks for 'three causes'. Explaining four or five does not gain extra marks and wastes time. Focus on developing three well.
- Describing without analysing: A common mistake is to just define the types (e.g., 'Structural unemployment is when...'). You must also explain WHY it is damaging. This is the analysis part.
- One-sided evaluation: The 'consider' clause requires a comparison. An answer that only explains why structural unemployment is damaging, without comparing it to the others, would not score the full 2 evaluation marks.
- No conclusion: The mark scheme explicitly reserves a mark for a 'justified conclusion'. An answer that compares the types but does not state which is most damaging will lose this mark.
- Vague conclusion: A conclusion like 'It depends on the situation' is not a justified conclusion. You must make a clear judgement and support it with reasoning.
Things to Be Careful About
- Use the correct terminology: Use terms like 'derived demand', 'occupational immobility', 'hysteresis', and 'negative output gap' to demonstrate your knowledge.
- Focus on a 'high-income economy': The question specifies this context. A high-income economy has a different structure (more services, less manufacturing) and different social safety nets than a low-income economy. Your analysis should be relevant to this context. For example, structural unemployment in a high-income economy might be more about deindustrialisation and the skills gap for the digital economy.
- Time management: This is an 8-mark question. Spend about 10-12 minutes on it. Do not write an essay. Be concise and direct.
Assess which expansionary macroeconomic policy would be most likely to enable a government to meet its economic objective of a low rate of unemployment.
Introduction
Unemployment is a key macroeconomic objective for governments. Expansionary macroeconomic policies aim to increase aggregate demand (AD) or aggregate supply (AS) to reduce unemployment. This essay will assess the likely effectiveness of expansionary monetary policy, expansionary fiscal policy, and supply-side policy in achieving a low rate of unemployment, concluding that a combination of policies is most effective, but supply-side policy is most likely to achieve a sustainable reduction.
Expansionary Monetary Policy
Expansionary monetary policy involves a central bank reducing interest rates or increasing the money supply. Lower interest rates reduce the cost of borrowing for firms and households. This stimulates consumption (C) and investment (I), two components of AD. The increase in AD shifts the AD curve to the right, from AD1 to AD2, leading to an increase in real output (Y) and, via the derived demand for labour, a reduction in cyclical unemployment.
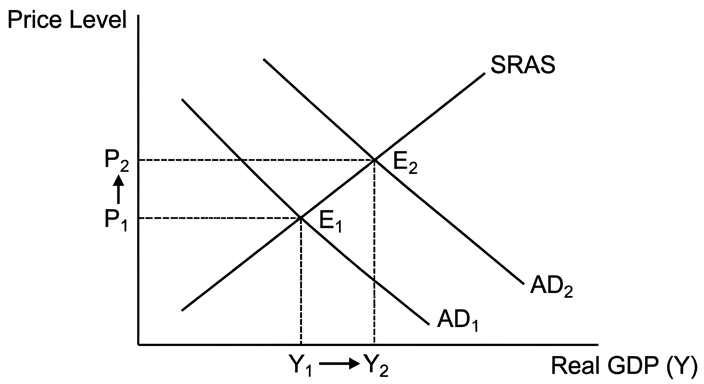
However, this policy is less effective against structural unemployment, as it does not address skills mismatches. Furthermore, if the economy is already close to full capacity, the increase in AD may be largely inflationary, with little impact on output and employment. The effectiveness also depends on the interest elasticity of investment and consumption; if firms are pessimistic, they may not borrow even at low rates (a 'liquidity trap').
Expansionary Fiscal Policy
Expansionary fiscal policy involves the government increasing its spending (G) or cutting taxes. Higher government spending directly increases AD, while tax cuts increase disposable income, boosting consumption (C). This also shifts the AD curve to the right, increasing output and reducing cyclical unemployment. The impact can be amplified by the multiplier effect, as the initial injection of spending circulates through the economy.
However, expansionary fiscal policy can lead to a budget deficit and an increase in the national debt. This may 'crowd out' private sector investment if the government borrows from the same pool of funds, raising interest rates. Like monetary policy, it is primarily effective against cyclical, not structural, unemployment. There are also significant time lags in implementing fiscal policy (e.g., passing a budget).
Supply-Side Policy
Supply-side policies aim to increase the economy's productive capacity by shifting the LRAS curve to the right. Policies such as investment in education and training directly tackle structural unemployment by improving the occupational mobility of labour. This reduces the skills mismatch, making workers more employable in growing industries. Improved infrastructure can also increase geographical mobility. By increasing the potential output of the economy, supply-side policies can achieve a sustainable reduction in unemployment without causing inflation.
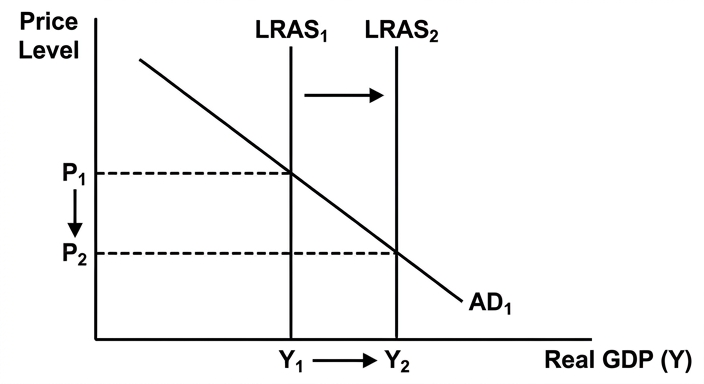
However, supply-side policies are typically long-term and costly. The benefits of retraining programmes may take years to materialise. They are also less effective in the short run at tackling a sudden rise in cyclical unemployment caused by a recession.
Evaluation
Expansionary monetary and fiscal policies are effective at reducing cyclical unemployment in the short run, but they are blunt tools that can cause inflation and do not address the root causes of structural unemployment. Supply-side policies are more targeted and can reduce unemployment sustainably, but they are slow-acting and expensive. The most appropriate policy depends on the type of unemployment. For a high-income economy with a significant structural unemployment problem, supply-side policies are essential for a long-term solution. However, they may need to be complemented by expansionary demand-side policies in the short run to provide jobs for those being retrained.
Conclusion
While expansionary demand-side policies can provide a quick boost to employment, they are unlikely to be the most effective policy for achieving a low rate of unemployment in the long term. Supply-side policy, particularly investment in education and training, is most likely to enable a government to meet its objective of a low rate of unemployment because it directly addresses the skills mismatches that cause structural unemployment, which is the most persistent and damaging form of unemployment in a high-income economy. A combination of policies, using demand-side measures to manage the economic cycle and supply-side measures to boost potential output, is the most effective overall strategy.
Supply-side policy, particularly investment in education and training, is most likely to enable a government to meet its objective of a low rate of unemployment because it directly addresses the root causes of structural unemployment, which is the most persistent and damaging form in a high-income economy, and can achieve a sustainable reduction without causing inflation.
Background Concept
This question is about the three main types of macroeconomic policy and their effectiveness in tackling unemployment.
- Expansionary Monetary Policy: This is conducted by the central bank. The main tool is the policy interest rate. Lowering the interest rate makes borrowing cheaper and saving less attractive. This is intended to boost consumption (C) and investment (I), increasing Aggregate Demand (AD). The central bank can also engage in quantitative easing (increasing the money supply) to lower long-term interest rates and encourage lending.
- Expansionary Fiscal Policy: This is conducted by the government. It involves increasing government spending (G) or cutting taxes. Higher G directly adds to AD. Tax cuts increase households' disposable income, boosting C, and can increase firms' post-tax profits, boosting I. This also increases AD. The increase in AD can be amplified by the multiplier effect.
- Supply-Side Policy: These policies aim to increase the economy's productive capacity by shifting the Long-Run Aggregate Supply (LRAS) curve to the right. They include policies to improve labour productivity (education, training), increase competition (deregulation, privatisation), improve infrastructure, and reduce the natural rate of unemployment. They are the only policies that can directly tackle structural unemployment.
Understanding the Question
This is a levels-marked 12-mark essay (AO1+AO2 out of 8, AO3 out of 4). The command word is 'Assess', which requires you to weigh up the arguments for and against different policies and reach a justified conclusion. The question asks you to 'Assess which expansionary macroeconomic policy would be most likely to enable a government to meet its economic objective of a low rate of unemployment.'
Key points to note:
- 'Expansionary macroeconomic policy': You must discuss policies designed to expand the economy. This includes expansionary monetary and fiscal policy (demand-side) and supply-side policy (which expands the economy's capacity).
- 'Which... would be most likely': This is a comparative question. You must discuss at least two policies and compare their effectiveness. A one-sided answer that only discusses one policy will not score well on evaluation.
- 'Most likely to enable': This requires you to consider the conditions under which each policy is effective. For example, monetary policy is more likely to work if confidence is high and banks are willing to lend. Fiscal policy is more likely to work if there is spare capacity in the economy.
- 'Low rate of unemployment': The ultimate goal is to reduce unemployment. You must link each policy to its specific impact on different types of unemployment (cyclical vs. structural).
The top band for AO1/AO2 requires 'detailed knowledge and understanding', 'fully developed explanations', and 'accurate and relevant use of analytical tools such as diagrams'. The top band for AO3 requires a 'justified conclusion' and 'developed, reasoned and well-supported evaluative comment(s)'.
Approach
- Introduction: Briefly define the key terms (unemployment, expansionary policy) and state the structure of your essay. You can also state your final conclusion here to give the essay direction.
- Analyse Policy 1 (e.g., Expansionary Monetary Policy):
- Explain the mechanism: lower interest rates -> higher C and I -> AD shifts right -> higher output -> lower cyclical unemployment.
- Use an AD/AS diagram to illustrate this.
- Analyse its limitations: ineffective against structural unemployment, potential for inflation, liquidity trap, time lags.
- Analyse Policy 2 (e.g., Expansionary Fiscal Policy):
- Explain the mechanism: higher G or lower taxes -> AD shifts right -> higher output -> lower cyclical unemployment.
- Discuss the multiplier effect.
- Analyse its limitations: budget deficit, national debt, crowding out, time lags, ineffective against structural unemployment.
- Analyse Policy 3 (e.g., Supply-Side Policy):
- Explain the mechanism: better training -> more skilled workers -> lower structural unemployment -> LRAS shifts right -> higher potential output.
- Use an AD/AS diagram to show the LRAS shift.
- Analyse its limitations: long time lags, high cost, may not help in the short run.
- Evaluation:
- Compare the policies directly. Which is best for cyclical unemployment? Which is best for structural unemployment? Which has the fewest negative side effects? Which works fastest?
- Consider the context of a 'high-income economy'. Such economies often have a significant structural unemployment problem (e.g., deindustrialisation, automation).
- Argue that a combination of policies is often best, but if you must choose one, supply-side policy is most likely to achieve a sustainable reduction in the long run.
- Conclusion: State your final, justified judgement. This must directly answer the question: 'Which policy would be most likely...?'
Step-by-Step Reasoning
Step 1: Analyse Expansionary Monetary Policy
- Mechanism: The central bank cuts the policy interest rate. This reduces the cost of borrowing for firms (to finance investment) and households (to finance consumption of durables like cars and houses). It also reduces the incentive to save. The resulting increase in C and I shifts the AD curve to the right. In the short run, assuming the economy is operating below full employment, this leads to an increase in real GDP (Y) and a higher price level (P). The increase in output leads to an increase in the derived demand for labour, reducing cyclical unemployment.
- Limitations:
- Ineffective against structural unemployment: It does nothing to help a steelworker whose skills are no longer needed.
- Liquidity Trap: If confidence is very low (e.g., during a deep recession), firms may not want to borrow even at zero interest rates, and households may prefer to save. The policy becomes ineffective.
- Inflation: If the economy is near full capacity, the increase in AD will mainly cause inflation, not higher output.
- Time Lags: There is an 'outside lag' – it takes time for lower interest rates to feed through into actual spending decisions.
Step 2: Analyse Expansionary Fiscal Policy
- Mechanism: The government increases its spending (e.g., on infrastructure projects) or cuts taxes. Higher G directly injects money into the circular flow. Tax cuts increase disposable income, leading to higher C. This shifts AD to the right. The initial increase in spending can be amplified by the multiplier effect (e.g., a new road project pays workers, who then spend their wages in local shops, who then hire more staff). This reduces cyclical unemployment.
- Limitations:
- Crowding Out: To finance the spending, the government may need to borrow. This increases the demand for loanable funds, pushing up interest rates. Higher interest rates can then 'crowd out' private sector investment, partially offsetting the initial boost to AD.
- Budget Deficit and National Debt: Persistent deficits can lead to a growing national debt, which may be unsustainable and lead to higher taxes in the future.
- Time Lags: There are significant 'inside lags' – it takes time to decide on, approve, and implement new spending programmes.
- Ineffective against structural unemployment: Like monetary policy, it mainly addresses cyclical unemployment.
Step 3: Analyse Supply-Side Policy
- Mechanism: A policy like government-funded retraining programmes helps workers in declining industries acquire the skills needed for growing sectors (e.g., from manufacturing to IT). This reduces occupational immobility, a key cause of structural unemployment. The unemployed workers become more employable, reducing the natural rate of unemployment. This shifts the LRAS curve to the right, meaning the economy can produce more output at any given price level. This can reduce unemployment without causing inflation.
- Limitations:
- Long Time Lags: The benefits of retraining take years to materialise. It is not a quick fix for a recession.
- High Cost: These policies are expensive and may not be politically popular.
- Effectiveness: The success of retraining depends on the quality of the programmes and whether there is actual demand for the new skills.
Step 4: Evaluation and Conclusion
- Comparison: Demand-side policies (monetary and fiscal) are effective 'sticking plasters' for cyclical unemployment. They can boost the economy quickly but have side effects (inflation, debt) and do not solve the underlying problem of structural unemployment. Supply-side policy is a 'surgical' solution for structural unemployment, but it is slow and expensive.
- Context: The question asks about a government's objective of a 'low rate of unemployment'. A low rate is not just about avoiding recessions; it is about having a labour market where most people who want to work can find it. In a high-income economy, structural unemployment is often the biggest barrier to achieving this, as the economy is constantly evolving.
- Justified Conclusion: Therefore, while demand-side policies are necessary to manage the economic cycle, supply-side policy is most likely to enable a government to meet its objective of a low rate of unemployment in the long term. It is the only policy that directly reduces the natural rate of unemployment and increases the economy's productive potential. A government that relies only on demand-side policies will find that unemployment becomes 'sticky' at a higher rate due to structural factors. The best strategy is a combination, but for a sustainable low rate, supply-side policy is the most important.
Key Takeaways
- For an 'assess' question, you must discuss at least two sides of the argument and reach a justified conclusion.
- You must use AD/AS analysis to show the impact of each policy. A diagram is expected for a top-band answer.
- Distinguish clearly between demand-side policies (affecting AD) and supply-side policies (affecting LRAS).
- Link each policy to the specific type of unemployment it is best at solving.
- Your conclusion must be a clear, reasoned judgement, not a summary of both sides.
Common Mistakes
- One-sided answer: Only discussing the benefits of one policy without considering its drawbacks or alternative policies. This will cap the mark at Level 2 for AO1/AO2 and score 0 for AO3.
- No diagrams: The top band requires 'accurate and relevant use of analytical tools such as diagrams'. An answer without a diagram cannot reach the top band.
- Descriptive rather than analytical: Simply describing what monetary policy is, without explaining the chain of reasoning from the policy to the reduction in unemployment.
- Vague conclusion: A conclusion like 'It depends on the situation' is not a justified conclusion. You must make a clear choice and explain why.
- Ignoring the question: Discussing the policies in general without linking them back to the specific objective of reducing unemployment.
Things to Be Careful About
- Label your diagrams correctly: Axes (Price Level, Real GDP), curves (AD1, AD2, SRAS, LRAS1, LRAS2), and equilibrium points (Y1, Y2, P1, P2). Explain the diagram in the text.
- Use economic terminology: Use terms like 'derived demand', 'multiplier effect', 'crowding out', 'liquidity trap', 'natural rate of unemployment', 'hysteresis'.
- Focus on the 'most likely': Your evaluation should weigh the likelihood of success. For example, monetary policy is 'likely' to work if the banking system is functioning, but 'unlikely' if there is a liquidity trap.
- Time management: This is a 12-mark question. Spend about 18-20 minutes on it. Plan your essay before you start writing.