Economics 9708/13 — May/June 2024
Cambridge AS Level · AS Level Multiple Choice · answer key with instant marking and worked solutions
Topics Demand and Supply · International Trade and Comparative Advantage · Classification of Goods and Services · Price Elasticity of Supply · Market Equilibrium and the Price Mechanism · Elasticities of Demand · +17 more
Tap an option under each question to check it — your score builds as you go.
What is not an example of a public good?
Options
A education
B flood control systems
C national defence
D street lighting
Reasoning
A public good must be both non-rival and non-excludable. Education is a private good because it is rival (one person's consumption reduces availability for others) and excludable (schools can charge fees or restrict admission). Flood control systems, national defence, and street lighting are all non-rival and non-excludable, making them public goods. Therefore, education is not a public good.
Answer
A
A
Background Concept
Public goods are defined by two key characteristics: non-rivalry and non-excludability. Non-rivalry means that one person's consumption of the good does not reduce the quantity available for others; the marginal cost of providing the good to an additional person is zero. Non-excludability means that once the good is provided, it is impossible or very costly to prevent anyone from benefiting from it, even if they do not pay. These two features give rise to the free-rider problem, where individuals can enjoy the benefits without paying, leading to under-provision by private markets. Public goods are therefore often provided by the government. Examples include national defence, street lighting, flood control systems, and lighthouses.
Understanding the Question
The question asks which of the four options is NOT an example of a public good. The correct answer is the one that lacks the characteristics of non-rivalry and non-excludability. This is a straightforward recognition question: the student must know the definition of a public good and identify the option that does not fit.
Approach
We will examine each option and determine whether it satisfies non-rivalry and non-excludability. Then pick the one that does not.
Step-by-Step Reasoning
- A: Education. Education is a service provided to students. It is rival: if a teacher instructs one student, they cannot simultaneously provide the same level of individual attention to another student. Moreover, it is excludable: schools can charge tuition fees, and students can be denied access if they do not pay. Therefore, education is a private good (or sometimes considered a merit good, but not a public good). So A is correct.
- B: Flood control systems. A flood control system, such as a dam or levee, once built, protects all residents in the area from flooding. The benefit is non-rival: one person's protection does not reduce the protection available to others. It is also non-excludable: it is not practical to exclude individual households from the protection (you cannot selectively protect only paying customers). Therefore, flood control is a public good.
- C: National defence. The classic example of a public good. The military protects all citizens regardless of whether they pay taxes. Defence is non-rival: protecting one person does not reduce protection for others. It is also non-excludable: once provided, everyone benefits and cannot be excluded. So it is a public good.
- D: Street lighting. Street lighting provides illumination that anyone passing by can use. One person's use of light does not reduce the light for others (non-rival). It is also difficult to charge users individually or exclude non-payers (non-excludable). Thus, street lighting is a public good.
Therefore, the only option that is not a public good is A: education.
Key Takeaways
- Public goods have two essential characteristics: non-rivalry and non-excludability.
- Common examples include national defence, street lighting, flood control systems, lighthouses, and clean air.
- Private goods are rival and excludable. Merit goods are private goods that are considered beneficial and often subsidised, but they are not public goods.
- The free-rider problem leads to under-provision of public goods by the private sector.
Common Mistakes
- Assuming that any good or service provided by the government is a public good. Governments also provide private goods (education, healthcare) and merit goods.
- Confusing merit goods (like education) with public goods. Education is a private good with positive externalities, not a public good.
- Thinking that flood control is not a public good because it might be excludable in some contexts. In principle, flood control typically exhibits non-excludability.
- Forgetting that street lighting is non-excludable in practice: it would be prohibitively costly to install coin-operated lights that turn off if a payment is not made.
Things to Be Careful About
- Always check both criteria: non-rivalry AND non-excludability. A good that is non-rival but excludable (like a cable TV channel) is not a public good — it's a club good or natural monopoly good.
- Some public goods may have aspects that are not pure; for instance, a highway may be congested (rivalry) but still non-excludable. But in its pure form, a public good is strictly non-rival and non-excludable. The question uses classic examples.
- The question asks for what is NOT a public good. Be careful to pick the option that fails one or both criteria.
The diagram shows a production possibility curve for an economy that produces two goods, X and Y.
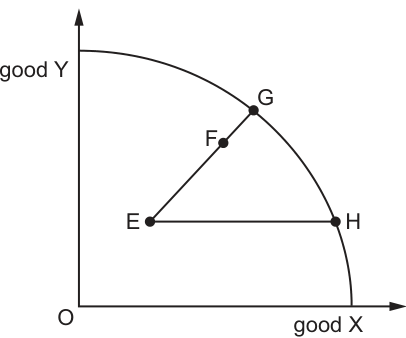
When will the opportunity cost of producing more of good X be the largest?
Options
A moving from point E to point F
B moving from point E to point G
C moving from point E to point H
D moving from point G to point H
Working
A production possibility curve (PPC) is concave to the origin, which reflects the law of increasing opportunity cost: as an economy produces more of one good, it must give up increasing quantities of the other good, as resources are not equally suited to producing both goods.
- Movements starting from point E (which lies inside the PPC) use idle/unemployed resources, so there is no opportunity cost of producing more X, as no Y needs to be sacrificed.
- Movements along the PPC itself involve opportunity cost. The opportunity cost of producing more X is equal to the amount of Y given up, represented by the absolute value of the slope of the PPC. The further right along the X-axis the movement occurs, the steeper the PPC becomes, so the higher the opportunity cost of X.
- Moving from G to H is the movement furthest to the right along the X-axis, so it has the largest opportunity cost of producing more X.
Answer
D
D
Background Concept
A production possibility curve (PPC) is a model that shows the maximum possible combinations of two goods an economy can produce given its fixed quantity of resources, fixed state of technology, and assumption that all resources are used efficiently (full employment). The curve is typically concave (bowed out) from the origin, which illustrates the law of increasing opportunity cost.
Opportunity cost is the value of the next best alternative that is forgone when a choice is made. Along a PPC, the opportunity cost of producing one more unit of good X is the amount of good Y that must be given up. This is represented by the slope of the PPC: the steeper the curve (the larger the absolute value of the change in Y divided by the change in X), the higher the opportunity cost of X.
The concave shape arises because resources are heterogeneous: they are not equally productive in producing both goods. When an economy is producing very little of good X, it can shift resources from Y production to X production that are well-suited to making X, so the opportunity cost of X is low. As production of X increases, the economy has to start shifting resources that are better suited to making Y, so each additional unit of X requires giving up more and more Y. This is why the PPC gets steeper as you move right along the X-axis, and flatter as you move up the Y-axis.
A point inside the PPC (like point E in the diagram) represents a situation where the economy is not using all its resources efficiently — there is unemployment or underused capacity. In this case, the economy can increase production of one or both goods without having to give up any of the other, because it is not operating at its maximum potential.
Understanding the Question
The question provides a diagram of a concave PPC for an economy producing two goods: X (horizontal axis) and Y (vertical axis). Four points are marked: E is inside the curve, while F, G and H lie on the curve. The question asks which of the four listed movements has the largest opportunity cost of producing more of good X.
The core task is to apply the PPC opportunity cost rule to the given diagram: first, eliminate movements that do not involve opportunity cost, then compare the opportunity costs of the remaining movements using the shape of the PPC. The question is a 1-mark multiple choice, so it tests basic recall and application of the increasing opportunity cost concept.
Approach
To solve this, follow two steps:
- First, eliminate any movements that start from a point inside the PPC. Movements from an interior point like E to the curve use idle resources, so no Y is given up to produce more X — these have an opportunity cost of zero.
- For movements that start and end on the PPC, use the concave shape rule: the further right along the X-axis the movement goes, the steeper the PPC, so the higher the opportunity cost of X. The movement that is furthest right will have the largest opportunity cost.
Step-by-Step Reasoning
- First, assess each option against the PPC rules:
- Option A (E to F): E is inside the PPC, so the economy has unused resources. Moving to F (on the curve) allows more X to be produced without reducing Y output, as the idle resources are put to work. Opportunity cost of X here is 0.
- Option B (E to G): Again, E is inside the curve. The economy can increase production of both X and Y by using its unused resources, so no Y is sacrificed to get more X. Opportunity cost is 0.
- Option C (E to H): E is inside, so moving horizontally to H increases X output with no change in Y, as the economy is still using its idle resources. Opportunity cost is 0.
- Option D (G to H): Both G and H are on the PPC, so the economy is already operating at full efficiency. To move from G to H, it must shift resources from Y production to X production. Since this movement is the furthest right along the X-axis, it occurs on the steepest part of the concave PPC. This means each additional unit of X requires giving up more Y than would be required at any point further left on the curve, so the opportunity cost of X is highest here.
- Since options A, B and C all have zero opportunity cost, and option D has the highest opportunity cost of the remaining movements, D is the correct answer.
Key Takeaways
- The PPC illustrates trade-offs and opportunity cost only when the economy is operating on the curve (full efficiency). Movements from inside the curve to the curve do not involve trade-offs, as they use idle resources.
- A concave PPC reflects increasing opportunity cost: the opportunity cost of producing more of a good rises as you produce more of it, because resources are not equally suited to all production.
- The opportunity cost of good X is measured by the amount of Y given up, so a steeper PPC (larger absolute slope) means a higher opportunity cost of X.
Common Mistakes
- Assuming all movements on the diagram have an opportunity cost: many students forget that points inside the PPC represent unused resources, so moving from inside to the curve does not require sacrificing any output of the other good.
- Misreading the slope of the PPC: some students incorrectly think a flatter slope means higher opportunity cost of X, but the opposite is true: a steeper slope (more vertical) means you give up more Y per extra X, so higher opportunity cost of X.
- Not using the concave shape rule: students might pick a movement further left on the curve, not realising that opportunity cost increases as you move right along the X-axis.
Things to Be Careful About
- Always check the position of the starting point first: if it is inside the PPC, the movement has zero opportunity cost, so it can be eliminated immediately for questions asking about opportunity cost of producing more of a good.
- Remember that the opportunity cost of the good on the horizontal axis (X) rises as you move right along the curve, while the opportunity cost of the good on the vertical axis (Y) rises as you move up the curve.
- For multiple choice questions on PPC opportunity cost, eliminate the interior point movements first, then compare the positions of the remaining movements along the relevant axis to find the highest opportunity cost.
Which activity illustrates the consumption of a ‘free’ good?
Options
A a farmer using water taken from a river
B a patient visiting a medical facility provided by a charity
C a person breathing air in the countryside
D a person eating their birthday cake given as a gift by a friend
Answer
A free good has no opportunity cost because it is not scarce. Air in the countryside is abundant and non-rival, so breathing it involves no sacrifice of alternative uses. Water from a river is typically scarce (alternative uses), a charity medical facility uses scarce resources, and a birthday cake required scarce inputs; all are economic goods. Therefore, only option C is correct.
C
C
Background Concept
In economics, goods are classified by scarcity. A free good has zero opportunity cost because its supply is abundant relative to demand – examples include air, sunshine, and seawater. An economic good (private good) is scarce: its use involves an opportunity cost because the resources used to produce or provide it could be used elsewhere.
Understanding the Question
This is a multiple-choice question asking which activity represents the consumption of a free good. To answer, we examine each scenario and check whether the good being consumed is scarce (has alternative uses) or not. The correct answer is the one where the good is abundant and has no opportunity cost.
Approach
Go through each option and apply the definition of a free good. A good is free if its supply is so abundant that using a unit does not reduce the amount available for others (non-rival) and there is no opportunity cost. If the good is scarce and has alternative uses, it is an economic good.
Step-by-Step Reasoning
- Option A: a farmer using water taken from a river. Water is typically a scarce resource, especially where there is competition for irrigation, drinking, and industrial use. The farmer's use of water prevents others from using that same water, so there is an opportunity cost. Therefore, this is an economic good.
- Option B: a patient visiting a medical facility provided by a charity. The facility uses scarce resources: doctors' time, medical equipment, medicines. Using these resources for one patient means they are not available for another, so there is an opportunity cost. Even though the service is free at the point of use, the good itself is scarce – an economic good.
- Option C: a person breathing air in the countryside. Air is abundant; one person's breathing does not reduce the amount of air available for others. There is no alternative use sacrificed, so the opportunity cost is zero. This is the classic example of a free good.
- Option D: a person eating their birthday cake given as a gift by a friend. The cake required scarce ingredients (flour, sugar, etc.) and labour to produce. The friend could have used those resources for something else, so the cake carries an opportunity cost. It is an economic good, even though the recipient did not pay for it.
Only option C meets the definition of a free good.
Key Takeaways
- A free good is defined by zero opportunity cost due to abundance, not by a zero price.
- Many goods that appear 'free' (e.g., charity services, gifts) are actually economic goods because they use scarce resources.
- The distinction is fundamental to understanding the basic economic problem of scarcity.
Common Mistakes
- Confusing 'free at the point of use' with a free good. Charity medical care (B) and a gift cake (D) are free to the consumer but not free in the economic sense.
- Assuming that water from a river is always a free good. In most contexts, water is a scarce resource with competing uses, making it an economic good.
- Forgetting that a free good must be abundant relative to demand – even goods like air can become economic goods in polluted or enclosed environments, but the scenario specifies 'air in the countryside', which is abundant.
Things to Be Careful About
- Read each scenario carefully: the wording often provides clues about scarcity. 'Using water from a river' suggests the water has an alternative use, unlike 'breathing air'.
- The definition of a free good hinges on opportunity cost, not on whether money changes hands. A gift or charity service can still involve opportunity cost.
- In MCQs, eliminate options that clearly involve scarce resources; the outlier is often the correct answer.
What is essential to eliminate scarcity?
Options
A the existence of sufficient resources to meet all needs and wants
B producers consistently produce in excess of demand
C the government has a surplus budget
D there is equilibrium in all markets
Reasoning
Scarcity arises from the fundamental economic problem of limited resources and unlimited wants. Eliminating scarcity requires that resources are sufficient to meet all wants, which is option A.
Answer
A
A
Background Concept
Scarcity is the basic economic problem: limited resources to satisfy unlimited wants. It necessitates choice and opportunity cost. Scarcity cannot be eliminated by producing more or by government policy; it is a condition of existence.
Understanding the Question
The question asks for the essential condition to eliminate scarcity. This is a definitional question testing whether the student understands that scarcity is about the relationship between resources and wants.
Approach
Identify the definition of scarcity and then match the option that addresses the root cause. Evaluate each option against this definition.
Step-by-Step Reasoning
- Scarcity: wants exceed available resources.
- To eliminate scarcity, resources must be sufficient to meet all wants. Option A says exactly that.
- Option B: producing in excess of demand does not eliminate scarcity; it may cause waste but scarcity still exists because there are other wants not met.
- Option C: government surplus budget is unrelated to the resource-want gap.
- Option D: market equilibrium is about price and quantity, not about the overall availability of resources to meet all wants.
Key Takeaways
Scarcity is a fundamental condition; it is not something that can be eliminated by economic policies or market outcomes. Understanding this is crucial for the rest of economics.
Common Mistakes
- Confusing scarcity with shortage (a temporary market condition). Scarcity is permanent.
- Thinking that economic growth eliminates scarcity (it reduces it but does not eliminate because wants are unlimited).
- Believing that equilibrium eliminates scarcity.
Things to Be Careful About
- Scarcity is about the relationship between resources and wants, not about the amount of production.
- Option A is the only one that directly addresses that relationship.
What will encourage a higher degree of division of labour?
Options
A firms wishing for a greater level of self-sufficiency
B firms wishing to increase their flexibility in production
C firms wishing to raise their level of productivity
D firms wishing to reduce their level of risk
Answer
Division of labour involves breaking down the production process into smaller, specialised tasks. The primary purpose of this specialisation is to raise productivity, as workers become quicker and more skilled at their specific task, reducing time lost switching between tasks and allowing for the use of specialised machinery. Therefore, a firm wishing to raise its level of productivity would be encouraged to adopt a higher degree of division of labour.
Answer
C
C
Background Concept
Division of labour is a key concept in the study of factors of production, specifically labour. It refers to the specialisation of workers on specific, limited tasks within a production process, rather than each worker completing the entire product. This concept was famously discussed by Adam Smith in his example of a pin factory. The main economic benefits of division of labour include:
- Increased productivity and output per worker: Workers become highly skilled and efficient at their single task.
- Time saved: No time is lost moving between different tasks or changing tools.
- Use of specialised machinery: Tasks can be automated or aided by capital equipment designed for that specific job.
- Lower unit costs: Higher productivity leads to lower average costs of production.
Understanding the Question
This is a multiple-choice question asking which of the four listed business objectives would encourage a firm to adopt a higher degree of division of labour. The question tests whether you understand the purpose and outcome of division of labour. Each option presents a different business goal: self-sufficiency, flexibility, productivity, and risk reduction. You must identify which goal is directly and positively served by increasing specialisation.
Approach
To answer this, evaluate each option against the known effects of division of labour:
- Self-sufficiency: Division of labour makes firms interdependent (each worker relies on others for other parts of the process), which is the opposite of self-sufficiency. This would discourage division of labour.
- Flexibility: Specialised workers are less flexible because they can only perform one task. A firm wanting flexibility would avoid high division of labour.
- Productivity: This is the classic, well-documented benefit of division of labour. Specialisation dramatically increases output per worker.
- Risk reduction: Division of labour can increase risk (e.g., if a key worker is absent, the whole process stops). It does not reduce risk.
Only option C aligns with the primary economic rationale for division of labour.
Step-by-Step Reasoning
- Define division of labour: It is the specialisation of workers on a narrow, specific task within a larger production process.
- Identify its main economic benefit: The primary goal is to increase efficiency and productivity. By focusing on one task, a worker becomes faster, more dexterous, and makes fewer errors. This leads to a higher output per unit of time (higher labour productivity).
- Evaluate each option:
- Option A (Self-sufficiency): Division of labour requires workers to depend on each other. A firm aiming for self-sufficiency would want workers who can do everything, not specialists. This is incorrect.
- Option B (Flexibility): A specialist worker is inflexible; they can only do their one job. A firm wanting to quickly switch production or cover for absent colleagues would avoid high specialisation. This is incorrect.
- Option C (Productivity): This is the direct and intended outcome. The question asks what will encourage division of labour. The desire to raise productivity is the primary motivator. This is correct.
- Option D (Risk reduction): Division of labour can increase risk (e.g., a single point of failure in the production line). It does not reduce risk. This is incorrect.
- Select the correct answer: Option C is the only one that describes a goal that is directly achieved by increasing the division of labour.
Key Takeaways
- Division of labour is a strategy to increase productivity and efficiency.
- It involves trade-offs: higher productivity often comes at the cost of lower flexibility and higher interdependence.
- When answering multiple-choice questions, always link the concept to its core economic purpose or outcome.
Common Mistakes
- Confusing productivity with flexibility: Students may think that a specialist worker is more 'flexible' because they are good at their job, but flexibility in economics refers to the ability to switch between different tasks or adapt to change.
- Focusing on the worker's perspective: The question asks about the firm's objective. A worker might enjoy being a specialist, but the firm's reason for implementing division of labour is to raise productivity and lower costs.
- Not reading all options carefully: Option C is the most direct and correct answer, but a student might be tempted by option D if they think specialisation reduces the chance of error. However, the risk of a bottleneck or key worker absence is a significant risk.
Things to Be Careful About
- Pay close attention to the wording of the question and the options. The question asks what will encourage a higher degree, meaning what is the motive or goal.
- Remember the classic trade-offs associated with division of labour: increased productivity vs. decreased flexibility and increased interdependence/boredom.
Which business is likely to be the slowest to alter its output in response to a sustained increase in demand for its product?
Options
A a fast-food restaurant
B a household cleaning service
C a newspaper printer
D an oil exploration company
Reasoning
Price elasticity of supply (PES) measures the responsiveness of quantity supplied to a change in price. A firm with a low PES is slow to alter its output. The speed of adjustment depends on factors such as the time period, spare capacity, and the nature of the production process.
- A fast-food restaurant (A) can quickly hire extra staff and use more ingredients to increase output.
- A household cleaning service (B) can easily take on more clients by scheduling additional hours.
- A newspaper printer (C) can run presses for longer or add shifts to meet higher demand.
- An oil exploration company (D) requires years of planning, drilling, and investment before it can increase output. It faces the longest production lag and the lowest PES in the short run.
Therefore, the oil exploration company is the slowest to alter its output.
Answer
D
D
Background Concept
Price elasticity of supply (PES) measures the responsiveness of the quantity supplied of a good or service to a change in its price. It is calculated as:
PES = % change in quantity supplied / % change in price
A low PES (inelastic supply) means that firms cannot easily or quickly increase output when price rises. Factors that make supply inelastic include:
- Long production periods (e.g., agriculture, mining, oil drilling)
- Limited spare capacity
- Difficulty in storing output
- High barriers to expanding production (e.g., need for specialist equipment or regulatory approvals)
Conversely, a high PES (elastic supply) means firms can respond rapidly, often because they hold spare capacity, use flexible labour, or have short production cycles.
Understanding the Question
This question asks which of four businesses would be the slowest to increase its output in response to a sustained rise in demand. The key is to think about the production process of each business and how quickly it can scale up. The question tests the ability to apply the concept of PES to real-world examples.
Approach
For each option, consider:
- How long does it take to acquire the necessary inputs (labour, capital, raw materials)?
- Is there spare capacity that can be used immediately?
- Are there significant time lags or regulatory hurdles?
The business with the longest production lag and the most capital-intensive, time-consuming expansion process will have the lowest PES and be the slowest to respond.
Step-by-Step Reasoning
-
Fast-food restaurant (A): Can increase output quickly by hiring more staff, ordering more ingredients, and extending opening hours. Production is labour-intensive and uses readily available inputs. PES is high.
-
Household cleaning service (B): Can take on more clients by scheduling additional hours for existing staff or hiring temporary workers. Requires minimal capital investment. PES is high.
-
Newspaper printer (C): Can increase output by running printing presses for longer hours or adding shifts. If spare capacity exists, output can rise quickly. PES is moderate to high.
-
Oil exploration company (D): Increasing output requires finding new oil reserves, obtaining drilling permits, purchasing or leasing expensive equipment, and constructing extraction facilities. This process takes years. Even if demand rises, supply cannot increase significantly in the short run. PES is very low.
Therefore, the oil exploration company is the slowest to alter its output.
Key Takeaways
- Price elasticity of supply is determined by the nature of the production process and the time period considered.
- Capital-intensive industries with long lead times (e.g., oil, mining, agriculture) have inelastic supply in the short run.
- Labour-intensive service industries (e.g., restaurants, cleaning) can adjust output quickly and have elastic supply.
- This question illustrates how to apply theoretical concepts to real-world business scenarios.
Common Mistakes
- Choosing the newspaper printer because it uses heavy machinery — but printing presses can be run for longer hours, so output can increase relatively quickly.
- Confusing the speed of adjustment with the size of the firm — a large oil company is not necessarily slow because it is large, but because of the nature of its production.
- Not considering the time period: in the long run, all firms can adjust, but the question asks for the slowest, implying the short run.
Things to Be Careful About
- Focus on the production process, not the industry's market structure or profitability.
- Remember that 'sustained increase in demand' means the price rise is expected to last, so firms have an incentive to expand, but the speed of response is constrained by technical factors.
- The correct answer is the one with the longest production lag and the most barriers to rapid expansion.
A company uses large amounts of gas to produce steel. Supplies of gas are reduced at the same time as the market for steel is hit by a recession.
What can be said about the likely changes in the market for steel?
Options
| equilibrium price | equilibrium quantity | |
|---|---|---|
| A | falls | uncertain |
| B | rises | uncertain |
| C | uncertain | falls |
| D | uncertain | rises |
Reasoning
The supply of steel decreases because gas (an input) is reduced. This shifts the supply curve leftwards. At the same time, a recession reduces demand for steel, shifting the demand curve leftwards.
- The leftward shift in supply tends to increase price and decrease quantity.
- The leftward shift in demand tends to decrease price and decrease quantity.
For quantity, both shifts push quantity down, so equilibrium quantity definitely falls.
For price, the supply shift pushes price up, while the demand shift pushes price down. The net effect on price is uncertain without knowing the relative magnitudes of the shifts.
Therefore, equilibrium quantity falls, and the change in equilibrium price is uncertain.
Answer
C
C
Background Concept
When both demand and supply shift simultaneously, the effect on equilibrium price and quantity depends on the direction and magnitude of each shift. A leftward shift in supply (decrease in supply) raises price and reduces quantity. A leftward shift in demand (decrease in demand) lowers price and reduces quantity. When both shift left, quantity definitely falls because both effects reduce quantity. Price is ambiguous because the supply shift pushes it up and the demand shift pushes it down.
Understanding the Question
The question describes two events: a reduction in gas supplies (an input for steel production) and a recession that reduces demand for steel. We need to determine the likely changes in equilibrium price and quantity in the steel market. The options present combinations of "falls", "rises", or "uncertain" for price and quantity.
Approach
Identify the direction of each shift: supply decreases (left), demand decreases (left). Then consider the effect on price and quantity separately. For quantity, both shifts reduce quantity, so quantity falls. For price, the shifts have opposite effects, so the net effect is uncertain.
Step-by-Step Reasoning
- The reduction in gas supply increases production costs for steel, causing steel producers to supply less at each price. The supply curve shifts left.
- The recession reduces consumers' income and spending, decreasing demand for steel. The demand curve shifts left.
- In the new equilibrium, quantity will be lower because both shifts reduce quantity. So equilibrium quantity falls.
- Price: the supply shift tends to increase price (scarcity), while the demand shift tends to decrease price (less demand). The net effect depends on which shift is larger. Without information on magnitudes, price change is uncertain.
- Therefore, the correct answer is C: equilibrium price is uncertain, equilibrium quantity falls.
Key Takeaways
- When both demand and supply shift in the same direction (both left or both right), the change in quantity is determined (same direction as shifts), but price change is ambiguous.
- When shifts are in opposite directions, price change is determined but quantity change is ambiguous.
- Always consider the separate effects of each shift on price and quantity.
Common Mistakes
- Assuming that because supply decreases, price must rise, ignoring the demand shift.
- Forgetting that both shifts affect quantity in the same direction, so quantity change is certain.
- Choosing an option that says price rises or falls without considering the ambiguity.
Things to Be Careful About
- Read the question carefully: it asks for "likely changes" – we need to determine what is certain and what is uncertain.
- Remember that a recession reduces demand, not supply.
- The input cost increase reduces supply, not demand.
A firm is charging a price of $12 for its product and using 80% of its production capacity of 10 000 units per month.
Assuming the product has unitary price elastic demand, which price should the firm charge to utilise its full capacity?
Options
A $9.00
B $9.60
C $10.00
D $10.60
Working
Current output = 80% of 10,000 = 8,000 units.
Target output = 10,000 units.
Percentage increase in quantity = (10,000 - 8,000) / 8,000 * 100% = 25%.
Unitary price elastic demand means PED = -1.
PED = %ΔQ / %ΔP => -1 = 25% / %ΔP => %ΔP = -25%.
Therefore price must fall by 25%.
New price = $12 * (1 - 0.25) = $12 * 0.75 = $9.00.
Answer
A
A
Background Concept
Price elasticity of demand (PED) measures the responsiveness of quantity demanded to a change in price. It is calculated as the percentage change in quantity demanded divided by the percentage change in price. Unitary elasticity means PED = -1 (ignoring the sign, it is 1 in absolute value). This implies that a given percentage change in price leads to an equal percentage change in quantity demanded in the opposite direction. Consequently, total revenue remains constant when price changes if demand is unitary elastic.
Understanding the Question
The firm currently produces 8,000 units (80% of 10,000 capacity) and sells at $12. It wants to sell 10,000 units (full capacity). The product has unitary price elastic demand. The question asks for the price that will achieve this quantity increase. We need to use the relationship between price and quantity under unitary elasticity to find the required price reduction.
Approach
First, calculate the percentage increase in quantity needed. Then, since PED = -1, the percentage change in price must be equal in magnitude but opposite in sign to the percentage change in quantity. Apply this percentage change to the current price to find the new price.
Step-by-Step Reasoning
- Current output: 80% of 10,000 = 8,000 units.
- Target output: 10,000 units.
- Increase in quantity: 10,000 - 8,000 = 2,000 units.
- Percentage increase in quantity: (2,000 / 8,000) × 100% = 25%.
- Unitary price elastic demand: PED = -1. The formula: PED = (% change in quantity demanded) / (% change in price). So -1 = 25% / (% change in price). Therefore, % change in price = 25% / (-1) = -25%. (A negative sign indicates a price decrease.)
- Current price = $12. Price decrease of 25%: reduction = 25% of $12 = $3. New price = $12 - $3 = $9.00.
- Check: At $9, quantity demanded should increase by 25% to 10,000 units, consistent with unitary elasticity.
Thus, the firm should charge $9.00 to sell 10,000 units.
Key Takeaways
- Unitary elasticity implies that the percentage change in quantity demanded equals the percentage change in price (in absolute value).
- To increase quantity by a certain percentage, price must be reduced by the same percentage.
- This relationship is useful for firms aiming to achieve a specific sales target, assuming demand is unitary elastic over the relevant range.
Common Mistakes
- Confusing unitary elasticity with inelastic or elastic demand. If demand were inelastic, a price reduction would lead to a smaller percentage increase in quantity, so a larger price cut would be needed.
- Forgetting to calculate the percentage change based on the original quantity, not the target quantity. Using 2,000/10,000 = 20% would be incorrect.
- Misapplying the sign: PED is negative, so a positive quantity change requires a negative price change.
Things to Be Careful About
- Ensure the percentage change is calculated correctly: (new - old)/old × 100%.
- Remember that unitary elasticity means total revenue remains constant, but that is not directly needed here.
- The question assumes the demand curve is linear and unitary elastic at the current point? Actually unitary elasticity can be along a demand curve, but here it's given as a property of the product, so we assume it holds for the relevant range.
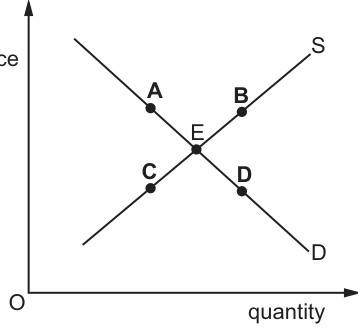
The diagram shows the demand for and supply of hotel accommodation. The market equilibrium is at point E.
The hotel receives a very large number of bad reviews about the quality of its accommodation.
Which point on the diagram would show the new market equilibrium?
Options
A point A on Fig. 9.1
B point B on Fig. 9.1
C point C on Fig. 9.1
D point D on Fig. 9.1
Answer
Bad reviews reduce consumer preference for the hotel, causing the demand curve to shift to the left. With the supply curve unchanged, the new market equilibrium occurs at a lower price and lower quantity, which corresponds to point C on the supply curve.
C
C
Background Concept
A market equilibrium is established where the demand curve (D) and supply curve (S) intersect, determining the equilibrium price and quantity. The position of the demand curve is determined by the willingness and ability of consumers to purchase a good at each price. Non-price determinants of demand include consumer tastes and preferences, income, the price of related goods, and expectations. A change in any of these non-price factors causes the entire demand curve to shift: an increase in demand shifts D to the right, while a decrease shifts D to the left. By contrast, a change in the price of the good itself causes a movement along the existing demand curve, not a shift of the curve. When demand shifts, the supply curve remains in its original position unless a supply determinant also changes. The new equilibrium is found at the intersection of the shifted demand curve and the original supply curve.
Understanding the Question
The question describes a hotel that receives very bad reviews about the quality of its accommodation. This information signals a negative change in consumer tastes and preferences toward this specific hotel. Because the reviews affect consumers' desire to stay at the hotel regardless of the price charged, this is a change in a non-price determinant of demand. Consequently, the demand for hotel accommodation at this hotel will decrease, shifting the demand curve to the left. The supply of rooms is determined by the hotel's capacity and costs, which are not directly affected by reviews, so the supply curve S stays in place. The task is to identify which labelled point on the diagram represents the new market equilibrium after this leftward shift in demand.
Approach
The correct approach is:
- Identify which curve shifts: Demand (D), because reviews alter consumer preferences.
- Determine the direction of the shift: Leftward (decrease), because bad reviews make the hotel less attractive.
- Locate the new equilibrium: It must lie on the unchanged supply curve S, at the point where the new (left-shifted) demand curve intersects S.
- Compare with the labelled points: The new equilibrium will be at a lower price and lower quantity than the original equilibrium E. On the supply curve, moving leftward and downward from E leads to point C.
Step-by-Step Reasoning
- The shock: Bad reviews represent adverse information that reduces consumer preference for the hotel. In demand and supply analysis, tastes and preferences are a key non-price determinant of demand.
- The curve shift: Because the change is in preferences rather than the price of the accommodation, the entire demand curve shifts to the left (a decrease in demand). At every given price, consumers now wish to buy fewer rooms than before.
- The unchanged curve: The hotel's supply of rooms is determined by its physical capacity, staff, and costs. Reviews do not alter these supply-side conditions in the short run, so the supply curve S does not shift.
- Finding the new equilibrium: The new market equilibrium is the point where the new demand curve meets the original supply curve S. Because demand has fallen, this intersection occurs at a lower equilibrium price and a lower equilibrium quantity than at point E.
- Matching to the diagram: Point C lies on the supply curve S, to the left of E (lower quantity) and below E (lower price). This precisely matches the expected new equilibrium after a leftward demand shift.
- Why the other points are incorrect:
- Point A lies on the demand curve D above E. This would represent a movement up along the demand curve caused by a price increase, not a shift of the curve.
- Point B lies on the supply curve S above E. This would require either an increase in demand or a decrease in supply, neither of which has occurred.
- Point D lies on the demand curve D below E. This would represent a movement down along the demand curve caused by a price decrease, not a shift.
Key Takeaways
- A change in consumer tastes, preferences, or opinions shifts the demand curve; a change in the price of the good itself causes a movement along the demand curve.
- When demand decreases (shifts left), the new equilibrium with an unchanged supply curve is at a lower price and lower quantity.
- The new equilibrium point must always lie on the curve that did not shift.
- In multiple-choice diagram questions, first identify the shifting curve and its direction, then locate the new intersection point on the unchanged curve.
Common Mistakes
- Choosing a point on the demand curve (A or D): Students sometimes forget that the new equilibrium must be on the unchanged supply curve, not on the demand curve.
- Confusing a shift with a movement along the curve: Bad reviews shift the demand curve; they do not cause a movement along it. Points A and D represent movements along the demand curve.
- Getting the direction wrong: Some students might think bad reviews increase demand (perhaps confusing it with a desire for cheaper prices), but reviews affect quality perception and thus reduce demand.
- Ignoring which curve is affected: Reviews affect demand, not supply. Do not shift the supply curve.
Things to Be Careful About
- Always ask whether the change affects demand or supply. Quality reviews affect consumer willingness to buy, so demand shifts.
- After identifying the shifting curve, confirm the direction: bad news reduces demand, shifting D left.
- Verify that the selected point lies on the curve that did NOT shift. Here, that is the supply curve S.
- Check the coordinates: the new equilibrium must have both lower price and lower quantity than E, which uniquely identifies point C among the labelled points on the supply curve.
What most accurately describes a market supply curve?
Options
A supply at different income levels, assuming product prices remain unchanged
B supply at different levels of factor prices, assuming product prices remain unchanged
C supply at different prices, assuming no changes in technology
D supply at different time periods, assuming no changes in technology
Reasoning
The market supply curve shows the quantity of a good that producers are willing and able to supply at different prices, holding all other factors constant (ceteris paribus). Technology is one of these factors, so option C correctly describes the supply curve.
Answer
C
C
Background Concept
A market supply curve is a graphical representation of the relationship between the price of a good and the quantity that all producers in a market are willing and able to supply, assuming all other factors that affect supply remain unchanged. This assumption is known as ceteris paribus. The supply curve typically slopes upward, indicating that as price increases, quantity supplied increases, and vice versa.
Understanding the Question
The question asks for the most accurate description of a market supply curve. It tests your understanding of what the curve represents and the ceteris paribus condition. The correct answer must capture the idea that the supply curve shows quantity supplied at different prices, while holding other determinants constant. The options introduce other variables (income, factor prices, time periods) that are either irrelevant to supply or are held constant, not varied along the curve.
Approach
To answer this question, recall the definition of a supply curve: it shows the relationship between price and quantity supplied, ceteris paribus. Then evaluate each option to see which one matches this definition. Eliminate options that confuse the supply curve with demand or that incorrectly suggest the supply curve shows variation in factors that are actually held constant.
Step-by-Step Reasoning
- Option A: "supply at different income levels, assuming product prices remain unchanged." Income is a determinant of demand, not supply. The supply curve does not show variation with income; income is held constant when drawing the supply curve. This option describes a demand relationship, not supply. So A is incorrect.
- Option B: "supply at different levels of factor prices, assuming product prices remain unchanged." Factor prices (e.g., wages, rent) are determinants of supply. A change in factor prices shifts the supply curve, but the supply curve itself is drawn with factor prices constant. This option incorrectly suggests that the supply curve shows variation in factor prices. So B is incorrect.
- Option C: "supply at different prices, assuming no changes in technology." This correctly identifies that the supply curve shows quantity supplied at various prices, with technology (a determinant of supply) held constant. Technology is one of the factors assumed unchanged under ceteris paribus. So C is correct.
- Option D: "supply at different time periods, assuming no changes in technology." Time periods are not a variable on the axes of a supply curve. The supply curve can be drawn for a given time period (e.g., short run or long run), but it does not show variation across time periods. This option is misleading. So D is incorrect.
Therefore, the correct answer is C.
Key Takeaways
- A market supply curve illustrates the relationship between price and quantity supplied, ceteris paribus.
- The ceteris paribus assumption means that all other determinants of supply (technology, factor prices, expectations, number of sellers, etc.) are held constant.
- Changes in these other determinants cause the supply curve to shift; movements along the curve are caused by changes in price.
- Do not confuse supply with demand: income affects demand, not supply.
Common Mistakes
- Choosing option A because of confusion between supply and demand. Income is a demand-side factor.
- Choosing option B because factor prices affect supply, but failing to recognise that the supply curve itself is drawn with factor prices constant, not varying.
- Choosing option D because time periods are relevant to supply elasticity, but the supply curve does not show variation across time periods; it is drawn for a specific time horizon.
Things to Be Careful About
- Always remember the ceteris paribus assumption when interpreting a supply curve.
- Distinguish between factors that cause a movement along the curve (price) and factors that shift the curve (all other determinants).
- Read each option carefully: the phrase "assuming no changes in technology" in option C is a clue that technology is being held constant, which aligns with ceteris paribus.
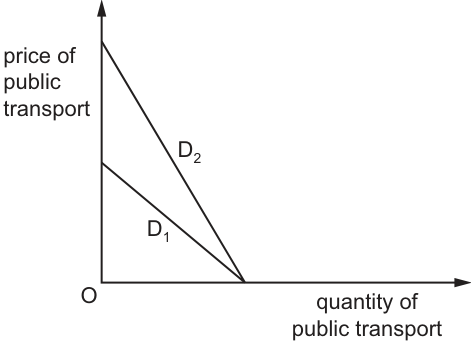
In the diagram, D1 shows an individual’s initial demand curve for public transport.
What could cause the demand curve to shift to D2?
Options
A The costs of running the individual’s car fall.
B The individual is no longer able to drive.
C The price of public transport falls.
D The public transport services are reduced.
Reasoning
The diagram shows D2 is to the right of D1, meaning demand for public transport has increased (the entire demand curve has shifted rightward). A shift in the demand curve is caused by a change in a non-price determinant of demand, while a change in the price of public transport itself would cause a movement along the existing demand curve, not a shift.
- Option A: A fall in car running costs makes cars (a substitute for public transport) cheaper, so demand for public transport would decrease (shift left), not increase.
- Option B: If the individual can no longer drive, they cannot use their car and must rely more on public transport. This increases their demand for public transport at every price, shifting the demand curve rightward from D1 to D2.
- Option C: A fall in the price of public transport causes a movement down along the existing demand curve, not a shift of the curve.
- Option D: A reduction in public transport services is a supply-side change, affecting the supply curve, not the demand curve.
Answer
B
B
Background Concept
A demand curve illustrates the relationship between the price of a good (on the vertical axis) and the quantity of that good consumers are willing and able to buy (on the horizontal axis), ceteris paribus (all other factors held constant).
There are two key ways the quantity demanded changes:
- A movement along the demand curve: This is caused only by a change in the price of the good itself. A fall in price leads to a movement down along the curve (higher quantity demanded), while a rise in price leads to a movement up along the curve (lower quantity demanded). The curve itself does not shift.
- A shift of the entire demand curve: This is caused by a change in a non-price determinant of demand – factors other than the good's own price that affect how much consumers want to buy at every given price. A rightward shift (from D1 to D2, as in the diagram) means an increase in demand: consumers want to buy more of the good at every price. A leftward shift means a decrease in demand. Common non-price determinants include changes in consumer income, prices of related goods (substitutes and complements), consumer tastes and preferences, expectations about future prices or income, and the number of buyers in the market.
Understanding the Question
The question provides a diagram of an individual's demand for public transport, where D2 is to the right of D1. This means the individual's demand for public transport has increased (the curve has shifted rightward). The task is to identify which of the four options would cause this rightward shift in demand. The options include changes to car costs, the individual's ability to drive, the price of public transport, and the availability of public transport services.
Approach
To solve this, we first apply the core distinction between movements along and shifts of the demand curve:
- Any option that is a change in the price of public transport will be a movement along the curve, so it can be eliminated immediately.
- Any option that affects the supply of public transport (rather than the individual's willingness to buy it) can also be eliminated, as supply changes do not shift the demand curve.
- We then evaluate the remaining options against the direction of the shift required (rightward/increase in demand): a substitute becoming more expensive would increase demand for public transport, while a substitute becoming cheaper would decrease it. A factor that makes public transport the only viable option for the individual would increase their demand.
Step-by-Step Reasoning
We evaluate each option in turn:
- Option A: The costs of running the individual’s car fall.
Cars and public transport are substitute goods: they can be used to fulfil the same need (travel). If the cost of running a car falls, the car becomes a more attractive option relative to public transport. The individual will switch from public transport to their car, so their demand for public transport will decrease (shift leftward, away from D2). This does not match the diagram, so A is incorrect. - Option B: The individual is no longer able to drive.
If the individual cannot drive, their car (a substitute for public transport) is no longer a viable travel option. They have no alternative but to use public transport for trips they would previously have made by car. This means that at every price of public transport, the individual will now demand a higher quantity than before. This causes the entire demand curve to shift rightward from D1 to D2, exactly as shown in the diagram. This is the correct answer. - Option C: The price of public transport falls.
A change in the price of the good itself (public transport) never shifts the demand curve. Instead, it causes a movement along the existing demand curve: a fall in price would lead to a movement down along D1 to a higher quantity demanded, but the curve D1 itself does not move. This is not a shift to D2, so C is incorrect. - Option D: The public transport services are reduced.
A reduction in public transport services is a change in the supply of public transport (the quantity that providers are willing and able to offer at each price). This would shift the supply curve of public transport, not the demand curve. It does not affect the individual's willingness to buy public transport at each price, so it does not shift the demand curve. D is incorrect.
Key Takeaways
The core skill tested here is distinguishing between the two types of changes to demand: movements along the curve (caused only by the good's own price change) and shifts of the curve (caused by non-price factors). For a rightward shift (increase in demand), the non-price factor must make consumers want to purchase more of the good at every given price. For substitute goods, a fall in the price of the substitute reduces demand for the original good, while a rise in the substitute's price increases demand for the original good.
Common Mistakes
- Confusing movements along and shifts of the demand curve: Many students select Option C, incorrectly believing that a fall in price increases demand. In economics, a change in the good's own price only changes the quantity demanded (a movement along the curve), not demand (the entire curve). Only non-price factors shift the demand curve.
- Mixing up demand and supply factors: Option D describes a change in the availability of public transport, which is a supply-side factor. Supply changes do not affect the demand curve, so this option can be eliminated immediately.
- Getting the direction of the substitute effect wrong: Some students may think that if car costs fall, people will still use public transport, but substitutes have an inverse relationship: a cheaper substitute reduces demand for the original good.
Things to Be Careful About
- Always check whether the change described is a price change of the good in question: if it is, it is a movement along the curve, not a shift, so it cannot be the correct answer for a question about a curve shift.
- Confirm the direction of the shift required: the diagram shows a rightward shift (increase in demand), so the correct option must cause demand to rise, not fall.
- Remember that factors affecting the ability or willingness of consumers to buy the good (non-price factors) shift the demand curve, while factors affecting the ability or willingness of producers to sell the good shift the supply curve.
A government introduces an effective minimum price for a product but makes no other intervention in the market.
This policy suggests that the government’s objective is
Options
A to discourage consumption of a demerit good.
B to increase the consumption of a merit good.
C to reduce the price of a private good.
D to support the incomes of producers.
Answer
A minimum price (price floor) is set above the free-market equilibrium. It creates a surplus because quantity supplied exceeds quantity demanded. This policy is typically used to discourage consumption of a demerit good (by making it more expensive) or to support producers' incomes. The question states the government makes 'no other intervention', so the objective is to discourage consumption of a demerit good.
Answer
A
A
Background Concept
A minimum price (also called a price floor) is a legally imposed lower limit on the price of a good or service. It is set above the free-market equilibrium price. At this higher price, the quantity supplied by producers exceeds the quantity demanded by consumers, creating a surplus. The government may then need to buy up the surplus or restrict supply to maintain the price. Minimum prices are used for two main reasons: to support the incomes of producers (e.g., in agriculture) or to discourage the consumption of demerit goods (goods that are over-consumed because consumers underestimate the negative externalities, such as alcohol or tobacco).
Understanding the Question
The question presents a scenario: a government introduces an effective minimum price for a product and makes no other intervention. The task is to identify which of the four listed objectives this policy suggests. The key phrase is 'effective minimum price' – meaning it is set above the equilibrium price and therefore has a real impact on the market. The options are: A – to discourage consumption of a demerit good; B – to increase consumption of a merit good; C – to reduce the price of a private good; D – to support the incomes of producers.
Approach
First, recall the two standard uses of a minimum price. Then evaluate each option against the characteristics of a minimum price. Option A is a known use. Option B is the opposite – a minimum price raises the price, which would decrease consumption, not increase it. Option C is also the opposite – a minimum price raises the price, not reduces it. Option D is the other standard use, but the question specifies 'no other intervention'. A minimum price to support producer incomes typically requires the government to also buy up the surplus or restrict supply, otherwise the surplus would drive the price back down. Since the question says 'no other intervention', this rules out option D. Therefore, option A is the correct answer.
Step-by-Step Reasoning
- Identify the policy: An effective minimum price is a price floor set above the equilibrium.
- Recall the effects: It raises the price above the market-clearing level, leading to a surplus (excess supply).
- Recall the objectives: Minimum prices are used to:
- Discourage consumption of demerit goods (by making them more expensive).
- Support producer incomes (by guaranteeing a higher price).
- Evaluate each option:
- A: to discourage consumption of a demerit good. This is a valid objective. A higher price reduces quantity demanded, which is the desired outcome for a demerit good.
- B: to increase the consumption of a merit good. This is incorrect. A minimum price raises the price, which reduces consumption. To increase consumption of a merit good, a government would use a subsidy or a maximum price.
- C: to reduce the price of a private good. This is incorrect. A minimum price raises the price. To reduce the price, a government would use a maximum price (price ceiling).
- D: to support the incomes of producers. This is a valid objective for a minimum price, but it is not the correct answer here. A minimum price to support producer incomes (e.g., in agriculture) almost always requires the government to also intervene to manage the resulting surplus – for example, by buying up the excess supply, paying farmers to reduce output, or storing the surplus. The question explicitly states 'makes no other intervention'. Without such complementary measures, the surplus would cause the market price to fall back towards equilibrium, making the minimum price ineffective. Therefore, this option is inconsistent with the condition of 'no other intervention'.
- Conclusion: The only option that is both a valid objective for a minimum price and consistent with the condition of no other intervention is A.
Key Takeaways
- A minimum price (price floor) is set above equilibrium and creates a surplus.
- Its main uses are to discourage demerit good consumption and to support producer incomes.
- A minimum price to support producer incomes usually requires additional government intervention (e.g., buying the surplus).
- A minimum price is the opposite of a maximum price (price ceiling), which is set below equilibrium and creates a shortage.
Common Mistakes
- Confusing minimum and maximum prices: A common error is to think a minimum price reduces the price. It does the opposite – it raises it.
- Ignoring the 'no other intervention' condition: A student might see 'support the incomes of producers' and select it without considering the condition. This is a classic exam trick – the correct answer is the one that fits ALL the given information.
- Not knowing the objectives: A student might not know that minimum prices are used for demerit goods. This is a standard application of the concept.
Things to Be Careful About
- Read the question carefully, especially any qualifying phrases like 'effective' or 'no other intervention'.
- Distinguish between the two main uses of a minimum price and the conditions under which each is effective.
- Remember that a minimum price for producer support is rarely a standalone policy; it usually requires complementary measures to deal with the surplus.
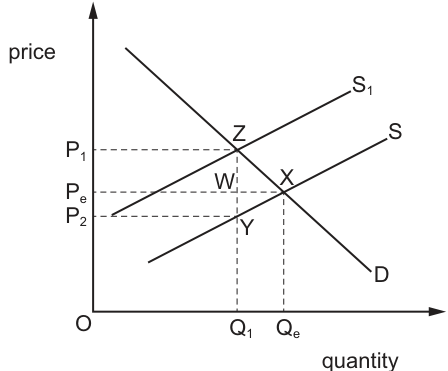
The diagram shows the effect of an indirect tax imposed on cigarettes. The market is initially in equilibrium at point X.
Which area represents the incidence of the tax on consumers?
Options
A P1ZYP2
B P1ZWPe
C PeWYP2
D PeXZP1
Reasoning
An indirect tax imposed on cigarettes shifts the supply curve leftward from S to S1, as it increases firms' costs of production. The market was initially in equilibrium at point X, where the original supply curve S meets the demand curve D, at price Pe and quantity Qe. After the tax, the new equilibrium is at point Z, where the after-tax supply curve S1 meets demand, at the consumer price P1 and lower quantity Q1. The total tax per unit is the vertical difference between S and S1 at Q1, equal to P1 - P2. The consumer's tax incidence is the extra amount they pay per unit relative to the pre-tax price: P1 - Pe. This forms a rectangle with height (P1 - Pe) and width Q1, corresponding to the area P1ZWPe.
Answer
B
B
Background Concept
An indirect tax is a tax levied on the production or sale of a good, paid by the producer to the government but typically passed partly or fully to consumers via higher prices. When an indirect tax is imposed, it increases the cost of supplying each quantity of the good, so the supply curve shifts vertically upward by the amount of the tax, from the original supply curve S to the after-tax supply curve S1. Tax incidence refers to the division of the total tax burden between consumers and producers: consumers bear the incidence equal to the increase in the price they pay per unit, while producers bear the incidence equal to the decrease in the price they receive per unit. The total tax revenue raised by the government is the per-unit tax multiplied by the quantity sold after the tax, represented by a rectangle on the diagram. A deadweight loss triangle also arises, representing the loss of total surplus due to the reduction in quantity traded from the pre-tax equilibrium.
Understanding the Question
This 1-mark multiple choice question asks you to identify which labelled area on the provided demand and supply diagram represents the incidence of the indirect tax on consumers of cigarettes. The diagram shows the market in initial equilibrium at point X (pre-tax price Pe, pre-tax quantity Qe), with supply shifting up to S1 after the tax, creating a new equilibrium at point Z (post-tax consumer price P1, post-tax quantity Q1). The vertical line at Q1 intersects S1 at Z, the original supply curve S at Y (corresponding to the price producers receive after tax, P2), and the horizontal line at Pe at point W. You need to distinguish the consumer's tax burden from the producer's burden, total tax revenue, and deadweight loss.
Approach
To solve this, first identify the key prices:
- Pre-tax equilibrium price: Pe (the price consumers paid and producers received before the tax)
- Post-tax price consumers pay: P1 (the price at the new equilibrium Z)
- Post-tax price producers receive: P2 (the price on the original supply curve at the new quantity Q1)
The consumer's tax incidence per unit is the difference between the post-tax consumer price and the pre-tax price: P1 - Pe. Multiply this per-unit burden by the post-tax quantity Q1 to get the total consumer incidence, which will be a rectangular area on the diagram. Match this area to the options provided.
Step-by-Step Reasoning
- First, recall the effect of an indirect tax: it shifts the supply curve left/up because it raises the cost of producing each unit, so firms will only supply the same quantity at a higher price. This is shown by the shift from S to S1.
- The original equilibrium is at X, where S meets D: consumers pay Pe, and the quantity traded is Qe.
- After the tax, the new equilibrium is at Z, where S1 meets D: consumers now pay P1, and the quantity traded falls to Q1.
- The total tax per unit is the vertical gap between S and S1 at any quantity, which at Q1 is P1 - P2 (the difference between the price on S1 and the price on S at Q1).
- The consumer's share of the tax (incidence) is the amount their price has risen: P1 - Pe. This is because before the tax they paid Pe per unit, and now they pay P1 per unit, so they pay (P1 - Pe) more per cigarette.
- The total consumer incidence is this per-unit amount multiplied by the number of cigarettes sold after the tax (Q1), which forms a rectangle with corners at P1 (on the price axis), Z (Q1, P1), W (Q1, Pe), and Pe (on the price axis). This area is labelled P1ZWPe, which is option B.
- To eliminate other options:
- Option A (P1ZYP2) is the total tax revenue: it is the full per-unit tax (P1 - P2) multiplied by Q1, split between consumers and producers.
- Option C (PeWYP2) is the producer's tax incidence: the amount their received price falls, (Pe - P2) multiplied by Q1.
- Option D (PeXZP1) is the deadweight loss triangle: the loss of total consumer and producer surplus that is not captured as tax revenue, due to the reduction in quantity from Qe to Q1.
Key Takeaways
- An indirect tax shifts the supply curve upward by the amount of the tax.
- Tax incidence is split between consumers and producers depending on the relative elasticities of demand and supply, but on the diagram, the consumer's incidence is always the rectangle between the pre-tax price, post-tax consumer price, and the post-tax quantity.
- Total tax revenue is the full vertical tax wedge multiplied by the post-tax quantity, while deadweight loss is the triangle between the pre-tax and post-tax quantities, bounded by the demand and original supply curves.
Common Mistakes
- Confusing total tax revenue (option A) with the consumer's share of the tax: total tax includes both the consumer and producer burdens.
- Mixing up the producer's incidence (option C) with the consumer's: producers bear the fall in the price they receive, not the rise in the consumer price.
- Mistaking the deadweight loss triangle (option D) for tax incidence: deadweight loss is the lost surplus, not the tax paid to the government.
- Misreading the diagram labels: mixing up the pre-tax equilibrium price Pe with the post-tax producer price P2, or the post-tax consumer price P1.
Things to Be Careful About
- Always distinguish between the price consumers pay (P1) and the price producers receive (P2) after the tax: the difference between these two is the full per-unit tax.
- The consumer's incidence is only the part of the tax that raises the consumer price above the original pre-tax equilibrium price Pe, not the full tax wedge.
- Check the corners of the area carefully: the consumer's incidence rectangle is bounded by the pre-tax price (Pe), post-tax consumer price (P1), the post-tax quantity (Q1), and the price axis.
The diagram shows the supply curve of a product.
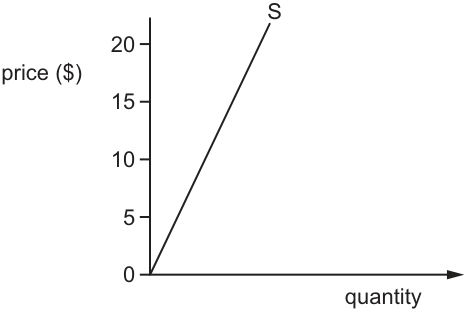
The government imposes a specific indirect tax of $5 on the product.
How will the price elasticity of supply of the product change?
Options
A from elastic (>1) to inelastic (<1)
B from inelastic (<1) to elastic (>1)
C from inelastic (<1) to unitary (=1)
D from unitary (=1) to elastic (>1)
Reasoning
The original supply curve is a straight line starting from the origin, so quantity supplied is directly proportional to price. For this curve, price elasticity of supply (PES) = (change in quantity supplied / change in price) * (price / quantity supplied) = 1 (unitary) at all points, as the percentage change in quantity always equals the percentage change in price.
A $5 specific indirect tax increases firms' per-unit costs, shifting the supply curve vertically upwards by $5 to a parallel curve with the same slope. This new curve no longer passes through the origin. For any point on the new curve, PES = (change in quantity supplied / change in price) * (price / quantity supplied) is always greater than 1, as the price is $5 higher for any given quantity, making the price/quantity supplied ratio larger than under the original curve.
Answer
D
D
Background Concept
Price Elasticity of Supply (PES) measures how responsive the quantity supplied of a good is to a change in its market price. It is calculated as the percentage change in quantity supplied divided by the percentage change in price: PES = (% change in quantity supplied) / (% change in price) = (change in quantity supplied / quantity supplied) / (change in price / price) = (change in quantity supplied / change in price) * (price / quantity supplied). A PES of 1 is unitary elastic (percentage change in quantity equals percentage change in price), >1 is elastic (quantity changes proportionally more than price), and <1 is inelastic (quantity changes proportionally less than price).
For a straight-line supply curve that starts at the origin (0,0), the relationship between price and quantity supplied is linear and proportional: Qs = mP, where m is the slope of the curve (change in quantity supplied per unit change in price). Substituting into the PES formula gives PES = m * (price / (m * price)) = 1, so PES is unitary at every point on this curve.
A specific indirect tax is a fixed charge per unit of a good sold. It increases the cost of producing each unit by the amount of the tax, so firms require a higher price to supply any given quantity. This shifts the supply curve vertically upwards by the full amount of the tax, creating a new supply curve that is parallel to the original (same slope) but with a positive intercept on the price axis (the price when quantity supplied is zero is equal to the tax amount).
Understanding the Question
The question presents a linear supply curve starting at the origin, and states that the government imposes a $5 specific indirect tax on the product. It asks how the price elasticity of supply (PES) of the product will change as a result, with four options describing shifts between elastic, inelastic and unitary values.
This question tests two core concepts: first, the PES of a linear supply curve from the origin, and second, how a specific tax alters the supply curve and therefore the PES measured along the new curve. The correct answer requires linking the shape of the original and new supply curves to their respective PES values.
Approach
- First, recall the definition and formula for PES, and the characteristics of PES for different supply curve shapes.
- Calculate the PES of the original supply curve (straight line from origin) using the formula.
- Determine how a $5 specific tax affects the supply curve (shift direction, shape, intercept).
- Calculate the PES of the new shifted supply curve to compare with the original.
- Match the change in PES to the given options.
Step-by-Step Reasoning
-
Original supply curve PES: The given supply curve S is a straight line starting at (0,0), so quantity supplied is directly proportional to price: Qs = mP, where m is the slope (change in quantity supplied per unit change in price). Using the PES formula:
PES = (change in quantity supplied / change in price) * (price / quantity supplied) = m * (price / (m * price)) = 1.
This means the original supply curve has unitary PES at every point. -
Effect of the specific tax: A $5 per-unit tax adds $5 to the cost of supplying each unit. Firms will now only supply a given quantity if the price they receive is $5 higher than before. This shifts the supply curve vertically upwards by $5, resulting in a new supply curve S1 that is parallel to S (same slope m) but with a price intercept of $5 (when quantity supplied=0, price=$5). The equation of the new supply curve is price = 5 + m * quantity supplied, which can be rearranged to quantity supplied = (price - 5)/m.
-
New supply curve PES: For the new curve, the slope (change in quantity supplied / change in price) is still 1/m (same as original, since the curve is parallel). For any point on S1, the price/quantity supplied ratio is price / [(price - 5)/m] = m * price / (price - 5). Substituting into the PES formula:
PES = (1/m) * (m * price / (price - 5)) = price / (price - 5).
Since price is always greater than price - 5 (as the tax is $5), price/(price - 5) is always greater than 1. For example:- At price=$10: quantity supplied=(10-5)/m=5/m, so PES = 10/5 = 2 (elastic).
- At price=$15: quantity supplied=(15-5)/m=10/m, so PES=15/10=1.5 (still elastic).
Thus the new supply curve has elastic PES at all points.
-
Conclusion: PES changes from unitary (=1) on the original curve to elastic (>1) on the new curve, which matches option D.
Key Takeaways
- A straight-line supply curve that originates at the origin has a constant PES of 1 (unitary elastic) at all points, because percentage changes in price and quantity are always equal.
- A specific indirect tax shifts the supply curve vertically upwards by the full amount of the tax, creating a parallel curve with the same slope but a positive price intercept.
- PES depends on both the slope of the supply curve and the price-to-quantity ratio at the point being measured. A parallel shift that moves the curve away from the origin increases the price/quantity ratio, raising PES even though the slope is unchanged.
- For any linear supply curve with a positive price intercept (does not pass through the origin), PES is always greater than 1 (elastic) for all positive quantities supplied.
Common Mistakes
- Assuming PES does not change when the supply curve shifts: PES is a property of a specific supply curve, not an inherent characteristic of the good. A shift to a new curve means a new PES value.
- Confusing supply curve slope with PES: While slope is a component of PES, PES also depends on the price/quantity ratio at the point of measurement. A parallel shift changes this ratio even if the slope is unchanged, so PES changes.
- Incorrectly identifying the PES of a supply curve from the origin: Some students mistakenly believe this curve is elastic or inelastic, but it is always unitary elastic.
- Misunderstanding the direction of the tax shift: A specific tax shifts the supply curve up by the full tax amount, not down, and not by a smaller amount.
- Forgetting to compare the original and new PES: The question asks for the change in PES, so you must identify the PES of both the original and new curves, not just describe the effect of the tax on price or quantity.
Things to Be Careful About
- Always apply the full PES formula: PES = (change in quantity supplied / change in price) * (price / quantity supplied), do not rely only on the slope of the curve.
- When a supply curve shifts, calculate PES for the new curve separately; do not assume it is the same as the original.
- For linear supply curves, check if they pass through the origin: if they do, PES is 1 everywhere; if they have a positive price intercept, PES is >1 everywhere; if they have a positive quantity intercept, PES is <1 everywhere.
- The question asks for the change in PES, so focus on comparing the elasticity values of the two curves, not on the change in equilibrium price or quantity.
- A specific tax is a per-unit tax, so it causes a parallel upward shift of the supply curve; an ad valorem tax would cause a pivot, but that is not the case here.
The diagrams show a country’s aggregate demand (AD1) and aggregate supply (AS1) curves.
Since the world economic downturn (2007–2008), some governments have reduced labour costs and ensured interest rates remained unchanged.
How would this most likely be shown on a diagram?
Options
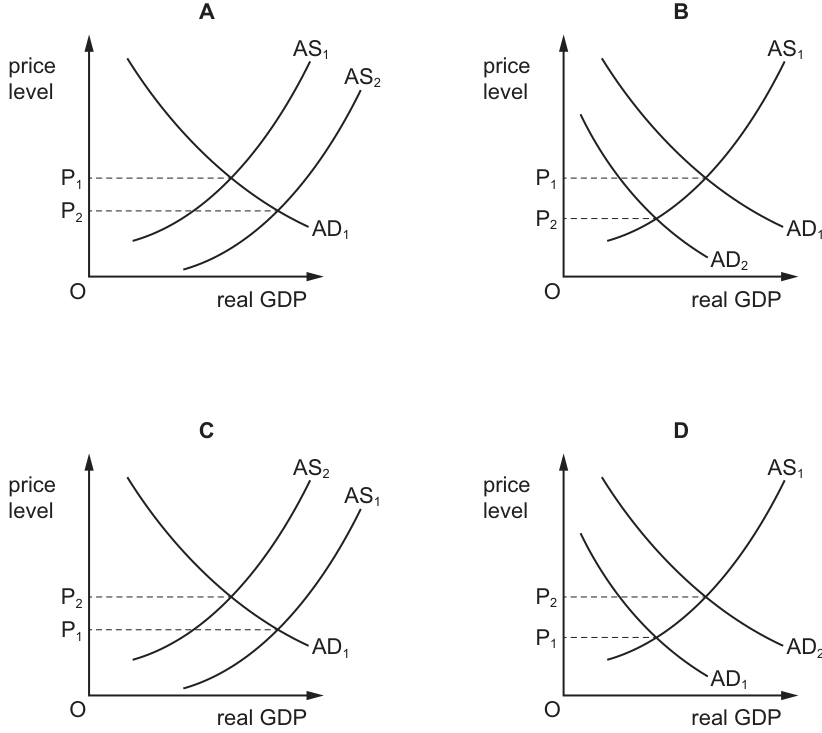
Working
Reducing labour costs lowers firms' production costs, shifting the aggregate supply curve to the right (from AS1 to AS2). With interest rates unchanged, aggregate demand does not shift. The rightward shift in AS results in a lower price level (P1 to P2) and higher real GDP. This corresponds to Diagram A.
Answer
A
A
Background Concept
The aggregate demand and aggregate supply (AD/AS) model explains how the overall price level and real output of an economy are determined. Aggregate demand (AD) represents the total demand for goods and services at different price levels, while aggregate supply (AS) represents the total output firms are willing to produce. The AS curve shifts when production costs change: lower costs shift AS to the right (outward), increasing output and lowering the price level, while higher costs shift AS to the left (inward). The AD curve shifts when there are changes in consumption, investment, government spending, or net exports. Interest rates are a key determinant of AD because they affect borrowing costs for households and firms.
Understanding the Question
The question presents a policy scenario: following the 2007-2008 world economic downturn, governments reduced labour costs and ensured interest rates remained unchanged. The task is to identify which of the four AD/AS diagrams correctly illustrates the outcome of these policies. This requires recognizing that reduced labour costs are a supply-side factor affecting AS, while unchanged interest rates mean AD is not affected. The correct diagram must show an AS shift with no AD shift, and the resulting changes in price level and real GDP.
Approach
First, analyse the effect of reduced labour costs on the aggregate supply curve. Lower wages reduce firms' costs of production, making it profitable to supply more output at every price level, so AS shifts to the right. Second, analyse the effect of unchanged interest rates: since interest rates influence borrowing and spending, keeping them unchanged means aggregate demand does not shift. Third, match this combination (AS shifting right, AD unchanged) to the diagram showing a lower price level and higher real GDP.
Step-by-Step Reasoning
- Labour costs are a major component of firms' production costs. When labour costs fall, the cost of producing each unit of output declines.
- Lower production costs increase firms' profitability at any given price level, incentivizing them to increase output. This causes the aggregate supply curve to shift to the right (outward), from AS1 to AS2.
- Interest rates influence aggregate demand through their effect on consumption (via borrowing costs for households) and investment (via borrowing costs for firms). The question states interest rates remained unchanged, so there is no shift in the aggregate demand curve; it stays at AD1.
- The rightward shift in AS intersects the unchanged AD curve at a new equilibrium. Because the AS curve has shifted right while AD is unchanged, the equilibrium moves to a higher level of real GDP and a lower price level (from P1 to P2).
- Examining the options:
- Diagram A shows AS shifting right (AS1 to AS2), with price level falling (P1 to P2) and real GDP rising. This matches our analysis.
- Diagram B shows AD shifting left (AD1 to AD2), which would result from higher interest rates or reduced government spending, not from unchanged interest rates.
- Diagram C shows AS shifting left (inward from AS1 to AS2), which would result from higher production costs, not lower ones.
- Diagram D shows AD shifting right (AD1 to AD2), which would result from lower interest rates or increased government spending, not from unchanged interest rates.
- Therefore, Diagram A is the correct representation.
Key Takeaways
- Supply-side factors (production costs, productivity) shift the aggregate supply curve.
- Demand-side factors (interest rates, government spending, taxation) shift the aggregate demand curve.
- When analyzing policy combinations, treat each policy's effect separately before combining them.
- A rightward shift in AS (with AD unchanged) lowers the price level and raises real GDP.
- Always check both the direction of the curve shift and the resulting change in price level and output when matching diagrams to scenarios.
Common Mistakes
- Confusing supply-side and demand-side policies: Students often think any government action during a downturn shifts AD, but reducing labour costs is a supply-side measure.
- Misidentifying the direction of the AS shift: Higher costs shift AS left (inward); lower costs shift AS right (outward).
- Ignoring the interest rate condition: If students miss that interest rates are unchanged, they might incorrectly select a diagram showing an AD shift (B or D).
- Confusing the axes or price/output directions: In Diagram A, P2 is below P1 (lower price level) and real GDP is higher to the right.
Things to Be Careful About
- Labour costs are a supply-side determinant; they affect AS, not AD directly.
- "Interest rates remained unchanged" is a deliberate constraint eliminating AD shifts.
- In AD/AS diagrams, a rightward shift of AS means the curve moves toward the lower-right, intersecting AD at a higher output and lower price level.
- Ensure you read the axis labels correctly: price level is vertical, real GDP is horizontal.
- The 2007-2008 downturn context suggests the policy is intended to stimulate the economy, which aligns with increasing AS to boost output without triggering inflation.
The diagram shows the effect on the average price level when aggregate demand (AD) increases from AD1 to AD2.
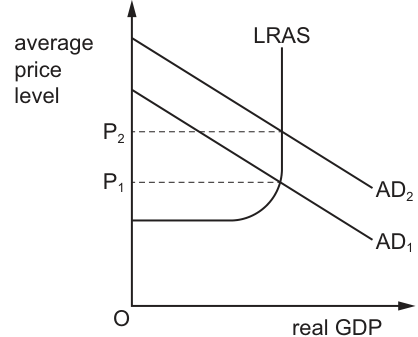
Which statement relating to this change in aggregate demand is correct?
Options
A Nominal GDP has increased.
B Nominal GDP is unchanged.
C Real GDP has increased.
D Real GDP has fallen.
Working
The diagram shows a vertical long-run aggregate supply (LRAS) curve, meaning the economy is operating at its full-employment potential real GDP. When aggregate demand shifts right from AD1 to AD2, the new equilibrium with LRAS occurs at a higher average price level, but real GDP remains unchanged at the potential level, as LRAS is vertical and output cannot exceed full-employment capacity in the long run.
Nominal GDP is measured at current prices and equals the average price level multiplied by real GDP. Since the price level has risen and real GDP is unchanged, nominal GDP must have increased.
Answer
A
A
Background Concept
The aggregate demand and aggregate supply (AD/AS) model is used to analyse changes in the price level and real output in an economy. The long-run aggregate supply (LRAS) curve is vertical at the potential level of real GDP, which is the output produced when all resources, including labour, are fully employed at the natural rate of unemployment. This means that in the long run, the economy's real GDP is fixed at the LRAS level, and changes in aggregate demand (AD) only affect the average price level, not real output.
A key distinction in national income measurement is between real GDP and nominal GDP. Real GDP measures the value of output using constant prices from a base year, so it only changes if the quantity of goods and services produced changes. Nominal GDP measures the value of output using the current year's prices, so it changes if either the quantity of output or the price level changes. The relationship is: Nominal GDP = Average Price Level × Real GDP.
Understanding the Question
The question provides an AD/AS diagram where AD increases (shifts right) from AD1 to AD2, alongside a vertical LRAS curve. You are asked to identify which of the four statements about nominal GDP and real GDP is correct. This requires you to first interpret the diagram to find the change in real GDP and the price level, then apply the definitions of nominal and real GDP to work out the impact on nominal GDP. The question tests your ability to link the AD/AS model to national income concepts, and the absolute claims in the options mean you must verify each against the diagram and theory.
Approach
- First, interpret the diagram: note the shape of the LRAS curve and the direction of the AD shift, then identify the change in real GDP and the price level.
- Use this outcome to eliminate options that make incorrect claims about real GDP.
- Apply the definition of nominal GDP to the changes in price level and real GDP to eliminate remaining incorrect options and select the correct answer.
Step-by-Step Reasoning
- Interpreting the AD/AS diagram: The vertical LRAS curve sits at the economy's potential real GDP, the maximum sustainable output when all resources are fully employed. The initial equilibrium is at the intersection of AD1 and LRAS, with price level P1 and real GDP equal to the LRAS level. When AD shifts right to AD2, the new equilibrium is at the intersection of AD2 and LRAS. Because LRAS is vertical, the real GDP at this new equilibrium is identical to the initial real GDP (it cannot rise above potential in the long run). The only change is a higher average price level, P2.
- Evaluating real GDP claims: Since real GDP is unchanged, option C (real GDP has increased) and option D (real GDP has fallen) are both incorrect. A common mistake here is to assume any rightward AD shift increases real GDP, but this only applies when the economy is below full employment and the short-run AS curve is upward sloping.
- Evaluating nominal GDP claims: Nominal GDP is calculated using current prices, so it equals the average price level multiplied by real GDP. We know the price level has risen from P1 to P2, and real GDP is unchanged. Multiplying a higher price level by the same real GDP gives a higher nominal GDP. This means option B (nominal GDP is unchanged) is incorrect, as it ignores the price level effect on nominal GDP. Only option A (nominal GDP has increased) is consistent with the diagram and the definition of nominal GDP.
Key Takeaways
- A vertical LRAS curve indicates the economy is at full employment, so rightward shifts in AD only raise the price level, with no change in real GDP, in the long run.
- Real GDP is a measure of output volume, adjusted for price changes, so it only changes if the quantity of output produced changes.
- Nominal GDP is a measure of output value at current prices, so it is affected by both changes in output quantity and changes in the price level.
- For multiple-choice questions, eliminating clearly wrong options first simplifies the process of identifying the correct answer.
Common Mistakes
- Assuming AD shifts always increase real GDP: Many students incorrectly believe that any rightward shift in AD raises real GDP. This is only true when the economy is below full employment (when the short-run AS curve is upward sloping). When LRAS is vertical (full employment), AD shifts only affect prices.
- Confusing nominal and real GDP: Students often assume that if real GDP is unchanged, nominal GDP must also be unchanged. This ignores the fact that nominal GDP is calculated at current prices, so it rises if the price level rises even if output is constant.
- Misreading the diagram: Failing to notice that LRAS is vertical leads to the incorrect conclusion that real GDP rises when AD shifts right, eliminating option A prematurely.
- Forgetting the formula for nominal GDP: Some students may not recall that nominal GDP is price level multiplied by real GDP, leading them to incorrectly think nominal GDP is unaffected by price changes when output is constant.
Things to Be Careful About
- Always check the shape of the LRAS curve when analysing AD shifts: a vertical LRAS means the economy is at full employment, so real GDP is fixed.
- Remember the exact definitions of nominal and real GDP: real GDP is adjusted for inflation, nominal is not. Do not mix up which one is affected by price changes.
- For 1-mark multiple-choice questions, work through the logic systematically: first eliminate options that are definitely wrong based on the diagram, then apply relevant definitions to the remaining options to find the correct answer.
- Do not assume that a rightward shift in AD always increases real GDP: the impact depends on whether the economy is below or at full employment, which is indicated by the shape of the LRAS (or SRAS) curve.
The table lists the values of the components of an economy’s circular flow of income.
| component | value $m |
|---|---|
| government spending | 6 |
| exports | 8 |
| investment | 9 |
| imports | 7 |
| saving | 10 |
| tax | 5 |
What can be concluded about the economy from the information shown?
Options
A It has a budget surplus.
B It has a trade deficit.
C It is a mixed, open economy.
D Its circular flow is in equilibrium.
Reasoning
Injections: I + G + X = 9 + 6 + 8 = 23. Leakages: S + T + M = 10 + 5 + 7 = 22. Injections are not equal to leakages, so the circular flow is not in equilibrium. Government spending (6) exceeds tax (5), so there is a budget deficit, not a surplus. Exports (8) exceed imports (7), so there is a trade surplus, not a deficit. The presence of government spending and tax indicates a mixed economy, and the presence of exports and imports indicates an open economy. Therefore, the only correct conclusion is that the economy is a mixed, open economy.
Answer
C
C
Background Concept
The circular flow of income models the flows of money between different sectors of an economy. In its simplest form, it includes households and firms. When we add a government sector and an international sector, the circular flow becomes more complex. Injections are additions to the circular flow that are not generated by household spending: investment (I), government spending (G), and exports (X). Leakages are withdrawals from the circular flow: saving (S), taxation (T), and imports (M). For the circular flow to be in equilibrium (stable income), total injections must equal total leakages: I + G + X = S + T + M. If injections exceed leakages, national income will rise; if leakages exceed injections, income will fall. The presence of a government sector (tax and spending) makes the economy a mixed economy (as opposed to a pure market economy). The presence of international trade (exports and imports) makes it an open economy (as opposed to a closed economy).
Understanding the Question
The question provides a table of values for six components of the circular flow: government spending, exports, investment, imports, saving, and tax. It asks what can be concluded about the economy from these numbers. The four options test knowledge of equilibrium (injections = leakages), budget balance (tax vs government spending), trade balance (exports vs imports), and the type of economy (mixed/open). The task is to compute each comparison and see which statement is true.
Approach
- Compute total injections: I + G + X.
- Compute total leakages: S + T + M.
- Compare to see if equilibrium holds.
- Compare government spending and tax to determine budget surplus or deficit.
- Compare exports and imports to determine trade surplus or deficit.
- Evaluate each option against the computed results.
Step-by-Step Reasoning
Given values:
- Government spending (G) = $6m
- Exports (X) = $8m
- Investment (I) = $9m
- Imports (M) = $7m
- Saving (S) = $10m
- Tax (T) = $5m
Injections = I + G + X = 9 + 6 + 8 = $23m
Leakages = S + T + M = 10 + 5 + 7 = $22m
Injections ($23m) are greater than leakages ($22m), so the circular flow is not in equilibrium. Option D says it is in equilibrium, which is false.
Budget balance: government spending ($6m) exceeds tax ($5m), so there is a budget deficit (spending > revenue). Option A says it has a budget surplus, which is false.
Trade balance: exports ($8m) exceed imports ($7m), so there is a trade surplus (exports > imports). Option B says it has a trade deficit, which is false.
Option C says it is a mixed, open economy. A mixed economy has both a private sector and a government sector. The presence of government spending and tax confirms a government sector, so the economy is mixed. An open economy engages in international trade, which is shown by the inclusion of exports and imports. Therefore, the economy is indeed mixed and open. This conclusion is consistent with the data and is the only correct statement.
Key Takeaways
- The circular flow equilibrium condition is injections = leakages.
- Injections: I + G + X; leakages: S + T + M.
- A mixed economy has a government sector; an open economy trades internationally.
- Budget surplus: tax > government spending; deficit: tax < government spending.
- Trade surplus: exports > imports; deficit: exports < imports.
Common Mistakes
- Confusing injections with leakages. For example, thinking that exports are a leakage or imports are an injection. Exports bring money into the economy (injection), imports take money out (leakage).
- Forgetting that the equilibrium condition is a strict equality. A small difference, as here, means not in equilibrium.
- Misinterpreting the budget balance: comparing tax and government spending, not total government revenue vs spending. Here only tax is given, not other government revenue, but in the simplified model tax is the only government revenue, so it's appropriate.
- Assuming that the presence of any government spending/tax automatically means a mixed economy, which is correct, but some might think it's a planned economy; but mixed means both private and public sectors, which is consistent.
Things to Be Careful About
- The values are given in $m, but the units are not needed for the conclusion.
- The question asks for what can be concluded from the information shown. All options except C are directly contradicted by the data. Even if the equilibrium condition were slightly off, the conclusion about the type of economy is straightforward.
- In a multiple-choice question, always test each option systematically against the data.
- The term 'mixed, open economy' is a classification based on the presence of government and international trade; it does not require any specific numeric relation.
What is a cost of negative economic growth?
Options
A deteriorating balance of payments
B higher inflation
C higher unemployment
D increased pollution
Reasoning
Negative economic growth means real GDP is falling. Firms produce less output, so they reduce their workforce, leading to higher unemployment.
Answer
C
C
Background Concept
Economic growth is measured as the percentage increase in real GDP over a period. Negative economic growth means real GDP is declining, often associated with a recession (commonly defined as two consecutive quarters of negative growth). The main consequences of negative growth include rising unemployment (cyclical unemployment), falling incomes, reduced consumer spending, lower business investment, and possibly deflation or disinflation. It also often leads to lower tax revenues and higher government spending on welfare, worsening the government budget. Pollution may decrease as production falls. The balance of payments may improve or deteriorate depending on relative changes in imports and exports.
Understanding the Question
The question asks: "What is a cost of negative economic growth?" A cost is a negative consequence. Among the four options, only one is a direct and near-universal cost of a recession: higher unemployment. The other options are either unlikely (higher inflation) or not necessarily costs in the context (deteriorating BOP and increased pollution are not typical costs; pollution may actually fall).
Approach
Apply macroeconomic principles to the options. Recall that in a recession:
- Output falls → firms need fewer workers → unemployment rises.
- Demand falls → downward pressure on prices → inflation tends to fall, not rise.
- Imports may fall, potentially improving the trade balance; the effect on the overall BOP is ambiguous.
- Pollution is a by-product of production; less production means less pollution.
Thus, eliminate options based on typical outcomes.
Step-by-Step Reasoning
-
Option C (higher unemployment): Negative economic growth implies falling aggregate demand and/or aggregate supply. Firms face lower demand for their goods and services, so they reduce production. To cut production, they lay off workers or stop hiring, raising the unemployment rate. This is a standard cost of a recession. Cyclical unemployment increases. This is the correct answer.
-
Option A (deteriorating balance of payments): The current account balance depends on exports minus imports. During a recession, domestic incomes fall, reducing spending on imports, which could improve the current account. However, exports may also fall if trading partners are in recession. The net effect is uncertain. Moreover, the question asks for a cost – a deterioration in BOP is not a guaranteed consequence. Some economies might see an improvement. Therefore, it is not a reliable cost.
-
Option B (higher inflation): Inflation is generally lower during periods of negative growth because weak demand reduces firms' ability to raise prices. Demand-pull inflation falls. In extreme cases, deflation may occur. Cost-push inflation could persist if supply shocks cause recession, but this is not the typical association. Higher inflation is more commonly associated with rapid growth. So this is incorrect.
-
Option D (increased pollution): Pollution is often positively correlated with economic output. When output falls, less energy is used, fewer goods are produced, and emissions tend to decrease. For example, during the 2008 recession, global carbon emissions fell. Thus, pollution usually decreases, not increases, making this a benefit (or at least not a cost) of negative growth. Hence, incorrect.
Therefore, the only direct and near-universal cost among the options is higher unemployment.
Key Takeaways
- Negative economic growth (recession) directly raises cyclical unemployment.
- Inflation tends to fall during recessions.
- The current account may improve due to lower imports.
- Pollution may decrease.
- Understanding the typical macroeconomic consequences of business cycle phases is essential.
- Always think: a cost is a negative consequence; evaluate each option against standard economic theory.
Common Mistakes
- Confusing negative growth with inflation: some students might think negative growth causes higher inflation (stagflation). That is possible if there is a supply shock, but it is not the typical case. The question implies general negative growth, not a specific supply-side recession.
- Thinking that a deteriorating balance of payments is always a cost: it could be a benefit if it helps reduce a large surplus. Also, it's not a necessary consequence.
- Assuming pollution always increases with any economic activity: negative growth means less output, so pollution falls.
- Not distinguishing between short-run and long-run consequences: the cost of negative growth is primarily short-run unemployment.
Things to Be Careful About
- Read the question precisely: "cost" means an undesirable outcome.
- Do not overcomplicate: negative growth leads to lower output and employment.
- Consider all options systematically; eliminate based on typical macroeconomic relationships.
- Remember that the question is from an AS Level multiple-choice paper – it tests basic understanding.
A government statistical office measured changes in income from employment, pensions and benefits, then subtracted income tax and welfare contributions and adjusted for inflation.
What did the final figure represent?
Options
A changes in nominal income
B changes in nominal net earnings
C changes in real disposable income
D changes in real gross earnings
Answer
The income from employment, pensions and benefits is gross income. Subtracting income tax and welfare contributions yields net (disposable) income. Adjusting for inflation converts nominal values to real values. Therefore, the final figure represents changes in real disposable income, which is option C.
C
Background Concept
In economics, it is important to distinguish between nominal and real values. Nominal values are measured in current prices, while real values are adjusted for changes in the price level (inflation) to reflect actual purchasing power. Additionally, income can be measured at different stages: gross income is the total income before any deductions, net income is after deductions such as taxes and social security contributions, and disposable income is the income available to households for spending and saving after taxes and welfare contributions. Therefore, real disposable income is the most accurate measure of changes in the purchasing power of households.
Understanding the Question
The question describes a process: start with income from employment, pensions, and benefits (gross income), then subtract income tax and welfare contributions (to get net/disposable income), then adjust for inflation (to convert nominal to real). The final figure is changes in real disposable income. The options are: A changes in nominal income (no adjustments), B changes in nominal net earnings (only tax adjustment, no inflation), C changes in real disposable income (both adjustments), D changes in real gross earnings (only inflation adjustment, no tax). The correct answer is C.
Approach
To solve this, identify the two adjustments: first, the subtraction of taxes and welfare contributions moves from gross to net (disposable) income. Second, the adjustment for inflation moves from nominal to real values. The combination of both yields real disposable income. Compare with the options to see which one matches.
Step-by-Step Reasoning
- Start with changes in income from employment, pensions, and benefits. This is the gross income.
- Subtract income tax and welfare contributions. This reduces gross income to net income, which is the income that households actually receive (disposable income). So after this step, we have changes in nominal disposable income.
- Adjust for inflation. This converts the nominal values into real values by dividing by the price level index. The result is changes in real disposable income.
- Check the options:
- Option A: changes in nominal income – no adjustments, so incorrect.
- Option B: changes in nominal net earnings – only the tax adjustment, no inflation adjustment, so still nominal, incorrect.
- Option C: changes in real disposable income – both adjustments applied, correct.
- Option D: changes in real gross earnings – only inflation adjustment, no tax adjustment, so gross, not net, incorrect.
Key Takeaways
- Real variables are adjusted for inflation; nominal variables are not.
- Disposable income is income after taxes and welfare contributions (net income).
- Real disposable income is the most meaningful measure for analysing changes in household purchasing power.
- When multiple adjustments are applied, the order does not matter mathematically, but conceptually it is important to understand what each adjustment does.
Common Mistakes
- Confusing gross with net: forgetting to subtract taxes and welfare contributions leads to choosing option D (real gross earnings).
- Confusing nominal with real: forgetting to adjust for inflation leads to choosing option B (nominal net earnings).
- Only applying one adjustment: some students might choose A if they think no adjustments are needed.
- Misunderstanding the term "disposable income": it is income after tax, not before.
Things to Be Careful About
- Ensure you understand the meaning of each adjustment: subtracting taxes and welfare contributions gives net (disposable) income, adjusting for inflation gives real values.
- The question asks for "changes in" the final figure, so it is about the change over time, not the level. The adjustments are applied to the changes as well.
- In multiple-choice questions, carefully read each option and eliminate those that do not match the described process.
Which combination of fiscal and monetary policies is most likely to be effective in the short run to prevent deflation in a closed economy?
Options
| fiscal policy | monetary policy | |
|---|---|---|
| A | decreasing the budget deficit | decreasing the interest rate |
| B | decreasing the budget deficit | decreasing the money supply |
| C | increasing the budget deficit | decreasing the interest rate |
| D | increasing the budget deficit | decreasing the money supply |
Reasoning
To prevent deflation (a falling price level), the economy needs an increase in aggregate demand. Expansionary fiscal policy involves increasing the budget deficit (by raising government spending or cutting taxes). Expansionary monetary policy involves lowering interest rates or increasing the money supply. Option C combines an expansionary fiscal policy (increasing the budget deficit) with an expansionary monetary policy (decreasing the interest rate), thus boosting AD on both fronts, making it the most effective in the short run. The other options mix expansionary and contractionary policies, which would partially offset each other, making them less effective.
Answer
C
C
Background Concept
Deflation is a sustained fall in the general price level. In a closed economy, preventing deflation requires increasing aggregate demand (AD) or preventing it from falling. Fiscal policy involves the government adjusting its spending and taxes; monetary policy involves the central bank adjusting interest rates and the money supply. Both can be used to shift the AD curve to the right, raising the price level and real output in the short run.
Understanding the Question
This multiple-choice question asks which combination of fiscal and monetary policies is 'most likely to be effective in the short run to prevent deflation' in a closed economy. The options pair either increasing or decreasing the budget deficit (fiscal) with either decreasing the interest rate or decreasing the money supply (monetary). Correctly identifying expansionary policies and recognising that both need to work together is key.
Approach
First, recall the definition of deflation and the need to increase AD. Second, identify which of the listed fiscal changes is expansionary (increasing the budget deficit) and which is contractionary (decreasing the budget deficit). Third, identify which monetary change is expansionary (decreasing the interest rate) and which is contractionary (decreasing the money supply). Finally, select the option where both policies are expansionary, as that will provide the strongest boost to AD.
Step-by-Step Reasoning
- Deflation and AD: Deflation occurs when AD falls or AS increases rapidly, but in this context the focus is on insufficient AD. The most direct way to prevent deflation is to increase AD, raising the price level.
- Fiscal policy: An increase in the budget deficit (higher government spending or lower taxes) is expansionary – it injects spending into the circular flow, shifting AD right. A decrease in the budget deficit is contractionary.
- Monetary policy: A decrease in the interest rate reduces the cost of borrowing, encouraging consumption and investment, and also increases the money supply via lower reserve requirements or open market purchases – all expansionary. Decreasing the money supply would raise interest rates and reduce borrowing, shifting AD left.
- Evaluating the options:
- A: Decreasing budget deficit (contractionary) + decreasing interest rate (expansionary) – mixed, net effect uncertain, less effective.
- B: Decreasing budget deficit (contractionary) + decreasing money supply (contractionary) – both contractionary, would worsen deflation.
- C: Increasing budget deficit (expansionary) + decreasing interest rate (expansionary) – both expansionary, strongest boost to AD.
- D: Increasing budget deficit (expansionary) + decreasing money supply (contractionary) – mixed, partially offsetting.
- Conclusion: Option C is the only one where both policies are expansionary, making it the most effective to prevent deflation in the short run.
Key Takeaways
- Deflation is a fall in the price level and can be countered by expansionary macroeconomic policies.
- Expansionary fiscal policy: increase budget deficit (increase spending or cut taxes).
- Expansionary monetary policy: lower interest rates or increase money supply.
- For maximum impact, both policies should be used together in the same direction.
Common Mistakes
- Confusing expansionary and contractionary policies: students may think decreasing the budget deficit or decreasing the money supply is expansionary.
- Not recognising that the question asks for the combination 'most likely to be effective' – a mixed approach is less effective than a unified expansionary one.
- Overlooking the 'short run' clause – in the short run, AD policies are effective even if supply-side constraints might limit the long-run effect.
Things to Be Careful About
- Remember that decreasing the money supply is contractionary, not expansionary, even though it is often associated with 'tight' monetary policy.
- The budget deficit is the difference between spending and revenue; increasing it is expansionary, decreasing it is contractionary.
- In a closed economy, there is no exchange rate or trade channel, so the analysis purely relies on domestic AD components.
Which macroeconomic objective is most likely to be achieved by increasing income tax?
Options
A depreciation of the exchange rate
B economic growth
C low unemployment
D price stability
Reasoning
Increasing income tax reduces households' disposable income. Lower disposable income reduces consumption expenditure, a component of aggregate demand (AD = C + I + G + X - M). A fall in AD reduces the general price level when the economy is operating near full capacity or experiencing demand-pull inflation. Therefore, price stability is the macroeconomic objective most likely to be achieved.
The other options are unlikely: a fall in AD reduces economic growth and employment, while a lower price level (if domestic prices fall relative to foreign prices) might cause the exchange rate to appreciate, not depreciate.
Answer
D
D
Background Concept
Income tax is a direct tax levied on individuals' earnings. It is a key tool of fiscal policy. An increase in income tax is a contractionary fiscal policy measure, designed to reduce aggregate demand in the economy. Aggregate demand (AD) is the total spending on domestically produced goods and services: AD = C + I + G + (X - M). Consumption (C) is the largest component and is heavily influenced by disposable income.
Understanding the Question
The question asks which macroeconomic objective (out of exchange rate depreciation, economic growth, low unemployment, and price stability) is 'most likely to be achieved' by raising income tax. It expects you to know the impact of a tax rise on aggregate demand and then on each objective. Price stability (low inflation) is the natural result of reducing demand-pull inflationary pressure. The other options would be harmed, not helped, by a tax increase.
Approach
- Identify the type of fiscal policy: an income tax increase is contractionary.
- Trace the effect on disposable income and consumption.
- Recognise that lower consumption reduces AD.
- In an AD/AS framework, a leftward shift of AD lowers the price level (or reduces the rate of inflation). This directly supports price stability.
- Briefly consider each other option to confirm they are made worse, not better.
Step-by-Step Reasoning
- Step 1: Effect on disposable income. An increase in income tax means households keep less of their gross income. Disposable income falls.
- Step 2: Effect on consumption. With less disposable income, households spend less on goods and services. Consumption (C) falls.
- Step 3: Effect on aggregate demand. Since C is part of AD, a fall in C shifts the AD curve to the left (a contractionary demand shock).
- Step 4: Effect on the price level. If the economy is on the upward-sloping part of the short-run aggregate supply (SRAS) curve, a leftward shift of AD leads to a lower price level (or a lower rate of inflation). This directly achieves the objective of price stability.
- Step 5: Effects on other objectives.
- Economic growth: A fall in AD reduces real output (GDP). So economic growth is harmed, not achieved.
- Low unemployment: Lower output means firms produce less, so they may reduce employment. Unemployment rises.
- Exchange rate depreciation: A lower domestic price level (if it occurs relative to trading partners) may actually strengthen the currency (appreciation), not weaken it. Depreciation is not likely.
Thus, price stability is the only objective that is helped.
Key Takeaways
- Contractionary fiscal policy (higher taxes or lower government spending) reduces AD.
- Reducing AD helps control demand-pull inflation, thus achieving price stability.
- The same policy harms economic growth and employment.
- Always trace the policy through the AD/AS model to see the effect on output and prices.
Common Mistakes
- Confusing expansionary with contractionary policy: some might think higher income tax stimulates the economy (it does the opposite).
- Ignoring the AD/AS mechanism: simply stating 'higher tax reduces inflation' without explaining the chain of causation loses marks in longer-answer questions.
- Thinking lower inflation automatically causes depreciation: actually, lower domestic prices relative to foreign prices can lead to appreciation under floating exchange rates if the real exchange rate adjusts.
Things to Be Careful About
- The question is about 'most likely' – you don't need perfect certainty; choose the option that is unambiguously helped.
- In an MCQ, read all options; sometimes two might seem plausible, but the question asks for 'most likely'.
- Remember the components of AD and how fiscal policy affects each: consumption from income tax, investment from corporate taxes or interest rates, government spending directly from G.
What is not a supply-side policy?
Options
A increasing government expenditure on infrastructure
B increasing research and development expenditure
C increasing subsidies for education and training
D increasing the supply of money
Reasoning
Supply-side policies are designed to increase the productive capacity of the economy by shifting the LRAS curve to the right. Policies that improve the supply side include increasing government expenditure on infrastructure, increasing expenditure on research and development, and increasing subsidies for education and training. These all aim to raise productivity and potential output. Increasing the supply of money, however, is a monetary policy tool used to manage aggregate demand and influence interest rates; it does not directly affect the productive capacity of the economy. Therefore, it is not a supply-side policy.
Answer
D
D
Background Concept
Supply-side policies are aimed at increasing the long-run aggregate supply (LRAS) of an economy by improving the quantity and/or quality of factors of production. Common supply-side measures include investment in infrastructure (capital), research and development (technological progress), and education and training (human capital). Monetary policy, on the other hand, involves the control of the money supply and interest rates by the central bank to influence aggregate demand and stabilize the economy. The tools of monetary policy include open market operations, changing the policy interest rate, and adjusting reserve requirements.
Understanding the Question
This multiple-choice question tests your ability to distinguish between supply-side policies and other types of macroeconomic policy. You are given four options (A, B, C, D) and asked to identify which one is NOT a supply-side policy. Options A, B, and C are typical examples of supply-side policies as they aim to increase the economy's productive capacity. Option D refers to increasing the supply of money, which is a key tool of monetary policy, not supply-side policy.
Approach
Recall the definitions and objectives of supply-side policy and monetary policy. Identify the policy measure that does not directly contribute to increasing the LRAS. For each option, consider its impact on the economy's productive capacity.
Step-by-Step Reasoning
- Option A: Increasing government expenditure on infrastructure (e.g., building roads, ports, and broadband) improves the capital stock of the economy. Better infrastructure enhances productivity and potential output, thus shifting LRAS to the right. This is a supply-side policy.
- Option B: Increasing research and development expenditure leads to technological innovation, which can result in new production techniques and increased efficiency. This also raises productivity and potential output, making it a supply-side policy.
- Option C: Increasing subsidies for education and training improves the skills and qualifications of the workforce, increasing human capital. A more educated workforce is more productive, shifting LRAS to the right. This is a supply-side policy.
- Option D: Increasing the supply of money is a monetary policy action. It can affect interest rates, investment, and consumption, thereby influencing aggregate demand. While it may have indirect effects on the supply side in the long run, its primary purpose and immediate impact are on aggregate demand, not directly on productive capacity. Therefore, it is not considered a supply-side policy.
Thus, the correct answer is D.
Key Takeaways
- Supply-side policies directly aim to increase the productive capacity of the economy, shifting LRAS to the right.
- Monetary policy primarily influences aggregate demand through changes in the money supply and interest rates.
- It is important to categorise policies correctly according to their mechanisms and objectives.
- Common supply-side tools include infrastructure spending, R&D support, education/training subsidies, tax reforms to incentivise work and investment, and deregulation.
Common Mistakes
- Confusing expansionary monetary policy with supply-side policy because both can be used to stimulate the economy. However, they act through different channels: demand vs. supply.
- Thinking that any government spending is supply-side; only spending that enhances productive capacity qualifies.
- Overlooking that increasing the money supply is a demand-side tool, even though in the long run it may have some supply-side effects through investment if interest rates fall, but it is not classified as a supply-side policy.
Things to Be Careful About
- Focus on the primary objective and mechanism of each policy.
- Supply-side policies are designed to increase the economy's ability to produce goods and services, i.e., shift LRAS.
- Monetary policy is mostly used to manage short-term fluctuations in aggregate demand.
- In exams, be precise in definitions and avoid mixing categories.
When can a policy be classified as macroeconomic?
Options
A when it focuses on the level of individual welfare
B when it involves economy-wide institutions and behaviour
C when it is based on the control of monopoly markets
D when it relies on the use of buffer stock schemes
Reasoning
Macroeconomics examines the economy as a whole, focusing on aggregate variables such as national output, inflation, unemployment, and the balance of payments. A macroeconomic policy is one that targets these economy-wide objectives rather than specific markets or individual welfare. Option B correctly identifies that a policy is macroeconomic when it involves economy-wide institutions and behaviour.
Answer
B
B
Background Concept
Economics is divided into microeconomics and macroeconomics. Microeconomics studies the behaviour of individual economic agents (households, firms) and specific markets. Macroeconomics studies the economy as a whole, focusing on aggregate measures like GDP, inflation, unemployment, and the balance of payments. A macroeconomic policy is a government policy that aims to influence these aggregate variables. Examples include fiscal policy (government spending and taxation), monetary policy (interest rates, money supply), and supply-side policy (to increase productive capacity). These policies affect the entire economy, not just a particular market or individual.
Understanding the Question
The question asks: "When can a policy be classified as macroeconomic?" It gives four options. The candidate must identify the correct criterion for classification. The key is to distinguish between policies that target the overall economy versus those that are microeconomic or specific.
Approach
We need to evaluate each option against the definition of macroeconomics. The correct answer is the one that captures the economy-wide scope. We can eliminate options that refer to individual welfare, control of monopoly markets, or buffer stock schemes, as these are microeconomic or specific to certain markets.
Step-by-Step Reasoning
- Option A: "when it focuses on the level of individual welfare" – This is microeconomic, as it deals with individual utility or well-being. Policies to improve individual welfare, such as social assistance, are not necessarily macroeconomic unless they are broad enough to affect aggregate demand, but the focus on individual level is micro.
- Option B: "when it involves economy-wide institutions and behaviour" – This correctly describes macroeconomics. Macroeconomics deals with the behaviour of the economy as a whole, including institutions like the central bank, government, and aggregate behaviour of households and firms.
- Option C: "when it is based on the control of monopoly markets" – This is a specific market structure issue, which is microeconomic. Competition policy might target monopolies, but it is not macroeconomic.
- Option D: "when it relies on the use of buffer stock schemes" – Buffer stock schemes are used to stabilise prices of specific commodities, such as agricultural products. This is a microeconomic intervention in a particular market.
Thus, only Option B correctly defines macroeconomic policy.
Key Takeaways
- Macroeconomics is about the economy as a whole.
- Macroeconomic policies affect aggregate variables like output, employment, and prices.
- Microeconomic policies target specific markets or individual behaviour.
- The distinction is important for understanding the scope and impact of government policies.
Common Mistakes
- Confusing macroeconomic policy with any government policy that has a large impact. For example, a tax cut might be macroeconomic if it affects aggregate demand, but the classification depends on the objective and scope.
- Thinking that any policy that involves the government is macroeconomic. Many government policies are microeconomic, such as regulations on specific industries.
- Selecting option A because "individual welfare" sounds like a broad goal, but the level of analysis is micro.
Things to Be Careful About
- Read the question carefully: it asks "when can a policy be classified as macroeconomic?" not "what is an example of a macroeconomic policy?".
- Ensure you understand the difference between micro and macro: micro is about individual units, macro is about aggregates.
- Do not overthink: the answer is explicitly about the economy-wide scope.
The demand for a country’s exports is price elastic.
If it is experiencing a deficit on the current account of its balance of payments, which combination of policies is most likely to correct the deficit?
Options
| rate of interest | exchange rate | standard rate of income tax | |
|---|---|---|---|
| A | decrease | appreciate | keep unchanged |
| B | decrease | depreciate | decrease |
| C | increase | keep unchanged | decrease |
| D | keep unchanged | depreciate | increase |
Answer
Since the demand for exports is price elastic, a depreciation of the exchange rate reduces the foreign currency price of exports and raises the domestic price of imports. With elastic demand, the quantity of exports demanded increases by a larger proportion than the price fall, so export revenue rises, while the quantity of imports falls by a larger proportion than the price rise, reducing import expenditure. This directly improves the current account balance.
An increase in the standard rate of income tax reduces households' disposable income, lowering total consumption expenditure, including spending on imported goods. This further reduces the deficit.
Keeping the rate of interest unchanged avoids stimulating domestic spending (via lower borrowing costs for investment and consumption) which would increase imports and offset some of the improvement from depreciation and tax increases.
Option D (keep interest unchanged, allow the exchange rate to depreciate, increase income tax) is therefore the combination most likely to correct the deficit.
Options A, B and C each include a policy that works against the correction: appreciation in A, a tax cut in B or C (which increases import spending), or an interest rate increase in C that could cause appreciation.
Answer
D
D
Background Concept
A current account deficit means a country is spending more on imports of goods, services, incomes and transfers than it earns from exports. Correcting the deficit typically requires either reducing the exchange rate (depreciation) to make exports cheaper and imports more expensive, and/or reducing domestic spending to lower import demand. The price elasticity of demand for exports (PED) determines how strongly export revenue responds to a change in the exchange rate. If export demand is price elastic (PED > 1), a fall in the price of exports leads to a more than proportionate increase in quantity demanded, raising total revenue from exports. This is the key assumption of the Marshall–Lerner condition, which states that a depreciation will improve the current account if the sum of the price elasticities of demand for exports and imports is greater than one.
Fiscal policy – changing taxes or government spending – affects disposable income and hence consumption, including imports. A rise in income tax reduces disposable income, reducing consumption of both domestic and imported goods, which helps reduce the deficit. Monetary policy – changing interest rates – affects borrowing, investment and consumption, and also influences capital flows and the exchange rate.
Understanding the Question
The question sets a scenario: a country has a current account deficit, and the demand for its exports is price elastic. The candidate must choose which combination of three policy changes (rate of interest, exchange rate, standard rate of income tax) is most likely to correct the deficit. The options are presented as a table with combinations of increase, decrease, keep unchanged for each policy. The answer requires evaluating how each policy affects the current account given the elasticity condition.
Approach
Evaluate each policy lever separately, then assess the net effect of the combination. For the exchange rate: depreciation helps the deficit when exports are elastic. For income tax: higher tax reduces spending, especially on imports, helping the deficit. For interest rate: a cut may stimulate spending (worsening the deficit) but could also cause depreciation (helping); a rise could cause appreciation (worsening) or reduce spending (helping). The question asks for the combination ‘most likely’ to correct the deficit, so we look for the set of changes that all work in the same direction.
Step-by-Step Reasoning
-
Exchange rate effect: A depreciation (a fall in the value of the domestic currency) makes exports cheaper in foreign currency and imports dearer in domestic currency. Given price-elastic export demand, the quantity of exports demanded rises by a larger percentage than the price falls, so total export revenue increases. Imports also become more expensive, reducing the quantity demanded; with elastic demand (likely but not stated), import expenditure falls. The trade balance (exports – imports) improves. An appreciation would have the opposite effect and worsen the deficit.
-
Income tax effect: Raising the standard rate of income tax reduces households’ disposable income. This reduces overall consumption (the largest component of aggregate demand) and, importantly, reduces spending on imported goods. With lower import spending, the current account improves. A tax cut, conversely, would stimulate consumption and imports, worsening the deficit.
-
Interest rate effect: The rate of interest affects both aggregate demand and the exchange rate. A cut in interest rates stimulates investment and consumption (raising imports) and may cause capital outflows, leading to depreciation (which helps the trade balance on the export side). The net effect is ambiguous. Raising interest rates reduces spending and may attract capital inflows, appreciating the currency – harming the trade balance. Keeping interest rates unchanged avoids these complications.
-
Option analysis:
- Option A: Decrease interest + appreciate + tax unchanged. Appreciation worsens trade; interest cut stimulates imports; no offset from tax. Deficit worsens.
- Option B: Decrease interest + depreciate + decrease tax. Depreciation helps, but both lower interest and lower tax stimulate spending and imports, partially or fully offsetting the improvement. Not the best.
- Option C: Increase interest + keep exchange rate unchanged + decrease tax. Interest rise may cause appreciation, harming trade; tax cut boosts imports. Deficit worsens.
- Option D: Keep interest unchanged + depreciate + increase tax. All three changes are consistent: depreciation improves trade via elasticity, the tax rise reduces import spending, and unchanged interest avoids unintended stimulus or appreciation. This combination is most likely to correct the deficit.
-
Conclusion: Option D best aligns the policy tools to improve the current account given elastic export demand.
Key Takeaways
- The effectiveness of exchange rate changes on the trade balance depends on price elasticities (the Marshall–Lerner condition).
- Contractionary fiscal policy (higher taxes) can directly reduce import spending, reinforcing the effect of depreciation.
- Interest rate changes have complex effects through both aggregate demand and the exchange rate, making them less straightforward for correcting a deficit.
- When evaluating policy mixes, look for changes that all work in the same direction toward the objective.
Common Mistakes
- Assuming that depreciation always improves the current account without checking the elasticities involved. The question explicitly gives price-elastic export demand, so depreciation is helpful here, but not always.
- Overlooking the impact of tax changes on imports – a tax cut stimulates spending, worsening the deficit.
- Confusing the effects of appreciation and depreciation on trade flows.
- Ignoring the interaction between interest rates, capital flows and the exchange rate – an interest rate cut might cause depreciation, but the question treats ‘exchange rate’ as a separate policy lever, implying the government can change it independently (e.g., by foreign exchange intervention).
Things to Be Careful About
- The question asks for the combination ‘most likely’ – not a guarantee of success. Recognise that other factors (elasticity of imports, time lags, reaction of trading partners) could alter the outcome.
- The demand for exports is given as price elastic, but import demand elasticity is not stated. In reality, both matter. However, the options that help the most are still the ones with depreciation and higher tax.
- The policy options assume the government can simultaneously change the exchange rate, interest rate and tax rate. In practice, some combinations might be inconsistent (e.g., cutting interest rates and trying to appreciate the currency), but the question treats them as independent choices.
What is an unintended consequence of the US government restricting imports of cheap Chinese steel?
Options
A US importers of steel pay lower prices for steel.
B US manufacturers become less competitive.
C US steel makers increase steel production.
D US steel workers receive higher incomes.
Answer
The restriction on imports of cheap Chinese steel reduces the supply of steel in the US market, raising the price of steel. US steel producers benefit from higher prices and output, but US manufacturers that use steel as an input face higher costs, reducing their competitiveness compared to foreign rivals. This is an unintended consequence, as the policy aims to protect the steel industry but harms downstream industries. Option B is correct.
B
Background Concept
A tariff or import quota on a good raises its domestic price by reducing the supply available from abroad. The intended effect is to protect domestic producers of that good from foreign competition, allowing them to increase output, employment, and profits. However, the policy also affects downstream industries that use the protected good as an input. If those downstream industries face higher input costs, they become less competitive internationally, potentially losing market share and reducing output. This is a classic unintended consequence of protectionism.
Understanding the Question
The question asks for an 'unintended consequence' of the US government restricting imports of cheap Chinese steel. The restriction could be a tariff or a quota. The likely intended consequences are to boost the US steel industry: higher steel prices, increased production, and higher incomes for steel workers. The unintended consequence is something that the government did not aim for and that harms other parts of the economy. Options A, C, and D describe effects that are either intended or the opposite of what actually happens. Option B—US manufacturers become less competitive—is the correct unintended consequence.
Approach
Identify the effect of the import restriction on the domestic steel market: supply of steel falls, price rises. Then trace the impact on two groups: (1) US steel producers (intended beneficiaries) and (2) US manufacturers that use steel as an input (the unintended losers). The key is to recognise that the higher steel price raises costs for manufacturers, making them less competitive against foreign manufacturers who still have access to cheap steel. This is a classic application of supply and demand analysis to a tariff.
Step-by-Step Reasoning
-
Effect on the steel market: The restriction on imports of cheap Chinese steel reduces the total supply of steel available in the US. In a supply and demand diagram, the supply curve shifts left. This causes the equilibrium price of steel to rise and the quantity traded to fall. US steel producers (the domestic industry) receive a higher price, so they are likely to increase production (option C). Steel workers may also benefit from higher wages or more employment (option D). These are intended outcomes.
-
Effect on US manufacturers: Many US manufacturers (e.g., car makers, construction firms, appliance producers) use steel as an input. Their production costs rise because they now have to pay more for steel. This increases their average costs, reducing their profit margins. To compete, they may have to raise their own prices, which makes them less competitive compared to foreign manufacturers who can still obtain cheap steel from other sources (or who are not subject to the import restriction).
-
Why other options are not unintended consequences: Option A is incorrect because US importers of steel pay higher prices, not lower. Option C is an intended consequence (the policy aims to increase US steel production). Option D is also an intended consequence (the policy aims to protect steel workers' jobs and incomes). Option B is the only one that is both a real effect and unintended.
-
Conclusion: The unintended consequence is that US manufacturers become less competitive, harming downstream industries and potentially leading to job losses in those sectors. This is a classic argument against protectionism: it may protect one industry at the expense of others.
Key Takeaways
- Protectionist policies have both intended and unintended effects on different stakeholders.
- The immediate effect of a tariff or quota is to raise the domestic price of the protected good.
- Downstream industries that use the protected good as an input face higher costs, which can reduce their competitiveness.
- When evaluating trade policies, it is important to consider the entire supply chain, not just the protected industry.
Common Mistakes
- Thinking that the restriction benefits all US industries: only the protected industry benefits directly; downstream industries are harmed.
- Confusing the direction of price change: imports are restricted, so supply falls, price rises, not falls.
- Assuming that the intended consequence (protecting the steel industry) is the only consequence; the question specifically asks for an unintended consequence.
Things to Be Careful About
- Read the question carefully: 'unintended consequence' means the government did not aim for this outcome.
- Distinguish between short-run and long-run effects: the loss of competitiveness may be more severe in the long run as manufacturers relocate or lose market share.
- In an MCQ, eliminate options that are clearly intended or factually incorrect.
What is an export of services in Jamaica’s current account?
Options
A an inflow of funds to Jamaica to buy shares
B earnings from US tourists visiting Jamaica
C earnings of Haitian workers in Jamaica sent to Haiti
D the export of Jamaican coffee
Reasoning
The current account of the balance of payments records flows of goods, services, primary income, and secondary income between residents and non-residents.
- A: an inflow of funds to buy shares is a capital/financial account transaction, not an export of services.
- B: earnings from US tourists visiting Jamaica are payments for services provided by Jamaican tourist firms to foreign visitors. This is an export of services.
- C: earnings of Haitian workers in Jamaica sent to Haiti are a debit on secondary income (workers' remittances), not an export of services.
- D: the export of Jamaican coffee is an export of goods (visible trade), not an export of services.
Answer
B
B
Background Concept
The balance of payments records all transactions between residents of one country and the rest of the world. The current account is one key component and it is divided into four parts:
- Trade in goods (visible trade) – exports and imports of physical items like coffee, machinery, oil.
- Trade in services (invisible trade) – exports and imports of services such as tourism, banking, shipping, insurance, education.
- Primary income – earnings on investment and employment: profits, dividends, interest, and compensation of employees working abroad.
- Secondary income – transfers of money without a direct exchange of goods or services, including foreign aid, remittances, and pension payments.
An export is any transaction that brings money into the country from a non-resident in exchange for goods or services. The key skill tested here is correctly classifying a given real-world transaction into one of these four accounts.
Understanding the Question
The question asks: “What is an export of services in Jamaica’s current account?” This means which of the four options represents a service that Jamaica sells to foreigners. The command word “What is” simply requires identification of the correct classification.
Options:
- A: an inflow of funds to Jamaica to buy shares – this buying of shares is a portfolio investment, which goes into the financial account (capital account), not the current account.
- B: earnings from US tourists visiting Jamaica – this represents spending by foreign tourists on Jamaican tourism services (accommodation, meals, tours). The tourists are non-residents paying for a service while in Jamaica. This counts as an export of services.
- C: earnings of Haitian workers in Jamaica sent to Haiti – this is money sent back home, a transfer of earnings, which is a secondary income outflow from Jamaica (a debit), not an export of services.
- D: the export of Jamaican coffee – coffee is a physical good, so this is an export of goods, not services.
Approach
For each option, decide which of the four current account components it falls into, or if it falls outside the current account entirely (into the capital/financial account). The correct answer is the one that is clearly an export of services – a service provided by Jamaican residents to non-residents, earning foreign exchange for Jamaica.
Step-by-Step Reasoning
-
Option A: An inflow of funds to buy shares represents a financial investment. Buying shares in a Jamaican company is a financial transaction; it adds to Jamaica’s external liabilities (foreign ownership). This is recorded in the capital/financial account, not the current account. It is not an export of services.
-
Option B: US tourists visiting Jamaica require accommodation, food, transport, guided tours, etc. These are services. When the tourists pay for them, the money is a receipt from non-residents for services rendered. In Jamaica’s current account, this is recorded as a credit (export) under “trade in services.” Tourism is a major service export for many economies. This is the correct answer.
-
Option C: Haitian workers in Jamaica earn income; when they send part of those earnings to family in Haiti, that is a remittance outflow. Remittances are classified under secondary income (transfers). For Jamaica, it is a debit (outflow) on secondary income because money is leaving the country to non-residents without a direct good or service in return. This is not an export.
-
Option D: Coffee is a physical good. The export of coffee is recorded under “trade in goods.” It is a visible export, not a service export.
Therefore, only option B fits the definition of an export of services.
Key Takeaways
- The current account has four components: goods, services, primary income, and secondary income. It is essential to be able to classify transactions correctly.
- An “export of services” can include tourism, consulting, banking, shipping, education, etc. It is money received from non-residents for a non-physical item supplied by residents.
- Distinguishing between the current account and financial account is critical when faced with flows like buying shares (financial account) or receiving foreign direct investment.
Common Mistakes
- Confusing “export of goods” with “export of services.” Coffee is a good, so D is not the answer.
- Thinking that sending money abroad (remittances) is a service – it is a secondary income transfer, not a trade in services.
- Assuming any inflow of foreign money is an export; money to buy shares is an investment inflow (financial account), not an export of services.
Things to Be Careful About
- Read the question carefully: it specifies “export of services” – not “export of goods” or “current account credit.”
- Remember that the classification depends on the nature of the transaction (good vs service vs income vs transfer), not just on the direction of flow.
- For the current account, services include tourism, financial services, IT services, royalties, and many others – not just physical products.
A country imports natural gas for which it has price-inelastic demand.
What is the effect if that country imposes an import duty on the gas?
Options
A Consumers in the importing country will suffer a loss of consumer surplus.
B The exporting country will gain export revenue.
C The importing country’s primary income will increase.
D The price of natural gas will rise in other importing countries.
Reasoning
An import duty (tariff) raises the domestic price of the imported gas above the world price. Because domestic demand is price-inelastic, the percentage decrease in quantity demanded is smaller than the percentage increase in price. Consumers pay a higher price for each unit they continue to buy, and they also lose the consumer surplus they previously enjoyed on the units no longer purchased. The loss of consumer surplus is thus significant and clearly suffered by consumers in the importing country.
Option B is incorrect because the higher price paid by domestic consumers goes to the government as tariff revenue, not to the exporting country. Option C is wrong because tariff revenue is counted as a tax on imports and appears in the current account as a debit (imports valued at the world price plus tariff), not as primary income; primary income consists of earnings from investments abroad. Option D is incorrect because the tariff applies only to imports of this one country; it does not directly affect the world price paid by other importers, especially since this country is not a large buyer (the question does not state market power).
Answer
A
A
Background Concept
An import duty (tariff) is a tax on imported goods. It raises the domestic price of the imported product above the world price, reducing the quantity traded. Consumer surplus is the difference between what consumers are willing to pay and what they actually pay; it is measured by the area below the demand curve and above the price line. When the price rises, consumers lose surplus: they pay more for the units they still buy (the price effect) and they lose the surplus on the units they stop buying (the quantity effect). The size of the loss depends on the price elasticity of demand: if demand is inelastic (PED close to zero), the quantity effect is small but the price effect is large, so total consumer surplus loss is substantial.
Understanding the Question
The question describes a country that imports natural gas for which it has price-inelastic demand. The country then imposes an import duty on the gas. We are asked to identify the effect from four options. The correct answer is that consumers in the importing country will suffer a loss of consumer surplus. The question tests basic tariff theory and the link between elasticity and the burden of a tax.
Approach
First, recall the standard analysis of a tariff in a small importing country: the domestic price rises to world price + tariff, domestic consumption falls, domestic production rises (if any), and the government collects tariff revenue. Consumer surplus necessarily falls. Then evaluate each option: A is consistent with this analysis; B confuses tariff revenue with exporter revenue; C misidentifies tariff revenue as primary income (which is from factor services abroad); D assumes the tariff affects world price, which it does not if the country is small in the world market (and no information suggests it is large).
Step-by-Step Reasoning
-
Effect of the tariff on domestic price: The tariff adds to the world price, so the domestic price of gas rises. With inelastic demand, the quantity demanded falls only slightly. Consumers now pay a higher price for each unit they purchase.
-
Consumer surplus change: Consumer surplus is the area under the demand curve above the price. When price rises from P_w (world price) to P_w + tariff:
- Consumers lose surplus equal to the rectangle P_w to P_w+tariff on the original quantity (the extra payment on units still bought).
- They also lose the triangular area on the reduced quantity (surplus from units no longer bought).
- Since demand is inelastic, the rectangle (price effect) is large relative to the triangle (quantity effect). Overall, consumers definitely suffer a loss.
-
Option A is correct: Consumers suffer a loss of consumer surplus. This is the direct and certain effect.
-
Why Option B is wrong: The higher price paid by consumers includes the tariff. The tariff revenue accrues to the importing government, not to the exporting country. The exporting country receives only the world price per unit (which may even fall if the importing country is large enough to affect world demand, but the question does not indicate that).
-
Why Option C is wrong: Primary income in the balance of payments includes compensation of employees and investment income (dividends, interest). Tariff revenue is a tax, not a factor income. It appears in the government budget, not directly in the current account as primary income. If the tariff revenue is recorded, it might be part of secondary income (transfers) or simply not appear in the current account at all (it is a tax, not an international transaction).
-
Why Option D is wrong: The tariff is imposed by one importing country. Unless that country is a large buyer (e.g., it accounts for a significant share of world demand – not stated), the tariff does not affect the world price. Other importing countries still pay the world price (or a price determined by their own supply and demand). The question does not mention any market power, so we assume the country is small.
Thus, only A is correct.
Key Takeaways
- A tariff always raises the domestic price and reduces consumer surplus. The extent of the loss depends on elasticities.
- The burden of a tariff falls on domestic consumers (via higher prices) and domestic producers (if they face import competition), but the government gains tariff revenue.
- In multiple-choice questions, carefully distinguish who pays and who receives: consumers pay the tax, government receives the revenue, foreign exporters receive only the world price.
- Understand the components of the balance of payments: tariff revenue is not primary income.
Common Mistakes
- Confusing tariff revenue with revenue for foreign exporters (Option B). Students may think the higher price benefits the exporting country, but the extra price is the tax, not additional revenue for exporters.
- Assuming that a country imposing a tariff can affect the world price (Option D). Only if the country is a large importer can its tariff reduce world demand and lower the world price; otherwise, the world price remains unchanged.
- Misclassifying tariff revenue as primary income. Primary income includes factor earnings from abroad (profits, dividends, interest). Tariff revenue is a transfer within the domestic economy and appears in the government budget, not in the balance of payments as primary income.
- Not recognising the role of price elasticity of demand in determining the loss of consumer surplus. With inelastic demand, the loss is larger because consumers cannot easily reduce quantity.
Things to Be Careful About
- Read the question carefully: it says the country has price-inelastic demand, which is crucial for understanding that the price increase is passed largely onto consumers.
- Option C mentions 'primary income' – recall the definition: earnings from investments and labour abroad, unrelated to tariff revenue.
- In an MCQ, eliminate wrong options systematically: each wrong option contains a clear error that can be identified with basic trade theory.
- Remember that a tariff is a specific indirect tax; its economic incidence falls on consumers when demand is inelastic relative to supply.
The table shows the output of goods X and Y in China and the United States (US) before specialisation.
| good X | good Y | |
|---|---|---|
| China | 20 000 | 70 000 |
| US | 20 000 | 50 000 |
| total | 40 000 | 120 000 |
Assuming both China and the US use 50% of their resources to produce each product, what will the combined total output be after specialisation has occurred?
Options
A 120 000
B 140 000
C 160 000
D 180 000
Working
Opportunity cost of 1 unit of good X:
- China: 70 000 Y / 20 000 X = 3.5 Y
- US: 50 000 Y / 20 000 X = 2.5 Y
US has the lower opportunity cost in X, so US has comparative advantage in X.
China has comparative advantage in Y.
Before specialisation, each country used 50% of its resources for each good.
After specialisation, each country devotes all resources to the good in which it has comparative advantage.
Maximum output:
- US: 20 000 X × 2 = 40 000 X
- China: 70 000 Y × 2 = 140 000 Y
Combined total output = 40 000 X + 140 000 Y = 180 000 units.
Answer
D
D
Background Concept
This question tests the principle of comparative advantage, which states that countries should specialise in producing goods where they have a lower opportunity cost relative to other countries. Opportunity cost is the value of the next best alternative foregone when a choice is made. By specialising according to comparative advantage, total world output can increase even if one country has an absolute advantage in both goods.
Understanding the Question
The table shows the output of goods X and Y in China and the US when each country uses half of its resources to produce each good. The question asks for the combined total output after specialisation, assuming they fully specialise in the good where they have a comparative advantage. The data given is not the total potential output of each country, but only the output from half of their resources.
Approach
First, calculate the opportunity cost of each good for each country. Then identify which country has a comparative advantage in which good. Next, determine the total output of the good each country specialises in by doubling the output from half resources (since they now use all resources). Finally, sum the outputs to get the combined total.
Step-by-Step Reasoning
-
Calculate opportunity costs: For China, to produce 20 000 X, it gives up 70 000 Y. So opportunity cost of 1 X = 70 000 / 20 000 = 3.5 Y. For US, to produce 20 000 X, it gives up 50 000 Y, so opportunity cost of 1 X = 50 000 / 20 000 = 2.5 Y. Since the US has a lower opportunity cost in X, the US has a comparative advantage in X. Consequently, China has a comparative advantage in Y.
-
Determine specialisation: US specialises in X, China specialises in Y.
-
Calculate total output after specialisation: Before specialisation, each country used half its resources to produce each good. Therefore, the output from half resources is the given figure. If a country now uses all resources to produce one good, it can double that output. So US produces 20 000 X × 2 = 40 000 X, and China produces 70 000 Y × 2 = 140 000 Y.
-
Combined total output: 40 000 X + 140 000 Y = 180 000 units. This is an increase from the original combined total of 40 000 X + 120 000 Y = 160 000 units, demonstrating the gain from specialisation.
Key Takeaways
- Comparative advantage is about lower opportunity cost, not absolute advantage.
- Specialisation according to comparative advantage increases total world output.
- When given output from a fraction of resources, scaling up correctly is essential.
- The total output after specialisation can be found by summing the maximum possible outputs of each good.
Common Mistakes
- Confusing comparative advantage with absolute advantage (China has absolute advantage in Y, but the US has comparative advantage in X).
- Forgetting that the given outputs are only from half of resources, thus not doubling them after specialisation.
- Incorrectly calculating opportunity cost by dividing the wrong way.
- Adding the original totals (40 000 + 120 000 = 160 000) and thinking that is the answer, which is option C.
Things to Be Careful About
- Always compute opportunity cost correctly: the cost of producing one unit of good A is the amount of good B forgone divided by the amount of good A produced.
- Ensure that when specialising, the output from all resources is used, which may require scaling up from the given data.
- The combined total output is the sum of the outputs of each good, not a single number, but the question asks for the combined total output (units of goods), so it is the sum of the quantities of X and Y.
- Check that the final answer matches one of the options exactly.
Economists suggest that multilateral trade between many countries is preferable to bilateral trade between two countries.
Why is this?
Options
A Bilateral trade means that trade diversion is always greater than trade creation.
B Bilateral trade misses the benefit of trade with third countries.
C Gains from bilateral trade are less than the harm done to third countries.
D Gains from comparative advantage cannot apply in the case of bilateral trade.
Bilateral trade restricts the scope for specialisation to only two countries, so it may not allow trade with the most efficient producer. Multilateral trade enables trade with multiple countries, thereby realising greater gains from comparative advantage. Option B correctly identifies this: bilateral trade misses the benefit of trade with third countries.
Answer
B
B
Background Concept
Comparative advantage is the principle that countries should specialise in producing goods where they have a lower opportunity cost and trade with others to obtain goods at lower cost than if produced domestically. The gains from trade are maximised when countries can trade freely with many partners, allowing them to import from the most efficient producer worldwide. Multilateral trade agreements involve many countries, while bilateral agreements involve only two. The key advantage of multilateralism is that it expands the set of trading partners, increasing the potential for specialisation according to comparative advantage.
Understanding the Question
The question asks why economists consider multilateral trade preferable to bilateral trade. The four options provide possible reasons. The correct answer must capture a fundamental advantage of multilateral trade or a disadvantage of bilateral trade. Option B states that bilateral trade misses the benefit of trade with third countries, which directly addresses the limitation of restricting trade to two partners.
Approach
Evaluate each option by considering whether it accurately describes a necessary consequence of bilateral trade. Option A is too absolute ('always greater'), Option C is not necessarily true (gains may still be positive and harm is not assured), and Option D is false because comparative advantage can still apply in bilateral trade. Option B correctly identifies the missed opportunity.
Step-by-Step Reasoning
- Option A: 'Bilateral trade means that trade diversion is always greater than trade creation.' Trade diversion and creation are concepts from customs unions, but they are not always present in a simple bilateral trade agreement. Moreover, it is not necessarily true that diversion always exceeds creation; it depends on the relative costs of the partners versus third countries. So this statement is incorrect.
- Option B: 'Bilateral trade misses the benefit of trade with third countries.' This is correct. By limiting trade to two countries, any potential gains from trading with a third, more efficient, producer are forgone. Multilateral trade allows each country to trade with the world's lowest-cost producer, maximising the gains from comparative advantage.
- Option C: 'Gains from bilateral trade are less than the harm done to third countries.' This assumes that there is always harm to third countries, which is not necessarily the case. Third countries may be unaffected or even benefit if trade creation occurs. The statement is not a generalisation that holds for all bilateral trade agreements.
- Option D: 'Gains from comparative advantage cannot apply in the case of bilateral trade.' This is false. Comparative advantage can still apply between two countries; they can both gain from specialisation and trade. The limitation is that they may not be trading with the most efficient producer, but gains are still possible.
Thus, B is the correct answer.
Key Takeaways
- Multilateral trade allows countries to exploit comparative advantage more fully by trading with many partners.
- Bilateral trade restricts the potential gains by limiting the number of trading partners.
- The key concept is that the gains from trade depend on the opportunity cost of the trading partners; a wider set of partners increases the likelihood of finding a lower-cost producer.
Common Mistakes
- Assuming that any trade between two countries is as good as trade with many; this misses the point that the best producer may be a third country.
- Confusing trade creation/diversion with the basic comparative advantage argument; trade diversion is a specific concept in customs unions, not always relevant to simple bilateral trade.
- Thinking that comparative advantage cannot apply in bilateral trade; it can, but the gains are limited compared to multilateral trade.
Things to Be Careful About
- The question is about preference (why multilateral is preferable), not about absolute superiority in all cases. Option B correctly identifies the missed opportunity without overgeneralising.
- Avoid choosing options that make absolute statements ('always', 'cannot') unless they are undeniably true; often they are not.
- Understand that the term 'multilateral' implies many countries, not just two, and that this broadens the scope for specialisation.
A country experiences an improvement in its terms of trade.
What is the most likely cause?
Options
A a decrease in its budget deficit
B a relatively low rate of domestic inflation
C a rise in its exchange rate
D a surplus on its primary income account
Reasoning
The terms of trade measure the ratio of export prices to import prices. An improvement means export prices have risen relative to import prices, or import prices have fallen relative to export prices.
A rise in the exchange rate (appreciation) makes exports more expensive for foreign buyers and imports cheaper for domestic buyers. This directly raises export prices in foreign currency terms and lowers import prices in domestic currency terms, improving the terms of trade.
Answer
C
C
Background Concept
The terms of trade (TOT) measure the relative price of a country's exports compared to its imports. The most common formula is:
TOT = (Index of export prices / Index of import prices) x 100
An improvement in the terms of trade means that export prices have risen relative to import prices (or import prices have fallen relative to export prices). This is generally beneficial because the country can buy more imports for each unit of exports sold. However, the cause of the improvement matters for its overall economic impact.
Understanding the Question
The question asks for the most likely cause of an improvement in the terms of trade. Four options are given: a decrease in the budget deficit, a relatively low rate of domestic inflation, a rise in the exchange rate, and a surplus on the primary income account. The key is to identify which of these directly affects the ratio of export to import prices.
Approach
- Recall the definition of the terms of trade.
- Consider each option and determine whether it would directly cause export prices to rise relative to import prices.
- Eliminate options that do not directly affect the price ratio.
Step-by-Step Reasoning
Option A: A decrease in its budget deficit. A budget deficit is the difference between government spending and tax revenue. A decrease in the deficit (e.g., through spending cuts or tax increases) is a contractionary fiscal policy. This could reduce aggregate demand and potentially lower domestic inflation, but it does not directly affect the relative prices of exports and imports. The link is indirect and uncertain. Therefore, this is not the most likely cause.
Option B: A relatively low rate of domestic inflation. Low domestic inflation means that the prices of domestically produced goods and services are rising slowly. This could make exports more competitive internationally, but it does not directly improve the terms of trade. In fact, if domestic inflation is lower than inflation in trading partner countries, the country's exports might become relatively cheaper, which would worsen the terms of trade (export prices falling relative to import prices). So this option is incorrect.
Option C: A rise in its exchange rate. A rise in the exchange rate (appreciation) means the domestic currency becomes more valuable relative to foreign currencies. This has two direct effects:
- Exports become more expensive for foreign buyers (in their own currency), so the price of exports in foreign currency terms rises.
- Imports become cheaper for domestic buyers (in domestic currency), so the price of imports in domestic currency terms falls.
Both effects cause the ratio of export prices to import prices to increase, improving the terms of trade. This is a direct and predictable relationship. Therefore, this is the most likely cause.
Option D: A surplus on its primary income account. The primary income account records income flows such as interest, dividends, and profits from foreign investments. A surplus means the country receives more income from abroad than it pays out. This affects the current account balance but does not directly affect the prices of exports and imports. Therefore, this is not the most likely cause.
Key Takeaways
- The terms of trade measure the relative price of exports to imports.
- An appreciation of the exchange rate directly improves the terms of trade by making exports more expensive and imports cheaper.
- Other factors like inflation, fiscal policy, and income flows have indirect or no direct effect on the terms of trade.
Common Mistakes
- Confusing the terms of trade with the balance of trade or the current account. The terms of trade are about prices, not quantities or monetary flows.
- Thinking that low inflation improves the terms of trade. Low inflation makes exports cheaper, which worsens the terms of trade.
- Assuming that a budget deficit or surplus on primary income directly affects trade prices.
Things to Be Careful About
- The terms of trade are calculated using price indices, not absolute prices.
- An improvement in the terms of trade is not always beneficial; it depends on the cause. For example, if it is caused by a rise in export prices due to strong global demand, it is beneficial. If it is caused by a fall in import prices due to a recession, it may signal economic weakness.
- The question asks for the "most likely" cause, so the answer must be the one with the most direct and predictable effect.
Your score so far
Answer a question to start scoring
Your marks add up here as you work through the paper.