Economics 9708/11 — May/June 2024
Cambridge AS Level · AS Level Multiple Choice · answer key with instant marking and worked solutions
Topics Demand and Supply · Elasticities of Demand · Fiscal Policy · Scarcity, Choice and Opportunity Cost · Factors of Production · Unemployment · +15 more
Tap an option under each question to check it — your score builds as you go.
A worker earns $40 per hour. Rather than work, she decides to visit a museum for three hours. The visit costs a total of $40.
What is the opportunity cost of visiting the museum?
Options
A $40
B $80
C $120
D $160
Working
Opportunity cost is the value of the next best alternative forgone. The worker could have worked for 3 hours at $40 per hour, earning $120. Therefore, the opportunity cost of visiting the museum is $120.
Answer
C
C
Background Concept
Opportunity cost is the value of the next best alternative that is given up when a choice is made. It is a fundamental concept in economics, reflecting the scarcity of resources and the need to make choices. Opportunity cost includes both explicit costs (monetary outlays) and implicit costs (forgone earnings or benefits), but crucially, it is the value of the alternative that is sacrificed, not the total cost of the chosen activity.
Understanding the Question
This question tests the ability to calculate opportunity cost in a simple scenario. The worker faces a choice: work for 3 hours at $40 per hour, or visit a museum for 3 hours at a cost of $40. The question asks for the opportunity cost of choosing the museum visit. The key is to identify the next best alternative, which is working. The museum ticket cost is an explicit cost of the chosen activity, but it is not the opportunity cost; the opportunity cost is the forgone earnings from working.
Approach
- Identify the next best alternative: working for 3 hours.
- Calculate the value of that alternative: 3 hours × $40 per hour = $120.
- The $40 museum ticket is not part of the opportunity cost because it is a cost of the chosen activity, not the value of the forgone alternative.
Step-by-Step Reasoning
- The worker's time is a scarce resource. If she chooses to visit the museum, she cannot use that time to work.
- The wage rate of $40 per hour represents the value of her time in the next best use (work).
- For 3 hours, the forgone earnings are $40 × 3 = $120.
- The museum ticket cost of $40 is a monetary expense she incurs if she visits the museum, but it is not the value of something she gives up; it is part of the cost of the chosen activity. The alternative (working) does not involve paying $40, but it also does not yield the benefit of the museum visit.
- Therefore, the opportunity cost of the museum visit is the $120 she could have earned by working.
Key Takeaways
- Opportunity cost is the value of the next best alternative forgone.
- It includes both explicit and implicit costs, but only those that are part of the forgone alternative.
- In this case, the explicit cost of the museum ticket is not part of the opportunity cost because it is not a cost of the forgone alternative.
- To calculate opportunity cost, always identify the best alternative use of the resources (time, money, etc.) and measure its value.
Common Mistakes
- Including the explicit cost of the chosen activity (the $40 ticket) in the opportunity cost, leading to answer D ($160). This is incorrect because the $40 is not a cost of the forgone alternative; it is a cost of the chosen activity.
- Confusing opportunity cost with total cost of the chosen activity. The total cost of the museum visit is $40 (explicit) plus $120 (implicit) = $160, but the opportunity cost is only the value of the forgone alternative, which is $120.
- Failing to multiply the hourly wage by the number of hours, giving answer A ($40) or B ($80).
Things to Be Careful About
- Always read the question carefully: it asks for the opportunity cost of visiting the museum, not the total cost or the explicit cost.
- Remember that opportunity cost is forward-looking and based on the best alternative, not on what has been spent.
- In multiple-choice questions, identify the correct economic reasoning before looking at the options to avoid being misled by common errors.
The nature of a typical car assembly plant has changed. The industry has fewer firms, operates on larger sites and has more automated machinery.
How is this change most likely to have affected the relative use of factors of production in the industry?
Options
| increased relative use | decreased relative use | |
|---|---|---|
| A | capital and enterprise | labour and land |
| B | enterprise and labour | land and capital |
| C | labour and land | capital and enterprise |
| D | land and capital | enterprise and labour |
The car assembly plant now has more automated machinery (increased capital) and operates on larger sites (increased land). Fewer firms means less enterprise (the entrepreneur as an organiser of production). Automated machinery replaces workers, so labour use decreases. Therefore, land and capital increase relative to labour and enterprise, which corresponds to option D.
Answer
D
D
Background Concept
Factors of production are the inputs used to produce goods and services. They are classified into four categories: land (natural resources and space), labour (human work effort), capital (man-made aids to production, such as machinery and tools), and enterprise (risk-taking and organisation of the other factors by entrepreneurs). In production, firms substitute between factors as technology and costs change. Automating a process typically replaces labour with capital, and scaling up production may require more land. A reduction in the number of firms indicates a consolidation that reduces the amount of enterprise used in the industry.
Understanding the Question
The question describes a change in a car assembly plant: the industry now has fewer firms, larger sites, and more automated machinery. We are asked how this change most likely affected the relative use of factors of production. The phrase 'relative use' means which factors are used more compared to others. We must match each change to the factor it directly affects:
- 'Fewer firms' → less enterprise (since fewer entrepreneurs organising production).
- 'Larger sites' → more land (the physical space).
- 'More automated machinery' → more capital (machines).
- Automation typically reduces the need for human labour, so less labour.
Thus we identify which factors increase and which decrease.
Approach
- List the four factors of production: land, labour, capital, enterprise.
- Link each stated change to a factor:
- Fewer firms → enterprise decreases.
- Larger sites → land increases.
- More automated machinery → capital increases.
- Automation → labour decreases.
- Determine the pair that increased (land and capital) and the pair that decreased (enterprise and labour).
- Find the option that matches this: option D (increased relative use: land and capital; decreased relative use: enterprise and labour).
Step-by-Step Reasoning
- The industry had fewer firms: each firm requires an entrepreneur. Fewer firms means fewer entrepreneurs, so the factor 'enterprise' is used less. Enterprise decreases relative to other factors.
- The plants operate on larger sites: 'larger sites' means more physical land is occupied. Thus the factor 'land' is used more. Land increases relative to other factors.
- More automated machinery: machinery is a form of physical capital. So 'capital' increases relative to other factors.
- The presence of more automated machinery indicates that tasks previously done by workers are now done by machines. Therefore, the factor 'labour' is used less. Labour decreases relative to other factors.
Aggregating: increased relative use: land and capital; decreased relative use: enterprise and labour. This combination appears only in option D. Option A suggests increased capital and enterprise (but enterprise decreased). Option B suggests increased enterprise and labour (both decreased). Option C suggests increased labour and land (labour decreased). Therefore D is correct.
Key Takeaways
- The four factors of production have distinct definitions. Being able to classify real‑world changes (automation, site expansion, consolidation) into changes in factor use is a fundamental skill.
- 'Relative use' means comparing the direction of change across factors. Not all factors move in the same direction; substitution usually occurs.
- In MCQs, eliminating options by testing each factor against the description is efficient.
Common Mistakes
- Confusing capital (machinery) with land (sites). The question mentions both separately; they must be kept distinct.
- Assuming that 'fewer firms' automatically means less land or less capital. Fewer firms could still use more land per firm (here they use larger sites). So land increases despite fewer firms.
- Misinterpreting enterprise: some students think enterprise increases when there is more automation (innovation), but the question says 'fewer firms', directly indicating less entrepreneurial activity.
- Not reading the option layout carefully: the table pairs 'increased relative use' and 'decreased relative use'. Ensure the pairs match the correct direction.
Things to Be Careful About
- Read the question stem: it lists three changes. Each change must be mapped to a factor, and the net effect on each factor must be considered.
- The word 'relative' means we are comparing the use of factors, not absolute quantities. But here the changes are clear in direction.
- When checking options, verify both the increased and decreased pairs simultaneously. An option can be eliminated if even one factor is mismatched.
Which item would be least likely to be classed as land?
Options
A fertilisers
B fisheries
C forests
D coal
In economics, 'land' is defined as all natural resources that are not man-made. Fisheries, forests, and coal are all natural resources provided by nature. Fertilisers, however, are manufactured inputs – they are produced by combining other factors of production, making them a form of capital (or an intermediate good), not land. Therefore, fertilisers are the least likely to be classed as land.
Answer
A
A
Background Concept
In economics, the factors of production are the resources used to produce goods and services. They are typically classified into four categories:
- Land: All natural resources provided by nature. This includes physical land itself, as well as everything naturally occurring on or under it, such as minerals, forests, water, fisheries, and oil. Land is a 'gift of nature' and is not produced by human effort.
- Labour: The human effort (both physical and mental) used in production.
- Capital: Man-made goods used to produce other goods and services. This includes machinery, tools, factories, and also intermediate goods like fertilisers.
- Enterprise: The risk-taking and organising ability of entrepreneurs.
The key distinction for this question is between land (natural) and capital (man-made).
Understanding the Question
The question asks: 'Which item would be least likely to be classed as land?' You are given four options: fertilisers, fisheries, forests, and coal. You need to know the strict economic definition of land and apply it to each option to find the one that does not fit. The 'least likely' phrasing means the one that is clearly not a natural resource.
Approach
- Recall the definition of land in the context of factors of production.
- Examine each option:
- Fisheries: naturally occurring fish stocks in oceans, lakes, rivers.
- Forests: naturally growing trees and vegetation (wild forests).
- Coal: a naturally occurring mineral deposit.
- Fertilisers: man-made chemical substances (or naturally occurring substances but typically processed/manufactured).
- Determine which option is manufactured rather than naturally occurring.
- Conclude that fertilisers are capital, not land.
Step-by-Step Reasoning
- Option B (fisheries): Fisheries refer to the natural fish populations in a body of water. These exist without human creation; they are a renewable natural resource. Definitely land.
- Option C (forests): Wild forests also exist naturally. They are part of the land; they provide timber and other forest products without initial human input (though they can be managed). Classed as land.
- Option D (coal): Coal is a fossil fuel formed over millions of years from natural processes. It is a non-renewable natural resource. Clearly land.
- Option A (fertilisers): Fertilisers are substances added to soil to increase fertility. Most are manufactured through chemical processes (e.g., ammonia-based fertilisers). Even organic fertilisers like manure are considered intermediate goods or capital because they have been processed or collected by human effort. They are not a gift of nature in their usable form. Therefore, they are the least likely to be classed as land; they are more accurately classified as capital (or an intermediate good).
Thus, answer A.
Key Takeaways
- 'Land' in economics has a broad meaning: all natural resources, not just the surface of the Earth.
- The factor 'capital' includes all man-made aids to production.
- Distinguishing between natural and man-made is essential for classifying inputs.
Common Mistakes
- Thinking that land only means 'the ground' and therefore excluding fisheries or forests. Students might consider fertilisers as natural because they come from the earth. But economic classification looks at whether the input is provided by nature in a usable form; fertilisers require human processing.
- Confusing land with the reward 'rent'. Rent is the payment to land, but that's a separate concept.
- Being misled by the word 'least likely' – some students may overthink and pick a less obvious option. Stick with the core definition.
Things to Be Careful About
- Ensure you use the economic definition, not the everyday meaning.
- Note that some resources may be borderline (e.g., plantation forests can be considered capital because they are planted and managed; but the question says 'forests', which typically means natural forests).
- The exam frequently tests factor classification; always ask: is it natural? If yes, it's land. If man-made, it's capital.
- There is no diagram needed for this question.
Why does the concept of scarcity apply to the use of fossil fuels?
Options
A Demand fluctuates according to price changes.
B Supply is insufficient to meet demand.
C Their use is restricted because of harmful pollution.
D They are being replaced by renewable energy sources.
Reasoning
Scarcity is the fundamental economic problem of having unlimited wants but limited resources. Fossil fuels are a finite resource; their supply is limited relative to the demand for them. This means that not all wants for fossil fuels can be satisfied, so choices must be made about their use. Option B correctly states that supply is insufficient to meet demand, which is the essence of scarcity.
Answer
B
B
Background Concept
Scarcity is the core problem in economics. It arises because human wants for goods and services are unlimited, but the resources (land, labour, capital, enterprise) used to produce them are limited. Because resources are scarce, every choice involves an opportunity cost — the next best alternative forgone. Scarcity applies to any resource that is not freely available in sufficient quantity to satisfy all wants. Fossil fuels (coal, oil, natural gas) are a classic example: they are a non-renewable resource formed over millions of years, and their total stock is fixed. No matter how much we want to use them, we cannot produce more than what exists.
Understanding the Question
The question asks why the concept of scarcity applies to fossil fuels. It is a multiple-choice question with four options. The correct answer must identify the reason that directly matches the definition of scarcity. The other options describe related but distinct ideas: price responsiveness (A), negative externalities (C), and technological change (D). None of these is the definition of scarcity itself.
Approach
- Recall the precise definition of scarcity: limited resources relative to unlimited wants.
- Evaluate each option against that definition.
- Select the option that best captures the idea that the quantity of fossil fuels available is insufficient to satisfy all desired uses.
Step-by-Step Reasoning
- Option A: "Demand fluctuates according to price changes." This describes the law of demand — a movement along the demand curve. It does not address the fundamental limitation of the resource itself. Demand can fluctuate even for abundant goods. Incorrect.
- Option B: "Supply is insufficient to meet demand." This directly states that the available quantity of fossil fuels is less than the quantity people want to use. This is the essence of scarcity: a finite supply relative to unlimited wants. Correct.
- Option C: "Their use is restricted because of harmful pollution." This refers to a negative externality — a social cost not reflected in the market price. While pollution may lead to government restrictions, scarcity exists regardless of pollution. The restriction is a policy response, not the reason scarcity applies. Incorrect.
- Option D: "They are being replaced by renewable energy sources." This describes a substitution process driven by technology and policy. Even if renewables replace fossil fuels, the remaining fossil fuels are still scarce. The statement does not explain why scarcity applies. Incorrect.
Key Takeaways
- Scarcity is about limited resources relative to unlimited wants, not about price, externalities, or technological change.
- A resource is scarce if its supply is insufficient to meet all wants at a zero price.
- Fossil fuels are a textbook example of a scarce resource because they are finite and non-renewable.
Common Mistakes
- Confusing scarcity with a shortage: a shortage is a temporary market disequilibrium where quantity demanded exceeds quantity supplied at the current price; scarcity is a permanent condition.
- Choosing option C because pollution is a problem associated with fossil fuels — but the question asks about scarcity, not externalities.
- Choosing option D because it sounds like a reason fossil fuels are "limited" — but replacement by renewables is a consequence of scarcity and other factors, not the definition.
Things to Be Careful About
- Read the question carefully: it asks why scarcity applies, not what problems fossil fuels cause.
- Stick to the economic definition of scarcity; do not let real-world issues (pollution, renewable energy) distract from the core concept.
An economist knows the current point at which an economy operates within its production possibility curve.
What can the economist conclude about this economy?
Options
A its degree of self-sufficiency
B its international competitiveness
C its level of output of two goods
D its rate of economic growth
A point within a production possibility curve shows the economy is producing a specific combination of two goods at less than full capacity (resources are underemployed). The co-ordinates of the point directly give the actual quantities of the two goods being produced. Therefore, the economist can conclude the level of output of two goods.
This point does not reveal anything about self-sufficiency (A), international competitiveness (B), or the rate of economic growth (D).
Answer
C
C
Background Concept
A production possibility curve (PPC) shows the maximum possible output combinations of two goods an economy can produce given fixed resources and technology, assuming full and efficient employment of resources. Points on the curve represent efficient production; points inside the curve represent underemployment (some resources idle or used inefficiently); points outside the curve are unattainable in the short run.
Understanding the Question
This is a multiple-choice question asking what can be concluded from knowing the current point at which an economy operates within its PPC. The key is to recognise what information the co-ordinates of that point provide: they specify the exact quantities of the two goods being produced at that moment. Other options refer to concepts not conveyed by a single point on a static PPC.
Approach
Identify what each option involves and test whether it can be deduced from a point inside the PPC. Option C is directly read from the graph's axes. Options A, B, and D require additional information (trade flows, international prices, or shifts of the curve over time) that a single point does not provide.
Step-by-Step Reasoning
- Option C: The PPC is drawn with two goods on its axes. Any point on the diagram has co-ordinates that show the output level of each good. Thus, knowing the point tells the economist exactly how much of good X and good Y is being produced. This is the immediate conclusion.
- Option A (self-sufficiency): Self-sufficiency relates to the ability to meet all consumption needs from domestic output without trade. A PPC point shows only production, not consumption, and does not indicate whether the economy trades or not.
- Option B (international competitiveness): Competitiveness involves relative costs, prices, exchange rates, and productivity compared with other economies. A single point on a static PPC gives no information about costs, prices, or other economies.
- Option D (rate of economic growth): Economic growth is a dynamic concept measured by an outward shift of the PPC over time. A single point within the curve does not show the curve's future position or any shift.
Therefore, only C is a valid conclusion.
Key Takeaways
- A point on a PPC shows the specific combination of two goods produced.
- A point inside the curve indicates underemployment but still gives the actual output quantities.
- Do not over-interpret a static point: it cannot reveal dynamic concepts like growth or international comparisons.
Common Mistakes
- Choosing D (rate of economic growth) because students confuse a point inside the curve with potential for growth. Growth is about the curve's future position, not the current one.
- Selecting A or B because of vague associations without checking if the information is actually present in the point's co-ordinates.
Things to Be Careful About
- The PPC's axes are labelled with the two goods; read the co-ordinates correctly.
- A point inside the curve still gives the actual output; it is not just 'underemployment' without quantities.
- Distinguish between what the point shows directly and what requires additional assumptions or data.
An increase in which factor is likely to cause a shift to the left of the demand curve for cinema movies?
Options
A expenses for the heating system in the cinema
B payments charged by movie scriptwriters
C the cost of transport to the cinema
D taxes on the incomes of cinema operators
Reasoning
The demand curve for cinema movies shows the relationship between the price of cinema tickets and the quantity demanded by consumers, ceteris paribus. A shift to the left indicates a decrease in demand at every price, caused by a change in a non-price determinant of demand. The cost of transport to the cinema affects the overall cost of consuming the movie experience, thus a rise in transport cost makes cinema visits more expensive in total, reducing demand for cinema movies. This is a determinant of demand. The other options affect the supply side or the cinema operator's costs, not demand.
Answer
C
C
Background Concept
In economics, the demand curve represents the relationship between the price of a good and the quantity that consumers are willing and able to purchase, holding all other factors constant (ceteris paribus). A shift of the demand curve occurs when there is a change in a non-price determinant of demand. Common determinants of demand include: consumer income, tastes and preferences, prices of related goods (substitutes and complements), expectations about future prices, and the number of buyers. Any factor that directly affects the consumer's willingness or ability to pay for the good can shift the demand curve. A leftward shift means a decrease in demand at every price.
Understanding the Question
The question asks: "An increase in which factor is likely to cause a shift to the left of the demand curve for cinema movies?" We are given four options, each describing a cost increase. We need to determine which cost increase directly affects consumers' demand for cinema movies, not the supply side or the cinema operator's costs. The key is to identify whether the factor is a determinant of demand (affects consumers) or a determinant of supply (affects producers).
Approach
We evaluate each option by considering whether the factor influences the consumer's decision to purchase cinema tickets. If it affects the consumer's overall cost or willingness to buy, it is a demand determinant. If it affects the cinema's production costs or profitability, it is a supply determinant. Option C (cost of transport to the cinema) is a cost borne by the consumer in consuming the movie, so it shifts demand. Options A, B, and D are costs incurred by the cinema operator, so they affect supply, not demand.
Step-by-Step Reasoning
- Option A: expenses for the heating system in the cinema – This is a fixed operating cost for the cinema. Higher heating costs reduce the cinema's profit margin, which may lead to a reduction in supply (e.g., fewer screenings or higher ticket prices). However, it does not directly affect the consumer's willingness to buy tickets. Therefore, this shifts the supply curve, not the demand curve.
- Option B: payments charged by movie scriptwriters – This is a cost of producing the movie itself, but the question is about the demand for cinema movies (the exhibition of movies). Scriptwriters are input suppliers to the movie production industry, not directly to the cinema. Even if the cinema pays for the rights, it is a cost to the cinema, not to the consumer. So it affects supply.
- Option C: the cost of transport to the cinema – This is a cost incurred by the consumer to get to the cinema. It is a complementary good to the cinema experience. An increase in transport cost raises the full price of a cinema visit (ticket plus transport). Consumers may respond by reducing the quantity of visits demanded, shifting the demand curve for cinema movies leftward. This is a clear demand determinant.
- Option D: taxes on the incomes of cinema operators – This is a tax on the cinema's income, reducing after-tax profits. It is a supply-side cost factor. The cinema may respond by reducing output or raising ticket prices, but the demand curve itself is unaffected directly.
Thus, only option C is a demand-side factor that would cause a leftward shift of the demand curve.
Key Takeaways
- Distinguish between factors that shift demand (consumer-related) and factors that shift supply (producer-related).
- A complementary good's price increase reduces demand for the related good.
- The cost of getting to a venue is part of the full consumption cost and thus affects demand.
Common Mistakes
- Confusing supply-side costs (e.g., heating, scriptwriter payments, taxes on cinema operators) with demand determinants.
- Thinking that any cost increase leads to a leftward shift of the demand curve; but only costs borne by consumers shift demand.
- Not recognising that transport cost is a complementary good to cinema movies.
Things to Be Careful About
- Read each option carefully: ask "who bears this cost?" If it is the consumer, it is a demand shifter; if it is the producer, it is a supply shifter.
- Remember that the demand curve shifts only when there is a change in a non-price determinant of demand; changes in the price of the good itself cause movements along the curve.
- In this question, the increase in transport cost is a change in the price of a complementary good, which is a non-price determinant of demand.
Four firms supply the market. The market supply is 50 units at $20 and 100 units at $40. The table shows the market share of each firm at the two prices.
Which firm does not have a normal upward-sloping supply curve?
| % market share at $20 | % market share at $40 | |
|---|---|---|
| A | 10 | 10 |
| B | 20 | 50 |
| C | 30 | 20 |
| D | 40 | 20 |
Options
A firm A
B firm B
C firm C
D firm D
Working
Total market supply at $20 = 50 units; at $40 = 100 units.
For each firm, quantity supplied = market share × total market supply.
- Firm A: at $20: 10% × 50 = 5 units; at $40: 10% × 100 = 10 units → increase.
- Firm B: at $20: 20% × 50 = 10 units; at $40: 50% × 100 = 50 units → increase.
- Firm C: at $20: 30% × 50 = 15 units; at $40: 20% × 100 = 20 units → increase.
- Firm D: at $20: 40% × 50 = 20 units; at $40: 20% × 100 = 20 units → no change (constant).
A normal upward-sloping supply curve implies that quantity supplied rises as price rises. Firm D shows no change, so it does not have a normal upward-sloping supply curve.
Answer
D
D
Background Concept
The supply curve of a firm shows the relationship between the price of a good and the quantity the firm is willing and able to supply. For most goods, a higher price provides an incentive for firms to increase production, resulting in an upward-sloping supply curve. This is the 'law of supply'. A normal supply curve is upward-sloping, meaning that as price increases, quantity supplied increases. If a firm's quantity supplied does not increase when price rises, its supply curve is not upward-sloping; it could be vertical (perfectly inelastic) or even backward-bending.
Understanding the Question
This question provides data on the market shares of four firms at two different prices ($20 and $40). The total market supply at each price is given. The task is to identify which firm does not have a normal upward-sloping supply curve. The key is to recognise that 'normal upward-sloping' means that as price rises, the quantity supplied by that firm should increase. The table gives market shares, not absolute quantities. So we must first convert market shares into actual quantities supplied by each firm at each price.
Approach
- Determine the total market supply at each price: 50 units at $20, 100 units at $40.
- For each firm, calculate the quantity supplied at each price by multiplying the percentage market share (as a decimal) by the total market supply.
- Compare the quantity supplied at $20 and $40 for each firm.
- Identify the firm for which the quantity does not increase (or decreases) – that firm does not have a normal upward-sloping supply curve.
Step-by-Step Reasoning
-
At $20, total supply = 50 units.
- Firm A: 10% → 0.10 × 50 = 5 units.
- Firm B: 20% → 0.20 × 50 = 10 units.
- Firm C: 30% → 0.30 × 50 = 15 units.
- Firm D: 40% → 0.40 × 50 = 20 units.
-
At $40, total supply = 100 units.
- Firm A: 10% → 0.10 × 100 = 10 units.
- Firm B: 50% → 0.50 × 100 = 50 units.
- Firm C: 20% → 0.20 × 100 = 20 units.
- Firm D: 20% → 0.20 × 100 = 20 units.
Now compare:
- Firm A: 5 → 10 (increase) – normal upward-sloping.
- Firm B: 10 → 50 (increase) – normal upward-sloping.
- Firm C: 15 → 20 (increase) – normal upward-sloping, though the increase is smaller relative to market share change.
- Firm D: 20 → 20 (no change) – this is not an increase; it remains constant. Therefore, Firm D does not have a normal upward-sloping supply curve. A constant supply at both prices implies a perfectly inelastic supply curve (vertical), which is not upward-sloping.
Thus, the correct answer is Firm D.
Key Takeaways
- The supply curve shows the relationship between price and quantity supplied. A normal upward-sloping supply curve indicates that higher prices lead to higher quantity supplied.
- Market share percentages must be converted into absolute quantities to compare firms' supply behaviour.
- A firm that does not increase supply when price rises may have a vertical supply curve (perfectly inelastic) or a backward-bending supply curve; in this case, it is constant, so it is not upward-sloping.
Common Mistakes
- Failing to convert market shares into actual quantities. Some students might compare market shares directly and incorrectly think that Firm C's market share falls from 30% to 20%, so it does not supply more. But as we saw, the absolute quantity still increases because total market supply doubles. So always compute absolute quantities.
- Misunderstanding 'normal upward-sloping': some might think it means the supply curve slopes upward from left to right, which is standard. But the crucial test is whether quantity supplied increases with price.
- Overlooking that Firm D's quantity is constant. Some might think constant is still upward-sloping because it's not decreasing, but upward-sloping requires a positive relationship, not constant.
Things to Be Careful About
- Always use the total market supply to convert percentages to actual numbers.
- Remember that a normal upward-sloping supply curve shows a positive relationship: as price rises, quantity supplied rises. A horizontal or vertical supply curve is not upward-sloping.
- In multiple-choice questions, if you are unsure, compute the quantities for each firm systematically.
Which statement is correct?
Options
A Demand for an inferior good has a positive relationship to income and a negative relationship to price.
B Demand for an inferior good has a negative relationship to income and a negative relationship to price.
C Demand for a normal good has a positive relationship to income and a positive relationship to price.
D Demand for a normal good has a negative relationship to income and a positive relationship to price.
Reasoning
A normal good is defined as one for which demand increases when income increases (positive income elasticity), while an inferior good is one for which demand decreases when income increases (negative income elasticity). The law of demand states that, ceteris paribus, price and quantity demanded are inversely related: a rise in price reduces quantity demanded, giving a negative relationship.
- Option A: Correct that inferior goods have a negative income relationship, but incorrectly suggests a positive price relationship.
- Option B: Correctly states a negative relationship to income (inferior good) and a negative relationship to price (law of demand).
- Option C: Correct for income (positive for normal good) but incorrect for price (positive relationship is false).
- Option D: Incorrect income relationship for a normal good (should be positive).
Answer
B
B
Background Concept
In economics, goods are classified by how demand responds to changes in income. A normal good is one where demand rises as income rises (income elasticity of demand, YED > 0). An inferior good is one where demand falls as income rises (YED < 0). Separately, the law of demand states that, all else equal, as the price of a good increases, the quantity demanded decreases – a negative relationship between price and quantity demanded. This holds for both normal and inferior goods, unless the good is a Giffen good (an extreme theoretical case not in this syllabus).
Understanding the Question
The question presents four statements each combining two claims: the relationship between demand and income (positive or negative) and the relationship between demand and price (positive or negative). It asks which statement is correct. The student must recall the definitions of normal and inferior goods and the law of demand, then apply them to each option.
Approach
First, identify the income relationship for the type of good mentioned in each option. For a normal good, demand increases with income (positive); for an inferior good, demand decreases with income (negative). Second, identify the price relationship: for virtually all goods, demand decreases when price rises (negative). Then eliminate options that contradict these fundamentals.
Step-by-Step Reasoning
-
Option A: "Demand for an inferior good has a positive relationship to income and a negative relationship to price." The income relationship is incorrect: an inferior good has a negative relationship to income (as income rises, demand falls). Therefore A is wrong.
-
Option B: "Demand for an inferior good has a negative relationship to income and a negative relationship to price." The income relationship is correct (negative YED), and the price relationship follows the law of demand (negative). So B is correct.
-
Option C: "Demand for a normal good has a positive relationship to income and a positive relationship to price." The income relationship is correct (positive YED), but the price relationship is wrong: a rise in price reduces demand, not increases it. Therefore C is false.
-
Option D: "Demand for a normal good has a negative relationship to income and a positive relationship to price." The income relationship is incorrect (should be positive for a normal good) and the price relationship is also incorrect. So D is false.
Thus only option B satisfies both conditions.
Key Takeaways
- Normal goods have positive income elasticity; inferior goods have negative income elasticity.
- The law of demand gives a negative relationship between price and quantity demanded for all ordinary goods.
- Exam questions often combine two separate pieces of theory; test each claim independently.
Common Mistakes
- Confusing normal and inferior: thinking inferior goods are those with low quality, not those with negative YED.
- Assuming that a higher price signals higher quality and thus increases demand (the Veblen effect is an exception not in the AS syllabus).
- Forgetting that the law of demand applies to both normal and inferior goods.
Things to Be Careful About
- Read each option carefully – both clauses must be correct.
- Remember that "positive relationship" means as one variable increases, the other increases; "negative relationship" means they move in opposite directions.
- In multiple choice, eliminate clearly wrong options rather than looking only for the correct one.
In which row are both statements correct?
Options
| consumer surplus | producer surplus | |
|---|---|---|
| A | the value that consumers gain from consuming a good over and above the value that would have been gained from consuming the next best alternative | the difference between the actual revenue received by firms for a good and the profit maximising revenue |
| B | the value that consumers gain from consuming a good over and above the price paid | the difference between the price received by firms for a good or service and the price at which they would have been prepared to supply that good |
| C | the value that consumers gain from consuming a good over and above the price paid | the difference between the actual revenue received by firms for a good and the profit maximising revenue |
| D | the value that consumers gain from consuming a good over and above the value that would have been gained from consuming the next best alternative | the difference between the price received by firms for a good and the price at which they would have been prepared to supply that good |
Answer
Consumer surplus is the difference between the maximum price a consumer is willing to pay for a good and the price actually paid. Producer surplus is the difference between the price a firm receives for a good and the minimum price it would accept to supply that good.
Row B states exactly these definitions:
- Consumer surplus: 'the value that consumers gain from consuming a good over and above the price paid'.
- Producer surplus: 'the difference between the price received by firms for a good or service and the price at which they would have been prepared to supply that good'.
All other rows contain at least one incorrect statement.
Answer
B
B
Background Concept
Consumer surplus and producer surplus are measures of economic welfare. Consumer surplus arises because consumers typically pay the same market price for all units of a good, even though they value earlier units more highly. The surplus is the area between the demand curve (which reflects willingness to pay) and the market price, up to the quantity purchased. Producer surplus arises because firms typically receive the same market price for all units, even though they have rising marginal costs. The surplus is the area between the supply curve (which reflects the minimum acceptable price) and the market price, up to the quantity supplied. Both concepts are central to evaluating the efficiency of markets: the sum of consumer and producer surplus (total surplus) is maximised under perfect competition.
Understanding the Question
This question presents four rows, each offering a statement about consumer surplus and a statement about producer surplus. You must identify the row in which BOTH statements are correct. The definitions are the standard textbook definitions. The distractors mix correct and incorrect elements: Row A uses a description of opportunity cost for consumer surplus ('the value that would have been gained from consuming the next best alternative') and for producer surplus it refers to 'profit maximising revenue', which is not the definition. Row C has a correct consumer surplus statement but the producer surplus statement incorrectly refers to profit maximising revenue. Row D has an incorrect consumer surplus statement (opportunity cost) but a correct producer surplus statement. Only Row B has both correct.
Approach
Start by recalling the precise definitions:
- Consumer surplus = total willingness to pay minus actual payment. (Alternatively: the value gained over and above the price paid.)
- Producer surplus = total revenue received minus total variable cost (or the sum of differences between price and marginal cost for each unit). In simpler terms: the difference between the price received and the minimum supply price.
Then test each row: immediately reject any that conflates consumer surplus with opportunity cost or that misstates producer surplus as a difference from profit-maximising revenue (profit-maximising revenue is not a relevant concept). Identify Row B as the only one that matches both correct definitions.
Step-by-Step Reasoning
-
Consumer surplus definition: At market equilibrium, all consumers pay the same price. The value they gain is the difference between what they would have been willing to pay (their maximum willingness) and what they actually pay. This is NOT the same as the opportunity cost of consuming the good (the value of the next best alternative). Opportunity cost is a different concept — it is the value of the alternative forgone, whereas consumer surplus is a net benefit measured in money terms. Therefore, any statement that says consumer surplus is 'over and above the value that would have been gained from consuming the next best alternative' is wrong. That describes something else, perhaps an aspect of economic rent or the consumer's surplus from making a choice, but it is not the standard definition of consumer surplus. Hence Rows A and D have an incorrect consumer surplus statement.
-
Producer surplus definition: Producer surplus is the difference between the revenue a firm actually receives for a good and the minimum amount it would accept to supply that good (which is essentially the cost of production, typically marginal cost). It is not about 'profit maximising revenue'. Profit-maximising revenue is the revenue at the profit-maximising output, but that is not the basis of producer surplus. Producer surplus is about the surplus earned on each unit because the firm receives a price above its supply price. The phrase 'the difference between the actual revenue received by firms for a good and the profit maximising revenue' is incorrect because profit-maximising revenue is not a fixed reference point; also producer surplus is not defined relative to profit-maximising revenue. Therefore Rows A and C have an incorrect producer surplus statement.
-
Check Row B: Consumer surplus: 'the value that consumers gain from consuming a good over and above the price paid' — this is correct, exactly matching the definition. Producer surplus: 'the difference between the price received by firms for a good or service and the price at which they would have been prepared to supply that good' — correct, as it captures the excess over the minimum supply price. Both are correct, so B is the answer.
-
Check Row D: Consumer surplus statement is incorrect (as explained), producer surplus statement is correct. Since both must be correct, D is eliminated.
Thus only Row B satisfies the condition.
Key Takeaways
- Precise definitions of consumer surplus and producer surplus must be memorised for examinations. Consumer surplus is NOT related to opportunity cost; it is purely a market-based measure. Producer surplus is about the difference between price and the supply price (marginal cost), not about profit maximisation.
- Avoid confusing consumer surplus with the value of the next best alternative; that is opportunity cost, which is a different concept.
- In multiple-choice questions testing definitions, eliminate rows that mix correct and incorrect statements; always compare each half against the standard definition.
Common Mistakes
- Mistaking consumer surplus as 'the value of consuming a good over the value of the next best alternative' is a common error. That describes the net benefit of choosing this good over the alternative, but consumer surplus is specifically measured as the difference between willingness to pay and price paid.
- For producer surplus, students sometimes think it is profit (total revenue minus total cost), but producer surplus is revenue minus variable cost; fixed cost is irrelevant in the short run. In this question, the distractor 'profit maximising revenue' is a red herring.
- Another mistake is thinking that both statements in Row D are correct because the producer surplus statement is correct, forgetting that the consumer surplus statement is wrong.
Things to Be Careful About
- Read each row carefully; the wording can be subtle. The phrase 'over and above the value that would have been gained from consuming the next best alternative' looks plausible but is not the standard definition.
- Know the exact wording: consumer surplus = price consumers are willing to pay minus price actually paid. Producer surplus = price actually received minus minimum acceptable price (marginal cost). Do not add extraneous concepts.
- For multiple-choice questions, always check both halves of the row; a row with one correct and one incorrect is not the answer.
A firm calculates that the income elasticity of demand for its product is -3.0.
What can be deduced from this information?
Options
A In a period of economic growth, its total revenue should increase.
B In a period of economic recession, its total revenue should increase.
C It has few substitutes so it should increase its price to increase total revenue.
D It has many substitutes so it should decrease price to increase total revenue.
Working
Income elasticity of demand (YED) = -3.0. A negative YED means the product is an inferior good: as income rises, demand falls, and as income falls, demand rises.
In a period of economic growth, incomes rise, so demand for an inferior good falls, decreasing total revenue. Option A is therefore incorrect.
In a period of recession, incomes fall, so demand for this inferior good rises, increasing total revenue. Option B is correct.
Options C and D refer to price elasticity, not income elasticity, and are not deducible from the given information.
Answer
B
B
Background Concept
Income elasticity of demand (YED) measures the responsiveness of quantity demanded to a change in consumer income. The formula is:
YED = % change in quantity demanded / % change in income
The sign of YED indicates the type of good:
- Positive YED (>0): normal good (demand rises as income rises)
- Negative YED (<0): inferior good (demand falls as income rises)
The magnitude (absolute value) shows the strength of the response: if |YED| > 1, demand is income-elastic; if |YED| < 1, it is income-inelastic.
Understanding the Question
The question gives YED = -3.0. This is a negative value, meaning the product is an inferior good. The task is to deduce what happens to the firm's total revenue during economic growth (rising incomes) and recession (falling incomes). The options bring in total revenue, substitutes, and price changes, but only the income effect is directly deducible. The correct deduction is that during a recession, when incomes fall, demand for the inferior good rises, so total revenue should increase. Option B states this.
Approach
- Interpret the sign of YED to identify the type of good.
- Apply the relationship between income changes (growth vs recession) and demand for that good.
- Consider the effect on total revenue (price × quantity). Since price is not given, we assume quantity change is the main driver. If demand rises, total revenue rises (assuming price unchanged).
- Evaluate each option: A is wrong because growth reduces demand; B is correct; C and D are about price elasticity, not income elasticity, so they cannot be deduced.
Step-by-Step Reasoning
- Given YED = -3.0. The negative sign means the product is an inferior good. For an inferior good, an increase in income leads to a decrease in quantity demanded, and a decrease in income leads to an increase in quantity demanded.
- Economic growth: incomes rise → demand for inferior good falls → quantity sold falls → total revenue (price × quantity) likely falls (assuming price stays constant). So option A is false.
- Economic recession: incomes fall → demand for inferior good rises → quantity sold rises → total revenue rises. So option B is true.
- Option C: “It has few substitutes so it should increase its price to increase total revenue.” This refers to price elasticity of demand (PED). If a product has few substitutes, PED is inelastic, and raising price would increase total revenue. But YED tells us nothing about PED; we cannot deduce anything about substitutes or price changes from YED alone. So C is incorrect.
- Option D: “It has many substitutes so it should decrease price to increase total revenue.” Again, this is about PED, not YED. Even if the product had many substitutes (making PED elastic), the deduction about price adjustment is not deducible from YED. So D is incorrect.
Therefore, only B is a valid deduction.
Key Takeaways
- The sign of YED immediately tells you whether the good is normal or inferior.
- Income elasticity of demand is about the effect of income changes, not price changes.
- Total revenue changes can be inferred from demand changes only if price is fixed; here the question implicitly assumes price constant, so quantity change drives revenue.
- Do not confuse income elasticity with price elasticity; each gives different information about consumer behaviour.
Common Mistakes
- Thinking that a negative YED means the good is a “luxury” or “necessity” – those are about magnitude, not sign. Negative YED always means inferior.
- Assuming that during economic growth total revenue always rises for all firms. For firms selling inferior goods, growth can hurt revenue.
- Mixing up YED and PED: options C and D are about price elasticity, but the question is about income elasticity, so they are irrelevant.
- Not noticing that the sign is negative: a positive YED of 3 would imply normal good, leading to opposite conclusions.
Things to Be Careful About
- Always check the sign of the elasticity coefficient; it is the first thing to interpret.
- Remember that “economic growth” means rising incomes; “recession” means falling incomes.
- Total revenue = price × quantity. The question does not state price changes, so we assume quantity change is the primary effect on revenue. In reality, the firm might adjust price, but the question is about deduction from YED alone.
- When options mix different concepts (substitutes, price changes), stay focused on what the given coefficient tells you.
The diagram shows the demand and supply curves for the global air cargo market.
The initial equilibrium is at point X.
What would the new equilibrium be if there is a global recession and an increase in fuel costs?
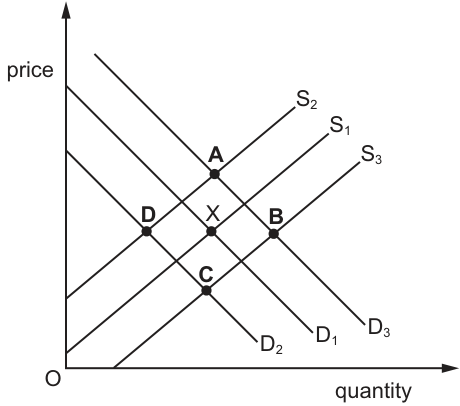
Options
A point A on Fig. 11.1
B point B on Fig. 11.1
C point C on Fig. 11.1
D point D on Fig. 11.1
Reasoning
A global recession reduces incomes and economic activity, lowering the demand for air cargo (a derived demand from international trade). This shifts the demand curve left from D1 to D2. An increase in fuel costs raises the operating costs for air cargo providers, reducing supply and shifting the supply curve left from S1 to S2. The new equilibrium is at the intersection of the new demand curve D2 and the new supply curve S2, which is point D.
Answer
D
D
Background Concept
The demand and supply model explains how market prices and quantities are determined. Demand represents the willingness and ability of buyers to purchase a good at various prices, while supply represents the willingness and ability of sellers to offer a good. Market equilibrium occurs where the demand and supply curves intersect, establishing the equilibrium price and quantity.
Curves shift when non-price determinants change. For demand, key determinants include consumer incomes, tastes, prices of related goods, and expectations. For supply, key determinants include input costs, technology, taxes, subsidies, and the number of sellers. A leftward shift (decrease) in demand lowers both equilibrium price and quantity. A leftward shift (decrease) in supply raises equilibrium price but lowers equilibrium quantity. When both curves shift left simultaneously, equilibrium quantity definitely falls, while the change in price is ambiguous and depends on the relative magnitude of the two shifts.
Understanding the Question
The question presents a demand and supply diagram for the global air cargo market. The initial equilibrium is at point X, where demand curve D1 intersects supply curve S1. Two economic shocks occur simultaneously: a global recession and an increase in fuel costs. The task is to identify the new equilibrium point from the four labelled alternatives (A, B, C, or D).
A global recession means falling incomes and reduced business activity worldwide. Air cargo is a derived demand—it depends on the volume of goods being traded internationally. During a recession, trade volumes typically contract, reducing demand for air freight services. Fuel is a major operating cost for air cargo companies; higher fuel costs increase the cost of supplying the service at any given price, reducing supply.
Approach
The strategy is to:
- Determine the direction of the demand curve shift caused by the recession.
- Determine the direction of the supply curve shift caused by higher fuel costs.
- Locate the intersection of the two new curves on the diagram.
I expect demand to shift left (decrease) and supply to shift left (decrease). The new equilibrium should be at the intersection of the leftmost demand curve (D2) and the leftmost supply curve (S2), which is point D.
Step-by-Step Reasoning
Step 1: Effect of the global recession on demand
A global recession reduces household incomes and business revenues worldwide. Since air cargo demand is derived from the demand for the goods being transported, a recession reduces international trade volumes. Consumers buy fewer imported goods, and businesses reduce production and exports. Consequently, the quantity of air cargo demanded falls at every price level. This is a decrease in demand, shown as a leftward shift of the demand curve from D1 to D2.
Step 2: Effect of increased fuel costs on supply
Fuel is a significant variable cost for airlines and air cargo operators. When fuel costs rise, the cost of providing air cargo services increases. At any given market price, it becomes less profitable to offer the service, so some firms reduce output or exit the market. This represents a decrease in supply, shown as a leftward shift of the supply curve from S1 to S2.
Step 3: Locating the new equilibrium
The new market equilibrium occurs where the new demand curve intersects the new supply curve. With demand shifted to D2 and supply shifted to S2, the intersection is at point D.
Step 4: Eliminating the other options
- Point A (intersection of D1 and S2): This would be correct if only supply decreased but demand remained at D1. It ignores the recession's effect on demand.
- Point B (intersection of D3 and S1): This would require demand to increase (shift right to D3), which is the opposite of what happens in a recession.
- Point C (intersection of D2 and S1): This would be correct if only demand decreased but supply remained at S1. It ignores the fuel cost increase's effect on supply.
Step 5: Interpreting the equilibrium change
At point D compared to point X, the equilibrium quantity is lower because both curves shifted left. The change in equilibrium price depends on the relative size of the two shifts, but the question asks only for the new equilibrium point, not the direction of the price change.
Key Takeaways
- A recession reduces demand for normal goods and services with high income elasticity, shifting the demand curve left.
- Increased input costs (such as fuel) reduce supply, shifting the supply curve left.
- When both demand and supply decrease simultaneously, equilibrium quantity falls unambiguously.
- Always identify the direction of each curve shift separately before locating their intersection.
- Air cargo is a derived demand sensitive to the economic cycle.
Common Mistakes
- Confusing a shift with a movement: A recession is a non-price determinant that shifts the entire demand curve, not a movement along it.
- Misattributing fuel costs: Fuel costs affect the supply side (production costs), not demand. Some students incorrectly shift the demand curve for fuel cost changes.
- Selecting point C: This is the most common error. Students correctly identify that the recession reduces demand (shifting to D2) but forget that fuel costs also reduce supply, leaving them at the intersection of D2 and S1.
- Selecting point A: Students correctly identify the supply reduction but forget the demand reduction.
- Assuming price must rise or fall: With both curves shifting left, quantity definitely falls, but price could rise or fall depending on which shift is larger. Do not assume a direction for price without knowing the relative magnitudes.
Things to Be Careful About
- Ensure you shift the correct curve in the correct direction: recession reduces demand (left), fuel costs reduce supply (left).
- Verify that the selected point is the intersection of BOTH new curves, not just one.
- Remember that air cargo is a derived demand from international trade, making it highly sensitive to the economic cycle.
- The diagram labels confirm D2 is left of D1 (lower demand) and S2 is left of S1 (lower supply), so point D is indeed the intersection of the two decreased curves.
A government gives free food to poor households in a community.
What is this food an example of?
Options
A a free good
B a public good
C a demerit good
D a normal good
Reasoning
The food given free to poor households is an economic good (it has an opportunity cost because resources used to produce it could have been used elsewhere). It is not a free good (A) because free goods have zero opportunity cost, like air. It is not a public good (B) because it is both rival and excludable; one person's consumption reduces availability for others and it is possible to exclude non-recipients. It is not a demerit good (C) because demerit goods are overconsumed due to imperfect information about their harmful effects (e.g., cigarettes). Food is a normal good (D) because for most households, including poor ones, the demand for food increases when their income rises; food has a positive income elasticity of demand.
Answer
D
D
Background Concept
In economics, goods are classified in several ways. One classification is based on scarcity: free goods (zero opportunity cost) versus economic goods (positive opportunity cost). Another is based on rivalry and excludability: private goods (rival and excludable) versus public goods (non-rival and non-excludable). A third classification distinguishes merit goods (under-consumed due to imperfect information) and demerit goods (over-consumed due to imperfect information about harmful effects). Separately, goods are classified by their income elasticity of demand: normal goods (positive YED, demand rises as income rises) and inferior goods (negative YED, demand falls as income rises).
Understanding the Question
The question asks what type of good is the free food provided by the government to poor households. The options come from different classification systems: free good (scarcity), public good (rivalry/excludability), demerit good (information failure), normal good (income elasticity). The student must apply the correct definition to each option and select the one that accurately describes the food.
Approach
First, recall the defining features of each type. Eliminate options that clearly do not apply. The food is an economic good, not a free good, because producing it uses scarce resources. It is a private good, not a public good, because it is rival and excludable. It is not a demerit good because food is not typically overconsumed due to imperfect information; indeed, poor households may be under-consuming food. This leaves normal good as the most plausible answer. Confirm that food is a normal good for poor households: as their income rises, they tend to spend more on food (though the proportion may fall—Engel's law—but the absolute amount increases), so food has a positive income elasticity.
Step-by-Step Reasoning
Option A: Free good. A free good has zero opportunity cost; it is naturally abundant, like air or sunlight. The food provided uses land, labour, and capital to produce; it is scarce and has an opportunity cost. Therefore, it is not a free good.
Option B: Public good. A public good is non-rival (one person's consumption does not reduce availability for others) and non-excludable (it is impossible or very costly to exclude anyone from consuming it). Food is rival: if one person eats a loaf of bread, it is not available for someone else. It is excludable: the government can control who receives the food (e.g., only registered poor households). Hence, it is a private good, not a public good.
Option C: Demerit good. Demerit goods are those that are over-consumed because consumers underestimate the private costs or long-term harm (e.g., cigarettes, alcohol, gambling). Food is not generally over-consumed in the sense of harmful effects; in fact, poor households may lack sufficient nutrition. Free food aims to address under-consumption, which is characteristic of merit goods, not demerit goods. Therefore, it is not a demerit good.
Option D: Normal good. A normal good is defined as one for which demand increases when consumer income increases (positive income elasticity). For most households, especially poor ones, food is a normal good: as their income rises, they spend more on food (even if the proportion of income spent on food declines—Engel's law). The fact that the government provides it free does not change its nature as a normal good; the classification depends on the relationship between demand and income, not on the price paid. Hence, food is a normal good.
Thus, the correct answer is D.
Key Takeaways
- Understand the different classification systems for goods: free vs economic, public vs private, merit vs demerit, normal vs inferior.
- A good can be provided freely by the government and still be an economic good (scarce) and a private good (rival and excludable).
- A normal good is defined by its positive income elasticity of demand, not by its price or who provides it.
- Be careful not to confuse 'free' (zero price) with 'free good' (zero opportunity cost).
Common Mistakes
- Mistaking a good provided at zero price (free of charge) for a free good. Free goods have zero opportunity cost, not just zero price.
- Assuming that goods provided by the government are public goods. Many government-provided goods are private goods (e.g., school meals, public housing).
- Confusing demerit goods with goods that are provided free to correct under-consumption; demerit goods are over-consumed, not under-consumed.
- Forgetting the definition of a normal good as one with positive income elasticity; some students might think 'normal' means 'typical' or 'healthy'.
Things to Be Careful About
- Distinguish between the different classification criteria: scarcity, rivalry/excludability, information problems, income responsiveness.
- For normal goods, remember that 'normal' refers to the direction of the demand response to income changes, not to the market price or quality.
- In multiple-choice questions, read all options carefully; sometimes only one option is economically correct even if it seems less obvious.
- Use the elimination method when definitions are clear.
A government wishes to raise the incomes of farmers without raising the price of food to consumers.
Which policy should it use?
Options
A a maximum price below the market price for food
B a minimum price below the market price for food
C a payment of a subsidy to farmers to produce food
D a release of government food stocks onto the market
A subsidy paid to farmers reduces their costs of production, shifting the supply curve rightwards. This lowers the market price of food (benefiting consumers) and increases the quantity traded. Farmers’ total revenue (price × quantity) may rise, and they also receive the subsidy payment, raising their total income. The other options fail: a maximum price below equilibrium would create a shortage and reduce quantity sold, lowering farmers’ income; a minimum price below equilibrium is non-binding and has no effect; releasing government stocks increases supply, lowering price and reducing farmers’ revenue. Therefore, only a subsidy can achieve both objectives.
Answer
C
C
Background Concept
Subsidies are government payments to producers that reduce their production costs, shifting the supply curve rightwards. This lowers the equilibrium price and increases the quantity traded. Producers’ income consists of total revenue (price × quantity) plus the subsidy payment. Maximum prices (price ceilings) set a legal upper limit below equilibrium; they cause a shortage and reduce quantity exchanged. Minimum prices (price floors) set a lower limit; if set below equilibrium they are ineffective. Buffer stock schemes involve government buying or selling stocks to stabilise prices; releasing stocks increases supply and lowers price.
Understanding the Question
The government has two goals simultaneously: raise farmers’ incomes and avoid raising the consumer price of food. The question asks which policy best achieves both. Each option must be evaluated against the two criteria.
Approach
Evaluate each policy in turn:
- A (maximum price below market): lowers consumer price but creates shortage; farmers sell less, total income likely falls.
- B (minimum price below market): non-binding, has no effect on price or quantity; incomes unchanged.
- C (subsidy): lowers consumer price and, through the subsidy payment, directly increases farmers’ income (total revenue may also rise if demand is elastic).
- D (release government stocks): increases supply, lowers price; farmers receive lower revenue, income falls unless compensated.
Step-by-Step Reasoning
Option A (maximum price below market): If the government sets a maximum price for food below the free-market equilibrium, consumers pay less. However, producers are unwilling to supply as much at the lower price, leading to a shortage. The quantity sold falls, and farmers’ total revenue (price × quantity) almost certainly decreases, reducing their incomes. Hence this fails the income goal.
Option B (minimum price below market): A minimum price set below the equilibrium price is not effective because the market price is already higher. It has no effect on the market, so neither consumer price nor farmers’ incomes change. It does not raise incomes.
Option C (subsidy to farmers): The subsidy shifts the supply curve to the right, lowering the equilibrium price – so consumers pay less. The quantity sold increases. Farmers’ total revenue may increase or decrease depending on the price elasticity of demand (PED). But crucially, farmers also receive the subsidy payment from the government, which directly adds to their income. Therefore, even if total revenue falls slightly, total income (revenue + subsidy) rises. This policy can achieve both objectives.
Option D (release government food stocks): Releasing stocks onto the market increases supply, shifting the supply curve rightwards and lowering the market price. While consumers benefit from lower prices, farmers face lower revenue. Their incomes fall unless they receive compensation elsewhere, which is not stated. Thus this policy fails to raise farmers’ incomes.
Key Takeaways
- Subsidies can lower consumer prices while raising producer incomes because the subsidy payment compensates for any loss in revenue.
- Price controls are ineffective or harmful if the goal is to simultaneously benefit both consumers and producers.
- Understanding the full effect of a policy requires considering both market outcomes and direct transfer payments.
Common Mistakes
- Assuming a minimum price always raises incomes: it only works if set above equilibrium.
- Thinking a maximum price benefits producers: it lowers their revenue unless accompanied by subsidies.
- Confusing a subsidy with a price floor: a subsidy directly supports income without raising consumer price.
- Overlooking that a subsidy is a payment, so even if revenue falls, total income can rise.
Things to Be Careful About
- Check whether a price control is binding relative to market equilibrium.
- Remember that the incidence of a subsidy (who gains) depends on elasticities, but the subsidy itself always increases producer income by at least part of the subsidy.
- Note that releasing stocks is a temporary measure and does not provide ongoing income support.
Governments in market economies give different reasons for intervening in the operation of an economy.
Which reason given is a normative statement?
Options
A Average incomes have failed to keep pace with price rises during the past year.
B Energy prices have increased by more than 50% during the past year.
C The distribution of incomes has become more unfair during the past year.
D The poorest 10% of households have suffered the greatest fall in average real income during the past year.
Reasoning
A normative statement expresses a value judgement — an opinion about what ought to be — and cannot be verified as true or false by looking at the facts. Options A, B and D are all positive statements: they describe what has happened (a fall in average incomes, a rise in energy prices, a fall in the real income of the poorest 10%) and can be checked against data. Option C uses the word 'unfair', which is a value judgement about the distribution of incomes. It is therefore a normative statement.
Answer
C
C
Background Concept
In economics, statements are classified as either positive or normative. A positive statement is objective and fact-based — it describes what is, what was, or what will be, and it can be tested or verified using evidence. For example, 'The unemployment rate rose from 4% to 5%' is a positive statement because we can check the data. A normative statement, by contrast, expresses a value judgement — it says what ought to be, or what is good or bad, fair or unfair. Such statements cannot be proven true or false by facts alone because they depend on the speaker's values or opinions. The distinction is fundamental to economic methodology because it separates analysis from policy advocacy.
Understanding the Question
The question asks which of the four given reasons for government intervention is a normative statement. Each option is phrased as a claim about the economy. The task is to identify the one that contains a value judgement rather than a purely factual claim. The command word is 'Which reason given is a normative statement?' — this is a straightforward classification exercise testing the positive/normative distinction.
Approach
Read each option and ask: 'Can this statement be verified as true or false by checking the data?' If yes, it is positive. If the statement uses value-laden words such as 'unfair', 'too high', 'should', 'better', or 'worse', it is normative. Apply this test to each option in turn.
Step-by-Step Reasoning
-
Option A: 'Average incomes have failed to keep pace with price rises during the past year.' This is a factual claim about the relationship between income growth and inflation. We can check the data on average nominal income and the CPI to see whether it is true. No value judgement. Positive.
-
Option B: 'Energy prices have increased by more than 50% during the past year.' This is a straightforward factual claim about the percentage change in energy prices. It can be verified by looking at price indices. No value judgement. Positive.
-
Option C: 'The distribution of incomes has become more unfair during the past year.' The word 'unfair' is a value judgement. Fairness is not an objective, measurable property — different people have different views about what constitutes a fair distribution. The statement cannot be verified as true or false by data alone; it depends on the speaker's ethical standard. Normative.
-
Option D: 'The poorest 10% of households have suffered the greatest fall in average real income during the past year.' This is a factual claim about the change in real income for a specific group. It can be checked using income survey data. No value judgement. Positive.
Therefore, only option C is a normative statement.
Key Takeaways
- Positive statements are objective and testable; normative statements contain value judgements and are not testable by facts alone.
- Look for words like 'fair', 'unfair', 'should', 'ought', 'good', 'bad', 'better', 'worse' — these signal a normative statement.
- The same factual claim can be expressed positively or normatively: 'The Gini coefficient rose from 0.3 to 0.4' (positive) vs 'The rise in inequality is unfair' (normative).
Common Mistakes
- Confusing a statement that describes a negative outcome (e.g. 'the poorest suffered the greatest fall') with a normative statement. The description of a bad outcome is still a positive statement if it is a factual claim; the value judgement is in the word 'unfair', not in the fact that the poorest lost income.
- Thinking that any statement about policy or government intervention is automatically normative. The question's stem mentions 'reasons for intervening', but the options themselves are statements that could be either positive or normative — the classification depends on the wording, not the topic.
Things to Be Careful About
- Read each option carefully for value-laden language. 'Unfair' is the clearest signal here.
- Remember that a statement can be false and still be positive — testability, not truth, is the criterion.
- In exam questions, the normative option almost always contains an explicit value judgement word; do not overthink it.
The table illustrates macroeconomic data for an economy. All figures are in $ billions.
What is the equilibrium real output?
| consumption expenditure | investment | government expenditure | exports | imports | real output | |
|---|---|---|---|---|---|---|
| A | 110 | 100 | 50 | 10 | 20 | 100 |
| B | 120 | 100 | 60 | 20 | 30 | 200 |
| C | 140 | 100 | 70 | 30 | 40 | 300 |
| D | 160 | 100 | 80 | 40 | 50 | 430 |
Options
A 100
B 200
C 300
D 430
In equilibrium, aggregate expenditure (AE) equals real output (Y). AE = C + I + G + (X - M).
For row A: AE = 110 + 100 + 50 + (10 - 20) = 250, but Y = 100, so not equilibrium.
For row B: AE = 120 + 100 + 60 + (20 - 30) = 270, but Y = 200, not equilibrium.
For row C: AE = 140 + 100 + 70 + (30 - 40) = 300, Y = 300, equilibrium.
For row D: AE = 160 + 100 + 80 + (40 - 50) = 330, but Y = 430, not equilibrium.
Thus, the equilibrium real output is 300.
Answer
C
C
Background Concept
In macroeconomics, equilibrium real output occurs when the total planned spending in the economy (aggregate expenditure, AE) equals the total value of output (Y). This is equivalent to the condition that total injections (I + G + X) equal total leakages (S + T + M), but the simplest approach is to compute AE directly as C + I + G + (X - M). When AE = Y, there is no unplanned change in inventories, and the economy is in short-run equilibrium.
Understanding the Question
The table provides four possible combinations of consumption, investment, government spending, exports, imports, and real output. The question asks which row shows the equilibrium real output. We must check each row to see if the sum of its components equals the given Y.
Approach
For each row, calculate AE = C + I + G + (X - M). Compare AE to the stated Y. The correct row is where AE = Y.
Step-by-Step Reasoning
- Row A: C=110, I=100, G=50, X=10, M=20, Y=100. AE = 110+100+50+10-20 = 250. AE ≠ Y (250 ≠ 100). Not equilibrium.
- Row B: C=120, I=100, G=60, X=20, M=30, Y=200. AE = 120+100+60+20-30 = 270. 270 ≠ 200. Not equilibrium.
- Row C: C=140, I=100, G=70, X=30, M=40, Y=300. AE = 140+100+70+30-40 = 300. AE = Y. This is equilibrium.
- Row D: C=160, I=100, G=80, X=40, M=50, Y=430. AE = 160+100+80+40-50 = 330. 330 ≠ 430. Not equilibrium.
Thus, only row C satisfies the equilibrium condition.
Key Takeaways
- Equilibrium real output is where aggregate expenditure equals output.
- The formula AE = C + I + G + (X - M) is essential for such calculations.
- In a multiple-choice setting, checking each option systematically is efficient.
Common Mistakes
- Misremembering the formula: forgetting to include net exports (X - M) or adding M instead of subtracting.
- Confusing equilibrium with another condition, such as the equality of injections and leakages, but failing to compute correctly.
- Skipping the calculation for one row and assuming without verification.
Things to Be Careful About
- Ensure all figures are in the same units (billions $).
- Double-check arithmetic: simple addition/subtraction errors can lead to the wrong row.
- Remember that equilibrium is a specific condition, not just any row where the numbers look plausible.
A country's net national income (NNI) is less than its gross national income (GNI).
What does this mean?
Options
A incomes earned overseas were less than incomes sent overseas
B inflation has been accounted for in NNI but not in GNI
C the country's exports decreased
D there has been a net depreciation in the value of the country's fixed capital assets
Reasoning
GNI = NNI + depreciation (consumption of fixed capital). Therefore, if NNI < GNI, depreciation must be positive, indicating a net reduction in the value of fixed capital assets.
Answer
D
D
Background Concept
National income can be measured in gross terms (before allowing for the wearing out of capital assets) or net terms (after deducting the consumption of fixed capital, i.e., depreciation). Gross National Income (GNI) includes all income earned by residents of a country, both domestically and abroad, without subtracting depreciation. Net National Income (NNI) is GNI minus depreciation. Depreciation is the decline in the value of a country's fixed capital assets (e.g., machinery, buildings, infrastructure) due to wear and tear, obsolescence, or age. Therefore, NNI is always less than GNI if there is positive depreciation.
Understanding the Question
The question states that NNI is less than GNI and asks what this implies. Four options are given. The correct interpretation must be based on the accounting relationship between gross and net measures. Option A refers to incomes earned overseas versus incomes sent overseas, which relates to the difference between GNI and GDP (not gross vs. net). Option B suggests inflation adjustment, which is not relevant to the gross/net distinction. Option C mentions exports, which are unrelated. Option D correctly identifies depreciation of fixed capital assets.
Approach
Recall the definition: NNI = GNI - Depreciation. If NNI < GNI, then depreciation > 0. This means that the economy's stock of fixed capital has decreased in value over the period due to consumption of fixed capital. The answer must be the option that expresses this idea.
Step-by-Step Reasoning
- Understand the relationship: Gross measures do not deduct depreciation; net measures do. For national income, NNI = GNI - Consumption of fixed capital (depreciation).
- Given that NNI is less than GNI, the difference is positive. This difference is exactly the amount of depreciation.
- Depreciation represents the decline in the value of fixed capital assets (machinery, buildings, etc.) due to their use in production.
- Option D states: "there has been a net depreciation in the value of the country's fixed capital assets." This matches the definition of depreciation leading to NNI < GNI.
- Option A confuses the difference between GNI and GDP (which involves net factor income from abroad). Option B confuses nominal vs. real adjustment. Option C is unrelated to the gross/net concept.
Key Takeaways
- Gross national income (GNI) includes all income earned by residents, without deducting depreciation.
- Net national income (NNI) is GNI minus depreciation.
- The difference between gross and net measures is always depreciation (consumption of fixed capital).
- This adjustment is separate from inflation adjustments or international income flows.
Common Mistakes
- Confusing the difference between GNI and GDP (which is net factor income from abroad) with the difference between GNI and NNI (which is depreciation). Option A is a common distractor.
- Thinking that NNI is adjusted for inflation (option B). Inflation adjustment is between nominal and real measures, not gross vs. net.
- Assuming that exports or trade balance affect the gross/net distinction (option C).
Things to Be Careful About
- Remember that depreciation is a non-cash cost that reduces the value of capital assets. It is an accounting concept, not a cash flow.
- In national income accounting, gross measures are often used for production and income, while net measures give a better indication of sustainable income.
- The question is straightforward if you recall the exact relationship. Do not overcomplicate it.
Asha is currently unemployed. She has been offered a job but has decided to decline the offer and search for a better paid job.
Which type of unemployment is this?
Options
A cyclical
B frictional
C seasonal
D structural
Answer
Asha is unemployed because she is voluntarily between jobs, having declined an offer to search for a better-paid position. This is frictional unemployment, which arises from the normal time lag between leaving one job (or being unemployed) and finding a suitable new job. It is not cyclical (caused by a downturn in economic activity), seasonal (due to variations in demand over the year), or structural (mismatch of skills or location).
Answer
B
B
Background Concept
Unemployment is the state of being without work but actively seeking work. Economists classify unemployment into different types based on its causes. Frictional unemployment is the short-term unemployment that occurs when workers are between jobs or are searching for new jobs that better match their skills and preferences. It is a natural part of a dynamic economy because it takes time for workers and employers to find each other. Structural unemployment arises from a mismatch between the skills or location of workers and the requirements of available jobs. Cyclical unemployment is caused by a downturn in the business cycle (recession). Seasonal unemployment occurs when demand for labour varies at different times of the year (e.g., tourism, agriculture).
Understanding the Question
The question presents a scenario: Asha is unemployed, has been offered a job, but declines it to search for a better-paid job. We need to identify which type of unemployment best describes her situation. The key point is that she is actively searching for a better job, indicating she is voluntarily between jobs rather than unable to find a job due to lack of demand or mismatched skills. This is a classic example of frictional unemployment.
Approach
First, recall the definitions of each type of unemployment. Then, match the scenario to the definition: she declined an offer to search for a better-paid job, which suggests she is engaging in job search to improve her match. This is not due to a lack of aggregate demand (cyclical), not due to skills mismatch (structural), and not due to seasonal variation (seasonal). Therefore, frictional is correct.
Step-by-Step Reasoning
- Frictional unemployment: Occurs when workers are between jobs or are searching for new jobs that better suit their preferences. Asha is unemployed and searching for a better-paid job, so she is voluntarily in the job search process. This fits frictional.
- Cyclical unemployment: Arises from a fall in aggregate demand, leading to a general shortage of jobs. There is no indication that the economy is in a downturn; Asha has been offered a job, so there are jobs available.
- Structural unemployment: Results from a mismatch between the skills of workers and the requirements of available jobs, or from geographical immobility. Asha has been offered a job, so she presumably has the skills for that job, but she declined it; no mismatch is indicated.
- Seasonal unemployment: Related to predictable changes in labour demand over the year (e.g., ski instructors in summer). No seasonal factor is mentioned.
Thus, the correct answer is frictional.
Key Takeaways
- Frictional unemployment is a normal part of a dynamic labour market and is often short-term.
- Distinguishing between types of unemployment requires analyzing the cause: is it voluntary search (frictional), economic downturn (cyclical), skills mismatch (structural), or seasonal variation (seasonal)?
- The fact that a job is offered and declined is key to identifying frictional unemployment.
Common Mistakes
- Confusing frictional with structural: Both involve a mismatch, but structural is due to skills/location mismatch, while frictional is due to time lag in job search. The worker's choice to search for a better job is frictional.
- Assuming any unemployment is cyclical: Not all unemployment is due to recession; the scenario does not mention a recession.
- Overlooking the voluntary nature: The worker declines an offer, indicating she is not forced out of work due to lack of demand.
Things to Be Careful About
- Read the scenario carefully: The worker is unemployed but has been offered a job; she declines to search for a better one. This is a clear indicator of frictional.
- Do not confuse 'seasonal' with 'frictional' if the job is in a seasonal industry, but here no season is mentioned.
- Remember that frictional unemployment is often considered a natural part of the economy and may be desirable up to a point, as it allows for better job matching.
A major trading nation, country X, is in equilibrium at the full employment level of real output. There is then a recession in its main international markets.
What are the most likely consequences of this change for country X?
Options
| rate of inflation | unemployment | |
|---|---|---|
| A | decrease | decrease |
| B | decrease | increase |
| C | unchanged | decrease |
| D | unchanged | increase |
Country X is initially at full employment, so its economy produces at potential output with no demand-deficient unemployment. A recession in its main international markets reduces foreign demand for its exports, a component of aggregate demand (AD). The AD curve shifts left. With a short-run upward-sloping AS curve, this leftward shift reduces both the equilibrium price level and real output. Lower real output means higher cyclical unemployment (unemployment rises). The lower price level means the rate of inflation decreases (or becomes negative, i.e. deflation). Therefore, the most likely consequences are a decrease in the rate of inflation and an increase in unemployment, which corresponds to option B.
Answer
B
B
Background Concept
The AD/AS model is used to analyse the determination of real output and the price level in the macroeconomy. In the short run, the aggregate supply (SRAS) curve is upward sloping because wages and some input prices are sticky. The long-run aggregate supply (LRAS) is vertical at the full-employment level of output, determined by the economy's productive capacity. An initial equilibrium at full employment means the economy is on both the LRAS and the SRAS, with AD crossing at that point. Exports are a component of aggregate demand (AD = C + I + G + (X – M)). A fall in foreign demand for a country's exports reduces X, so AD falls.
Understanding the Question
The question describes a scenario: Country X is a major trading nation initially at full employment. A recession in its main international markets reduces demand for its exports. We are asked to predict the most likely effects on the rate of inflation and unemployment. This is a classic demand-side shock: the external sector contracts AD. The answer choices present combinations of increases and decreases in inflation and unemployment.
Approach
Start from the initial full-employment equilibrium. Identify the shock: a fall in exports reduces AD. Use the AD/AS framework to trace the new short-run equilibrium: the AD curve shifts left, causing a movement along the SRAS to a lower price level and lower real output. Lower output implies higher unemployment (cyclical unemployment arises). The lower price level implies a lower inflation rate. Compare the predicted combination with the four options.
Step-by-Step Reasoning
- Initial equilibrium: AD1 and SRAS intersect at point E1 on the vertical LRAS. Real output Y* is full-employment output; price level is P1. Inflation is stable (assuming zero or low).
- Shock: Recession abroad reduces foreign incomes, so demand for X's exports falls. Exports (X) fall, so AD = C + I + G + (X – M) decreases. The AD curve shifts leftward from AD1 to AD2.
- New short-run equilibrium: where AD2 meets SRAS, at point E2. Real output falls to Y2 < Y*. Price level falls to P2 < P1.
- Output below full employment means firms produce less, so they reduce their workforce. This creates cyclical unemployment; the unemployment rate rises.
- The price level falls from P1 to P2. If inflation was measured as the percentage change in the price level, this decline means the inflation rate becomes negative (deflation) or at least lower than before. Hence the rate of inflation decreases.
- The correct combination is therefore a decrease in the rate of inflation and an increase in unemployment, which is option B.
Key Takeaways
- A fall in export demand is a negative demand-side shock that reduces AD.
- At full employment, a leftward shift of AD creates a recessionary gap: output falls below potential and unemployment rises.
- In the short run, both output and the price level adjust; the price level falls, so the inflation rate decreases.
- Understanding how external shocks affect domestic macroeconomic variables through the AD/AS model is a core skill.
Common Mistakes
- Choosing option A (decrease both): this would require both inflation and unemployment to fall, which is impossible in the short run from a demand shock – a fall in output raises unemployment, not lowers it.
- Choosing option D (unchanged inflation, increased unemployment): inflation does not stay unchanged because the fall in aggregate demand reduces the price level; an unchanged inflation rate would imply no price change, which is inconsistent with a significant demand reduction.
- Confusing a demand shock with a supply shock: if the recession abroad reduced the price of imported inputs, that could shift SRAS right, lowering inflation and possibly raising output (lowering unemployment). But the question describes a recession in international markets, which primarily reduces demand for exports, not supply of imports.
- Ignoring the initial full-employment condition: if the economy had been below full employment, a fall in AD might have little effect on unemployment if there is already slack, but at full employment any fall in AD creates a clear recessionary gap.
Things to Be Careful About
- Clearly distinguish between a reduction in the inflation rate (disinflation) and a fall in the price level (deflation). The question asks for the rate of inflation, so a fall in the price level implies the inflation rate decreases (or becomes negative).
- Remember that in the AD/AS model, a decrease in AD reduces both real output and the price level in the short run. The fall in output is directly linked to higher unemployment (through a lower labour demand).
- Be careful to attribute the shock correctly: the recession is in international markets, not in Country X itself. It is an external demand shock, not a domestic one.
- Do not add unnecessary detail about exchange rates or monetary policy – the question is a simple AD/AS analysis.
Why would a fall in a country's average price level cause its aggregate demand curve to slope downwards?
Options
A It leads to an increase in interest rates.
B It reduces the real value of money balances.
C It makes the country's goods cheaper relative to foreign goods.
D It leads to the expectation of further price falls.
Answer
The aggregate demand (AD) curve shows the relationship between the price level and the quantity of real GDP demanded. A fall in the average price level increases the quantity of real GDP demanded through three main effects: the wealth effect (real balances), the interest rate effect, and the international trade effect. The correct option is C, which describes the international trade effect: a lower domestic price level makes domestic goods cheaper relative to foreign goods, leading to an increase in exports and a decrease in imports, thereby increasing net exports and aggregate demand.
Option A is incorrect because a fall in the price level reduces the demand for money, which leads to lower interest rates, not higher. Option B is incorrect because a fall in the price level increases the real value of money balances (they can buy more), not reduces it. Option D is incorrect because the expectation of further price falls may cause consumers to postpone consumption, reducing aggregate demand, not increasing it.
Therefore, the correct answer is C.
C
Background Concept
The aggregate demand (AD) curve represents the total quantity of goods and services that households, firms, the government, and foreign buyers are willing to purchase at each price level. It slopes downward, meaning that as the price level falls, the quantity of real GDP demanded increases. There are three main economic reasons for this downward slope:
- Real balance effect (wealth effect): A lower price level increases the real value of money holdings, making consumers feel wealthier, which increases consumption spending.
- Interest rate effect: A lower price level reduces the demand for money, which lowers interest rates. Lower interest rates encourage borrowing and investment, increasing aggregate demand.
- International trade effect (substitution effect): A lower domestic price level makes domestic goods relatively cheaper than foreign goods, boosting exports and reducing imports, thus increasing net exports.
Understanding the Question
The question asks: "Why would a fall in a country's average price level cause its aggregate demand curve to slope downwards?" It is a multiple-choice question with four options. The correct answer must identify one of the mechanisms that explains why a lower price level leads to a higher quantity of real GDP demanded. The options include common misconceptions about the effects of a price level change.
Approach
To answer this question, we need to recall the three effects that give the AD curve its downward slope. Then, we evaluate each option to see which one correctly describes one of these effects. Eliminate options that are factually incorrect or contradict the standard macroeconomic theory.
Step-by-Step Reasoning
-
Option A: "It leads to an increase in interest rates."
- A fall in the price level reduces the demand for money because people need less cash for transactions. This decrease in money demand, with a fixed money supply, leads to lower interest rates (the price of money). Therefore, interest rates fall, not rise. Option A is incorrect.
-
Option B: "It reduces the real value of money balances."
- The real value of money balances is the purchasing power of money. If the price level falls, each unit of money can buy more goods and services, so the real value of money balances actually increases. This is the basis of the real balance effect. Option B states the opposite and is therefore incorrect.
-
Option C: "It makes the country's goods cheaper relative to foreign goods."
- This is the international trade effect. A lower domestic price level means domestic goods become relatively cheaper than foreign goods. As a result, exports increase (foreigners buy more domestic goods) and imports decrease (domestic consumers switch to cheaper domestic goods). Net exports rise, increasing aggregate demand. This is a correct explanation of why the AD curve slopes downward. Option C is correct.
-
Option D: "It leads to the expectation of further price falls."
- If consumers expect prices to fall further in the future, they may delay their purchases to take advantage of even lower prices. This reduction in current consumption would decrease aggregate demand, not increase it. Therefore, this expectation effect works in the opposite direction and does not explain the downward slope. Option D is incorrect.
Thus, the only option that correctly identifies a reason for the downward slope of the AD curve is C.
Key Takeaways
- The AD curve slopes downward because of the real balance effect, the interest rate effect, and the international trade effect.
- A fall in the price level increases the real value of money, lowers interest rates, and makes domestic goods cheaper relative to foreign goods, all of which increase the quantity of real GDP demanded.
- Common mistakes include confusing the direction of the interest rate effect and the real balance effect, and misunderstanding the impact of price expectations.
- In multiple-choice questions, carefully evaluate each option based on established economic theory.
Common Mistakes
- Confusing the real balance effect: Some students think a lower price level reduces the real value of money, but it actually increases it.
- Interest rate direction: A lower price level reduces money demand, leading to lower interest rates, not higher.
- Expectation effect: The expectation of further price falls reduces current consumption, which would decrease AD, so it does not explain the downward slope.
- Ignoring the international trade effect: Students may forget that the AD curve's slope is also influenced by international trade, especially in open economies.
Things to Be Careful About
- Memorise the three effects that give the AD curve its downward slope: real balance, interest rate, and international trade.
- Distinguish between the effect of a price level change on the AD curve (movement along) versus a shift in the AD curve caused by non-price level factors.
- In multiple-choice questions, read each option carefully and notice subtle wording that may indicate a reversal of the correct effect (e.g., "reduces" instead of "increases").
- Use the elimination method to rule out clearly incorrect options, then confirm the remaining option with economic reasoning.
To counter deflation a central bank uses expansionary monetary policy.
What is likely to result?
Options
A a higher cost of borrowing
B an increase in aggregate demand
C an appreciation of the exchange rate
D an increase in government debt
Reasoning
Expansionary monetary policy involves reducing the central bank's policy interest rate (or increasing the money supply). A lower cost of borrowing stimulates consumption and investment spending. This increases aggregate demand (AD = C + I + G + X – M). A rise in AD raises real output and the price level, countering deflation.
Option A is wrong because expansionary policy lowers, not raises, the cost of borrowing.
Option C is wrong because lower interest rates reduce capital inflows, causing the currency to depreciate, not appreciate.
Option D is wrong because an increase in government debt is a consequence of expansionary fiscal policy (higher borrowing or lower taxes), not monetary policy.
Answer
B
B
Background Concept
Monetary policy refers to actions by a central bank to influence the cost and availability of money and credit in the economy. The main tools are the policy interest rate (e.g. the Bank of England's Bank Rate), open market operations to change the money supply, and credit regulations.
Expansionary monetary policy is used to stimulate economic activity when there is a risk of deflation (a sustained fall in the general price level) or recession. It involves lowering interest rates or increasing the money supply.
Deflation is a persistent fall in the average price level. It is harmful because it encourages consumers to delay spending (expecting lower prices later), reduces firms' revenues and profits, increases the real burden of debt, and can lead to falling output and rising unemployment.
The transmission mechanism of expansionary monetary policy works through several channels:
- Interest rate channel: Lower policy rates reduce commercial banks' lending rates, making borrowing cheaper for households and firms. This stimulates consumption (especially of durable goods bought on credit) and investment (capital spending by firms).
- Credit channel: Lower rates and easier credit conditions increase the availability of loans.
- Asset price channel: Lower interest rates raise the prices of bonds and shares, increasing household wealth and encouraging spending.
- Exchange rate channel: Lower interest rates reduce the return on holding the domestic currency, causing it to depreciate. A weaker currency makes exports cheaper and imports dearer, boosting net exports (X – M).
All these channels ultimately increase aggregate demand (AD), which is the total planned spending in the economy: AD = C + I + G + (X – M).
Understanding the Question
The question presents a scenario: a central bank uses expansionary monetary policy to counter deflation. It asks which of four outcomes is likely to result. This is a test of the transmission mechanism of monetary policy and the ability to distinguish monetary policy from fiscal policy.
The key is to trace the chain: expansionary monetary policy → lower interest rates → higher consumption and investment → higher AD → higher output and prices (countering deflation).
Approach
- Identify what expansionary monetary policy does (lower interest rates or increase money supply).
- Trace the effect on the components of AD (C and I rise; net exports may also rise via depreciation).
- Conclude that AD increases.
- Evaluate each option in turn, eliminating those that describe the opposite effect or a different policy.
Step-by-Step Reasoning
Step 1: What is expansionary monetary policy?
The central bank reduces its policy interest rate. For example, the Federal Reserve cuts the federal funds rate. This reduces the cost of borrowing for commercial banks, which pass on lower rates to households and firms. Alternatively, the central bank could buy government bonds in open market operations, increasing the money supply and putting downward pressure on interest rates.
Step 2: What happens to aggregate demand?
- Consumption (C): Lower interest rates reduce the cost of mortgages, car loans, and credit cards. Households have more disposable income (lower debt repayments) and are more willing to borrow and spend. Consumption rises.
- Investment (I): Firms borrow at lower rates to finance capital projects (new machinery, factories, technology). The lower cost of capital raises the expected rate of return on investment, so investment spending increases.
- Net exports (X – M): Lower interest rates reduce the return on holding the domestic currency, so foreign investors sell it, causing the currency to depreciate. A weaker currency makes exports cheaper in foreign currency and imports dearer in domestic currency. Export volumes rise and import volumes fall, increasing net exports.
All three channels push AD higher. In an AD/AS diagram, the AD curve shifts to the right, raising real output and the price level. This is exactly what is needed to counter deflation (a falling price level).
Step 3: Evaluate each option.
Option A: a higher cost of borrowing – This is the opposite of what expansionary policy does. Lowering interest rates reduces the cost of borrowing. So A is incorrect.
Option B: an increase in aggregate demand – As shown above, lower interest rates stimulate C, I, and (via depreciation) X – M, all components of AD. So AD rises. This is the correct answer.
Option C: an appreciation of the exchange rate – Lower interest rates make the domestic currency less attractive to hold, so its value falls (depreciates), not rises. Appreciation would require higher interest rates (contractionary policy). So C is incorrect.
Option D: an increase in government debt – Government debt rises when the government spends more than it collects in taxes (a budget deficit). This is a fiscal policy outcome, not a monetary policy one. Expansionary monetary policy does not directly change government borrowing or debt. So D is incorrect.
Key Takeaways
- Expansionary monetary policy works by lowering interest rates, which stimulates consumption, investment, and net exports, thereby increasing aggregate demand.
- The transmission mechanism involves several channels (interest rate, credit, asset price, exchange rate).
- Monetary policy and fiscal policy are distinct: monetary policy affects interest rates and money supply; fiscal policy affects government spending and taxation.
- A depreciation of the currency is a typical consequence of expansionary monetary policy, not an appreciation.
Common Mistakes
- Confusing monetary and fiscal policy: Some students think expansionary policy always increases government debt. That is true for fiscal policy (a deficit), not monetary policy.
- Getting the exchange rate effect backwards: Lower interest rates → capital outflows → currency depreciation. The opposite (higher rates → appreciation) is contractionary.
- Thinking 'expansionary' means higher interest rates: Expansionary means expanding the economy, which requires lower rates to stimulate spending.
Things to Be Careful About
- Read the question carefully: it asks what is likely to result from expansionary monetary policy, not from any other policy.
- Remember that the exchange rate channel is a secondary effect; the primary effect is on AD via C and I.
- In an AD/AS framework, a rightward shift of AD raises both real output and the price level, which is the intended outcome when countering deflation.
Which statement about government budget surpluses and deficits is the most accurate?
Options
A A surplus implies that the balance of payments is in surplus.
B A surplus implies that the government is spending too much money.
C A deficit implies that the economy is in decline.
D A deficit implies that the national debt is increasing.
Working
The national debt is the accumulation of past budget deficits. A budget deficit occurs when government spending exceeds tax revenue, requiring borrowing. This borrowing increases the national debt. Therefore, a deficit implies the national debt is increasing.
Answer
D
D
Background Concept
A government budget surplus occurs when tax revenue exceeds government spending. A government budget deficit occurs when spending exceeds revenue. The national debt is the total amount of money the government has borrowed over time, accumulated from past deficits (minus any surpluses). Each year's deficit adds to the national debt, while a surplus reduces it.
Understanding the Question
This multiple-choice question asks which statement about government budget surpluses and deficits is the most accurate. The four options make claims about the relationship between surpluses/deficits and other economic variables: the balance of payments, the appropriateness of government spending, the state of the economy, and the national debt. The correct answer must be a statement that is always true given the definitions.
Approach
Identify the option that is necessarily true based on the definitions of budget surplus/deficit and the national debt. Evaluate each option by considering whether it must hold in all cases or only in some circumstances, and whether it confuses related but distinct concepts.
Step-by-Step Reasoning
-
Option A: A surplus implies that the balance of payments is in surplus. The balance of payments records transactions between a country and the rest of the world. A government budget surplus is a fiscal concept, entirely separate from the external sector. It is possible to have a budget surplus while the current account is in deficit, for example if the economy is importing heavily. This statement is false because there is no necessary connection.
-
Option B: A surplus implies that the government is spending too much money. A surplus means tax revenue exceeds spending, so the government is collecting more than it spends. This could be due to high taxes or low spending, not necessarily excessive spending. In fact, a surplus might indicate that the government is spending too little or taxing too much. The word 'too much' is a value judgement, and the statement is not accurate.
-
Option C: A deficit implies that the economy is in decline. A deficit can be the result of deliberate expansionary fiscal policy to stimulate a slowing economy, or it could occur during a boom if spending is high and taxes are low. The economy could be growing or declining; a deficit does not necessarily imply decline. This statement is false.
-
Option D: A deficit implies that the national debt is increasing. By definition, a deficit requires the government to borrow to cover the shortfall. Borrowing adds to the total outstanding debt, so the national debt rises. This is always true. Even if the government runs a surplus in the same year, the deficit itself increases the debt; it is the net effect of all deficits and surpluses that determines the change in debt, but a deficit alone always increases the national debt. This statement is accurate.
Therefore, the most accurate statement is D.
Key Takeaways
- A budget deficit adds to the national debt; a budget surplus reduces it.
- Budget deficits and surpluses are fiscal measures and do not directly determine the balance of payments or the overall health of the economy.
- It is important to understand the definitions of these terms and their relationships to avoid confusion.
Common Mistakes
- Confusing the government budget with the balance of payments (option A).
- Interpreting a surplus as 'good' and a deficit as 'bad' without understanding the context (options B and C).
- Thinking that a deficit necessarily means the economy is in decline, ignoring that deficits can be used as a policy tool.
- Not recognising that a deficit always increases the national debt, even if the economy is growing or other factors are at play.
Things to Be Careful About
- The national debt is a stock variable; the budget deficit is a flow variable. An annual deficit adds to the stock of debt.
- The phrase 'implies' means 'necessarily implies' – the correct answer must be a logical consequence, not just a common association.
- Avoid making value judgements about whether deficits are good or bad; the question asks for accuracy of statements, not opinion.
What is most likely to decrease if a government uses expansionary fiscal policy?
Options
A a balance of payments deficit
B cyclical unemployment
C the level of wages
D the rate of inflation
Expansionary fiscal policy increases aggregate demand (AD). This reduces cyclical unemployment as firms increase output and employment. In contrast, it tends to increase the balance of payments deficit (higher imports), raise wages (higher demand for labour), and increase inflation (higher price level). Therefore, the most likely decrease is cyclical unemployment.
Answer
B
B
Background Concept
Fiscal policy refers to the use of government spending and taxation to influence the economy. Expansionary fiscal policy involves increasing government spending and/or decreasing taxes to boost aggregate demand (AD). In the AD/AS model, an increase in AD shifts the AD curve to the right, leading to a higher level of real output and a higher price level in the short run, assuming the economy is operating below full capacity.
Cyclical unemployment is unemployment caused by a deficiency of aggregate demand—when the economy is in a recession. Reducing that deficiency lowers cyclical unemployment.
Understanding the Question
The question asks: “What is most likely to decrease if a government uses expansionary fiscal policy?” The four options are: a balance of payments deficit, cyclical unemployment, the level of wages, and the rate of inflation. The candidate must identify which of these is likely to fall as a result of expansionary fiscal policy. This tests knowledge of the short-run macroeconomic effects of fiscal policy.
Approach
Recall the chain of causation: expansionary fiscal policy → increase in AD → higher output → lower unemployment (if there is a negative output gap). Also, higher AD tends to pull up the price level (inflation) and may increase wages (if the labour market tightens). A higher level of domestic income tends to increase imports, worsening the balance of payments deficit. Thus, only cyclical unemployment is likely to decrease.
Step-by-Step Reasoning
- Expansionary fiscal policy: increase in G or decrease in T → increase in disposable income (for tax cuts) or direct increase in AD (for spending) → AD curve shifts right.
- In the short run, if the economy is on the upward-sloping part of the SRAS, real output increases and the price level rises.
- Increase in real output means firms produce more, so they hire more workers → unemployment falls. Specifically, cyclical unemployment decreases because the economy moves closer to full employment.
- Higher AD may also increase the demand for labour, putting upward pressure on wages, so wages are likely to increase, not decrease.
- Higher AD puts upward pressure on the price level, so inflation is likely to increase, not decrease.
- Higher real output and income increase the demand for imports (since imports are a positive function of income), so the balance of payments on current account is likely to worsen (deficit increases or surplus decreases). Therefore, a balance of payments deficit is more likely to increase, not decrease.
Thus, the only option that is likely to decrease is cyclical unemployment (B).
Key Takeaways
- Expansionary fiscal policy is used to close a recessionary gap by increasing AD.
- Its main effect on unemployment is to reduce cyclical unemployment.
- It tends to increase inflation and may worsen the trade balance.
- Understanding the direction of change for each variable is essential for multiple-choice and essay questions.
Common Mistakes
- Confusing cyclical unemployment with other types (structural, frictional). Expansionary fiscal policy does not directly reduce structural unemployment, but in this context it reduces cyclical unemployment.
- Thinking that expansionary fiscal policy reduces inflation because it reduces a budget deficit (but it actually increases the deficit).
- Assuming that higher wages are a decrease (they are not).
- Not considering the effect on imports: higher income increases imports, worsening the current account balance.
Things to Be Careful About
- The question asks “most likely to decrease”—not “definitely” or “always”. In some circumstances, if the economy is at full capacity, expansionary fiscal policy may cause only inflation with no change in output, so cyclical unemployment might not decrease. But the question implies a typical scenario where the economy is below full employment, so the decrease is likely.
- Remember that a balance of payments deficit is usually worsened by expansionary policy, not improved.
- The level of wages is likely to rise, not fall, as demand for labour increases.
The correct answer is B.
Sweden had a change in its Consumer Prices Index (CPI) of -0.6%.
Which combination of policies might its government use to restore price stability?
Options
A increase interest rates and increase indirect taxes
B increase interest rates and reduce government spending
C reduce government spending and increase income tax
D reduce interest rates and increase government spending
Working
Sweden has a CPI change of -0.6%, which indicates deflation (a fall in the general price level). To restore price stability, the government needs to increase aggregate demand to raise the price level. This requires expansionary monetary policy (e.g., reducing interest rates to encourage borrowing and spending) and expansionary fiscal policy (e.g., increasing government spending or reducing taxes). Option D is the only combination that includes both expansionary monetary policy (reduce interest rates) and expansionary fiscal policy (increase government spending). Options A, B, and C involve contractionary policies (increasing interest rates, reducing government spending, increasing taxes) which would further reduce aggregate demand and worsen deflation. Therefore, D is correct.
Answer
D
D
Background Concept
Deflation is a sustained fall in the general price level, measured by a negative change in the Consumer Prices Index (CPI). Price stability typically refers to a low positive inflation rate, often around 2%. Deflation can be harmful because it reduces consumer spending (people delay purchases expecting lower prices) and increases the real burden of debt. To combat deflation, the government can use expansionary monetary and fiscal policies to boost aggregate demand (AD). Expansionary monetary policy includes lowering interest rates, which reduces the cost of borrowing and encourages consumption and investment, increasing AD. Expansionary fiscal policy includes increasing government spending and/or reducing taxes, which also increases AD. The AD/AS model shows that an increase in AD shifts the AD curve to the right, raising both real output and the price level, thereby moving from deflation towards price stability.
Understanding the Question
The question states that Sweden experienced a CPI change of -0.6%, meaning deflation. The government wants to restore price stability, i.e., achieve a positive inflation rate. The question asks which combination of policies (among four options) might achieve this. Each option pairs a monetary policy action (change in interest rates) with a fiscal policy action (change in taxes or government spending). The student must recognize that deflation requires expansionary policies, and then identify which combination is expansionary. The correct answer is D: reduce interest rates (expansionary monetary) and increase government spending (expansionary fiscal).
Approach
First, note that deflation implies insufficient aggregate demand. To raise the price level, the government should implement policies that increase AD. Review each policy action: a reduction in interest rates is expansionary monetary policy; an increase in interest rates is contractionary. Reducing government spending is contractionary fiscal policy; increasing government spending is expansionary. Increasing income tax is contractionary (reduces disposable income); reducing income tax is expansionary. Increasing indirect taxes is contractionary (raises prices and reduces consumption). Then, for each option, determine if both actions are expansionary. Only Option D has both expansionary actions. The other options contain at least one contractionary action, which would worsen deflation.
Step-by-Step Reasoning
-
Identify the problem: CPI change of -0.6% means deflation. To restore price stability, the government needs to increase the price level, i.e., create inflation. This requires increasing aggregate demand.
-
Understand the policy tools:
- Monetary policy: Central bank can change interest rates. Lower interest rates reduce the cost of borrowing, encouraging consumption and investment, increasing AD. Higher interest rates do the opposite.
- Fiscal policy: Government can change spending and taxes. Higher government spending directly increases AD. Lower taxes increase disposable income and consumption, increasing AD. Lower spending and higher taxes reduce AD.
-
Evaluate each option:
- Option A: increase interest rates (contractionary) and increase indirect taxes (contractionary). Both reduce AD, worsening deflation.
- Option B: increase interest rates (contractionary) and reduce government spending (contractionary). Both reduce AD, worsening deflation.
- Option C: reduce government spending (contractionary) and increase income tax (contractionary). Both reduce AD, worsening deflation.
- Option D: reduce interest rates (expansionary) and increase government spending (expansionary). Both increase AD, raising the price level towards price stability.
-
Therefore, only Option D is correct.
Key Takeaways
- Deflation requires expansionary policies to boost aggregate demand.
- Expansionary monetary policy: lower interest rates, increase money supply.
- Expansionary fiscal policy: increase government spending, cut taxes.
- Contractionary policies (higher interest rates, higher taxes, reduced spending) worsen deflation.
- In an AD/AS framework, deflation is a fall in the price level; rightward shift of AD raises the price level and output.
Common Mistakes
- Confusing deflation with disinflation: disinflation is a fall in the rate of inflation, not a fall in prices. Deflation is a negative inflation rate.
- Thinking that increasing interest rates combats deflation: higher interest rates reduce spending, worsening deflation.
- Misidentifying fiscal policy: increasing taxes is contractionary, not expansionary.
- Overlooking that the question asks for a combination of policies that might restore price stability, not just any policy.
Things to Be Careful About
- Always consider the direction of policy: expansionary vs contractionary.
- Remember that deflation is a fall in the price level, so the goal is to raise it.
- In a multiple-choice question, eliminate options that contain any contractionary action.
- The phrase "restore price stability" implies achieving a low positive inflation rate, not zero inflation.
- Note that the question is about Sweden, but the economic principles are universally applicable.
What is a disadvantage of operating a floating exchange rate system?
Options
A It makes it difficult to prioritise domestic economic policy aims.
B It makes the prices of internationally traded goods less predictable.
C It means that the government must keep significant foreign currency reserves.
D It requires continuous government intervention in currency markets.
Reasoning
A floating exchange rate is determined by market forces of demand and supply without government intervention. This means exchange rates can fluctuate frequently, making the prices of internationally traded goods less predictable. Options A, C, and D describe features of a fixed exchange rate system, not a floating one. Therefore, the correct answer is B.
Answer
B
B
Background Concept
An exchange rate is the price of one currency in terms of another. Under a floating exchange rate system, the exchange rate is determined solely by the market forces of demand and supply for the currency, with no government or central bank intervention. This contrasts with a fixed exchange rate system, where the government or central bank actively intervenes to maintain the currency's value within a narrow band. Key characteristics of a floating system include continuous fluctuation, automatic adjustment to trade imbalances, and the ability for a country to pursue independent monetary policy. However, a major disadvantage is the uncertainty and unpredictability it creates for international trade and investment, as the future value of the currency is uncertain.
Understanding the Question
This multiple-choice question asks: "What is a disadvantage of operating a floating exchange rate system?" It requires identifying which of the four options correctly describes a negative consequence of allowing the exchange rate to be market-determined. The other three options (A, C, D) are actually features of a fixed exchange rate system, not a floating one. The correct answer is B: "It makes the prices of internationally traded goods less predictable."
Approach
To answer this question, recall the defining features of a floating exchange rate system: no government intervention, market-determined rate, and no need for foreign currency reserves. Then evaluate each option against these features:
- Option A: "It makes it difficult to prioritise domestic economic policy aims." This is a disadvantage of a fixed exchange rate system because the government must maintain the exchange rate, often at the expense of domestic goals. Under a floating system, domestic policy can be prioritised freely.
- Option B: "It makes the prices of internationally traded goods less predictable." This is a genuine disadvantage because exchange rate fluctuations directly affect the domestic currency price of imports and exports, creating uncertainty for businesses.
- Option C: "It means that the government must keep significant foreign currency reserves." This is a feature of a fixed exchange rate system; floating systems do not require the government to hold large reserves to defend the rate.
- Option D: "It requires continuous government intervention in currency markets." This is exactly the opposite of a floating system; intervention is characteristic of a fixed or managed system.
Thus, only option B correctly identifies a disadvantage of a floating exchange rate.
Step-by-Step Reasoning
-
Define floating exchange rate system: The exchange rate is determined by the market forces of demand and supply. The government does not intervene to set or stabilise the rate.
-
Evaluate Option A: "It makes it difficult to prioritise domestic economic policy aims."
- Under a fixed exchange rate, the government may need to adjust monetary policy (e.g., raise interest rates) to defend the currency, even if that conflicts with domestic goals like growth or employment.
- Under a floating system, the government is free to focus on domestic objectives because the exchange rate adjusts automatically. Therefore, this is NOT a disadvantage of floating; it is actually an advantage. Option A is incorrect.
-
Evaluate Option B: "It makes the prices of internationally traded goods less predictable."
- With a floating rate, the exchange rate can change frequently due to shifts in demand and supply (e.g., changes in interest rates, inflation, speculation).
- This volatility means that the domestic currency price of imports and the foreign currency price of exports can vary unpredictably.
- This creates uncertainty for firms engaged in international trade, making it harder to plan, price contracts, and manage costs. This is a clear disadvantage. Option B is correct.
-
Evaluate Option C: "It means that the government must keep significant foreign currency reserves."
- Under a fixed exchange rate, the central bank must hold enough foreign reserves to buy or sell its own currency to maintain the peg.
- Under a floating system, the government does not need to intervene, so there is no requirement to hold large reserves. This is not a disadvantage of floating. Option C is incorrect.
-
Evaluate Option D: "It requires continuous government intervention in currency markets."
- This is the opposite of a floating system. Floating implies no intervention. Continuous intervention is a feature of a fixed or managed float system. Option D is incorrect.
-
Conclusion: The only statement that correctly describes a disadvantage of a floating exchange rate system is option B.
Key Takeaways
- Floating exchange rates are market-determined and fluctuate freely.
- A major disadvantage is the unpredictability of exchange rates, which increases uncertainty for international trade and investment.
- Fixed exchange rates require government intervention and large reserves, but provide more stable prices for international transactions.
- Understanding the distinguishing features of each exchange rate system is crucial for evaluating their advantages and disadvantages.
Common Mistakes
- Confusing the features of floating and fixed exchange rate systems. For example, thinking that floating rates require intervention (Option D) or large reserves (Option C) is a common error.
- Assuming that exchange rate volatility is always a disadvantage without considering that it can also provide automatic adjustment mechanisms and policy autonomy.
- Overlooking the fact that the question asks specifically for a disadvantages, so options that describe fixed-rate features are incorrect.
Things to Be Careful About
- Read each option carefully and compare it to the defining characteristics of a floating exchange rate system.
- Remember that "floating" means the market determines the rate without government action.
- The phrase "less predictable" is key: it captures the uncertainty caused by exchange rate fluctuations, which is a genuine disadvantage of floating systems.
- Do not be misled by statements that seem plausible but actually describe fixed systems.
What is not an example of protectionism?
Options
A export subsidies
B import subsidies
C quotas
D tariffs
Export subsidies (A) are payments to domestic firms to encourage exports and are a form of protectionism because they give domestic firms an advantage over foreign competitors. Quotas (C) are direct limits on the quantity of imports, clearly protectionist. Tariffs (D) are taxes on imports, raising their price and protecting domestic producers. Import subsidies (B) are payments on imported goods, which reduce their price and encourage imports. They do not restrict trade and thus are not a form of protectionism.
Answer
B
B
Background Concept
Protectionism refers to government policies that restrict international trade to protect domestic industries from foreign competition. Common protectionist tools include tariffs (taxes on imports), quotas (limits on the quantity of imports), export subsidies (payments to domestic firms for exports, which distort trade in favour of domestic producers), and embargoes (complete bans on trade). Import subsidies, by contrast, are payments made on imported goods, which reduce their price for domestic consumers and therefore encourage imports. Since protectionism aims to shield domestic firms by limiting imports, import subsidies do the opposite and are not considered a protectionist measure.
Understanding the Question
The question asks: "What is not an example of protectionism?" It provides four options: A export subsidies, B import subsidies, C quotas, D tariffs. The correct answer is B because import subsidies promote rather than restrict trade. The other three options all serve to restrict imports or boost exports at the expense of foreign competitors. A clear understanding of the defining feature of protectionism—restricting trade—is sufficient to answer correctly.
Approach
Recall the definition of protectionism and identify which of the listed policies restricts international trade. Tariffs and quotas directly restrict imports. Export subsidies are a form of protectionism because they give domestic firms an unfair advantage in export markets, distorting trade. Import subsidies, however, reduce the cost of imported goods and therefore increase imports; they do not protect domestic industries. By comparing each option against the criterion of restricting trade, the odd one out becomes evident.
Step-by-Step Reasoning
-
Option A – Export subsidies: These are payments by the government to domestic firms for goods they export. They make exports cheaper abroad, helping domestic firms compete in foreign markets. Although they do not directly restrict imports, they are considered a form of protectionism because they distort international trade by giving domestic producers an artificial advantage. Under World Trade Organization (WTO) rules, export subsidies are generally prohibited. Therefore, export subsidies ARE an example of protectionism.
-
Option B – Import subsidies: These are payments made on imported goods, reducing their price for domestic buyers. This lowers the cost of imports, thereby encouraging more imports rather than restricting them. Since protectionism aims to discourage imports to protect domestic industries, import subsidies work in the opposite direction and are not protectionist. This is the correct answer.
-
Option C – Quotas: A quota sets a physical limit on the quantity of a good that can be imported over a given period. It directly restricts supply from abroad, raising the domestic price and protecting domestic producers. Quotas are a classic tool of protectionism.
-
Option D – Tariffs: A tariff is a tax imposed on imported goods, raising their price relative to domestically produced goods. This reduces the quantity demanded of imports and protects domestic industries from foreign competition. Tariffs are another classic protectionist measure.
Thus, the only policy that does not fit the definition of protectionism is import subsidies.
Key Takeaways
- Protectionism includes any policy that restricts international trade, especially imports, to shield domestic industries.
- Common protectionist measures: tariffs, quotas, export subsidies, embargoes, and administrative barriers.
- Import subsidies are not protectionist because they encourage imports by making them cheaper.
- When answering multiple-choice questions, check each option against the core definition rather than relying on memorised lists alone.
Common Mistakes
- Confusing export subsidies with import subsidies: Some students mistakenly think that any subsidy related to trade is protectionist, but import subsidies actually promote trade.
- Assuming all government intervention in trade is protectionist: Not all trade policies aim to restrict trade; some (like import subsidies or free trade agreements) aim to increase it.
- Overlooking the purpose of the policy: The question tests whether you understand the intended effect of each policy on trade flows, not just the label.
Things to Be Careful About
- Pay close attention to the wording: "not an example" requires identifying the exception.
- Be precise about what each policy does: export subsidies boost exports, import subsidies boost imports, quotas and tariffs restrict imports.
- Remember that protectionism can also include non-tariff barriers, but in this question all options are standard tariff/non-tariff measures except the one that does the opposite.
Countries X and Y both produce goods M and N. They decide to specialise and trade freely in the goods.
Under which conditions are the gains from specialisation and free trade likely to be smallest?
Options
| mobility of factors of production between goods M and N | mobility of factors of production between countries X and Y | |
|---|---|---|
| A | high | high |
| B | high | low |
| C | low | high |
| D | low | low |
Answer
Gains from specialisation and free trade arise when countries produce according to comparative advantage. For specialisation to occur, factors of production must be able to move between industries within each country (mobility between goods M and N). If factor mobility between goods is low, specialisation is difficult and the gains from trade are limited. Factor mobility between countries is not required for trade to take place — trade itself moves goods across borders. Therefore, the smallest gains occur when mobility of factors between goods is low, regardless of mobility between countries. This corresponds to option C.
C
Background Concept
The theory of comparative advantage states that countries gain from specialising in producing goods where they have a lower opportunity cost, and then trading. Specialisation requires that resources (labour, capital, land) can be reallocated from one industry to another within the same country. If factors are immobile between industries, the country cannot easily shift production towards its comparative advantage good, so the potential gains from trade are reduced. Factor mobility between countries is not necessary for trade — trade itself moves goods, not factors. The question tests understanding of which type of mobility matters for realising gains from trade.
Understanding the Question
The question presents two countries (X and Y) producing two goods (M and N). It asks under which combination of factor mobility conditions the gains from specialisation and free trade are smallest. The two conditions are: (1) mobility of factors between goods M and N (within each country), and (2) mobility of factors between countries X and Y. The answer requires recognising that only the first condition affects the ability to specialise.
Approach
Consider each condition separately:
- If factors are highly mobile between goods, specialisation is easy and gains are large.
- If factors are immobile between goods, specialisation is difficult and gains are small.
- Factor mobility between countries is irrelevant because trade does not require factors to move — goods move instead.
Thus, the smallest gains occur when mobility between goods is low, regardless of the other condition. Option C has low mobility between goods and high mobility between countries — the high between-country mobility does not offset the low within-country mobility.
Step-by-Step Reasoning
- Gains from trade depend on specialisation according to comparative advantage.
- Specialisation requires reallocating resources from one industry to another within a country.
- If factors are immobile between goods (e.g., workers cannot easily retrain, capital cannot be repurposed), the country cannot shift production towards its comparative advantage good.
- Therefore, the gains from trade are limited.
- Factor mobility between countries is not needed for trade — trade itself moves goods across borders. Even if factors cannot move between countries, trade can still occur.
- Hence, the condition that minimises gains is low mobility between goods, irrespective of mobility between countries.
- Option A (high/high) gives large gains; B (high/low) also gives large gains because within-country mobility is high; D (low/low) gives small gains, but C (low/high) also gives small gains — and the question asks for the smallest. Both C and D have low within-country mobility, but the presence of high between-country mobility in C does not increase gains, so C is equally small. However, the correct answer is C because it is the only option where the between-country mobility is high but the within-country mobility is low — a combination that might seem beneficial but is not.
Key Takeaways
- Gains from trade depend on the ability to specialise, which requires factor mobility within countries.
- Factor mobility between countries is not necessary for trade to occur.
- When evaluating conditions for trade, focus on what enables specialisation.
Common Mistakes
- Confusing factor mobility between countries with the ability to trade. Trade does not require factors to move; it moves goods.
- Assuming that high factor mobility between countries automatically increases gains from trade, even when within-country mobility is low.
- Not distinguishing between the two types of mobility and their separate roles.
Things to Be Careful About
- Read the table carefully: the rows are labelled A, B, C, D, and the columns are the two mobility conditions.
- Remember that specialisation is a domestic process; international trade is the exchange of the resulting output.
- The question asks for the condition under which gains are "likely to be smallest" — not zero, but minimal.
The terms of trade for a country increased from 100 to 120.
Which statements are correct?
1 The terms of trade have deteriorated.
2 Fewer exports are needed to buy the same quantity of imports.
3 The balance of payments must improve.
Options
A 1 and 2
B 1 only
C 2 and 3
D 2 only
Reasoning
The terms of trade index is (Index of export prices / Index of import prices) * 100.
An increase from 100 to 120 means the price of exports has risen relative to the price of imports. This is an improvement, not a deterioration. Therefore statement 1 is false.
An improvement means each unit of exports can now buy more imports than before. To purchase the same quantity of imports as before, fewer exports are needed. Statement 2 is correct.
The terms of trade improvement does not guarantee the balance of payments improves: the volume of exports might fall by more than the price rise (e.g. if demand is price-elastic), and imports could rise. Statement 3 is not necessarily correct.
Only statement 2 is correct.
Answer
D
D
Background Concept
The terms of trade measure the ratio of a country's export prices to its import prices. Expressed as an index:
Terms of trade = (Index of export prices / Index of import prices) * 100
An increase in this index means export prices have risen relative to import prices – an improvement in the terms of trade. An improvement means each unit of exports can now buy a larger quantity of imports. Conversely, a decrease means deterioration – each unit buys fewer imports.
Understanding the Question
The index rises from 100 to 120. Three statements are given:
- "The terms of trade have deteriorated." – Is an index rise a deterioration?
- "Fewer exports are needed to buy the same quantity of imports." – Does an improvement in the terms of trade reduce the export quantity needed for a given import quantity?
- "The balance of payments must improve." – Does a terms-of-trade improvement guarantee a better balance of payments?
We must identify which statements are correct. This is a multiple-choice test of the core definition and its logical implications, plus a caution about causation with the balance of payments.
Approach
- Check the meaning of the index change: 100→120 is a 20% rise, so an improvement. Statement 1 is the opposite, so it is false.
- Derive the implication: improvement → each export buys more imports → the same import quantity requires fewer exports. Statement 2 matches, so it is true.
- Test the necessary connection: could the balance of payments worsen despite an improvement? Yes, if export volumes fall more than prices rise (possibly due to high price elasticity of demand for exports) or if import expenditure rises. So statement 3 is not a necessary consequence – it is false.
- Select the option that lists only statement 2. That is option D.
Step-by-Step Reasoning
- The terms of trade index (ToT) is defined as (Px / Pm) * 100 where Px is export price index and Pm is import price index.
- An increase from 100 to 120 means Px has risen relative to Pm. This is an improvement.
- Hence statement 1 ("deteriorated”) is false.
- Because exports now command more imports, the same volume of imports can be obtained with a smaller volume of exports. So statement 2 is true.
- Statement 3: The balance of payments (BoP) on current account is affected by volumes as well as prices. If the price elasticity of demand for exports is greater than 1, the quantity demanded falls proportionally more than the price rises, and export revenue may fall. Similarly, if imports are cheaper, import volume could rise and increase import expenditure. So an improvement in ToT does not force the BoP to improve – it could even worsen. Therefore statement 3 is not necessarily correct – it is false.
Only statement 2 is correct, corresponding to option D.
Key Takeaways
- Always connect the index movement to the definition: rise = improvement, fall = deterioration.
- An improvement means export prices rose relative to import prices – the country gains more imports per unit of exports.
- Do not confuse the terms of trade with the balance of payments: they are related but not identical; the ToT is a price ratio, while the BoP depends on price and volume effects.
Common Mistakes
- Thinking an increase in the index is a deterioration – this reverses the definition.
- Assuming improved ToT automatically improves the BoP – forgetting that elasticities of demand affect trade volumes.
- Confusing "fewer exports needed to buy the same imports" with "the same exports buy fewer imports". Candidates often invert the relationship.
Things to Be Careful About
- Read the index direction carefully: an increase from 100 to 120 is a 20% rise.
- Only statement 2 is correct – remember that option D means "2 only" not "2 and 3".
- For the balance of payments connection, recall the Marshall-Lerner condition or simply note that a change in relative prices does not guarantee the net trade balance moves in a particular direction; volumes matter too.
The table shows the number of Turkish lira (TRY) which can be exchanged for one US dollar (USD) in 2016 and 2021.
| date | exchange rate |
|---|---|
| July 2016 | 1 USD = 2.83 TRY |
| July 2021 | 1 USD = 8.15 TRY |
What is the most likely cause of the change in the price of Turkish lira between 2016 and 2021?
Options
A a sustained fall in the demand for Turkish imports
B a sustained fall in Turkish government debt as a percentage of GDP
C a sustained rise in Turkish interest rates
D a sustained rise in Turkish inflation
The Turkish lira depreciated from 2.83 TRY per USD to 8.15 TRY per USD between 2016 and 2021. A sustained rise in Turkish inflation relative to US inflation would reduce the purchasing power of the lira, increasing demand for foreign currency and decreasing demand for lira, causing depreciation. Options A, B, and C would all tend to strengthen the lira (appreciate it), not weaken it.
Answer
D
D
Background Concept
Exchange rates in a floating system are determined by the demand for and supply of a currency. If the demand for a currency falls or the supply rises, its price (exchange rate) depreciates. Inflation differentials are a key driver: a country with persistently higher inflation than its trading partners will see its currency depreciate because its goods become relatively more expensive, reducing demand for its exports and thus its currency. This is the purchasing power parity (PPP) theory in essence.
Understanding the Question
The table shows a sharp depreciation of the Turkish lira against the US dollar from 2016 to 2021. The question asks for the most likely cause among four options. We need to select the one that would cause a sustained fall in the value of the lira (i.e., a depreciation). The other options would tend to cause an appreciation, so they are incorrect.
Approach
Analyse each option in turn, using the demand-and-supply framework for the lira. A depreciation means either a leftward shift in demand for lira or a rightward shift in supply of lira. Identify which option would produce such shifts.
Step-by-Step Reasoning
-
Option A: a sustained fall in the demand for Turkish imports. This would reduce Turkish imports, meaning Turkey buys fewer foreign goods, so demand for foreign currency (USD) falls, and thus the supply of lira (to buy USD) falls. That would reduce the supply of lira, causing the lira to appreciate, not depreciate. So A is incorrect.
-
Option B: a sustained fall in Turkish government debt as a percentage of GDP. Improved fiscal health reduces risk premium, increasing foreign demand for Turkish assets and thus for lira, leading to appreciation. So B is incorrect.
-
Option C: a sustained rise in Turkish interest rates. Higher interest rates attract foreign capital inflows, increasing demand for lira, causing appreciation. So C is incorrect.
-
Option D: a sustained rise in Turkish inflation. Higher inflation erodes the purchasing power of the lira. Turkish goods become more expensive relative to foreign goods, reducing export demand and thus demand for lira. Also, Turkish consumers and firms may buy more imports, increasing supply of lira to buy foreign currency. Both effects push the lira down. This is consistent with the observed depreciation. D is correct.
Key Takeaways
- The exchange rate is determined by demand and supply of the currency.
- Higher inflation relative to trading partners is a classic cause of depreciation.
- Other factors like interest rates, debt, and import demand affect the exchange rate in predictable ways.
Common Mistakes
- Confusing the direction of the effect: e.g., thinking higher interest rates cause depreciation (they actually attract capital and cause appreciation).
- Not distinguishing between demand for imports and demand for the currency: a fall in import demand reduces supply of domestic currency, not demand for it.
Things to Be Careful About
- The question asks for the 'most likely' cause, so even if multiple factors could affect the exchange rate, only one is consistent with depreciation.
- Always consider the relative impact: inflation is a sustained, broad-based factor that matches the prolonged depreciation shown.
The table shows the current account of a balance of payments for January 2021.
| $m | |
|---|---|
| exports of goods | 15 000 |
| imports of goods | 17 000 |
| services | |
| credit | 2 500 |
| debit | 2 000 |
| primary income | |
| credit | 100 |
| debit | 1 000 |
| secondary income balance | 60 |
What is the current account balance?
Options
A a deficit of $2340m
B a deficit of $2000m
C a surplus of $2340m
D a surplus of $2000m
Working
Goods balance = exports of goods - imports of goods = 15 000 - 17 000 = -2 000 (deficit of $2000m)
Services balance = credit - debit = 2 500 - 2 000 = 500 (surplus of $500m)
Primary income balance = credit - debit = 100 - 1 000 = -900 (deficit of $900m)
Secondary income balance = +60 (given)
Current account balance = (-2 000) + 500 + (-900) + 60 = -2 340 (deficit of $2 340m)
Answer
A
A
Background Concept
The current account of the balance of payments records transactions in goods, services, primary income (investment income and compensation of employees) and secondary income (current transfers). Each component has credits (inflows) and debits (outflows). The balance for a component is credits minus debits. A positive net balance is a surplus, a negative is a deficit. The current account balance is the sum of all component net balances.
Understanding the Question
The table provides values for each component. We are asked to calculate the overall current account balance, choosing the correct option among four possibilities. The key is to correctly compute net balances for goods, services, and primary income, then add the secondary income balance as given.
Approach
Compute each component net balance:
- Goods: exports minus imports.
- Services: credit minus debit.
- Primary income: credit minus debit.
- Secondary income: already a net balance, so add directly.
Sum all net balances to get the current account balance. A negative result indicates a deficit.
Step-by-Step Reasoning
- Goods balance: Exports of goods = $15 000m, imports = $17 000m. Net = $15 000m - $17 000m = -$2 000m (deficit).
- Services balance: Credit = $2 500m, debit = $2 000m. Net = $2 500m - $2 000m = +$500m (surplus).
- Primary income balance: Credit = $100m, debit = $1 000m. Net = $100m - $1 000m = -$900m (deficit).
- Secondary income balance is given as $60m. The label "balance" suggests it is already net, so we treat it as +$60m.
- Sum: (-$2 000m) + $500m + (-$900m) + $60m = -$2 340m.
- The negative sign indicates a deficit of $2 340m. Option A states "a deficit of $2340m", matching our calculation.
Key Takeaways
- The current account is the sum of its four components.
- For goods, services, and primary income, compute net as credits minus debits.
- Secondary income is often presented as a net figure.
- A negative total is a deficit; a positive total is a surplus.
Common Mistakes
- Adding debits as positive: e.g., adding $1 000m instead of subtracting it as a debit, leading to a different total.
- Forgetting to include the secondary income balance.
- Misreading the table: the primary income debit is $1 000m and credit $100m; the net is -$900m, not -$1 100m or +$900m.
- Confusing surplus/deficit: the final sign must be interpreted correctly.
Things to Be Careful About
- Always subtract debits from credits for each component.
- Secondary income is labelled "balance", so it is already net; add it as given.
- Use the correct units: all figures in $m.
- Double-check arithmetic: -2000 + 500 = -1500; -1500 - 900 = -2400; -2400 + 60 = -2340.
- Option C is a surplus of $2340m, which would result from adding all positive and negative incorrectly; beware of sign errors.
Which policy would not be an argument for the use of import tariffs?
Options
A They are an effective way of raising revenue.
B They improve the balance of payments on a current account.
C They improve a nation's terms of trade in a bilateral agreement.
D They may lead to retaliation by trading partners.
Answer
D is the correct answer because the possibility of retaliation by trading partners is a cost or argument against the use of import tariffs, not a reason to impose them. Options A, B, and C are all arguments in favour of tariffs: they can raise revenue for the government (A), improve the current account of the balance of payments by reducing imports (B), and improve a nation's terms of trade if the country is large enough to influence world prices (C).
D
Background Concept
Import tariffs are taxes on imported goods. They are a form of protectionism used to shield domestic industries from foreign competition. Arguments for tariffs include: raising government revenue, protecting infant industries, improving the balance of payments by reducing imports, and potentially improving the terms of trade if the country has market power (i.e., it is a large buyer of the good). Arguments against tariffs include: higher prices for consumers, inefficiency, retaliation from trading partners, and the risk of trade wars.
Understanding the Question
The question asks: "Which policy would not be an argument for the use of import tariffs?" This means we must identify the option that is NOT a reason to support tariffs. The correct answer is the one that is a drawback or a cost of tariffs, not a benefit. The command word is "would not be an argument", so we need to select the option that is not a valid justification for imposing tariffs.
Approach
We evaluate each option in turn, determining whether it is a reason to use tariffs (an argument for) or a reason to avoid them (an argument against). Option D is clearly a negative consequence, so it is not an argument for; it is an argument against. Options A, B, and C are all positive outcomes that could be used to justify tariffs, though each has nuances.
Step-by-Step Reasoning
-
Option A: "They are an effective way of raising revenue." Tariffs generate revenue for the government because they are taxes on imports. This is a genuine argument for tariffs, especially in developing countries where other tax bases are weak. So A is an argument for.
-
Option B: "They improve the balance of payments on a current account." By reducing imports, tariffs can reduce the deficit on the current account (or increase the surplus). This is a common argument for tariffs, though it may be offset by retaliation. So B is an argument for.
-
Option C: "They improve a nation's terms of trade in a bilateral agreement." If a large country imposes a tariff, it can lower the world price paid for imports, improving the terms of trade (ratio of export prices to import prices). This is a theoretical argument for tariffs, though it is most effective when the country is a large importer. So C is an argument for.
-
Option D: "They may lead to retaliation by trading partners." Retaliation is a potential negative consequence of tariffs; it can lead to trade wars and reduce overall welfare. This is an argument against using tariffs, not a reason to use them. Therefore, D is not an argument for tariffs.
Thus, the correct answer is D.
Key Takeaways
- Arguments for tariffs include revenue, protection of domestic industries, balance of payments improvement, and terms of trade improvement (for large countries).
- Arguments against tariffs include higher consumer prices, inefficiency, and the risk of retaliation.
- The question tests the ability to distinguish between costs and benefits of a policy.
Common Mistakes
- Confusing arguments for and against: some students might think that retaliation is a reason to impose tariffs (e.g., to force others to lower tariffs), but the question asks for an argument for the use of tariffs, not a justification for retaliation.
- Overlooking the nuance of terms of trade: only large countries can improve their terms of trade with tariffs; small countries cannot. But the question does not specify the size of the country, so the possibility is still an argument.
Things to Be Careful About
- Read the question carefully: "not be an argument for" means the opposite of a pro-tariff argument.
- Understand that "improve the terms of trade" is a pro-tariff argument only if the country can influence world prices; otherwise it is not a valid argument. But the question treats it as a potential argument.
- Retaliation is a cost, not a benefit, so it is never an argument for tariffs.
Your score so far
Answer a question to start scoring
Your marks add up here as you work through the paper.