Economics 9708/22 — February/March 2024
Cambridge AS Level · AS Level Data Response and Essays · worked solutions for every part, with the mark scheme
Topics Economic Growth · Elasticities of Demand · Production Possibility Curves · Demand and Supply · Market Equilibrium and the Price Mechanism · Unemployment · +10 more
Artificial Intelligence
Artificial Intelligence (AI) is a form of technological progress. It involves computers or computer-controlled robots engaging in tasks usually performed by humans. Many businesses invest in AI to reduce their costs, to increase their efficiency by reducing human errors and to raise business revenues and profits.
The COVID-19 pandemic has accelerated this process – from increased use of contactless card payment systems to large-scale investment in driverless taxis. In China, a leading internet search company plans to follow some of its rivals in the United States (US) by starting a driverless taxi service in 100 cities by 2030.
Nevertheless, the pace of growth in AI has raised concerns that this will result in increased unemployment. One study suggests that up to 38% of US jobs are at risk from automation by the mid-2030s. To date, Japan has between 200 and 300 AI companies. It is also the leading supplier of industrial robots and third, behind China and the US, in spending on research and development into AI.
Just a few years ago, the growth of the internet created similar fears. Despite these concerns, the technology created millions of jobs and contributed as much as 10.5% towards US GDP in 2020. As a result, some economists suggest that the movement towards AI will fundamentally change the world and the way we work and live but will not lead to large rises in unemployment. AI technology may create more jobs than it destroys.
Nonetheless, the danger remains that automation will lead to a society of winners and losers. These newly created jobs will require new skills and significant investment in training young people and retraining adults. Therefore, governments may need to implement targeted policies to ensure that any changes to structural unemployment are only short-lived. However, rising national debt alongside projections of low economic growth, as shown in Table 1.1, may reduce the ability of governments to deliver such policies.
Table 1.1: Selected macroeconomic indicators for Japan and the US, 2020 to 2025
| Japan: Central government debt (% of GDP) | Japan: Unemployment rate (%) | Japan: Real GDP growth (% change from previous year) | US: Central government debt (% of GDP) | US: Unemployment rate (%) | US: Real GDP growth (% change from previous year) | |
|---|---|---|---|---|---|---|
| 2020 | 254.1 | 2.8 | -4.6 | 133.9 | 8.1 | -3.4 |
| 2021 | 256.9 | 2.8 | 2.4 | 133.3 | 5.4 | 6.0 |
| 2022* | 252.3 | 2.4 | 3.2 | 130.7 | 3.5 | 5.2 |
| 2023* | 250.8 | 2.3 | 1.4 | 131.1 | 3.0 | 2.2 |
| 2024* | 251.0 | 2.3 | 0.8 | 131.7 | 3.0 | 1.7 |
| 2025* | 251.3 | 2.3 | 0.6 | 132.5 | 3.1 | 1.7 |
*forecast
Source: IMF, 2021
Using the information in Table 1.1, compare the change in projected real GDP growth of Japan with that in the US between 2022 and 2025.
Answer
Both Japan and the US experienced positive real GDP growth from 2022 to 2025. However, both experienced a slowdown in the rate of growth. Over the period, Japan's average real GDP growth rate was 1.5%, while the US's was 2.7%, indicating that Japan's growth was slower than that of the US.
Both countries experienced positive but slowing growth; Japan's average growth rate (1.5%) was slower than the US's (2.7%).
Background Concept
Economic growth is measured by the percentage change in real GDP, which adjusts for inflation. Real GDP growth indicates the increase in the economy's output of goods and services. In this question, we compare the projected real GDP growth rates of Japan and the US from 2022 to 2025.
Understanding the Question
The question asks to compare the change in projected real GDP growth of Japan with that of the US between 2022 and 2025 using Table 1.1. This requires identifying the overall trend, any differences in the pattern, and providing a comparative statement. The data is forecast from the IMF.
Approach
Look at the real GDP growth rates for each country for each year. Identify the overall trend: both positive. Then note the direction: both are declining over the period. Then compare the magnitude: Japan's growth rates are lower than the US's each year. Calculate an average to support the comparison.
Step-by-Step Reasoning
From the table:
- Japan: 2022: 3.2%, 2023: 1.4%, 2024: 0.8%, 2025: 0.6%. All positive, but decreasing from 3.2% to 0.6%. Average = (3.2+1.4+0.8+0.6)/4 = 6.0/4 = 1.5%.
- US: 2022: 5.2%, 2023: 2.2%, 2024: 1.7%, 2025: 1.7%. All positive, decreasing from 5.2% to 1.7% but then constant. Average = (5.2+2.2+1.7+1.7)/4 = 10.8/4 = 2.7%.
Thus, both experience positive growth but a slowdown. Japan's average growth is lower than the US's, and Japan's growth consistently below the US's each year.
Key Takeaways
- Data comparison requires identifying trends, not just quoting numbers.
- Use averages to summarise when appropriate.
- Always relate the comparison to the specific question.
Common Mistakes
- Only stating the numbers without identifying the trend.
- Not comparing the two countries explicitly.
- Forgetting to mention the slowdown.
Things to Be Careful About
- Ensure you are using the correct rows (2022 to 2025) and the correct column (real GDP growth).
- Note that the data is forecast; the question does not require distinguishing actual from forecast.
With the help of a production possibility curve (PPC) diagram, demonstrate the likely impact of increased investment in AI on the Japanese economy in the long run.
Answer
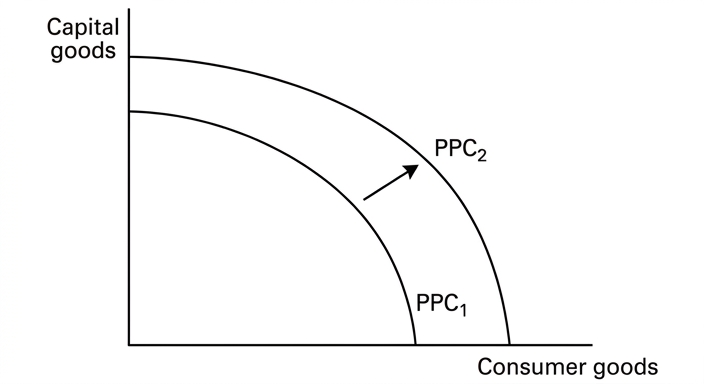
A correctly labelled production possibility curve (PPC) diagram. The axes are labelled with capital goods and consumer goods. The initial PPC is PPC1. Increased investment in AI increases the economy's productive capacity, shifting the PPC outward to PPC2, indicating that Japan can produce more of both goods in the long run.
Outward shift of PPC representing increased productive capacity.
Background Concept
A production possibility curve (PPC) shows the maximum combination of two goods an economy can produce given its resources and technology. An outward shift of the PPC represents economic growth – an increase in the economy's capacity to produce goods and services. Investment in capital goods, such as AI, is a key driver of long-run growth.
Understanding the Question
The question asks to demonstrate the likely impact of increased investment in AI on the Japanese economy in the long run, using a PPC diagram. This is a two-mark question, so the answer requires a correct diagram and a brief explanation of the shift.
Approach
Draw a PPC diagram with two representative goods (e.g., capital goods and consumer goods). Show an outward shift of the PPC to represent increased productive capacity due to AI investment. Label the axes and curves clearly.
Step-by-Step Reasoning
- Draw axes: vertical axis for capital goods, horizontal axis for consumer goods.
- Draw a concave curve (or straight line) from the vertical axis to the horizontal axis, labelled PPC1.
- AI investment increases the economy's stock of capital and improves technology, allowing more of both goods to be produced.
- Draw a new curve outward and to the right, labelled PPC2, showing that the economy can now produce more capital goods and more consumer goods.
- The shift indicates long-run economic growth.
Key Takeaways
- Investment in technology shifts the PPC outward, representing growth.
- A correctly labelled diagram is essential for marks.
- The PPC model illustrates opportunity cost and capacity.
Common Mistakes
- Drawing a shift inward or along the curve.
- Not labelling axes or curves.
- Confusing a movement along the curve with a shift.
Things to Be Careful About
- The diagram must be correctly labelled: axes, curves, and direction of shift.
- The explanation should link the shift to AI investment and increased productivity.
With the help of a demand and supply diagram, consider the impact of additional investment in AI on the price and output of a US carmaker.
Answer
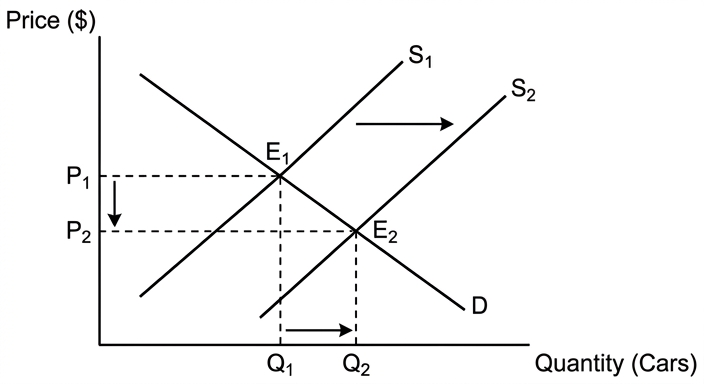
Additional investment in AI reduces the US carmaker's costs of production, increasing its supply. This shifts the supply curve to the right from S1 to S2. As a result, the equilibrium price decreases from P1 to P2, and the equilibrium quantity increases from Q1 to Q2. The demand curve remains unchanged.
Price decreases and output increases.
Background Concept
In a competitive market, the equilibrium price and quantity are determined by the intersection of demand and supply. A change in supply, caused by factors such as technology or input costs, shifts the supply curve, leading to a new equilibrium. A reduction in costs (due to AI) shifts the supply curve to the right, meaning more is supplied at each price.
Understanding the Question
The question asks to consider the impact of additional investment in AI on the price and output of a US carmaker, using a demand and supply diagram. This is a 4-mark question, so the diagram and explanation need to be clear. The carmaker is a specific firm, but we can use a market diagram for the firm's product.
Approach
Draw a standard demand and supply diagram for the carmaker's cars. Show the initial equilibrium. Then show the rightward shift of the supply curve due to AI reducing costs. Identify the new equilibrium price and quantity.
Step-by-Step Reasoning
- Draw axes: price on vertical axis, quantity on horizontal axis.
- Draw a downward-sloping demand curve (D) and an upward-sloping supply curve (S1). Label initial equilibrium at point E1, with price P1 and quantity Q1.
- AI investment reduces costs, so at each price, the firm is willing to supply more. The supply curve shifts right to S2.
- The new equilibrium is at E2, where S2 intersects D. Price falls to P2, quantity rises to Q2.
- Explain that the demand curve is unaffected because AI does not directly change consumer preferences.
Key Takeaways
- A cost reduction shifts the supply curve right, lowering price and raising output.
- The diagram must show the shift and the new equilibrium clearly.
- The explanation should link the shift to the specific cause (AI investment).
Common Mistakes
- Shifting the demand curve instead of supply.
- Not showing the shift in the correct direction.
- Forgetting to label axes and curves.
- Not explaining the change in price and quantity.
Things to Be Careful About
- Ensure the supply shift is to the right, not left.
- The demand curve is unchanged; do not shift it.
- The diagram should be clearly labelled with D, S1, S2, P1, P2, Q1, Q2, and equilibrium points.
Assess the possible impact on unemployment in Japan as a result of the increased investment in AI.
Answer
In the short run, increased investment in AI is likely to cause technological unemployment as AI replaces human labour. For example, the extract notes that up to 38% of US jobs are at risk from automation by the mid-2030s. This could lead to a rise in structural unemployment as workers' skills become obsolete, and may increase the overall unemployment rate, particularly in sectors like transport and manufacturing.
However, in the long run, AI may create new jobs, as seen with the internet which contributed 10.5% to US GDP and created millions of jobs. New jobs in AI development, maintenance, and other high-tech sectors could emerge. Additionally, the extract suggests that the movement towards AI may not lead to large rises in unemployment. Furthermore, government policies, such as retraining programmes, can help workers transition to new jobs, reducing the duration of unemployment.
Overall, the impact on Japan's unemployment is uncertain. The net effect depends on the pace of job creation relative to job destruction, and on the effectiveness of government policies. Given Japan's low unemployment rate (around 2.3% in 2022-2025), the impact may be manageable, but structural unemployment could persist in the short run. Therefore, while AI will cause some job losses, it is unlikely to cause a large, sustained rise in unemployment in Japan, provided appropriate retraining policies are implemented.
AI is likely to cause short-run technological unemployment but may create new jobs in the long run; the net impact on Japan's unemployment is likely to be small if retraining policies are effective.
Background Concept
Unemployment refers to the number of people actively seeking work but unable to find a job. Technological unemployment occurs when labour is replaced by machines or automation. Structural unemployment arises from a mismatch between workers' skills and job requirements. In the long run, technological progress can create new industries and jobs, as seen historically with the internet.
Understanding the Question
The question asks to assess the possible impact on unemployment in Japan as a result of increased investment in AI. This is a 6-mark evaluative question, so it requires both negative and positive effects, and a justified conclusion. The extract provides information about jobs at risk and the internet's job creation.
Approach
First, discuss the short-run negative impact: AI replaces jobs, leading to structural unemployment. Use the extract's statistic about 38% of US jobs at risk to illustrate. Second, discuss the long-run positive impact: AI creates new jobs, as the internet did. Use the extract's example of the internet contributing 10.5% to US GDP. Third, consider the role of government policies (retraining). Finally, reach a conclusion weighing the two sides.
Step-by-Step Reasoning
- Short-run losses: AI automates tasks, especially routine ones, leading to job losses in sectors like transport (driverless taxis), manufacturing, and administration. The extract mentions up to 38% of US jobs at risk, and Japan is also a leader in AI. This could increase structural unemployment as workers lack the skills for new jobs.
- Long-run gains: Historically, technological progress creates new jobs. The extract notes that the internet created millions of jobs. AI will create jobs in AI development, data analysis, maintenance, and other high-tech fields. These jobs require new skills, but the overall number of jobs may increase.
- Government policies: The extract mentions the need for targeted policies to retrain workers. If governments invest in education and training, the transition may be smoother, reducing the duration of unemployment.
- Conclusion: The net effect depends on the speed of adjustment. Given Japan's low baseline unemployment (2.3%), the impact may be limited. However, structural unemployment could rise temporarily. Overall, it is unlikely to cause a large, sustained increase in unemployment.
Key Takeaways
- Technological change can both destroy and create jobs.
- Evaluation requires considering short-run and long-run effects.
- Use extract data to support arguments.
- A justified conclusion is essential for full marks.
Common Mistakes
- Only discussing job losses (one-sided).
- Not using the extract's data.
- Failing to conclude or giving a vague conclusion.
- Ignoring the role of government policies.
Things to Be Careful About
- Distinguish between short-run and long-run.
- Use specific examples from the extract.
- Ensure the conclusion is justified and addresses the specific case of Japan.
Assess the likely impact of the growth of AI on the specialisation and trade of a country such as Japan.
Answer
The growth of AI can enhance Japan's specialisation and trade. AI improves productivity and reduces costs, making Japanese goods more competitive in international markets. This could strengthen Japan's comparative advantage in high-tech industries, such as industrial robots, leading to increased exports and improved terms of trade. For example, Japan is a leading supplier of industrial robots, and AI could further boost its exports of advanced machinery.
However, there are potential drawbacks. Over-specialisation in AI-related industries could make Japan vulnerable to shifts in global demand or technological changes. It could also lead to structural unemployment in other sectors, as the extract notes job losses. Additionally, reliance on AI may increase the risk of trade conflicts or protectionism from trading partners, which could reduce trade volumes.
Overall, the impact on Japan's specialisation and trade is likely to be positive in the long run, as AI enhances its comparative advantage and boosts exports. However, the benefits depend on successful retraining and diversification to avoid over-specialisation. Japan should pursue a balanced approach to maximise gains from trade.
AI is likely to enhance Japan's comparative advantage and boost trade, but risks of over-specialisation and protectionism need to be managed.
Background Concept
Specialisation allows countries to focus on producing goods where they have a comparative advantage, leading to gains from trade. Comparative advantage arises when a country can produce a good at a lower opportunity cost than another. Technological progress, such as AI, can change a country's comparative advantage by improving productivity in certain industries.
Understanding the Question
The question asks to assess the likely impact of the growth of AI on the specialisation and trade of a country such as Japan. This is a 6-mark evaluative question, so it requires both positive and negative impacts, and a justified conclusion. The extract provides information about Japan's role in AI and industrial robots.
Approach
First, discuss the positive impacts: AI improves productivity, reduces costs, and enhances Japan's comparative advantage in high-tech industries, leading to increased exports and trade. Use the example of Japan as a leading supplier of industrial robots. Second, discuss the negative impacts: risk of over-specialisation, vulnerability to demand changes, structural unemployment, and potential protectionism. Finally, reach a conclusion weighing the net effect.
Step-by-Step Reasoning
- Positive impacts: AI increases productivity in Japanese firms, reducing costs and improving quality. This strengthens Japan's comparative advantage in capital-intensive, high-tech goods. Japan can specialise more in these goods and export them, earning foreign exchange and improving the terms of trade (export prices rise relative to import prices). The extract notes Japan is a leading supplier of industrial robots, so AI can further boost this sector.
- Negative impacts: Over-specialisation in AI-related industries makes Japan vulnerable to shifts in global demand for these goods. If technology changes or demand falls, Japan could face a sharp decline in exports and increased unemployment. Also, the growth of AI may lead to protectionist responses from other countries, reducing trade. The extract mentions that the danger of winners and losers and the need for retraining.
- Conclusion: The net impact is likely positive, as Japan has a strong base in AI and can capitalise on its comparative advantage. However, the government should implement policies to diversify the economy and retrain workers to mitigate risks of over-specialisation.
Key Takeaways
- Technological change can alter comparative advantage.
- Specialisation can lead to gains from trade but also risks.
- Evaluation requires weighing benefits against potential costs.
- Use extract information to support the analysis.
Common Mistakes
- Only discussing benefits (one-sided).
- Not linking to the specific country (Japan).
- Failing to consider the role of government policy.
- Not providing a justified conclusion.
Things to Be Careful About
- Distinguish between short-run and long-run effects.
- Use specific examples from the extract, such as Japan's leadership in industrial robots.
- Ensure the conclusion answers the question directly.
With the help of a demand and supply diagram, explain how the introduction of an indirect tax affects equilibrium in a market and consider the extent to which the incidence of the tax will fall on the consumer.
Answer
An indirect tax is a tax levied on expenditure on a good, such as VAT or an excise duty. It is imposed on producers, shifting the supply curve vertically upwards by the amount of the tax.
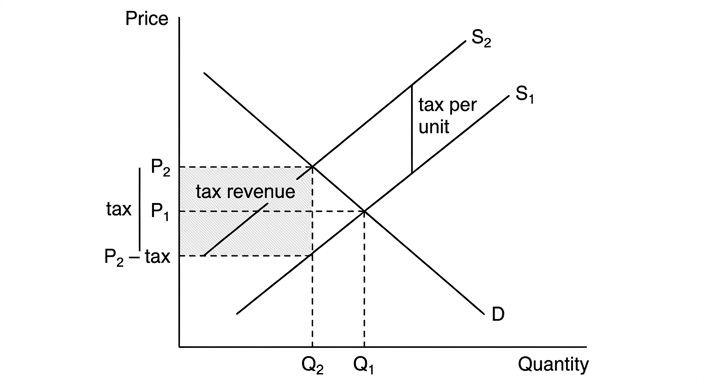
In the diagram, the initial equilibrium is at price P1 and quantity Q1, where demand D and supply S1 intersect. The introduction of an indirect tax shifts the supply curve leftwards from S1 to S2 (by the amount of the tax per unit). The new equilibrium is at a higher price P2 and a lower quantity Q2. The price paid by consumers rises from P1 to P2, while the price received by producers falls to P2 minus the tax. The difference between the consumer price and producer price is the tax revenue per unit.
The incidence of the tax on consumers depends on the price elasticity of demand (PED). If demand is price inelastic (PED < 1), consumers bear a larger proportion of the tax because they are less responsive to price changes, so the price rises significantly. If demand is price elastic (PED > 1), producers bear more of the tax as consumers reduce quantity demanded sharply, limiting the price increase. Therefore, the extent to which the tax falls on the consumer is greater when demand is inelastic.
The incidence of the tax on consumers depends on the price elasticity of demand; the more inelastic the demand, the greater the proportion of the tax passed on to consumers.
Background Concept
An indirect tax is a tax on expenditure, such as VAT or excise duty. It is imposed on producers, who then may pass some or all of the tax onto consumers through higher prices. The incidence of the tax refers to the distribution of the tax burden between consumers and producers. The price elasticity of demand (PED) determines how much of the tax is passed on. If demand is inelastic, consumers bear more; if elastic, producers bear more.
Understanding the Question
The question asks you to use a demand and supply diagram to explain the effect of an indirect tax on market equilibrium. It then asks you to consider the extent to which the tax falls on the consumer. This is a two-part question: first, explain the mechanism (AO1/AO2), then evaluate (AO3). The command word "consider the extent" requires a judgement based on PED.
Approach
First, draw a standard demand and supply diagram. Show the initial equilibrium. Then shift the supply curve leftwards by the amount of the tax. Identify the new equilibrium price and quantity. Explain that the price rises and quantity falls. Then discuss incidence: the burden on consumers depends on PED. Use the concept of elasticity to explain that the more inelastic the demand, the greater the price rise and thus the greater the consumer burden. Conclude that the extent varies with PED.
Step-by-Step Reasoning
- Define indirect tax: a tax on spending, e.g., VAT, excise duty.
- Draw diagram: axes labelled Price and Quantity. Demand curve D downward sloping. Supply curve S1 upward sloping. Equilibrium at P1, Q1.
- Tax shifts supply: The tax is a cost to producers, so supply decreases. The supply curve shifts vertically upward by the amount of the tax to S2. The vertical distance between S1 and S2 is the tax per unit.
- New equilibrium: Intersection of D and S2 gives higher price P2 and lower quantity Q2.
- Consumer price: P2. Producer price: P2 minus tax. The difference is the tax revenue per unit.
- Incidence: The burden on consumers is the increase in price from P1 to P2. The burden on producers is the decrease in price they receive from P1 to (P2 - tax). The total tax revenue is the sum of both burdens.
- Role of PED: If demand is price inelastic (PED < 1), consumers are less responsive to price changes, so the price rises significantly, and consumers bear a larger share. If demand is elastic (PED > 1), consumers reduce quantity demanded sharply, limiting the price increase, so producers bear more.
- Conclusion: The extent to which the tax falls on the consumer depends on the price elasticity of demand. The more inelastic the demand, the greater the consumer incidence.
Key Takeaways
- Indirect taxes shift supply left, raising price and lowering quantity.
- Tax incidence is shared between consumers and producers.
- Price elasticity of demand is the key determinant of the distribution of the tax burden.
- A diagram is essential to illustrate the effect.
Common Mistakes
- Drawing the shift incorrectly (e.g., shifting demand instead of supply).
- Not labelling axes or curves.
- Forgetting to explain the diagram in words.
- Stating that the entire tax is passed on without considering elasticity.
- Not providing a conclusion for the evaluation part.
Things to Be Careful About
- Ensure the supply shift is vertical and parallel.
- Label the tax amount clearly.
- Use the correct terminology: "incidence" not "impact".
- In the evaluation, explicitly link the extent to PED.
- The conclusion should be a judgement, not just a restatement.
Assess whether the improved provision of information is likely to be the best method to reduce the consumption of demerit goods.
Introduction
Demerit goods are goods that are over-consumed because consumers have imperfect information about their negative effects, such as cigarettes and alcohol. Improved provision of information aims to correct this by making consumers aware of the true private and social costs, thereby reducing demand.
How improved information can reduce consumption
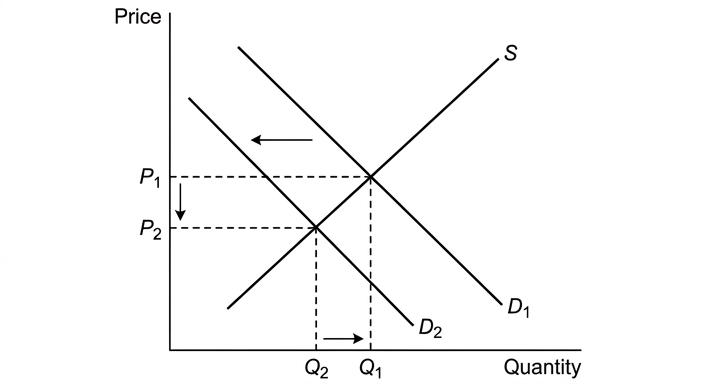
Improved information, such as health warnings or public awareness campaigns, shifts the demand curve for the demerit good to the left, from D1 to D2, as consumers reduce their willingness to pay. This leads to a lower equilibrium quantity consumed, from Q1 to Q2, and a lower price, from P1 to P2. The reduction in consumption moves the market closer to the socially optimal level.
Limitations of information provision
However, the effectiveness of information is limited. Many demerit goods are addictive, so consumers may continue to consume despite knowing the risks. Habitual behaviour and peer pressure can also override rational decision-making. Moreover, consumers may suffer from present bias, valuing immediate gratification over future harm. Therefore, the demand shift may be small, and the reduction in consumption insufficient.
Alternative policies
Other methods can be more effective. Taxation, such as an indirect tax, increases the price and reduces quantity demanded. The impact depends on price elasticity of demand; for inelastic demand, tax may be more effective in raising revenue than reducing consumption. Minimum prices set above the equilibrium can also reduce consumption by making the good more expensive. Regulation, such as banning advertising or restricting sales, can directly limit availability and is often effective for addictive goods.
Evaluation
The 'best' method depends on the specific demerit good and the objectives. Information provision is low-cost and respects consumer choice, but may be insufficient for addictive goods. Taxation and minimum prices are more direct but can be regressive and may create black markets. Regulation can be effective but may be costly to enforce. A combination of policies is often most effective. For example, information campaigns combined with taxation can reinforce each other.
Conclusion
Improved provision of information is unlikely to be the best method on its own for reducing consumption of demerit goods, especially those that are addictive. However, it is a valuable component of a broader policy mix. The most effective approach depends on the specific good and the elasticity of demand, but generally, a combination of information, taxation, and regulation yields the best results.
Improved provision of information is not the best method alone; a combination of policies is usually more effective, but information is a useful complement.
Background Concept
Demerit goods are goods that are over-consumed because consumers underestimate the negative externalities or private costs, often due to imperfect information. Examples include cigarettes, alcohol, and gambling. Government intervention aims to reduce consumption to a socially optimal level. Methods include information provision, taxation, regulation, and minimum prices. Each has strengths and weaknesses.
Understanding the Question
The question asks you to assess whether improved provision of information is likely to be the best method to reduce consumption of demerit goods. "Assess" requires a balanced evaluation and a justified conclusion. You need to analyse how information works, its limitations, and compare it with alternative policies. The top band requires detailed knowledge, developed analysis, and a reasoned conclusion.
Approach
First, explain what improved information means and how it can reduce consumption (shift demand left). Then discuss limitations: addiction, habit, peer pressure, irrationality. Then present alternative policies: taxation, minimum prices, regulation. For each, explain how they work and their pros and cons. Finally, evaluate which is best, considering effectiveness, cost, and side effects. Conclude that information alone is often insufficient, and a combination is usually best.
Step-by-Step Reasoning
- Define demerit goods and the market failure: over-consumption due to imperfect information.
- Improved information: campaigns, labels, education. This shifts the demand curve left as consumers become aware of true costs. Diagram: demand shifts from D1 to D2, price and quantity fall.
- Limitations: Addictive nature means demand may be inelastic; habitual behaviour; peer pressure; present bias. So the shift may be small.
- Alternative policies:
- Taxation: indirect tax shifts supply left, raising price and reducing quantity. Effective if demand is elastic. Can be regressive.
- Minimum price: sets a floor above equilibrium, reduces quantity. Can be effective but may lead to black markets.
- Regulation: bans, age restrictions, advertising bans. Directly limits availability but costly to enforce.
- Evaluation: Compare effectiveness. For addictive goods, taxation and regulation may be more effective than information. Information is low-cost and respects choice but may not change behaviour. The best method depends on the good and context. Often a mix is best.
- Conclusion: Improved information is unlikely to be the best method alone; a combination of policies is more effective.
Key Takeaways
- Demerit goods are over-consumed due to imperfect information.
- Information provision can reduce demand but has limitations.
- Alternative policies like taxation and regulation are more direct.
- The best policy depends on the specific good and its demand elasticity.
- A multi-pronged approach is often most effective.
Common Mistakes
- Only discussing one side (e.g., only benefits of information).
- Not evaluating the alternatives in depth.
- Providing a conclusion that is vague or not justified.
- Forgetting to use economic concepts like elasticity.
- Not addressing the "best" criterion.
Things to Be Careful About
- Ensure you compare policies on the same criteria (effectiveness, cost, side effects).
- Use examples of demerit goods to support your points.
- The conclusion must be a clear judgement, not a summary.
- Avoid being one-sided; give balanced analysis.
- Use diagrams where appropriate to illustrate shifts.
With the help of a formula, explain the meaning of income elasticity of demand and consider the extent to which a rise in income will increase the consumption of all goods and services.
Answer
AO1 Knowledge and understanding
Income elasticity of demand (YED) measures the responsiveness of quantity demanded of a good to a change in consumer income. The formula is:
YED = % change in quantity demanded / % change in income
Goods are classified as normal (YED > 0) or inferior (YED < 0).
AO2 Analysis
For a normal good, a rise in income leads to an increase in consumption. For example, if YED = +0.5, a 10% rise in income causes a 5% rise in quantity demanded. This positive relationship holds for most goods, especially luxuries (YED > 1) and necessities (0 < YED < 1).
AO3 Evaluation
However, not all goods experience increased consumption. Inferior goods have negative YED; as income rises, consumers switch to superior alternatives, reducing demand for inferior goods (e.g., bus travel replaced by car ownership). Therefore, a rise in income increases consumption of normal goods but decreases consumption of inferior goods. The statement is only partially correct; it holds for normal goods but not for inferior goods.
A rise in income increases consumption of normal goods but decreases consumption of inferior goods, so the statement is only partially correct.
Background Concept
Income elasticity of demand (YED) is a measure of how sensitive the quantity demanded of a good is to changes in consumer income. It is calculated as the percentage change in quantity demanded divided by the percentage change in income. The sign of YED determines whether a good is normal (positive) or inferior (negative). Normal goods can be further divided into necessities (0 < YED < 1) and luxuries (YED > 1). Inferior goods have negative YED, meaning demand falls as income rises.
Understanding the Question
The question asks you to explain the meaning of YED using the formula, and then consider whether a rise in income will increase consumption of all goods and services. The command word "explain" requires definition and formula (AO1) and analysis (AO2). The phrase "consider the extent to which" introduces evaluation (AO3): you must recognise that the effect depends on the type of good. The mark scheme allocates 3 marks for AO1, 3 for AO2, and 2 for AO3.
Approach
Start by defining YED and giving the formula. Then explain that for normal goods, YED is positive, so a rise in income increases consumption. Provide an example. Then introduce the counter-case: inferior goods have negative YED, so consumption falls. Conclude that the statement is not universally true.
Step-by-Step Reasoning
- Definition and formula: YED = (% change in quantity demanded) / (% change in income). This is the core knowledge.
- Normal goods: If YED > 0, the good is normal. For example, if YED = 0.8, a 10% income rise leads to an 8% increase in demand. This shows that for normal goods, consumption rises with income.
- Inferior goods: If YED < 0, the good is inferior. For example, if YED = -0.5, a 10% income rise leads to a 5% fall in demand. Consumers switch to better alternatives.
- Evaluation: The statement "a rise in income will increase the consumption of all goods and services" is false because it ignores inferior goods. A justified conclusion states that the effect depends on the type of good; for normal goods it is true, for inferior goods it is false.
Key Takeaways
- YED measures responsiveness of demand to income changes.
- Normal goods have positive YED; inferior goods have negative YED.
- A rise in income increases demand for normal goods but decreases demand for inferior goods.
- Always consider both sides when evaluating a general statement.
Common Mistakes
- Forgetting to include the formula (costs AO1 marks).
- Only discussing normal goods and ignoring inferior goods (loses AO3 marks).
- Not providing an example (weakens analysis).
- Concluding without a clear judgement (loses the second AO3 mark).
Things to Be Careful About
- Use the correct formula and sign.
- Clearly distinguish between normal and inferior goods.
- Ensure the conclusion directly addresses the statement.
- Keep the answer concise; this is an 8-mark question, not an essay.
Assess whether an estimate of the price elasticity of demand for a product is likely to be more useful to a firm than an estimate of its price elasticity of supply.
Introduction
Price elasticity of demand (PED) measures the responsiveness of quantity demanded to a change in price, while price elasticity of supply (PES) measures the responsiveness of quantity supplied to a change in price. Both estimates can inform firm decision-making, but their relative usefulness depends on the context. This essay assesses whether PED is more useful than PES for a firm.
The usefulness of PED estimates
PED is crucial for pricing decisions. If demand is price elastic (PED > 1), a price reduction increases total revenue, while a price increase reduces revenue. If demand is inelastic (PED < 1), a price increase raises revenue. For example, a firm selling a luxury good with elastic demand can use a low-price strategy to boost sales and revenue. PED also helps in forecasting the impact of competitors' price changes and in setting optimal prices for profit maximisation (where MR = MC). However, PED estimates have limitations: they assume ceteris paribus, ignoring changes in income, tastes, or prices of related goods. Moreover, PED can vary along the demand curve and over time, reducing the reliability of a single estimate.
The usefulness of PES estimates
PES is important for production planning. If supply is elastic (PES > 1), the firm can quickly increase output in response to a price rise, capturing additional revenue. If supply is inelastic (PES < 1), the firm may face constraints such as limited capacity or time. For example, a manufacturer with spare capacity and flexible production can respond to a surge in demand by increasing output, whereas a firm with fixed capacity cannot. PES estimates help firms decide whether to invest in extra capacity, hold inventories, or outsource production. However, PES is often short-term; in the long run, supply becomes more elastic as firms adjust. Also, PES estimates may not account for input price changes or regulatory constraints.
Evaluation
Both PED and PES provide valuable but different information. PED is more directly relevant to revenue and pricing strategy, which are central to profitability. PES is more relevant to operational flexibility and cost management. The relative usefulness depends on the firm's objectives: a firm focused on short-term revenue maximisation may find PED more useful, while a firm concerned with production capacity and supply chain resilience may prioritise PES. Additionally, the accuracy of both estimates is limited by the ceteris paribus assumption and data quality. In practice, firms use both together: PED to set price and PES to ensure they can meet the resulting demand.
Conclusion
While PED is often considered more directly useful for pricing and revenue decisions, PES is equally important for ensuring the firm can respond to market changes. Neither estimate is inherently more useful; their value depends on the specific decision context. Therefore, a firm should use both estimates in conjunction rather than relying on one alone.
Neither PED nor PES is inherently more useful; their relative usefulness depends on the firm's objectives and the decision context. Both estimates are valuable and should be used together.
Background Concept
Price elasticity of demand (PED) = % change in quantity demanded / % change in price. It indicates how sensitive consumers are to price changes. Price elasticity of supply (PES) = % change in quantity supplied / % change in price. It indicates how easily producers can change output in response to price changes. Both are important for firm decision-making.
Understanding the Question
The question asks you to assess whether an estimate of PED is likely to be more useful to a firm than an estimate of PES. The command word "assess" requires a balanced evaluation and a justified conclusion. The mark scheme uses level descriptors: AO1+AO2 out of 8, AO3 out of 4. The top band requires detailed knowledge, developed analysis, and a justified conclusion with well-supported evaluative comments.
Approach
First, define both terms and explain how each estimate can be useful. Then discuss limitations of each. Then evaluate which is more useful, considering different contexts (e.g., pricing vs. production decisions). Finally, reach a reasoned conclusion that addresses the question directly.
Step-by-Step Reasoning
- Define PED and PES: Provide formulas and brief explanation.
- Usefulness of PED: Explain how PED affects total revenue; give examples (elastic vs inelastic demand). Mention use in pricing strategy, tax incidence, and marketing.
- Limitations of PED: Ceteris paribus, variation over time, difficulty in estimation, ignores costs.
- Usefulness of PES: Explain how PES affects ability to respond to price changes; give examples (spare capacity, time period). Mention use in production planning, inventory management, investment decisions.
- Limitations of PES: Short-run vs long-run, cost of increasing elasticity, external constraints.
- Evaluation: Compare the two. PED is more directly linked to revenue, but PES is crucial for operational feasibility. The usefulness depends on the firm's primary goal (profit maximisation vs. growth vs. stability). Also note that both are needed for comprehensive decision-making.
- Conclusion: Neither is universally more useful; they complement each other. A firm should use both.
Key Takeaways
- PED and PES are both important for different aspects of firm decision-making.
- PED is key for pricing and revenue; PES is key for production and supply response.
- Both have limitations; estimates should be used with caution.
- A balanced evaluation leads to a nuanced conclusion.
Common Mistakes
- Only discussing one elasticity (one-sided answer loses AO3 marks).
- Not defining the terms clearly (loses AO1 marks).
- Providing superficial analysis without development (stays in lower band).
- Failing to reach a conclusion or giving a vague conclusion (loses AO3 marks).
- Ignoring the comparative aspect (the question asks which is "more useful").
Things to Be Careful About
- Ensure the essay is well-structured with clear paragraphs.
- Use examples to support points.
- Explicitly compare the two elasticities.
- The conclusion must be justified, not just a summary.
- Avoid overgeneralisation; acknowledge that usefulness depends on context.
Explain what is meant by a depreciation of the exchange rate and consider whether a depreciation is likely to increase domestic real output.
Answer
A depreciation of the exchange rate is a fall in the value of a currency in a floating exchange rate system, meaning it buys less foreign currency. For example, if the exchange rate falls from £1 = $1.50 to £1 = $1.20, the pound has depreciated. This occurs when the demand for the currency falls (e.g., due to lower interest rates or reduced export demand) or the supply of the currency increases (e.g., due to increased imports or capital outflows).
A depreciation makes exports cheaper in foreign currency and imports more expensive in domestic currency. This tends to increase the quantity of exports demanded and reduce the quantity of imports demanded, improving net exports (X-M). Since net exports are a component of aggregate demand (AD = C+I+G+(X-M)), an increase in net exports shifts the AD curve to the right. If the economy is operating below full capacity, this increase in AD will lead to an increase in real output (real GDP) as firms increase production to meet higher demand.
However, whether a depreciation actually increases real output depends on several factors. First, the Marshall-Lerner condition states that the current account will improve only if the sum of the price elasticities of demand for exports and imports is greater than one. If demand is inelastic, the value of imports may rise initially (J-curve effect). Second, if the economy is already at full capacity, the increase in AD will mainly cause inflation rather than an increase in real output. Third, the effect may be offset by cost-push inflation if imported raw materials become more expensive. Therefore, while a depreciation can increase real output under favourable conditions, it is not guaranteed.
A depreciation can increase real output if there is spare capacity and if demand for traded goods is sufficiently elastic, but it is not certain.
Background Concept
The exchange rate is the price of one currency in terms of another. In a floating system, it is determined by demand and supply of the currency. A depreciation means the currency loses value, so it buys less foreign currency. This affects international trade: exports become cheaper for foreigners, imports become more expensive for domestic residents. The impact on the economy depends on the price elasticities of demand for exports and imports (Marshall-Lerner condition) and the state of the economy (spare capacity). Aggregate demand (AD) consists of consumption, investment, government spending, and net exports (X-M). A change in net exports shifts AD, affecting real output and the price level.
Understanding the Question
The question asks to explain what a depreciation is and then consider whether it is likely to increase domestic real output. The command word 'explain' requires a clear definition and causes. 'Consider' indicates evaluation: we need to weigh the conditions under which the effect holds. The mark scheme allocates 3 marks for knowledge (definition, causes), 3 for analysis (chain of reasoning from depreciation to output), and 2 for evaluation (conditions, conclusion). So the answer must include both the positive chain and the limitations.
Approach
First, define depreciation and explain how it occurs (fall in demand or rise in supply of the currency). Then, build the chain: depreciation -> exports cheaper, imports dearer -> net exports rise -> AD rises -> real output rises (if spare capacity). Then, evaluate: consider the Marshall-Lerner condition, J-curve effect, spare capacity, cost-push inflation from imported inputs. Conclude with a balanced judgement.
Step-by-Step Reasoning
-
Definition: Depreciation is a fall in the value of a currency in a floating exchange rate system. It means the currency buys less foreign currency. For example, if the pound falls from $1.50 to $1.20, it has depreciated. This can happen due to decreased demand for the currency (e.g., lower interest rates, lower export demand) or increased supply (e.g., more imports, capital outflows).
-
Analysis: A depreciation makes exports cheaper in foreign currency terms, so foreign demand for exports rises. Imports become more expensive in domestic currency, so domestic demand for imports falls. Thus, net exports (X-M) increase. Since net exports are part of AD, AD shifts right. If the economy is below full capacity, firms respond to higher demand by increasing output, so real GDP rises. This is the standard Keynesian transmission mechanism.
-
Evaluation: However, the effect is not automatic. First, the Marshall-Lerner condition: the current account improves only if the sum of PED for exports and imports > 1. If demand is inelastic, the value of imports may rise initially (J-curve effect). Second, if the economy is at full capacity, the increase in AD causes inflation rather than output growth. Third, depreciation raises the cost of imported raw materials, shifting SRAS left, which may reduce output. Fourth, the effect may be offset by other policies or expectations. Therefore, a depreciation is likely to increase real output only under specific conditions: spare capacity and elastic demand.
-
Conclusion: While a depreciation can boost output, it is not guaranteed; the outcome depends on elasticities and the macroeconomic context.
Key Takeaways
- Depreciation is a fall in the currency's value in a floating system.
- It can improve net exports and increase AD, raising output if spare capacity exists.
- The Marshall-Lerner condition and J-curve effect are crucial.
- Evaluation requires considering elasticities, capacity, and supply-side effects.
Common Mistakes
- Confusing depreciation with devaluation (devaluation is in a fixed system).
- Ignoring the Marshall-Lerner condition and assuming depreciation always improves the current account.
- Forgetting to mention the J-curve effect.
- Not considering the supply-side impact of higher import costs.
- Giving a one-sided answer without evaluation.
Things to Be Careful About
- Use correct terminology: depreciation vs. devaluation.
- Clearly state the chain of reasoning: depreciation -> relative prices -> net exports -> AD -> output.
- In evaluation, mention both the conditions for success and the potential negative effects.
- Provide a justified conclusion, not just a list of factors.
Assess whether contractionary fiscal policy is likely to be the best way to reduce a current account deficit on the balance of payments.
Introduction
Contractionary fiscal policy involves reducing government spending or increasing taxes to decrease aggregate demand (AD). A current account deficit occurs when the value of imports exceeds the value of exports. This essay assesses whether contractionary fiscal policy is the best way to reduce such a deficit.
How contractionary fiscal policy might reduce a current account deficit
Contractionary fiscal policy shifts the AD curve leftwards. Lower AD reduces national income, which reduces the demand for imports (since imports are a positive function of income). This directly improves the current account balance. Additionally, lower AD reduces demand-pull inflationary pressure, improving the international price competitiveness of domestic goods, which may boost exports. Thus, both the income effect and the price effect work to reduce the deficit.
Limitations of this approach
However, contractionary fiscal policy also reduces real output and increases unemployment, which may be politically and economically costly. The improvement in the current account may be small if the marginal propensity to import is low. Moreover, the policy suffers from time lags: implementation lags (budget changes take time) and impact lags (the multiplier process takes time). If the deficit is structural (e.g., due to poor competitiveness), demand management alone is insufficient. Additionally, if the economy is already in recession, contractionary policy would worsen the downturn.
Alternative policies
Monetary policy can be used: raising interest rates attracts capital inflows, appreciating the currency, which worsens the current account; lowering interest rates may depreciate the currency, improving competitiveness, but risks inflation. Supply-side policies (e.g., improving education, infrastructure, R&D) enhance long-run competitiveness and address structural causes, but take time to work. Protectionist measures like tariffs or quotas can directly reduce imports, but risk retaliation and inefficiency.
Evaluation
The best policy depends on the cause of the deficit. If it is due to excess demand, contractionary fiscal policy is appropriate and effective. If due to structural issues, supply-side policies are more suitable. Fiscal policy has the advantage of directly reducing imports via income, but its negative impact on growth is a serious concern. A combination of policies may be optimal: fiscal consolidation to reduce demand pressure, coupled with supply-side reforms to boost competitiveness. The state of the economy also matters: if the economy is below full capacity, contractionary fiscal policy is counterproductive.
Conclusion
Contractionary fiscal policy is not always the best way to reduce a current account deficit. Its effectiveness depends on the cause of the deficit and the trade-off with domestic objectives. A tailored mix of policies is likely to be superior.
Contractionary fiscal policy is not always the best way; its effectiveness depends on the cause of the deficit and the trade-off with domestic objectives.
Background Concept
Fiscal policy involves changes in government spending and taxation to influence aggregate demand. Contractionary fiscal policy (reducing spending or increasing taxes) reduces AD. The current account of the balance of payments records trade in goods and services, primary income, and secondary income. A deficit means imports exceed exports. Policies to reduce a deficit can be expenditure-reducing (reduce AD to cut imports) or expenditure-switching (make domestic goods more attractive). Contractionary fiscal policy is expenditure-reducing. Alternative policies include monetary policy (interest rates, money supply), supply-side policies (improve productivity, competitiveness), and protectionism (tariffs, quotas). The best policy depends on the cause of the deficit and the trade-offs with other objectives like growth and employment.
Understanding the Question
The question asks to assess whether contractionary fiscal policy is likely to be the best way to reduce a current account deficit. 'Assess' requires a balanced evaluation and a justified conclusion. The mark scheme is levels-based: top band requires detailed knowledge, developed analysis, and a justified conclusion with well-supported evaluative comments. The indicative content includes understanding fiscal policy and current account deficit, how contractionary fiscal policy might work (reduce imports via lower income, reduce inflation to improve competitiveness), limitations (impact on growth, unemployment), and alternative policies. The evaluation should consider relative effectiveness and arrive at a reasoned conclusion.
Approach
First, define key terms: contractionary fiscal policy, current account deficit. Then, explain the mechanism: lower AD reduces income, reducing import demand; also, lower inflation improves competitiveness. Then, discuss limitations: negative impact on output and employment, time lags, structural deficits. Then, present alternative policies: monetary policy (interest rates, exchange rate effects), supply-side policies (long-term competitiveness), protectionism (direct but risky). Evaluate each alternative relative to fiscal policy. Finally, conclude by stating that the best policy depends on the cause and context, and that a mix may be optimal.
Step-by-Step Reasoning
-
Knowledge: Contractionary fiscal policy: increase taxes or cut government spending. This reduces disposable income and AD. Current account deficit: imports > exports. The deficit can be caused by high domestic demand, lack of competitiveness, or structural factors.
-
Analysis of fiscal policy: Lower AD reduces national income. Since imports are a function of income (M = mY), a fall in Y reduces M, improving the current account. Additionally, lower demand reduces demand-pull inflation, making domestic goods more price-competitive, potentially increasing exports. In the AD/AS model, a leftward shift of AD lowers the price level, which may improve the real exchange rate.
-
Limitations: The reduction in AD also reduces output and increases unemployment, conflicting with other objectives. The effect on imports depends on the marginal propensity to import; if it is low, the improvement is small. There are time lags: implementation lag (budget changes take time) and impact lag (multiplier process). If the deficit is due to structural factors (e.g., poor productivity, low-quality goods), demand management alone will not solve it. Also, if other countries retaliate or if the exchange rate adjusts, the effect may be offset.
-
Alternative policies:
- Monetary policy: Raising interest rates attracts capital inflows, appreciating the currency, which worsens the current account. Lowering interest rates may depreciate the currency, improving competitiveness, but may fuel inflation. So monetary policy has conflicting effects.
- Supply-side policies: Improve productivity, innovation, infrastructure, education. These enhance long-run competitiveness, addressing the root cause. However, they take time and may not help in the short run.
- Protectionism: Tariffs, quotas directly reduce imports. But they risk retaliation, inefficiency, and higher prices for consumers. They may violate trade agreements.
-
Evaluation: The best policy depends on the diagnosis. If the deficit is due to excess demand (e.g., booming economy), contractionary fiscal policy is appropriate and effective. If due to structural issues, supply-side policies are better. Fiscal policy has the advantage of directly reducing imports via income, but its cost in terms of output and employment is high. A combination: fiscal consolidation to reduce demand pressure, plus supply-side reforms to boost competitiveness, may be best. Also, the policy must consider the state of the economy: if the economy is already in recession, contractionary fiscal policy would worsen it.
-
Conclusion: Contractionary fiscal policy is not always the best; its suitability depends on the cause of the deficit and the macroeconomic context. A tailored approach is likely superior.
Key Takeaways
- Contractionary fiscal policy reduces AD, lowering imports and inflation, which can improve the current account.
- It has negative side effects on output and employment.
- Alternative policies include monetary, supply-side, and protectionist measures.
- The best policy depends on the cause of the deficit and the trade-offs.
- A justified conclusion must weigh these factors.
Common Mistakes
- One-sided answer: only discussing how fiscal policy works without considering limitations or alternatives.
- Not providing a conclusion or providing a vague conclusion.
- Confusing fiscal policy with monetary policy.
- Ignoring the impact on domestic objectives like growth and unemployment.
- Not using economic theory (AD/AS, multiplier, elasticities) to support analysis.
Things to Be Careful About
- Clearly define terms at the start.
- Use the AD/AS model to illustrate the effects.
- In evaluation, compare policies on criteria like effectiveness, speed, side effects.
- Ensure the conclusion is justified and specific to the question.
- Avoid making absolute statements; use conditional language.
With the help of an aggregate demand and aggregate supply diagram, explain how a decrease in interest rates could cause economic growth and consider whether economic growth will always result in inflation.
Answer
Definitions: Economic growth is an increase in the real GDP of an economy. Inflation is a sustained increase in the general price level. Interest rates are the cost of borrowing or the reward for saving.
Diagram: A decrease in interest rates reduces the cost of borrowing and discourages saving. This increases consumption (C) and investment (I). It may also cause a depreciation of the exchange rate, boosting net exports (X-M). As a result, aggregate demand (AD) increases, shifting the AD curve to the right.
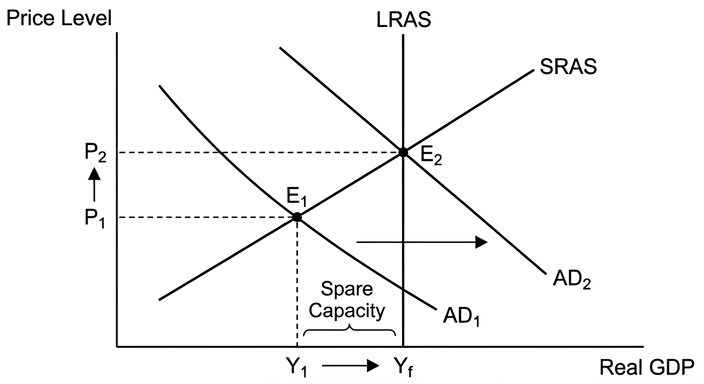
In the diagram, the economy moves from E1 to E2, with real GDP rising from Y1 to Y2 (economic growth) and the price level rising from P1 to P2.
Consideration of whether growth always results in inflation: The rise in the price level indicates demand-pull inflation. However, if the economy has spare capacity (i.e., is operating below full employment), the SRAS curve is relatively flat, and the increase in AD may cause growth with little or no inflation. Moreover, if the lower interest rates stimulate investment in capital goods, this can increase the economy's productive capacity, shifting LRAS to the right, which reduces inflationary pressure over time. Therefore, economic growth does not always result in inflation; it depends on the state of the economy and the nature of the growth.
Conclusion: While a decrease in interest rates can cause inflation when the economy is near full capacity, growth achieved through supply-side improvements or from a recessionary gap may occur without significant inflation. Hence, the claim that economic growth always results in inflation is not justified.
Economic growth does not always result in inflation; it depends on whether the economy has spare capacity and whether the growth is driven by supply-side factors.
Background Concept
This question draws on the AD/AS model, which is the core framework for analysing short-run fluctuations in real GDP and the price level. Aggregate demand (AD) is the total planned spending on goods and services in an economy, composed of consumption (C), investment (I), government spending (G), and net exports (X-M). The AD curve slopes downward due to the real balance effect, the interest rate effect, and the international trade effect. Aggregate supply (AS) in the short run (SRAS) is upward-sloping because firms adjust output as the price level changes, given sticky wages and prices. In the long run, the LRAS is vertical at the economy's potential output, determined by the availability of factors of production and technology.
Monetary policy, specifically changes in interest rates, affects AD by influencing the cost of borrowing and the incentive to save. A decrease in interest rates makes borrowing cheaper, encouraging consumption and investment; it also reduces the return on savings, further boosting spending. Additionally, lower interest rates tend to depreciate the domestic currency, making exports cheaper and imports more expensive, thereby increasing net exports. This combined effect shifts the AD curve to the right.
Economic growth in the short run is shown as an increase in real GDP along the SRAS curve. In the long run, growth can also result from a rightward shift of the LRAS, increasing potential output. Inflation is a sustained rise in the general price level; demand-pull inflation occurs when AD increases beyond the economy's capacity to produce.
Understanding the Question
The question has two parts: (1) explain how a decrease in interest rates could cause economic growth, using an AD/AS diagram; (2) consider whether economic growth will always result in inflation. The command word "explain" requires a clear chain of reasoning, while "consider" introduces an evaluative element—you must discuss the conditions under which growth may or may not lead to inflation. The question is worth 8 marks, split as 3 for AO1 (knowledge and understanding), 3 for AO2 (analysis), and 2 for AO3 (evaluation). The diagram is explicitly required, and without it, marks are capped. The evaluation must include a justified conclusion.
Approach
Start by defining the key terms: economic growth, inflation, and interest rates. Then draw an AD/AS diagram showing the initial equilibrium and the shift of AD caused by the interest rate cut. Explain the components of AD that change and why. Use the diagram to show the new equilibrium with higher real GDP (growth) and a higher price level (inflation). For the evaluation, consider two scenarios: one where the economy has spare capacity (so growth occurs without inflation) and one where the economy is near full capacity (so inflation results). Also consider the possibility that the lower interest rates stimulate investment that increases LRAS, providing a supply-side source of growth that is less inflationary. Conclude that growth does not always cause inflation—it depends on the state of the economy and the type of investment.
Step-by-Step Reasoning
- Definitions: Define economic growth as an increase in real GDP, inflation as a sustained rise in the general price level, and interest rates as the cost of borrowing.
- Mechanism: A decrease in interest rates reduces the cost of borrowing, so consumers and firms are more willing to borrow and spend. Consumption and investment rise. Additionally, lower interest rates may lead to a depreciation of the currency, boosting exports and reducing imports, so net exports rise. All three components (C, I, X-M) are parts of AD, so AD increases.
- Diagram: Draw the AD/AS diagram. Label axes: Price Level on the vertical, Real GDP on the horizontal. Draw an upward-sloping SRAS, a vertical LRAS at potential output Yf, and an initial AD curve AD1. Mark equilibrium E1 at intersection of AD1 and SRAS, with price level P1 and real GDP Y1. Then draw a new AD curve AD2 to the right of AD1. The new equilibrium E2 is at the intersection of AD2 and SRAS, with price level P2 and real GDP Y2. Y2 > Y1 shows economic growth; P2 > P1 shows inflation. Explain this clearly.
- Evaluation: The inflation shown in the diagram is demand-pull inflation. However, if the economy is operating below full capacity (Y1 < Yf), the SRAS curve is relatively flat. In that case, the same rightward shift of AD causes a large increase in real GDP but a very small increase in the price level. Growth can occur with little or no inflation. Also, the decrease in interest rates may encourage investment in capital goods, which increases the economy's productive capacity. This shifts LRAS to the right, allowing growth without inflation and even potentially reducing the price level if the shift is large enough. Therefore, the statement that economic growth always results in inflation is false. The conclusion must state that it depends on spare capacity and the source of growth.
Key Takeaways
- The AD/AS model is the primary tool for analysing the effects of monetary policy on output and prices.
- A decrease in interest rates is expansionary, shifting AD right and potentially causing both growth and inflation.
- The actual outcome depends on the slope of SRAS (spare capacity) and whether LRAS shifts.
- Evaluation requires identifying conditions that modify the simple relationship.
Common Mistakes
- Omitting the diagram or drawing it without labels (axes, curves, equilibrium points).
- Confusing a movement along the AD curve with a shift of the AD curve.
- Stating that lower interest rates automatically cause inflation without considering the state of the economy.
- Providing a one-sided evaluation or no conclusion.
Things to Be Careful About
- Always label the axes: Price Level and Real GDP.
- Show the direction of the shift clearly (AD to the right).
- Explain the chain of reasoning: interest rate decrease → borrowing/ saving → C, I, X-M → AD shift → new equilibrium.
- In the evaluation, explicitly mention spare capacity and supply-side effects. End with a clear, justified conclusion.
Introduction
Economic growth, defined as an increase in an economy's real GDP over time, is often seen as a primary macroeconomic objective. However, its desirability must be assessed by considering both its benefits and its costs.
Benefits of Economic Growth
Economic growth raises average incomes, leading to higher living standards and improved welfare. It reduces unemployment as firms hire more workers to meet increased demand. Government finances improve through higher tax revenues and lower welfare spending, allowing more investment in public services. Growth also fosters innovation and international competitiveness, and it can fund improvements in healthcare and education, increasing life expectancy and human capital.
Costs of Economic Growth
Growth can bring demand-pull inflation if the economy is near full capacity. It may worsen the current account deficit if growth is consumption-led and imports rise faster than exports. Growth can also increase income and wealth inequality, as the benefits may accrue disproportionately to the rich. Environmental costs include pollution, depletion of natural resources, and loss of biodiversity, which reduce long-term sustainability. Additionally, growth may be associated with negative externalities such as congestion and stress, reducing well-being.
Evaluation
The desirability of economic growth depends on its composition, distribution, and sustainability. Growth that is achieved through investment in technology and education and that is accompanied by redistributive policies can reduce inequality and environmental damage. Sustainable growth that respects environmental limits can improve well-being in the long run. However, growth that is driven by unsustainable consumption, worsens inequality, and degrades the environment may be undesirable. The net benefit of growth also depends on the initial conditions: a developing country may benefit greatly from growth, while a high-income country may face diminishing returns to well-being.
Conclusion
Economic growth is not always desirable. Its desirability hinges on the specific characteristics of the growth: whether it is sustainable, inclusive, and improves overall well-being beyond mere GDP. In many cases, growth brings substantial benefits, but when it generates high inflation, trade deficits, inequality, and environmental harm, it may be less desirable. Policymakers must manage growth to maximise net benefits.
Economic growth is not always desirable; its desirability depends on whether the growth is sustainable, inclusive, and improves well-being, and whether the costs outweigh the benefits.
Background Concept
Economic growth is a central macroeconomic objective, measured as the percentage increase in real GDP over a period. The benefits of growth are often assumed to be self-evident: higher incomes, more jobs, and better public services. However, growth has costs that can reduce welfare, including inflation, inequality, environmental damage, and balance of payments problems. The question asks whether economic growth is always desirable, which requires a critical evaluation of these trade-offs. The concept of sustainable development introduces the idea that growth should not compromise the ability of future generations to meet their needs. Similarly, inclusive growth considers whether the benefits are widely shared.
Understanding the Question
The command word "assess" requires you to weigh both sides of the argument and reach a reasoned conclusion. The question is worth 12 marks, with AO1+AO2 out of 8 and AO3 out of 4. The top band for AO1/AO2 requires detailed knowledge, developed explanations, and a well-organised response. The top band for AO3 requires a justified conclusion with developed evaluative comments. The question says "always", so you must argue that growth is not always desirable—you need to identify conditions under which the costs outweigh the benefits.
Approach
Structure your essay with an introduction, then separate sections for the benefits and costs. In the evaluation section, weigh the arguments against each other using criteria such as sustainability, equity, and well-being. Conclude by stating that growth is not always desirable, but it can be beneficial if managed properly. Use examples to support your points (e.g., China's rapid growth vs. its environmental costs, or Scandinavian countries with strong growth and low inequality).
Step-by-Step Reasoning
- Introduction: Define economic growth and state that the answer is not straightforward—growth can be both beneficial and harmful.
- Benefits: Explain each benefit in turn: higher incomes → higher consumption possibilities; lower unemployment → higher output and less welfare spending; higher tax revenues → better public services; innovation → higher productivity; etc. Develop each link fully.
- Costs: Explain each cost: inflation → erodes purchasing power; current account deficit → unsustainable borrowing; inequality → social tensions; environmental degradation → external costs; negative externalities → reduced well-being. Develop each link.
- Evaluation: Use criteria to weigh the sides. For example, if growth is achieved through investment in renewable energy, it may be both sustainable and inclusive. If growth is driven by consumer debt and imports, it may be short-lived and harmful. The net effect depends on the specific policies and initial conditions. Conclude that growth is not always desirable, but intelligent policy can make it more so.
- Conclusion: Restate the main judgement and justify it.
Key Takeaways
- Economic growth has both benefits and costs; it is not an unqualified good.
- Evaluation requires a balanced consideration of multiple dimensions: economic, social, environmental.
- A justified conclusion must go beyond listing pros and cons; it must weigh them and reach a verdict.
- The word "always" in the question signals that you should find counterexamples or conditions.
Common Mistakes
- Writing a one-sided answer (only benefits or only costs) → loses all evaluation marks.
- Failing to provide a conclusion or providing a vague conclusion.
- Listing points without developing the reasoning (e.g., "growth causes inflation" without explaining why).
- Ignoring the question's focus on "desirability" and instead just describing types of growth.
Things to Be Careful About
- Ensure your evaluation is developed, not just a sentence. Use economic reasoning and examples.
- The conclusion must be justified, not just a summary.
- Keep the response focused on the question: do not discuss unrelated topics like trade policy or fiscal policy in detail unless directly relevant to the desirability of growth.
- Use appropriate economic terminology throughout.