Economics 9708/12 — February/March 2024
Cambridge AS Level · AS Level Multiple Choice · answer key with instant marking and worked solutions
Topics Balance of Payments · Fiscal Policy · Scarcity, Choice and Opportunity Cost · Classification of Goods and Services · Demand and Supply · Elasticities of Demand · +17 more
Tap an option under each question to check it — your score builds as you go.
Why does a production possibility curve exist for every economy?
Options
A Resources are unlimited.
B Resources have alternative uses.
C Some resources can be imported.
D Some resources may be unemployed.
Answer
A production possibility curve (PPC) exists because resources are scarce and have alternative uses. Scarcity means that an economy cannot produce everything it wants; it must choose among different combinations of goods. The PPC shows the maximum possible output of two goods given available resources and technology. The fact that resources can be allocated to produce different goods (alternative uses) is what creates the trade-off that the PPC illustrates. Thus, option B is correct.
B
Background Concept
A production possibility curve (PPC) is a model that shows the maximum combinations of two goods or services an economy can produce when all its resources are fully and efficiently employed. It is a fundamental tool in economics because it illustrates scarcity, choice, and opportunity cost. The PPC is drawn as a downward-sloping curve (or straight line) because to produce more of one good, the economy must give up some of the other good; that sacrifice is the opportunity cost. The curve exists only because resources are limited and can be shifted between uses.
Understanding the Question
The question asks: "Why does a production possibility curve exist for every economy?" It is a multiple‑choice question with four options. The key is to identify the economic condition that makes a PPC meaningful. The PPC is not about the level of imports, the state of unemployment, or the assumption of unlimited resources; it is fundamentally about the need to make choices because resources are finite and can be used in different ways.
Approach
Read each option and evaluate whether it provides a necessary condition for the existence of a PPC. Consider whether the condition is true in all economies and whether it directly explains why we can draw a curve of production possibilities. Eliminate options that are false, irrelevant, or incomplete.
Step-by-Step Reasoning
-
Option A: "Resources are unlimited." If resources were truly unlimited, an economy could produce any quantity of any good without sacrificing any other good — there would be no trade‑off, no scarcity, and therefore no need for a PPC. This statement is false, and it contradicts the foundation of economics. Eliminate A.
-
Option B: "Resources have alternative uses." This is correct. A PPC is drawn by considering that the same resources (land, labour, capital, enterprise) can be used to produce different goods. If resources could only produce one thing, no substitution would be possible and the PPC would collapse to a single point. Because resources can be shifted between uses, the economy faces trade‑offs, and the PPC captures those trade‑offs. This is the direct reason the curve exists.
-
Option C: "Some resources can be imported." The existence of a PPC is about an economy’s domestic production possibilities, not about what can be obtained through trade. Imports affect what the economy can consume, but the PPC itself exists regardless of international trade. Even in a closed economy with no imports, a PPC would exist. Thus this is not the reason.
-
Option D: "Some resources may be unemployed." Unemployment would place the economy inside the PPC (or at a point inside the curve), but it does not explain why the curve itself exists. The PPC is defined for full employment and efficient production; unemployment shifts the actual output point but the curve remains. Therefore, this is not the fundamental reason.
Thus, only option B correctly identifies the essential condition that gives rise to a PPC.
Key Takeaways
- A production possibility curve is a central model for understanding scarcity and choice. It exists because resources are scarce and can be used in alternative ways.
- The curve itself does not depend on whether resources are fully employed, whether trade occurs, or whether resources are unlimited — it depends solely on scarcity and the possibility of substitution.
- Recognising the reason behind a model helps in applying it correctly to real‑world scenarios.
Common Mistakes
- Choosing option A: thinking that limited resources are the same as unlimited resources — this is a fundamental error.
- Choosing option C: confusing the domestic PPC with the consumption possibilities from trade.
- Choosing option D: believing that unemployment creates the need for a PPC; actually, unemployment is a separate issue about position inside the curve.
Things to Be Careful About
- Always focus on the specific condition that makes the model necessary: scarcity and alternative uses of resources.
- Do not let other economic concepts (trade, unemployment) distract from the core reason.
- Remember that the PPC is a tool to illustrate choices — without alternative uses, there would be no choice to illustrate.
Which statement is a normative statement?
Options
A Aggregate demand will increase following a decrease in interest rates.
B A rise in unemployment will decrease inflationary pressures.
C The incentive to work will rise if benefit payments are reduced.
D Unsustainable economic growth is more harmful to the economy than hyperinflation.
Working
Positive statements are objective and can be tested against facts. Normative statements are subjective and express a value judgement or opinion about what ought to be.
- A: 'Aggregate demand will increase following a decrease in interest rates' – this is a testable prediction, therefore positive.
- B: 'A rise in unemployment will decrease inflationary pressures' – also a testable causal claim, positive.
- C: 'The incentive to work will rise if benefit payments are reduced' – testable, positive.
- D: 'Unsustainable economic growth is more harmful to the economy than hyperinflation' – this makes a judgement about which is 'more harmful', a value judgement that cannot be tested objectively. It is a normative statement.
Answer
D
D
Background Concept
In economics, statements are classified as positive or normative. Positive statements are factual and can be tested against evidence – they describe 'what is'. For example, 'A rise in the price of petrol leads to a fall in the quantity demanded' can be tested by looking at data. Normative statements are value judgements – they express opinions about 'what ought to be' and cannot be proven true or false by evidence. They often contain words like 'should', 'ought', 'better', 'worse', 'more harmful', 'fair', 'unfair'.
Understanding the Question
This question asks you to pick which of the four statements is a normative statement. The key is to look for a statement that expresses a value judgement rather than a testable claim. Each option makes a claim about an economic relationship or outcome. You need to identify which one cannot be verified by data because it involves an opinion.
Approach
First, recall the definition of a normative statement. Then read each option and decide whether it could in principle be tested by looking at real-world data. If it can, it is positive. If it expresses a personal or societal opinion about what is desirable or harmful, it is normative. Option D directly compares two economic problems and says one is 'more harmful' – this is a value judgement because harm is subjective.
Step-by-Step Reasoning
- Option A: 'Aggregate demand will increase following a decrease in interest rates.' This is a causal claim that can be tested by observing the effect of interest rate changes on aggregate demand. It is positive.
- Option B: 'A rise in unemployment will decrease inflationary pressures.' This is a testable hypothesis (Phillips curve relationship). It is positive.
- Option C: 'The incentive to work will rise if benefit payments are reduced.' This can be tested by examining labour supply responses to changes in benefits. It is positive.
- Option D: 'Unsustainable economic growth is more harmful to the economy than hyperinflation.' The word 'harmful' implies a value judgement. Different people may have different opinions about which is worse – some might argue that hyperinflation destroys savings and is more damaging, others might focus on the long-term effects of unsustainable growth. There is no objective test to decide which is 'more harmful'. Therefore, it is normative.
Key Takeaways
- Normative statements contain value judgements and cannot be tested using facts.
- Positive statements are testable, even if they are false or difficult to measure.
- Look for opinion words ('should', 'ought', 'better', 'worse', 'harmful', 'fair') to identify normative statements.
Common Mistakes
- Confusing a statement that is false with a normative statement. Even a false positive statement is still positive because it is testable.
- Thinking that any statement about 'harm' is automatically normative – but 'harm' can be defined in a testable way if it is measured objectively (e.g., loss of output). However, in this question, the comparison is subjective.
- Choosing a statement that sounds like a policy recommendation but is actually a testable prediction (e.g., 'cutting taxes will increase growth' is positive).
Things to Be Careful About
- Read each option carefully. The question is not asking which statement is true, but which is normative.
- Remember that positive statements can be wrong – they are still positive because they are about facts.
- In economics, many statements in textbooks are positive, but questions often include a normative one to test this distinction.
Which combination best describes the basic economic problem?
Options
| resources | wants | |
|---|---|---|
| A | limited | limited |
| B | limited | unlimited |
| C | unlimited | limited |
| D | unlimited | unlimited |
Reason
The basic economic problem arises because resources (land, labour, capital, enterprise) are finite, while human wants for goods and services are infinite. This scarcity forces choices about how to allocate resources. Hence the correct combination is limited resources and unlimited wants.
Answer
B
B
Background Concept
The fundamental economic problem, also known as the problem of scarcity, is the central concept in economics. It stems from the observation that the resources available to produce goods and services are limited (scarce), while human wants – the desire to consume goods and services – are unlimited. Because of this mismatch, societies must make choices about what to produce, how to produce it, and for whom to produce it. Every economy, regardless of its system, faces this basic problem.
Understanding the Question
The question directly asks: 'Which combination best describes the basic economic problem?' The table presents four combinations of 'resources' and 'wants' with the words 'limited' or 'unlimited'. To answer correctly, you must recall the precise definition: it is the tension between limited (scarce) resources and unlimited wants. Option B presents exactly this.
Approach
This is a simple recall question. There is no calculation or diagram needed. The approach is to remember the core definition of economics and identify which row in the table matches it. It may help to think about common examples: there is only so much oil, land, time, etc., but we always want more goods, services, leisure, etc.
Step-by-Step Reasoning
- Define the basic economic problem: the condition where finite resources are insufficient to satisfy all human wants, which are infinite.
- Look at the table:
- Row A: limited resources, limited wants. This is incorrect because wants are not limited; they are unlimited.
- Row B: limited resources, unlimited wants. This matches the definition.
- Row C: unlimited resources, limited wants. This is incorrect because resources are finite, not unlimited.
- Row D: unlimited resources, unlimited wants. This is incorrect because resources are not unlimited; if resources also were unlimited, there would be no problem.
- Therefore, the only combination that correctly describes the basic economic problem is option B.
Key Takeaways
- The basic economic problem is the scarcity of resources relative to unlimited wants.
- Scarcity forces choices and trade-offs at all levels: individuals, firms, and governments.
- Understanding this concept is foundational to all economic analysis.
Common Mistakes
- Confusing 'unlimited' and 'limited' – some students incorrectly think wants are also limited or that resources are unlimited. Always remember: resources are finite, wants are infinite.
- Misreading the table – ensure you correctly match the labels 'resources' and 'wants' to their descriptions.
Things to Be Careful About
- The question uses the word 'limited' and 'unlimited' in a specific, binary way. In economics, 'scarcity' means the general condition of limited resources, not that there is a shortage of every single resource at every moment. But for this question, the basic definition is sufficient.
- Do not overthink – it is a straightforward recall question testing the starting point of the entire subject.
What is the main reason an economy is unlikely to rely completely on market forces to allocate resources?
Options
A Demerit goods will be over supplied.
B Merit goods will be under supplied.
C Private goods will not be supplied.
D Public goods will not be supplied.
Reasoning
Public goods are non-rival and non-excludable, leading to the free-rider problem: individuals cannot be excluded from consumption, so they have no incentive to pay, and private firms cannot profitably supply such goods. In contrast, merit goods are under-supplied but still supplied by the market, demerit goods are over-supplied but supplied, and private goods are efficiently supplied. Therefore, the fundamental reason an economy cannot rely completely on market forces is that public goods will not be supplied.
Answer
D
D
Background Concept
In economics, goods are classified by their characteristics of rivalry and excludability. Private goods are both rival (one person's consumption reduces availability for others) and excludable (people can be prevented from consuming if they don't pay). Markets work well for private goods because firms can charge a price and consumers reveal their preferences. Public goods are non-rival (consumption by one does not reduce availability for others) and non-excludable (impossible or very costly to prevent anyone from consuming). This leads to the free-rider problem: individuals can enjoy the good without paying, so private firms cannot profitably supply it. Merit goods are under-consumed because people underestimate their private benefits; demerit goods are over-consumed because people underestimate private costs. But in both cases, the market does supply some quantity.
Understanding the Question
The question asks: "What is the main reason an economy is unlikely to rely completely on market forces to allocate resources?" The four options each describe a potential market failure related to different types of goods. The key word is 'completely' – if a market fails to supply certain goods altogether, then complete reliance is impossible. The correct answer is D: public goods will not be supplied, because their characteristics prevent any market provision.
Approach
To identify the main reason, we compare the severity of market failure for each good type:
- For private goods (option C), markets work well, so this is not a reason.
- For merit goods (option B), markets under-supply but still supply some; government may subsidise but the market still allocates resources.
- For demerit goods (option A), markets over-supply but still supply; government may tax.
- For public goods (option D), markets supply none at all.
Since complete reliance on markets would leave entire categories of goods missing, public goods are the most fundamental barrier.
Step-by-Step Reasoning
- Define public goods: non-rival and non-excludable. Example: national defence, street lighting, clean air.
- Explain the free-rider problem: individuals have no incentive to pay because they can consume without contributing. Firms cannot charge a price, so they do not produce.
- Therefore, if an economy relies solely on market forces, public goods will not be provided at all. This means the market allocation of resources is incomplete.
- Now consider merit goods: e.g., education, healthcare. These are rival and excludable, but consumers may have imperfect information about their long-term benefits, leading to under-consumption. However, firms can and do supply education and healthcare privately. The market failure is one of quantity, not existence.
- Demerit goods: e.g., cigarettes, alcohol. Consumers over-estimate benefits, leading to over-consumption. Again, firms supply them. Market failure is over-allocation.
- Private goods: efficiently allocated by markets in competitive conditions.
- Conclusion: The most fundamental reason why an economy cannot rely completely on market forces is that public goods will not be supplied at all, making D the correct answer.
Key Takeaways
- Public goods are a pure market failure: zero private provision.
- The free-rider problem is the core concept.
- Merit/demerit goods are market failures of degree, not of complete non-provision.
- When a question asks for the 'main' reason, look for the most severe or fundamental failure.
Common Mistakes
- Choosing B or A: students often think of merit and demerit goods as typical examples of market failure, but they forget that these goods are still supplied by markets. The question specifically asks for the main reason that makes complete reliance impossible.
- Confusing public goods with merit goods: e.g., thinking that education is a public good when it is actually a merit good (rival and excludable).
- Not reading the word 'completely' – if the question had been about reasons for government intervention generally, B or A could be acceptable, but 'completely' points to the most extreme failure.
Things to Be Careful About
- Be precise about the characteristics: non-rival and non-excludable are both necessary for a pure public good.
- Some goods can be quasi-public or have degrees of excludability, but the textbook definitions apply.
- In the context of this question, 'unlikely to rely completely' means there must be some goods that the market fails to allocate at all.
What is the opportunity cost to a person of spending $20 on a new pair of sports shoes?
Options
A all the other things the person could have bought
B the cost of getting to the sports shop
C the current value of the person’s old pair of shoes
D the next best thing that could have been bought with the $20
Opportunity cost is the value of the next best alternative forgone when a choice is made. Spending $20 on shoes means the person cannot spend that $20 on something else. The next best alternative that could have been bought with the $20 is the opportunity cost. Option D correctly states this.
Answer
D
D
Background Concept
Opportunity cost is a fundamental concept in economics that arises from scarcity. Because resources (including money) are limited, choosing to use them one way means giving up the next best alternative use. The opportunity cost is not all alternatives (option A) but specifically the single next best alternative that is sacrificed. It is a forward-looking concept, not about past costs or the cost of acquiring the item (options B and C).
Understanding the Question
This question tests the precise definition of opportunity cost in the context of a personal spending decision. The person has $20 and chooses to spend it on shoes. The question asks: what is the opportunity cost of that decision? The command word is "What is" — a simple definition/identification question. The answer must match the standard economic definition.
Approach
Identify the key elements of the opportunity cost definition: (1) the next best alternative, (2) that is forgone, (3) because of the choice made. Evaluate each option against this definition. Option D is the only one that matches exactly.
Step-by-Step Reasoning
- Opportunity cost is defined as the value of the next best alternative forgone when a choice is made.
- The person has $20 and chooses to spend it on shoes. The money cannot be used for anything else.
- The opportunity cost is the specific alternative that was the next best use of that $20 — the thing the person would have bought if they had not bought the shoes.
- Option A says "all the other things" — this is too broad; opportunity cost is only the next best alternative, not all alternatives.
- Option B says "the cost of getting to the sports shop" — this is a separate cost of acquiring the shoes, not the opportunity cost of the spending decision itself.
- Option C says "the current value of the old pair of shoes" — this is irrelevant; opportunity cost is about the forgone alternative, not the value of what is being replaced.
- Option D says "the next best thing that could have been bought with the $20" — this exactly matches the definition.
Thus, D is correct.
Key Takeaways
- Opportunity cost is always the next best alternative forgone, not all alternatives.
- It is a forward-looking concept, not about past costs or sunk costs.
- In multiple-choice questions, watch for distractors that broaden the definition (all alternatives) or confuse with other costs (transport, replacement value).
Common Mistakes
- Choosing A because it seems to encompass many alternatives, but opportunity cost is specifically the next best, not all.
- Confusing opportunity cost with the cost of acquiring the item (transport, time) or the value of the item replaced.
Things to Be Careful About
- Always read the full definition: the next best alternative forgone.
- In MCQs, all options except one are specifically designed to test common misunderstandings. Distinguish between "all other things" and "the next best thing".
What is the definition of effective demand?
Options
A demand that is speculative
B demand that is supported by the ability to pay
C the relationship between price and quantity demanded
D the total amount demanded by consumers
Answer
Effective demand is the quantity of a good or service that consumers are willing and able to purchase at a given price over a given period. Option B correctly captures this: 'demand that is supported by the ability to pay'. Options A, C and D are incorrect because they refer to speculative demand, the general demand relationship, or total quantity demanded without the condition of ability to pay.
Answer: B
B
Background Concept
In economics, demand is not merely a desire or a want; it must be backed by the ability to pay. This is called effective demand. A consumer may wish to buy a luxury car, but unless they have the income or wealth to actually purchase it, that wish does not constitute effective demand. The concept is fundamental to understanding how markets work: firms produce goods for which there is effective demand, and the price mechanism allocates resources accordingly.
Understanding the Question
This question asks for the definition of effective demand. The four options present different ideas: (A) speculative demand (like buying in anticipation of price changes), (B) demand supported by ability to pay, (C) the relationship between price and quantity demanded (which is more like the demand curve), and (D) the total amount demanded by consumers (which is aggregate demand, but without the condition of ability to pay). The correct definition is the one that includes both willingness and ability to pay.
Approach
Read each option carefully and cross-check against the standard definition. The key element in effective demand is that the demand is backed by purchasing power. Option B explicitly states this. The others either miss the ability to pay or refer to different concepts.
Step-by-Step Reasoning
- Recall the definition of effective demand: it is the quantity of a good that consumers are willing and able to purchase at a given price.
- Option A: 'demand that is speculative' – this is not a standard definition; speculative demand refers to buying in anticipation of future price changes, which is a specific type of demand, not the general definition.
- Option B: 'demand that is supported by the ability to pay' – this matches the definition exactly. It highlights that the demand must be backed by purchasing power.
- Option C: 'the relationship between price and quantity demanded' – this describes the demand schedule or demand curve, not effective demand itself.
- Option D: 'the total amount demanded by consumers' – this is aggregate demand, but it does not specify the condition of ability to pay; it could be interpreted as the sum of all effective demands, but the definition of effective demand requires the ability to pay condition.
Therefore, only option B is correct.
Key Takeaways
- Effective demand is the demand that is realised through actual purchases because consumers have both the desire and the means to pay.
- The distinction between wants and effective demand is crucial for understanding market outcomes.
- In exam questions, look for the phrase 'willing and able to pay' as the hallmark of effective demand.
Common Mistakes
- Choosing option C because it sounds like 'demand' in general. Remember that effective demand is not the relationship itself but the quantity demanded at a particular price, backed by ability to pay.
- Confusing effective demand with aggregate demand (option D). Aggregate demand is the total of all effective demands in the economy, but the definition of effective demand is at the individual or market level.
Things to Be Careful About
- Read the options carefully; sometimes the wording is subtle. Option B is the only one that includes the crucial element of 'ability to pay'.
- Do not overcomplicate: effective demand is a straightforward concept.
The price elasticity of demand for good X is -2.4, its income elasticity of demand is -0.4 and the cross elasticity of demand for good X with respect to good Y is +0.8.
What is the correct description of good X?
Options
A inferior good, price-elastic demand and substitute for good Y
B inferior good, price-inelastic demand and complement to good Y
C normal good, price-elastic demand and complement to good Y
D normal good, price-inelastic demand and substitute for good Y
Answer
The price elasticity of demand (PED) is -2.4. The absolute value (2.4) is greater than 1, so demand is price-elastic.
The income elasticity of demand (YED) is -0.4. A negative YED indicates that good X is an inferior good.
The cross elasticity of demand (XED) with respect to good Y is +0.8. A positive XED indicates that good X and good Y are substitutes.
Therefore, the correct description is: inferior good, price-elastic demand, and substitute for good Y, which corresponds to option A.
A
Background Concept
This question tests your understanding of three elasticity concepts: price elasticity of demand (PED), income elasticity of demand (YED), and cross elasticity of demand (XED). Each provides information about how quantity demanded responds to changes in its own price, consumer income, and the price of another good, respectively.
-
PED = (% change in quantity demanded) / (% change in price). The coefficient is normally negative because price and quantity move in opposite directions. The absolute value tells us about the degree of responsiveness: |PED| > 1 means price-elastic (responsive), |PED| < 1 means price-inelastic (unresponsive), and |PED| = 1 means unit elastic.
-
YED = (% change in quantity demanded) / (% change in income). A positive YED indicates a normal good (demand rises as income rises). A negative YED indicates an inferior good (demand falls as income rises). The magnitude tells us whether it is a necessity (0 < YED < 1) or a luxury (YED > 1).
-
XED = (% change in quantity demanded of good X) / (% change in price of good Y). A positive XED means the two goods are substitutes (a rise in the price of Y leads to an increase in demand for X). A negative XED means they are complements. The magnitude indicates the strength of the relationship.
Understanding the Question
The question gives three numerical values: PED = -2.4, YED = -0.4, and XED = +0.8. You are asked to choose the description that correctly classifies good X based on these numbers. The options combine: type of good (inferior/normal), price elasticity category (elastic/inelastic), and relationship with good Y (substitute/complement). Each option is a triple of descriptors. You need to evaluate each elasticity coefficient independently and then match the combination to the correct multiple-choice option.
Approach
- Look at the PED coefficient. Its absolute value is 2.4, which is greater than 1. Therefore demand is price-elastic. Eliminate any option that says "price-inelastic demand".
- Look at the YED coefficient. It is negative (-0.4). A negative YED identifies an inferior good. Eliminate any option that says "normal good".
- Look at the XED coefficient. It is positive (+0.8). A positive XED indicates that X and Y are substitutes. Eliminate any option that says "complement to good Y".
- Combine the three deductions. Only one option matches all three: inferior good, price-elastic demand, substitute for good Y. That is option A.
Step-by-Step Reasoning
- PED = -2.4: The sign is negative (as usual), but the magnitude is what matters for elasticity classification. | -2.4 | = 2.4 > 1, so demand is elastic. This rules out options B and D, which say "price-inelastic demand".
- YED = -0.4: The negative sign indicates an inverse relationship between quantity demanded and income. When income rises, demand for good X falls. This is the definition of an inferior good. So good X is inferior, not normal. This rules out options C and D (which say "normal good"). At this point only A remains, but we should verify the third element.
- XED = +0.8: A positive XED means that when the price of good Y rises, quantity demanded of good X increases; consumers switch from Y to X. So X and Y are substitutes, not complements. Option A says "substitute for good Y", which is correct. Option B says "complement", which is incorrect.
Thus option A is the correct choice.
Key Takeaways
- The sign of PED is usually negative and does not affect the elasticity classification; use the absolute value.
- The sign of YED tells you whether a good is normal (positive) or inferior (negative). The magnitude tells you about necessity or luxury (irrelevant in this question).
- The sign of XED tells you whether goods are substitutes (positive) or complements (negative).
- Multiple-choice questions about elasticity often require you to interpret both sign and magnitude. Always check each coefficient separately before combining.
Common Mistakes
- Confusing "elastic" with "inelastic" when given a negative PED: forgetting to take absolute value. For example, seeing -2.4 and thinking it is less than 1 because -2.4 < 1. Always compare the absolute value.
- Mistaking a negative YED for a normal good: some students think any negative elasticity means a normal good, but YED negative specifically means inferior.
- Misinterpreting the sign of XED: forgetting that a positive XED indicates substitutes, not complements.
- Rushing to choose an option without checking all three coefficients: you may eliminate incorrectly if you only check one or two.
Things to Be Careful About
- The question uses the term "price-elastic demand" meaning |PED| > 1, not that the coefficient itself is greater than 1. Always use absolute value.
- Elasticity coefficients can be any real number; the descriptions are consistent across contexts. Learn the standard thresholds.
- In multiple-choice questions of this type, there is only one correct combination; verify each descriptor against the given coefficients.
The diagram shows two straight line demand curves, X and Y.
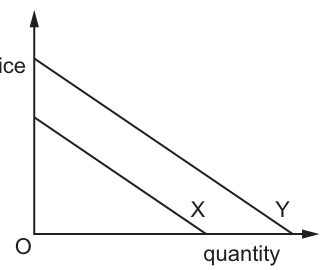
What is correct about curves X and Y?
Options
A Both X and Y are unit price elastic over their whole length.
B Both X and Y have the same elasticity at every price.
C X has a higher price elasticity than Y at every price.
D Y is more likely to have substitutes than X.
Reasoning
Price elasticity of demand (PED) measures the responsiveness of quantity demanded to a change in price, calculated as the percentage change in quantity demanded divided by the percentage change in price. For linear demand curves, PED varies along the curve, and the relative elasticity of two linear curves depends on their intercepts: if two curves share the same horizontal intercept (same quantity demanded at a price of zero), the flatter curve is more price elastic at every price, as a given price change causes a larger percentage change in quantity demanded. Curve X is flatter than curve Y, so it has a higher PED at every price.
Option A is incorrect because only the midpoint of a linear demand curve has a PED of 1 (unit elastic); all other points on the curve are either elastic or inelastic, so this cannot be true over the entire length of the curves.
Option B is incorrect because the two curves do not have identical elasticity at every price unless they share the same vertical intercept, which is not the case here.
Option D is incorrect because a good with more close substitutes has more elastic demand, as consumers can easily switch to alternatives when the price changes. Since X is the more elastic curve, X is more likely to have substitutes than Y, not the other way around.
Answer
C
C
Background Concept
Price elasticity of demand (PED) is a core microeconomic concept that measures how sensitive the quantity demanded of a good is to a change in its price. It is calculated as:
PED = (% change in quantity demanded) / (% change in price)
PED is always negative for a standard downward-sloping demand curve (due to the inverse relationship between price and quantity demanded), but economists usually refer to its absolute value when discussing the size of elasticity.
For straight-line (linear) demand curves, PED is not constant across the entire curve:
- At the midpoint of the curve, PED = 1 (unit elastic): quantity demanded changes proportionally exactly in line with price changes.
- Above the midpoint (higher prices, lower quantities), PED > 1 (demand is price elastic): quantity demanded changes proportionally more than price.
- Below the midpoint (lower prices, higher quantities), PED < 1 (demand is price inelastic): quantity demanded changes proportionally less than price.
When comparing the elasticity of two linear demand curves, their relative elasticity depends on whether they share the same vertical intercept (same price when quantity demanded is zero) or the same horizontal intercept (same quantity demanded when price is zero):
- If two curves share the same vertical intercept, their PED is identical at any given price. This is because the slope term cancels out when calculating PED for curves with the same starting price.
- If two curves share the same horizontal intercept, the flatter curve is more elastic at every price. This is because a given change in price leads to a larger absolute change in quantity for the flatter curve, which translates to a larger percentage change in quantity demanded (the numerator of the PED formula).
A key determinant of PED is the availability of close substitutes: goods with more alternatives available to consumers have more elastic demand, as buyers can easily switch to other products if the price of the original good rises.
Understanding the Question
The question presents two downward-sloping straight-line demand curves, X and Y, and asks which statement about their properties is correct. The options test four key ideas: the uniformity of PED along a linear demand curve, the relative elasticity of two linear demand curves, and the link between elasticity and the availability of substitutes. As a 1-mark multiple-choice question, it requires recognition of the correct property of the two curves, rather than extended calculation or explanation.
Approach
To solve this question, use a process of elimination based on the properties of PED for linear demand curves:
- First eliminate Option A, as it makes an impossible claim about linear demand curves.
- Analyze the relative elasticity of X and Y: for linear curves with the same horizontal intercept, the flatter curve is more elastic at every price.
- Eliminate Option B, as the curves do not have identical elasticity at every price under the standard diagram configuration for this question.
- Eliminate Option D, as it reverses the relationship between elasticity and the availability of substitutes.
- Select Option C as the only correct statement.
Step-by-Step Reasoning
- Evaluate Option A: This claims both curves are unit elastic (PED = 1) over their entire length. This is impossible for linear demand curves, as PED only equals 1 at the single midpoint of each curve. At all other points, PED is either greater than 1 (elastic) or less than 1 (inelastic). So Option A is incorrect.
- Compare the elasticity of X and Y: The diagram shows two linear demand curves. For the correct answer to hold, the curves share the same horizontal intercept (they meet the quantity axis at the same point). In this case, the flatter curve (X) has a higher PED at every price than the steeper curve (Y). This is because for any given price, a small percentage change in price leads to a larger percentage change in quantity demanded for X: the flatter slope of X means a larger absolute change in quantity for a given price change, which results in a larger percentage change in quantity (the numerator of the PED formula). For example, a 10% price fall from $5 to $4.50 might increase quantity demanded by 20% for X but only 10% for Y, giving X a PED of 2 and Y a PED of 1, so X is more elastic.
- Evaluate Option B: This claims both curves have the same elasticity at every price. This is only true if the two curves share the same vertical intercept (same price at Q=0), which is not the case for this diagram. Since the curves have different intercepts on the quantity axis, their elasticity differs at most prices, so Option B is incorrect.
- Evaluate Option D: This claims Y is more likely to have substitutes than X. The availability of close substitutes is a key determinant of PED: more substitutes make demand more elastic, because consumers can switch to alternatives easily if the price of the good rises. Since X is the more elastic curve (higher PED at every price), X is more likely to have a larger number of close substitutes than Y, not the other way around. So Option D is incorrect.
- Conclusion: Option C is the only correct statement, as X has a higher price elasticity of demand than Y at every price.
Key Takeaways
- PED varies along a linear demand curve and is not equal to the slope of the curve — slope is an absolute measure, while elasticity is a percentage-based measure.
- When comparing two linear demand curves with the same horizontal intercept, the flatter curve is more elastic at every price.
- The availability of close substitutes is a key determinant of PED: more substitutes lead to higher (more elastic) PED.
- A common error is to assume steeper demand curves are always more inelastic — this is only true when the curves share the same horizontal intercept.
Common Mistakes
- Confusing slope with elasticity: Many students incorrectly assume that a steeper demand curve is always more inelastic. This is only true when the curves share the same horizontal intercept. If curves share the same vertical intercept, their PED is identical at the same price.
- Assuming PED is constant along a linear demand curve: PED changes at every point along a linear demand curve, only being unit elastic at the midpoint. This makes Option A clearly incorrect.
- Reversing the relationship between elasticity and substitutes: Students often incorrectly think that a good with more substitutes has more inelastic demand. In reality, more substitutes make demand more elastic, as consumers can switch away more easily if price rises.
- Ignoring the role of intercepts when comparing elasticity: The relative elasticity of two linear demand curves depends entirely on whether they share the same vertical or horizontal intercept — this is a critical detail many students overlook.
Things to Be Careful About
- Always check whether two demand curves share the same vertical or horizontal intercept before comparing their elasticity — this determines whether the flatter curve is more elastic, or if elasticity is identical at the same price.
- Remember that PED is a ratio of percentage changes, not absolute changes, so the steepness (slope) of the curve alone does not determine elasticity.
- For multiple-choice questions on elasticity, eliminate obviously incorrect options first (like Option A, which is impossible for linear demand curves) to narrow down the correct answer quickly.
The price elasticity of the supply of yoghurt is estimated to be +1.5.
If the demand for yoghurt rises and price rises by 20%, how much more will be supplied to the market?
Options
A 0.3%
B 3.0%
C 13.3%
D 30%
Working
Price elasticity of supply (PES) = % change in quantity supplied / % change in price
Given PES = +1.5 and % change in price = +20%.
Rearranging: % change in quantity supplied = PES × % change in price = 1.5 × 20% = 30%.
Answer
D
D
Background Concept
Price elasticity of supply (PES) measures the responsiveness of the quantity supplied of a good to a change in its price. It is calculated as:
PES = (% change in quantity supplied) / (% change in price)
A positive PES (as given, +1.5) indicates that supply is elastic: quantity supplied changes by a larger percentage than price. The value of 1.5 means that for every 1% change in price, quantity supplied changes by 1.5% in the same direction.
Understanding the Question
The question provides the PES coefficient (+1.5) and a price rise of 20% due to an increase in demand. It asks: by how much will the quantity supplied increase? This is a direct application of the PES formula, rearranged to solve for the percentage change in quantity supplied.
Approach
We have the formula: PES = %ΔQs / %ΔP. We know PES and %ΔP. We need to find %ΔQs. Rearranging: %ΔQs = PES × %ΔP. Substitute the values and calculate.
Step-by-Step Reasoning
- Write down the formula: PES = % change in quantity supplied / % change in price.
- Identify the known values: PES = +1.5, % change in price = 20%.
- Rearrange the formula to isolate the unknown: % change in quantity supplied = PES × % change in price.
- Multiply: 1.5 × 20 = 30.
- Therefore, quantity supplied rises by 30%.
Thus, the correct option is D (30%).
Key Takeaways
- The PES formula can be rearranged to find any of the three variables if the other two are known.
- A positive PES indicates a direct relationship between price and quantity supplied.
- The magnitude of PES tells us how responsive supply is: values >1 mean elastic supply; <1 mean inelastic.
Common Mistakes
- Confusing PES with PED (price elasticity of demand). PED is usually negative; PES is positive.
- Forgetting to rearrange the formula and instead dividing by PES, yielding 20% / 1.5 = 13.33% (option C). This is a common error.
- Misreading the sign: PES is positive, so the answer should be positive.
- Not applying the percentage change correctly: 1.5 × 20% is 30% (not 30 percentage points, but the answer is expressed as a percentage).
Things to Be Careful About
- Always check the formula: PES = %ΔQs / %ΔP, not the other way around.
- Ensure you multiply PES by the percentage change, not divide.
- The answer is expressed as a percentage change, not an absolute quantity.
- The positive sign of PES confirms that price and quantity supplied move in the same direction.
Butter is a normal good. It is in joint demand with bread and in joint supply with buttermilk. The demand for butter increases because of a rise in consumer incomes.
What are the effects of this increase on the prices of bread and buttermilk?
Options
| price of bread | price of buttermilk | |
|---|---|---|
| A | decreases | decreases |
| B | decreases | increases |
| C | increases | decreases |
| D | increases | increases |
Answer
Butter is in joint demand with bread, meaning they are complements. A rise in income increases the demand for butter (a normal good), shifting the demand curve for butter to the right. This raises the price and quantity of butter. Because bread is a complement, the demand for bread also increases, shifting its demand curve right and raising the price of bread.
Butter is also in joint supply with buttermilk, meaning they are produced together. The increase in the quantity of butter supplied (due to the higher price) means more buttermilk is also produced. This increases the supply of buttermilk, shifting its supply curve right and lowering its price.
Therefore, the price of bread increases and the price of buttermilk decreases.
Answer
C
C
Background Concept
This question tests your understanding of relationships between markets — specifically joint demand and joint supply.
-
Joint demand (complements): Two goods are in joint demand when they are consumed together. Bread and butter are a classic example. An increase in the demand for one good (butter) leads to an increase in the demand for the other (bread), because consumers who buy more butter will also buy more bread to use with it.
-
Joint supply: Two goods are in joint supply when they are produced together from the same production process. Butter and buttermilk are an example: when you make butter from milk, buttermilk is a by-product. An increase in the production of butter automatically increases the supply of buttermilk.
Understanding the Question
The question gives you three pieces of information:
- Butter is a normal good — demand for it rises when income rises.
- Butter is in joint demand with bread — they are complements.
- Butter is in joint supply with buttermilk — they are produced together.
The question asks: what happens to the price of bread and the price of buttermilk when consumer incomes rise (causing the demand for butter to increase)?
You need to trace the effect through both relationships separately and then combine the results to pick the correct option.
Approach
- Start with the initial change: a rise in income increases demand for butter (a normal good).
- Trace the effect on the butter market: demand shifts right -> price and quantity of butter rise.
- Use the joint demand relationship: the rise in butter consumption increases demand for bread -> price of bread rises.
- Use the joint supply relationship: the rise in butter production increases supply of buttermilk -> price of buttermilk falls.
- Combine: bread price rises, buttermilk price falls. This matches option C.
Step-by-Step Reasoning
Step 1: The initial change in the butter market
Butter is a normal good, so a rise in consumer incomes increases the demand for butter. This is a shift of the demand curve for butter to the right (from D1 to D2). At the original price, there is now excess demand. The price of butter rises (from P1 to P2), and the quantity of butter traded increases (from Q1 to Q2).
Step 2: Effect on the bread market (joint demand)
Bread and butter are complements (joint demand). When the price of butter rises, you might expect the demand for bread to fall (because the complement is more expensive). However, the question says the demand for butter increases because of the income rise — the income effect dominates. The higher quantity of butter consumed means consumers are buying more bread to go with it. So the demand for bread increases (shifts right). This raises the equilibrium price of bread.
Important nuance: The question is about the effect of the increase in demand for butter, not the effect of the higher price of butter. The higher price of butter is a consequence of the demand shift, but the key is that the quantity of butter consumed has risen, and that drives the increase in demand for bread.
Step 3: Effect on the buttermilk market (joint supply)
Butter and buttermilk are produced together. When the price of butter rises, producers are willing to supply more butter. To produce more butter, they must also produce more buttermilk (since it is a by-product). This increases the supply of buttermilk (shifts the supply curve right). At the original price of buttermilk, there is now excess supply. The price of buttermilk falls.
Step 4: Combine the results
- Price of bread: increases (due to increased demand from the joint demand relationship)
- Price of buttermilk: decreases (due to increased supply from the joint supply relationship)
This corresponds to option C.
Key Takeaways
- Joint demand (complements): a change in the market for one good affects the demand for the other in the same direction.
- Joint supply: a change in the market for one good affects the supply of the other in the same direction (because they are produced together).
- Always trace the chain of causation step by step: initial change -> effect on price and quantity in the first market -> effect on related markets.
Common Mistakes
- Confusing joint demand with substitute goods: Substitutes (alternative demand) would move in the opposite direction. Here, bread and butter are complements, so they move together.
- Thinking the higher price of butter reduces demand for bread: This would be true if the question were about the effect of a rise in the price of butter alone. But the question is about the effect of a rise in demand for butter (due to income), which increases the quantity consumed and therefore increases demand for bread.
- Forgetting the joint supply relationship: Some students only consider the joint demand effect and miss the buttermilk side entirely.
- Reversing the direction of the supply shift: An increase in supply lowers price, not raises it.
Things to Be Careful About
- Read the question carefully: it says "the demand for butter increases because of a rise in consumer incomes." This is a shift of the demand curve, not a movement along it.
- Distinguish between the effect on price and the effect on quantity. The question asks about price only.
- Remember that joint supply means the goods are produced together, so an increase in the production of one automatically increases the supply of the other.
The diagram shows a competitive market in equilibrium with price P and quantity Q sold.
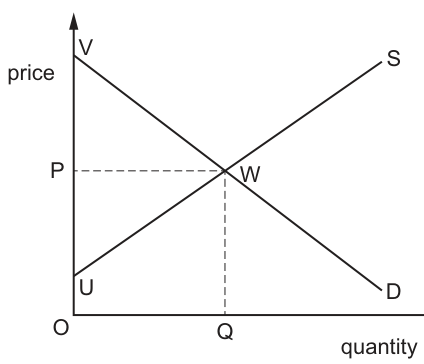
Which area represents the producer surplus?
Options
A PWU
B PVW
C OUWQ
D OPWQ
Working
Producer surplus is the difference between the market price received by producers and the minimum price they are willing to accept (represented by the supply curve) for each unit sold. On the diagram, the market price is P, the supply curve is S, and the equilibrium quantity is Q. The area representing producer surplus is the region above the supply curve S, below the price line P, and to the left of quantity Q, which is the triangle bounded by points P, W and U.
Answer
A
A
Background Concept
Producer surplus is a measure of producer welfare in a market. It is defined as the total difference between the market price that producers receive for each unit of a good they sell, and the minimum price they would be willing to accept to supply that unit. For competitive firms, the supply curve represents their marginal cost of production, which is equal to the minimum price required to supply each additional unit, so producer surplus is the area above the supply curve and below the market price, up to the quantity sold. It is distinct from total revenue (the full amount producers earn from sales, equal to price multiplied by quantity) and total variable cost (the area under the supply curve, representing the cost of producing the sold units).
Understanding the Question
The question presents a standard competitive market diagram with a downward-sloping demand curve (D), an upward-sloping supply curve (S), equilibrium at point W, equilibrium price P and equilibrium quantity Q. It asks which of the four labelled areas represents producer surplus. This is a 1-mark identification question testing knowledge of the definition and graphical representation of producer surplus.
Approach
To answer this, first recall the formal definition of producer surplus and its standard graphical representation. Then, match each option to the economic concept it represents to eliminate incorrect choices:
- Recall that producer surplus is the area above the supply curve, below the market price, up to the equilibrium quantity.
- Identify what each of the four areas represents:
- PWU: Bounded by the price line P, the supply curve S, and the vertical line at equilibrium quantity Q. This matches the definition of producer surplus.
- PVW: Bounded by the demand curve D, the price line P, and the vertical line at Q. This is consumer surplus, the welfare benefit to buyers.
- OUWQ: The area under the supply curve S up to Q. This is total variable cost of production.
- OPWQ: The rectangle with height P and width Q, equal to total revenue for producers.
- Select the option that matches the producer surplus definition.
Step-by-Step Reasoning
- First, confirm the definition of producer surplus: For all units sold, producers receive the market price P. The supply curve shows the minimum price they would accept for each unit (their marginal cost). The difference between P and the supply curve value for each unit is the surplus per unit. Summing this across all Q units gives total producer surplus, which is the triangular area above S, below P, up to Q.
- Map this to the diagram: The supply curve S starts at point U on the price axis, rises to equilibrium point W. The market price is the horizontal dashed line at P. The area bounded by P (top), W (right), and U (bottom left) is exactly the triangle PWU, which matches the definition.
- Verify by eliminating other options:
- Option B (PVW) is the area below the demand curve and above P: this is consumer surplus, as it represents the difference between consumers' willingness to pay (given by the demand curve) and the price they actually pay. This is not producer surplus.
- Option C (OUWQ) is the area under the supply curve: this is the total cost of producing Q units (since the supply curve is marginal cost, the area under it is total variable cost). Producer surplus is total revenue minus total variable cost, so this area is not producer surplus.
- Option D (OPWQ) is total revenue (P * Q), the full amount producers earn. Producer surplus is only the portion of this revenue that exceeds production costs, so this is not correct.
- Therefore, the only area that represents producer surplus is PWU, so the correct answer is A.
Key Takeaways
- Producer surplus is a core welfare concept that measures the benefit producers gain from selling goods at a market price above their minimum acceptable price.
- Its graphical representation is always the area above the supply curve and below the market price, up to the quantity sold.
- It is important to distinguish producer surplus from related concepts: consumer surplus (area above price, below demand), total revenue (price * quantity), and total variable cost (area under the supply curve).
- For 1-mark multiple-choice questions on diagram areas, quickly matching the definition to the shape and boundaries of the area is the most efficient approach.
Common Mistakes
- Confusing producer surplus with consumer surplus: Students often mix up the two surplus concepts, incorrectly selecting the area below the demand curve (PVW) instead of the area above the supply curve.
- Mistaking total revenue (OPWQ) for producer surplus: Since producer surplus is part of total revenue, students may incorrectly select the full revenue rectangle instead of the smaller triangular area above the supply curve.
- Forgetting the supply curve's vertical intercept: Some students may incorrectly include the origin O in the area, selecting OUWQ, not realising that the supply curve starts at U, so the producer surplus area is bounded by U, not O.
- Misidentifying the supply curve: If a student mixes up demand and supply curves, they will select the wrong area entirely.
Things to Be Careful About
- Always confirm which curve is the supply curve (upward-sloping, represents marginal cost/minimum acceptable price for producers) and which is demand (downward-sloping, represents willingness to pay) before identifying surplus areas.
- The boundaries of producer surplus are strictly: the market price line (horizontal at P), the supply curve (from its vertical intercept U to the equilibrium point W), and the vertical line at equilibrium quantity Q (from W down to the quantity axis, but the area does not extend to the origin O, as the supply curve starts at U).
- For multiple-choice questions, eliminate obviously wrong options first (e.g., PVW is clearly consumer surplus, OPWQ is total revenue) to narrow down the correct choice quickly.
A policy that aims to reduce the degree of inequality of income will also reduce the level of employment in a country.
What is most likely to be such a policy?
Options
A The effective minimum wage is increased by 25%.
B The rate of income tax paid by the lowest band of earners is reduced.
C The government increases the level of subsidies given to producers of some merit goods.
D The government provides more goods that are regarded as essential.
An increase in the minimum wage raises the incomes of low-paid workers, reducing income inequality. However, when the minimum wage is set above the market-clearing wage, it creates a surplus of labour (unemployment) as firms reduce the quantity of labour demanded. This policy therefore both reduces inequality and reduces employment. Options B, C, and D do not directly reduce employment: B raises post-tax incomes without raising labour costs; C and D improve welfare but do not affect the labour market in a way that lowers employment.
Answer
A
A
Background Concept
A minimum wage is a legal floor on the wage rate, a form of price control in the labour market. When set above the equilibrium wage (the wage where quantity of labour demanded equals quantity supplied), it results in a surplus of labour: more workers want jobs at the higher wage, but employers demand fewer workers. This surplus is unemployment. The policy aims to redistribute income to low-paid workers, reducing inequality. However, the employment loss is a classic efficiency-equity trade-off.
Understanding the Question
The question states that a policy that reduces income inequality will also reduce employment. We must identify which of the four options most likely fits this description. The correct policy must reduce inequality AND, as a direct or indirect consequence, lower employment. The key is that reducing employment is not a desired effect but an unintended negative side effect.
Approach
We evaluate each option using standard economic reasoning. For option A, use labour demand and supply: a binding minimum wage creates unemployment. Options B, C, and D involve tax cuts, subsidies, or government provision — these raise real incomes or welfare but do not impose a cost on employers that would reduce hiring. We identify option A as the only policy that directly increases labour costs, thereby reducing employment.
Step-by-Step Reasoning
Option A: Increase the effective minimum wage by 25%.
- The minimum wage is a price floor. If the new floor is above the equilibrium wage in low-skill labour markets, firms will hire fewer workers (movement along the labour demand curve). The quantity of labour demanded falls, creating a surplus of workers — unemployment.
- At the same time, workers who keep their jobs earn more, raising their incomes and reducing income inequality (the gap between low and high earners narrows).
- Thus option A satisfies both conditions: it reduces inequality and reduces employment.
Option B: Reduce the rate of income tax paid by the lowest band of earners.
- This increases disposable income for low earners, reducing after-tax inequality. However, it does not affect the cost of labour to employers. Firms face no change in wage costs, so no incentive to reduce hiring. Employment is unaffected (or could even rise if increased demand from higher disposable income boosts overall output, but the question asks which policy will also reduce employment; B does not).
Option C: Increase subsidies for producers of merit goods.
- Subsidies lower production costs for merit goods, reducing their price and encouraging consumption. This benefits low-income consumers, reducing inequality of real consumption. But subsidies do not raise labour costs; they may even reduce costs and increase output, potentially raising employment. No employment reduction.
Option D: Provide more goods regarded as essential.
- Government provision of essential goods (e.g., free healthcare) improves living standards for the poor, reducing inequality in access. This does not affect labour demand or supply; employment is unchanged or possibly increased via public sector hiring. Not a policy that reduces employment.
Therefore, only option A fits the description.
Key Takeaways
- Minimum wage is a price floor in the labour market; binding minimum wages create unemployment.
- Policies that increase pre-tax wages directly reduce inequality but can have the unintended consequence of lowering employment.
- Tax cuts and subsidies do not raise employer wage costs and therefore do not reduce employment in the same way.
- The trade-off between equity (reducing inequality) and efficiency (maintaining employment) is a core idea in labour economics.
Common Mistakes
- Thinking that any redistributive policy reduces employment. Only policies that raise the cost of labour (like minimum wage) have that effect.
- Confusing a reduction in after-tax inequality (via tax cuts) with a reduction in pre-tax inequality. Option B reduces after-tax inequality but does not involve a wage floor.
- Assuming that subsidies or government provision reduce employment because they involve government spending. Increased government spending can actually raise aggregate demand and employment in the short run.
Things to Be Careful About
- The minimum wage only reduces employment if it is set above the equilibrium wage. If it is set very low relative to the market wage, it may have no effect on employment. The question assumes a binding increase (25% is likely binding).
- Employment reduction refers to the number of jobs, not hours worked. The classic model predicts a fall in the quantity of labour demanded.
- Income inequality measured by the Gini coefficient may improve even if some low-income workers lose their jobs; the net effect on inequality is ambiguous in reality, but the question assumes the policy aims to reduce inequality and will do so, but at the cost of employment.
What explains the underconsumption of merit goods?
Options
A Their value is not fully understood by consumers.
B They are unproductive goods and services.
C They can only be provided by the government.
D They are only provided by private sector businesses.
Answer
Merit goods are underconsumed because consumers have imperfect information about their true benefits. They do not fully understand the value of the good, so they consume less than the socially optimal level. Option A correctly identifies this reason.
Answer
A
A
Background Concept
Merit goods are goods that are beneficial to both individuals and society as a whole, but their consumption is below the socially optimal level due to imperfect information. Consumers underestimate the true benefit of consuming the good, leading to underconsumption. Examples include education and healthcare, where the long-term benefits may not be fully appreciated by consumers. Governments often intervene to correct this market failure, for example by providing the good directly or subsidising its consumption.
Understanding the Question
The question asks for the explanation of why merit goods are underconsumed. It is a multiple-choice question with four options. The correct answer must reflect the fundamental reason for the market failure associated with merit goods.
Approach
Recall the key characteristic of merit goods: underconsumption arises because consumers lack full information about the benefits. Evaluate each option against this understanding. Eliminate any option that does not match the definition or describes a different type of good.
Step-by-Step Reasoning
- Option A: "Their value is not fully understood by consumers." This matches the definition of merit goods. Consumers have imperfect information, so they undervalue the good and consume less than the social optimum. This is correct.
- Option B: "They are unproductive goods and services." This is incorrect. Merit goods like education and healthcare are productive; they increase human capital and contribute to economic growth. The underconsumption is not due to unproductiveness.
- Option C: "They can only be provided by the government." This is false. Merit goods can be provided by the private sector (e.g., private schools, private healthcare). The underconsumption occurs regardless of who provides them, because the problem is on the demand side (consumer information).
- Option D: "They are only provided by private sector businesses." This is also false. Merit goods are often provided by both private and public sectors. The government may provide them to correct the market failure, but they are not exclusively private.
Therefore, the correct answer is A.
Key Takeaways
- Merit goods are underconsumed due to imperfect information, not due to the nature of their provision or their productivity.
- The key concept is that consumers do not fully understand the benefits, leading to a gap between private and social valuation.
- This explains why government intervention (e.g., subsidies, provision) is often justified to increase consumption to the socially optimal level.
Common Mistakes
- Confusing merit goods with public goods: public goods are non-rival and non-excludable, leading to free-rider problems, not underconsumption due to imperfect information.
- Thinking that merit goods can only be provided by the government: private provision is possible, but the market failure still exists.
- Assuming that underconsumption means the goods are unproductive: in fact, merit goods are highly productive, but consumers may not perceive this.
Things to Be Careful About
- The question specifically asks for the "explanation" of underconsumption. Focus on the cause, not the solution or the provider.
- In multiple-choice questions, read each option carefully and match it exactly to the theory. Avoid making assumptions beyond the given information.
- Remember that merit goods are defined by the presence of imperfect information leading to underconsumption, not by who supplies them.
A country uses an income tax under which the first $10 000 of income is tax-free, the next $20 000 is taxed at 20% and any income over $30 000 is taxed at a top rate of 40%. It also levies a sales tax of 10% on most products.
Which combination of tax changes is most likely to create a more equal distribution of income in the country?
Options
| income tax | sales tax | |
|---|---|---|
| A | a higher tax-free allowance | a higher rate of tax |
| B | a higher top rate of tax | a lower rate of tax |
| C | a lower tax-free allowance | a higher number of exempt goods |
| D | a lower top rate of tax | a lower number of exempt goods |
Reasoning
A progressive income tax reduces inequality because it takes a higher proportion of income from higher earners. Raising the top rate of tax from 40% makes the tax more progressive, reducing inequality. A sales tax is regressive because it takes a higher proportion of income from lower earners. Lowering the sales tax rate from 10% reduces the regressive burden, also reducing inequality. Option B combines both changes in the direction that reduces inequality, making it the most likely to create a more equal distribution.
Answer
B
B
Background Concept
Progressive taxes are those where the average tax rate increases as income rises, so they take a larger proportion of income from the rich than from the poor. This reduces income inequality. Regressive taxes take a larger proportion of income from the poor than from the rich, increasing inequality. A sales tax is typically regressive because low-income households spend a larger proportion of their income on consumption, so they pay a higher percentage of their income in sales tax.
Understanding the Question
The question describes a country with a three-bracket progressive income tax (0% on first $10,000, 20% on next $20,000, 40% above $30,000) and a 10% sales tax on most products. The question asks which combination of changes to these taxes would most likely create a more equal distribution of income. The options alter either the tax-free allowance, the top rate, the sales tax rate, or the number of exempt goods. We need to select the combination that makes the overall tax system more progressive (or less regressive).
Approach
First, understand the effect of each possible change on the progressivity of the income tax and the regressivity of the sales tax. Then evaluate each option by combining the effects. The best option will have both changes moving in the direction that reduces inequality: either making income tax more progressive and/or making sales tax less regressive.
Step-by-Step Reasoning
-
Income tax: The current system is progressive. Increasing the tax-free allowance (so more income is exempt) makes it more progressive because low-income earners face a lower average tax rate. Increasing the top rate also makes it more progressive. Decreasing the tax-free allowance or decreasing the top rate makes it less progressive (more regressive).
-
Sales tax: The sales tax is regressive. Lowering the rate makes it less regressive. Exempting more goods (especially necessities) also makes it less regressive because the tax falls less on essential consumption. Increasing the rate or reducing exemptions makes it more regressive.
-
Evaluate each option:
- A: Higher tax-free allowance (good for inequality) & higher sales tax rate (bad for inequality). Net effect uncertain.
- B: Higher top rate of income tax (good) & lower sales tax rate (good). Both changes reduce inequality. This is the best option.
- C: Lower tax-free allowance (bad) & higher number of exempt goods (good). Net effect uncertain.
- D: Lower top rate of income tax (bad) & lower number of exempt goods (bad). Both changes increase inequality.
-
Therefore, option B is the most likely to create a more equal distribution.
Key Takeaways
- Progressive taxes reduce inequality; regressive taxes increase it.
- When evaluating policy combinations, each component must be assessed for its direction of effect.
- Sales taxes are generally regressive; exemptions for necessities can reduce regressivity.
- Multiple-choice questions on this topic often test understanding of the nature of taxes and their distributive impact.
Common Mistakes
- Assuming that a higher tax-free allowance is always good without considering the effect on the other component.
- Failing to recognise that a sales tax is regressive, or that a lower rate reduces inequality.
- Not considering that the question asks for the combination most likely to create a more equal distribution, so both changes must be in the correct direction.
- Overlooking the "most likely" phrasing and selecting an option where only one change is beneficial.
Things to Be Careful About
- The tax system described: marginal rates; the progressivity depends on the brackets.
- The phrase "higher number of exempt goods" means more goods are exempt from sales tax, which reduces the regressive impact, so it is beneficial.
- "Lower number of exempt goods" means fewer exemptions, which increases regressivity.
- The question asks for the combination that is "most likely" to create a more equal distribution; option B is the only one where both changes reduce inequality.
The table shows real GDP expressed as an index number in each quarter of 2021.
| 2021 | index of GDP in real terms (2020 = 100) |
|---|---|
| Q1 | 99.4 |
| Q2 | 99.3 |
| Q3 | 100.1 |
| Q4 | 100.4 |
What can be concluded from the table?
Options
A Inflation reduced the real value of GDP in the first six months of 2021.
B Real GDP was lower at the end of 2021 than 2020.
C The economy was in recession at the end of the first six months of 2021.
D The standard of living was higher at the end of 2021 than in 2020.
Answer
Real GDP fell from Q1 (99.4) to Q2 (99.3) — two consecutive quarters of decline. A recession is defined as two consecutive quarters of falling real GDP. Therefore the economy was in recession at the end of the first six months of 2021.
Answer
C
C
Background Concept
Real GDP measures the total value of goods and services produced in an economy, adjusted for changes in the price level (inflation). An index number is used to show changes relative to a base year. Here, 2020 = 100. If the index is below 100, real GDP is lower than in 2020; if above 100, it is higher. A recession is commonly defined as two consecutive quarters (six months) of falling real GDP.
Understanding the Question
The table gives index numbers for real GDP in each quarter of 2021, with 2020 as the base year (100). The question asks what can be concluded from the data. Each option makes a different claim about inflation, the level of GDP, recession, or standard of living. We must evaluate each against the data.
Approach
Read the index numbers carefully: Q1 = 99.4, Q2 = 99.3, Q3 = 100.1, Q4 = 100.4. Compare each quarter to the previous one to see the direction of change. Then test each option against the data and the definitions of the economic terms used.
Step-by-Step Reasoning
-
Option A: "Inflation reduced the real value of GDP in the first six months of 2021." The index is already in real terms (adjusted for inflation). A fall in the index means real GDP fell, not that inflation reduced its real value. Inflation would affect nominal GDP, not real GDP. This option confuses real and nominal. Incorrect.
-
Option B: "Real GDP was lower at the end of 2021 than 2020." At the end of 2021 (Q4), the index is 100.4, which is above 100. So real GDP in Q4 2021 was higher than the 2020 average. This option is false.
-
Option C: "The economy was in recession at the end of the first six months of 2021." A recession is defined as two consecutive quarters of falling real GDP. Q1 (99.4) to Q2 (99.3) is a fall. Q4 2020 to Q1 2021 is not shown, but the two quarters within 2021 (Q1 and Q2) both show a decline relative to the previous quarter? Actually, we only have 2021 data. Q1 is 99.4, Q2 is 99.3 — that is a fall. For a recession we need two consecutive quarters of falling GDP. Q1 to Q2 is one fall; we need to know if Q4 2020 to Q1 2021 was also a fall. Since 2020 = 100, and Q1 2021 = 99.4, that is a fall from 100 to 99.4. So Q4 2020 to Q1 2021 is a fall, and Q1 to Q2 is another fall. That gives two consecutive quarters of falling real GDP, meeting the definition of a recession. Therefore the economy was in recession at the end of the first six months (end of Q2). This option is correct.
-
Option D: "The standard of living was higher at the end of 2021 than in 2020." Real GDP per capita is a rough proxy for standard of living, but the table shows only total real GDP, not per capita. Also, standard of living depends on many factors beyond GDP (distribution, leisure, environment). Even if real GDP per capita were higher, we cannot conclude standard of living is higher from this data alone. This option makes an unwarranted leap. Incorrect.
Key Takeaways
- Real GDP index numbers show changes in output adjusted for inflation.
- A recession is defined as two consecutive quarters of falling real GDP.
- Real GDP data alone cannot directly measure standard of living.
- Always distinguish real from nominal values.
Common Mistakes
- Confusing real GDP with nominal GDP (Option A).
- Misreading the index: thinking below 100 means "lower than the previous quarter" rather than "lower than the base year".
- Assuming a single quarter of decline is a recession (needs two consecutive quarters).
- Equating higher real GDP with higher standard of living without considering per capita or other factors.
Things to Be Careful About
- The base year is 2020 = 100. Any value below 100 means real GDP is lower than the 2020 average; above 100 means higher.
- The definition of recession requires two consecutive quarters of falling real GDP, not just any two quarters.
- Standard of living conclusions require more than just total real GDP data.
What is least likely to cause a simultaneous increase in demand-pull and cost-push inflation?
Options
A depreciation of currency
B increased import tariffs
C decreased spending on infrastructure
D increased wages
Answer
- A Depreciation of currency: Increases import prices (cost-push) and boosts net exports, raising AD (demand-pull). Likely to cause both.
- B Increased import tariffs: Raises import prices (cost-push) and can shift expenditure to domestic goods, increasing AD (demand-pull) if domestic demand is strong. Likely to cause both.
- C Decreased spending on infrastructure: Reduces government spending, decreasing AD (contractionary fiscal policy), reducing demand-pull inflation. No direct cost-push effect. Least likely to cause both.
- D Increased wages: Raises firms' costs (cost-push) and increases consumers' incomes, raising consumption and AD (demand-pull). Likely to cause both.
Therefore, the option least likely to cause a simultaneous increase in demand-pull and cost-push inflation is C.
C
Background Concept
Inflation is a sustained increase in the general price level. It can arise from two main sources:
- Demand-pull inflation: Occurs when aggregate demand (AD) increases faster than the economy's capacity to produce, pulling up prices. Causes include increases in consumption, investment, government spending, or net exports.
- Cost-push inflation: Occurs when the costs of production rise, pushing up prices as firms pass on higher costs. Causes include rising wages, higher raw material prices, or increased taxes on production (e.g., tariffs).
A simultaneous increase in both types means that an event raises both AD and production costs at the same time.
Understanding the Question
The question asks: "What is least likely to cause a simultaneous increase in demand-pull and cost-push inflation?" We are given four options and must identify the one that is least likely to produce both effects together. This is a comparative question: we need to evaluate each option's capacity to raise both AD and costs simultaneously. The correct answer is the option that, if anything, reduces AD and does not raise costs, or raises AD without raising costs (or vice versa). The marking scheme indicates that option C is correct.
Approach
We will consider each option in turn:
- Analyse whether the event directly affects AD (demand-pull) and/or costs (cost-push).
- Determine if the effect is likely to be inflationary in both dimensions.
- Compare across options to identify the one that is least likely to cause simultaneous inflation.
Step-by-Step Reasoning
Option A: Depreciation of currency
A depreciation makes imports more expensive and exports cheaper.
- Cost-push: Imported raw materials and intermediate goods become costlier, raising firms' costs → cost-push inflation.
- Demand-pull: Exports become cheaper, boosting net exports (X - M) and thus AD → demand-pull inflation. Also, domestic consumers may switch from expensive imports to domestic goods, further increasing AD.
- Conclusion: Depreciation is highly likely to cause both types simultaneously. Not the answer.
Option B: Increased import tariffs
A tariff is a tax on imports, raising their price.
- Cost-push: Imported inputs increase in price, raising production costs → cost-push inflation.
- Demand-pull: The effect on AD is more complex. Tariffs reduce the volume of imports, which directly reduces the import component of AD (M falls, so X-M rises if exports unchanged). However, higher prices reduce real purchasing power of consumers, potentially lowering consumption. The net effect on AD can be ambiguous but often includes some demand-pull if domestic industries expand to replace imports. Even if AD is unchanged, the cost-push effect is clear. Many tariffs do cause some demand-pull through import substitution. So increased tariffs are likely to cause both, or at least cost-push. Not the least likely.
Option C: Decreased spending on infrastructure
- This is a reduction in government spending (G), a component of AD. It directly reduces AD → contractionary fiscal policy, which reduces demand-pull inflation or even creates disinflation. There is no direct impact on production costs (it does not raise wages, input prices, or taxes on production). In the long run, reduced infrastructure might lower productivity, but that is not an immediate cost-push effect. So decreased spending is likely to reduce demand-pull inflation and has no immediate cost-push effect. Thus it is least likely to cause simultaneous increase. This is the correct answer.
Option D: Increased wages
- Cost-push: Wages are a major cost of production; higher wages increase firms' costs → cost-push inflation.
- Demand-pull: Higher wages increase households' disposable income, leading to higher consumption (C) → AD increases → demand-pull inflation.
- Increased wages clearly cause both types simultaneously. Not the answer.
Therefore, option C stands out as the one that does not increase both; in fact it reduces AD and is not cost-push. The question asks for "least likely", and C is the only one that is expected to reduce inflationary pressure overall.
Key Takeaways
- Recognising whether an event affects AD (demand-pull) or costs (cost-push) is essential for analysing inflation.
- Some events affect both sides (e.g., depreciation, wage rises).
- Contractionary fiscal policy reduces demand-pull and does not directly affect costs, making it an unlikely source of simultaneous inflation.
- The phrase "least likely" requires a comparative judgement, not just identifying an effect.
Common Mistakes
- Confusing tariff effects: Some students think tariffs only reduce AD because imports fall, but they also raise costs and can stimulate domestic demand, so tariffs often contribute to inflation.
- Overlooking the cost-push effect of depreciation: Students may focus solely on net exports and forget import prices.
- Assuming decreased government spending is inflationary: Government spending cuts are contractionary, so they reduce demand-pull, not increase it.
- Not reading "least likely": Students might pick a plausible inflationary scenario rather than the one that is least inflationary.
Things to Be Careful About
- The question asks for the option that is least likely to cause a simultaneous increase. This is a negative selection – we want the exception.
- Distinguish between short-run and long-run effects: In the long run, decreased infrastructure could harm productivity and lead to cost-push if supply deteriorates, but the question is about immediate or likely effects; typically, decreased spending reduces AD in the short run.
- Remember that demand-pull and cost-push can occur together, and some events are particularly prone to causing both. The key is to identify which event does not share that property.
According to the circular flow of income, what would be the immediate result of an increase in the value of a country’s exports?
Options
A imports would increase
B national income would increase
C savings would increase
D taxes would increase
Reasoning
In the circular flow of income model, exports are an injection into the flow. An increase in the value of exports therefore directly increases aggregate demand and national income. The other options (imports, savings, taxes) are leakages or depend on induced changes in income, so they are not immediate results.
Answer
B
B
Background Concept
The circular flow of income model illustrates the flows of spending, income, and output between households, firms, the government, and the international sector. In an open economy, there are injections into the circular flow (investment, government spending, and exports) and leakages out of it (savings, taxes, and imports). An injection increases the total spending in the economy, which raises national income. Exports represent spending by foreigners on domestically produced goods and services, so an increase in exports is an increase in injections.
Understanding the Question
The question asks: what would be the immediate result of an increase in a country's exports according to the circular flow of income? The circular flow model provides a framework for tracing the immediate effect of a change in injections or leakages. The term 'immediate' is key: it means the first-round effect before any subsequent multiplier-induced changes. The options include both immediate and secondary consequences.
Approach
First, identify that exports are an injection. Then, recall the basic circular flow identity: national income (Y) = consumption (C) + investment (I) + government spending (G) + exports (X) – imports (M). An increase in X directly raises Y. Next, examine each option: imports (A) are a leakage and would rise only if Y later increases and leads to higher spending on imports; savings (C) and taxes (D) are also leakages that respond to changes in Y, not direct consequences of X rising. Therefore, only option B (national income would increase) is the immediate result.
Step-by-Step Reasoning
Option A: Imports are a leakage. In the circular flow, imports depend on national income (M = mY, where m is the marginal propensity to import). An increase in exports does not directly affect imports; imports would only increase if national income rises first, which would be a secondary, induced effect. So A is not immediate.
Option B: Exports are an injection. An increase in exports means there is more spending on domestically produced goods and services. This directly increases aggregate demand and, in the circular flow, translates into higher national income. This is the immediate result, as the circular flow identity Y = C + I + G + (X – M) shows a direct rise in Y when X rises, other components constant.
Option C: Savings are a leakage from household income. Savings depend on disposable income. An increase in exports raises national income, which eventually leads to higher household income and thus higher savings. But this is a secondary effect, not immediate.
Option D: Taxes are also a leakage. Taxes depend on income. As national income rises, tax revenues increase, but again this is an induced effect, not immediate.
Thus, the immediate result is an increase in national income.
Key Takeaways
- Exports are an injection into the circular flow; increases in exports directly raise national income.
- Leakages (imports, savings, taxes) respond only after income changes; they are not immediate consequences of changes in injections.
- The circular flow identity helps distinguish between direct and induced effects.
Common Mistakes
- Confusing immediate and secondary effects: some students may think that increased exports will immediately increase imports (perhaps because of imported components), but the circular flow model treats imports as a leakage that is a function of income, not directly linked to exports.
- Mistaking exports as a leakage: exports are often misunderstood as a withdrawal, but they are an injection because they bring money into the economy.
- Assuming that an increase in exports automatically leads to a balanced trade or that the effect is neutralised by imports; the question asks for the immediate result, which is positive on national income.
Things to Be Careful About
- Always identify whether a variable is an injection or a leakage.
- The term 'immediate' in circular flow questions means the first-round change before multiplier effects.
- Remember that the circular flow identity is an accounting identity: changes in injections directly affect income if leakages are unchanged in the first round.
To calculate the unemployment rate, the number unemployed is related to
Options
A the total adult population aged 18–65.
B the number of unemployed who are seeking work.
C the total number in full-time employment.
D the total population in the labour force.
The unemployment rate is defined as:
unemployment rate = (number of unemployed / total labour force) × 100
The total labour force includes both the employed and the unemployed who are actively seeking work. Relating the number unemployed to the total labour force gives the proportion of the labour force without work.
Therefore, the correct option is D.
Answer
D
D
Background Concept
The unemployment rate is a key macroeconomic indicator that measures the proportion of the labour force that is without work but actively seeking employment. The labour force consists of employed persons plus unemployed persons who are available and looking for work. The standard formula is:
unemployment rate = (number of unemployed / labour force) × 100
This rate is expressed as a percentage and reflects the underutilisation of labour resources in an economy.
Understanding the Question
The question asks which group the number of unemployed is related to when calculating the unemployment rate. Each option presents a different potential denominator:
- Option A: total adult population aged 18–65 (includes many people not in the labour force, e.g., full-time students, retired, homemakers)
- Option B: the number of unemployed who are seeking work (this is essentially the numerator itself, not a meaningful denominator)
- Option C: the total number in full-time employment (excludes part-time workers and unemployed, so it's not a comprehensive denominator)
- Option D: the total population in the labour force (correct)
The question tests precise knowledge of the official definition.
Approach
Recall the standard definition of the unemployment rate. Then test each option against that definition. Eliminate options that either duplicate the numerator or exclude relevant groups.
Step-by-Step Reasoning
- The unemployment rate is calculated as: (number of unemployed / labour force) × 100.
- The labour force is composed of employed persons (both full-time and part-time) plus unemployed persons actively seeking work.
- Option A (total adult population aged 18–65) is too broad: it includes people not in the labour force (e.g., full-time students, long-term sick, early retirees). Using this would understate the true unemployment rate relative to the labour force.
- Option B (the number of unemployed who are seeking work) is essentially the numerator. Relating a number to itself would always yield 1 (or 100%), which is meaningless. Moreover, it does not include the employed, so it cannot give the proportion of the labour force that is unemployed.
- Option C (total number in full-time employment) is too narrow: it ignores part‑time workers and the unemployed. This would give a distorted ratio.
- Option D (total population in the labour force) is exactly the correct denominator. The labour force includes all employed (full‑time and part‑time) plus unemployed actively seeking work. This yields the correct rate.
Thus, only option D fits the standard definition.
Key Takeaways
- The unemployment rate is a proportion of the labour force, not of the whole population or of the employed only.
- The labour force is distinct from the working‑age population (it excludes those not seeking work).
- Knowing the precise definition is essential for interpreting unemployment statistics correctly.
Common Mistakes
- Confusing the labour force with the total adult population. Many students think the rate is unemployed / total adults, but that is incorrect because it includes people not participating.
- Thinking the denominator is the number of employed (full‑time only). This omits part‑time workers and the unemployed themselves, giving a distorted figure.
- Failing to recognise that the numerator and denominator must be consistently defined (both part of the labour force concept).
Things to Be Careful About
- The question tests a pure definition – no calculations or data interpretation are involved.
- Read each option carefully; option A and C contain common pitfalls.
- Memorising the formula exactly is sufficient to answer this type of question.
Aggregate demand in an economy may decrease as a result of an increase in
Options
A consumption expenditure.
B government expenditure.
C import expenditure.
D investment expenditure.
Reasoning
Aggregate demand (AD) is the total planned spending on an economy's goods and services, given by AD = C + I + G + (X – M). An increase in any positive component (C, I, G) raises AD. An increase in import expenditure (M) reduces net exports (X – M), thereby decreasing AD.
Answer
C
C
Background Concept
Aggregate demand (AD) is the total spending on goods and services produced within an economy over a period of time. It is calculated as:
AD = C + I + G + (X – M)
where:
- C = consumption expenditure by households
- I = investment expenditure by firms
- G = government expenditure on goods and services
- X = expenditure on exports by foreigners
- M = expenditure on imports by domestic residents
Exports are an injection into the circular flow of income, while imports are a leakage. An increase in a leakage reduces total spending in the domestic economy.
Understanding the Question
The question asks: 'Aggregate demand in an economy may decrease as a result of an increase in:' followed by four options. It wants you to identify which of the listed changes would cause AD to fall. The four options are increases in consumption, government spending, imports, or investment. You need to recall how each component affects AD and recognise that only an increase in imports (a leakage) reduces AD.
Approach
Start by writing down the AD equation. For each option, decide whether the variable is a positive component (added) or a negative component (subtracted). An increase in a positive component raises AD; an increase in a negative component lowers AD. The only option that is subtracted in the equation is import expenditure.
Step-by-Step Reasoning
- Option A (consumption expenditure): Consumption (C) is added in the AD formula. An increase in C raises AD. Therefore, this cannot be the answer.
- Option B (government expenditure): Government spending (G) is also added. An increase raises AD. Incorrect.
- Option C (import expenditure): Imports (M) are subtracted as part of net exports (X – M). So an increase in M reduces net exports, and hence reduces AD. This is the correct answer.
- Option D (investment expenditure): Investment (I) is added. An increase raises AD. Incorrect.
Thus, the only option that leads to a decrease in AD is an increase in import expenditure.
Key Takeaways
- Know the components of AD and their signs.
- Distinguish between injections (C, I, G, X) and leakages (M, savings, taxes).
- An increase in any leakage will reduce AD, while an increase in any injection will increase AD.
Common Mistakes
- Thinking that an increase in imports could reflect higher domestic demand and therefore increase AD – but imports are a withdrawal; only the net effect matters.
- Confusing net exports (X – M) with exports alone. An increase in M reduces net exports, so AD falls.
- Forgetting that consumption, investment, and government spending are all positive components.
Things to Be Careful About
- Read the question precisely: it asks for a decrease in AD as a result of an increase in the listed variable. Do not reverse the direction.
- Remember that the AD formula is a simple addition/subtraction of the components. No elasticity or other factors are needed for this question.
- Keep the definitions of each component clear: consumption is household spending, investment is capital spending by firms, etc.
A government has a balanced budget. It decides to increase its spending by 10%.
Which increase in government revenue would produce a budget surplus?
Options
A -10%
B 0%
C +10%
D +20%
Answer
A budget surplus occurs when government revenue exceeds government spending. With a balanced budget, revenue equals spending. If spending increases by 10%, revenue must increase by more than 10% to create a surplus. A 20% increase in revenue achieves this.
Answer
D
D
Background Concept
A government's budget position is the difference between its total revenue (mainly from taxes) and its total spending. There are three possible states:
- Balanced budget: Revenue = Spending
- Budget deficit: Spending > Revenue
- Budget surplus: Revenue > Spending
The question starts with a balanced budget, meaning revenue and spending are equal at the outset.
Understanding the Question
The question presents a scenario where a government initially has a balanced budget. It then increases its spending by 10%. The question asks which of the four given percentage increases in government revenue would produce a budget surplus. This is a straightforward test of understanding the definition of a budget surplus and applying it to a simple numerical change.
Approach
- Establish the initial condition: Revenue = Spending.
- Apply the 10% increase in spending.
- Determine the new level of spending.
- For a surplus, the new revenue must be greater than the new spending.
- Calculate the percentage increase in revenue needed to exceed the new spending level.
Step-by-Step Reasoning
Let's use a simple numerical example to make it clear.
-
Initial State (Balanced Budget):
- Let initial government spending = 100 units.
- Let initial government revenue = 100 units.
- Budget = Revenue - Spending = 100 - 100 = 0 (balanced).
-
After the Spending Increase:
- Government spending increases by 10%.
- New government spending = 100 + (10% of 100) = 100 + 10 = 110 units.
-
Condition for a Budget Surplus:
- A budget surplus requires: New Revenue > New Spending.
- Therefore, New Revenue must be greater than 110 units.
-
Evaluating the Options:
- Option A (-10%): New Revenue = 100 - 10 = 90 units. 90 < 110. This is a deficit.
- Option B (0%): New Revenue = 100 units. 100 < 110. This is a deficit.
- Option C (+10%): New Revenue = 100 + 10 = 110 units. 110 = 110. This is a balanced budget.
- Option D (+20%): New Revenue = 100 + 20 = 120 units. 120 > 110. This is a surplus.
Therefore, only a 20% increase in revenue will produce a budget surplus.
Key Takeaways
- The core definitions of budget surplus, deficit, and balance are essential.
- A surplus requires revenue to be strictly greater than spending.
- If spending increases, revenue must increase by a larger percentage to maintain a surplus (or even to return to a balance).
Common Mistakes
- Confusing surplus with balance: A student might think that matching the spending increase (+10%) would restore the balance, but this only returns to a balanced budget, not a surplus.
- Misreading the question: The question asks for a surplus, not a balanced budget. Option C is a common distractor for this reason.
- Not applying the initial condition: Forgetting that the budget was initially balanced and treating the 10% increase in spending as an absolute value rather than a relative change.
Things to Be Careful About
- Pay close attention to the precise wording of the question. The difference between a balanced budget and a surplus is critical.
- When working with percentages, it's often helpful to assign a numerical value (like 100) to the initial figure to make the calculation concrete and avoid errors.
An economy has an unemployment rate of 8%, an increase of 2% from the previous year. At the same time, the current account deficit rose from 3% of GDP to 4% of GDP.
What would be most likely to reduce both unemployment and the current account deficit?
Options
A decrease government spending
B depreciation of the currency
C increase indirect taxation
D increase interest rates
Answer
A depreciation of the currency makes exports cheaper in foreign currency and imports dearer in domestic currency. This increases the quantity of exports demanded and reduces the quantity of imports demanded, improving the current account balance. The rise in net exports increases aggregate demand (AD = C + I + G + X - M), shifting the AD curve rightwards. Higher AD raises real output and employment, reducing unemployment. Therefore, option B is correct.
Answer
B
B
Background Concept
This question tests the macroeconomic effects of exchange rate changes and their impact on two key policy objectives: reducing unemployment and improving the current account balance. A depreciation (or devaluation under a fixed system) makes the domestic currency cheaper relative to foreign currencies. This has two immediate effects: exports become cheaper for foreign buyers, and imports become more expensive for domestic consumers. The resulting change in net exports (X - M) affects both aggregate demand and the current account.
The current account records trade in goods and services, primary income, and secondary income. A deficit means the value of imports exceeds exports plus net income flows. Reducing a current account deficit requires either increasing exports, decreasing imports, or both.
Unemployment can be cyclical (caused by insufficient aggregate demand) or structural (caused by mismatches in the labour market). A depreciation primarily addresses cyclical unemployment by boosting aggregate demand.
Understanding the Question
The question presents an economy with two simultaneous problems: unemployment has risen to 8% (up 2 percentage points), and the current account deficit has widened from 3% to 4% of GDP. The task is to identify which single policy option is most likely to reduce BOTH problems. This is a classic policy conflict question — many policies that reduce unemployment (like expansionary fiscal policy) tend to worsen the current account by increasing imports, while policies that improve the current account (like contractionary monetary policy) tend to increase unemployment.
The four options are:
- A: Decrease government spending (contractionary fiscal policy)
- B: Depreciation of the currency
- C: Increase indirect taxation (contractionary fiscal policy)
- D: Increase interest rates (contractionary monetary policy)
Options A, C, and D are all contractionary policies that would reduce aggregate demand, worsening unemployment. Only option B offers a mechanism that can potentially address both objectives simultaneously.
Approach
- Identify the mechanism of each policy option
- Trace the chain of causation for each option on both unemployment and the current account
- Determine which option has the potential to improve both variables
- Consider any limitations or conditions (e.g., Marshall-Lerner condition, time lags)
Step-by-Step Reasoning
Option A: Decrease government spending
- This is contractionary fiscal policy
- Lower G reduces aggregate demand (AD shifts left)
- Lower AD reduces real output and employment, increasing unemployment
- Lower AD also reduces imports (as incomes fall), which could improve the current account
- However, the net effect on unemployment is clearly negative, so this fails the requirement to reduce unemployment
Option B: Depreciation of the currency
- A depreciation makes exports cheaper in foreign currency terms
- It makes imports more expensive in domestic currency terms
- If the Marshall-Lerner condition holds (sum of PED for exports and imports > 1), the current account improves in the long run
- The increase in net exports (X - M) shifts AD rightwards
- Higher AD raises real output, reducing cyclical unemployment
- This is the only option that can potentially improve both variables simultaneously
Option C: Increase indirect taxation
- Higher indirect taxes reduce disposable income and consumption
- This reduces AD, increasing unemployment
- Lower AD reduces imports, potentially improving the current account
- But again, unemployment worsens, so this fails
Option D: Increase interest rates
- Higher interest rates reduce consumption and investment (C and I fall)
- This reduces AD, increasing unemployment
- Higher rates may also attract hot money inflows, causing the currency to appreciate, which worsens the current account
- This fails on both counts
Why B is the best answer:
- Depreciation directly addresses the current account deficit by making exports cheaper and imports dearer
- The resulting increase in net exports boosts AD, creating jobs and reducing unemployment
- This is the only option that works through expanding output rather than contracting it
Limitations to consider (but not required for the MCQ):
- The Marshall-Lerner condition must hold for the current account to improve
- There may be a J-curve effect where the current account initially worsens before improving
- Depreciation can cause cost-push inflation (imported inflation), which may require policy responses
- The effectiveness depends on the price elasticity of demand for exports and imports
Key Takeaways
- A currency depreciation can simultaneously address a current account deficit and cyclical unemployment by boosting net exports and aggregate demand
- Most contractionary policies (fiscal or monetary) that improve the current account do so by reducing incomes and imports, which worsens unemployment
- The Marshall-Lerner condition and J-curve effect are important qualifications to the simple theory
- This question illustrates the common policy conflict between internal balance (unemployment) and external balance (current account)
Common Mistakes
- Choosing a contractionary policy (A, C, or D) thinking it will reduce imports and improve the current account, while ignoring the negative impact on unemployment
- Confusing depreciation with appreciation — a depreciation makes exports cheaper, not more expensive
- Thinking that higher interest rates attract capital inflows and strengthen the currency, which would worsen the current account (the opposite of what is needed)
- Not recognising that the question asks for the option that reduces BOTH problems, not just one
Things to Be Careful About
- Distinguish between depreciation (market-driven fall in value under floating rates) and devaluation (government-set reduction under fixed rates) — the economic effects are the same
- Remember that the current account improvement from depreciation is not automatic; it depends on elasticities and time periods
- In an MCQ, trace the full chain of causation for each option before selecting — don't jump to a conclusion based on one effect
- Note that the question says "most likely" — acknowledging that there are conditions and limitations, but B is clearly the best option among the four
The diagram shows aggregate demand (AD) curves for an economy.
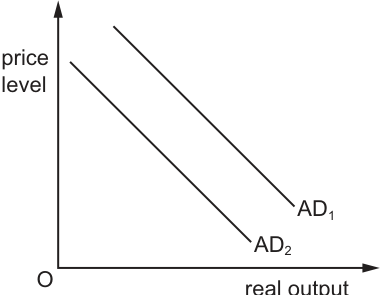
Which combination is most likely to have caused the shift from AD1 to AD2?
Options
| income tax | sales tax | |
|---|---|---|
| A | decrease | decrease |
| B | decrease | increase |
| C | increase | decrease |
| D | increase | increase |
Reasoning
The diagram shows aggregate demand shifting leftwards from AD1 to AD2, meaning total spending in the economy has fallen at every price level.
An increase in income tax reduces households' disposable income, which lowers consumption (C). An increase in sales tax raises the price of goods, also reducing consumption. Both tax rises are contractionary fiscal policy that decrease aggregate demand.
Only option D combines an increase in income tax with an increase in sales tax.
Answer
D
D
Background Concept
Aggregate demand (AD) represents the total demand for goods and services in an economy at a given price level. It is composed of consumption (C), investment (I), government spending (G), and net exports (X - M): AD = C + I + G + (X - M). Fiscal policy — changes in government taxation and spending — is a key determinant of AD. An increase in direct taxes such as income tax reduces disposable income, lowering consumption. An increase in indirect taxes such as sales tax raises the price of goods, also reducing real consumption. Both actions shift the AD curve to the left (a contractionary effect). Conversely, tax cuts shift AD to the right (expansionary).
Understanding the Question
The question presents a diagram (Fig. 22.1) showing two parallel downward-sloping AD curves. AD2 lies to the left of AD1, indicating that aggregate demand has decreased. The question asks which combination of changes to income tax and sales tax is most likely to have caused this leftward shift. This is a 1-mark multiple-choice question testing the candidate's ability to link fiscal policy instruments to their effect on the AD curve.
Approach
First, identify the direction of the shift: AD1 to AD2 is a leftward (inward) shift, meaning AD has fallen. Second, recall the effect of each tax on AD: higher income tax reduces disposable income and consumption; higher sales tax reduces consumption by raising prices. Both are contractionary. Third, scan the options for the combination where both taxes increase. That combination is option D.
Step-by-Step Reasoning
- Interpret the diagram: The vertical axis is the price level and the horizontal axis is real output. AD2 is to the left of AD1. A leftward shift of the AD curve means that at any given price level, the quantity of real output demanded is lower. This reflects a fall in aggregate demand.
- Analyse income tax: Income tax is a direct tax on household earnings. When income tax increases, households have less disposable income (income after tax). With less disposable income, they spend less on consumption. Since consumption is a component of AD (AD = C + I + G + X - M), a fall in C shifts the AD curve to the left.
- Analyse sales tax: Sales tax (an indirect tax) is added to the price of goods and services. When sales tax increases, the price paid by consumers rises. This reduces the real purchasing power of consumers' income, leading to a fall in consumption. Again, lower C shifts AD to the left.
- Combine the effects: Both an increase in income tax and an increase in sales tax reduce consumption and therefore shift AD leftwards. The question asks for the combination most likely to have caused the shift from AD1 to AD2. Option D (income tax increase, sales tax increase) is the only option where both taxes rise, producing the required leftward shift.
- Eliminate other options:
- Option A (both decrease) would be expansionary, shifting AD right.
- Option B (income tax decrease, sales tax increase) has opposing effects; the net impact is ambiguous and unlikely to produce a clear leftward shift unless the sales tax effect dominates, but the question asks for the combination most likely to have caused the shift, and D is unambiguously contractionary.
- Option C (income tax increase, sales tax decrease) also has opposing effects.
Key Takeaways
- A leftward shift of the AD curve indicates a decrease in aggregate demand.
- Both direct taxes (income tax) and indirect taxes (sales tax) reduce consumption when increased, shifting AD left.
- Contractionary fiscal policy involves higher taxes and/or lower government spending.
- When interpreting AD/AS diagrams, always identify the direction of the shift before linking it to policy causes.
Common Mistakes
- Confusing the direction of the shift: Some candidates may misread the diagram and think AD2 is to the right of AD1, or confuse a leftward shift with an increase in AD. The label positions and the downward slope make clear that AD2 is left of AD1.
- Thinking sales tax increases shift AD right: Because sales tax is a government levy, students sometimes incorrectly associate any tax with government revenue and higher AD. However, the immediate effect of a sales tax is to reduce private consumption, shifting AD left.
- Ignoring the combination requirement: The question asks for a combination of both taxes. Selecting an option where only one tax changes (or where they change in opposite directions) fails to explain the unambiguous leftward shift shown.
Things to Be Careful About
- Ensure you read the diagram carefully: the curve further to the left (AD2) represents lower demand.
- Distinguish between a shift of the AD curve (caused by changes in its components) and a movement along the AD curve (caused by a change in the price level). Tax changes shift the curve; they do not cause a movement along it.
- In multiple-choice questions, select the option that is unambiguously consistent with the diagram. Option D is the only one where both tax changes are contractionary.
What can be considered an expansionary supply-side policy?
Options
A an increase in government expenditure on training
B an increase in sales tax
C an increase in the rate of interest
D an increase of the exchange rate
Reasoning
Expansionary supply-side policy is designed to increase the productive capacity of the economy, shifting the LRAS curve to the right. Option A, an increase in government expenditure on training, improves the skills and productivity of the labour force, which enhances the economy's potential output. Option B (increase in sales tax) is a contractionary fiscal policy that reduces aggregate demand. Option C (increase in the rate of interest) is a contractionary monetary policy that reduces aggregate demand. Option D (increase of the exchange rate) makes exports more expensive and imports cheaper, which tends to reduce aggregate demand. Therefore, only A is an expansionary supply-side policy.
Answer
A
A
Background Concept
Supply-side policy refers to government measures aimed at increasing the productive capacity of the economy. The key objective is to shift the long-run aggregate supply (LRAS) curve to the right, enabling higher levels of output without causing inflation. Expansionary supply-side policies include measures that improve the quality and quantity of factors of production, such as training programmes to enhance human capital, infrastructure investment, and support for technological innovation. These policies differ from demand-side policies (fiscal and monetary), which target aggregate demand, and from exchange rate policies, which affect international competitiveness.
Understanding the Question
This multiple-choice question asks you to identify which of four policy measures can be classified as an expansionary supply-side policy. The options span different areas of macroeconomic intervention: government spending on training (A), a tax increase (B), an interest rate increase (C), and an exchange rate appreciation (D). You must apply the definition of supply-side policy and distinguish it from other policy types. The correct answer is the one that directly increases the economy's productive capacity by improving the labour supply or its productivity.
Approach
Recall that supply-side policies are those that increase the potential output of the economy by making markets work more efficiently or by increasing the quantity or quality of factors of production. Evaluate each option in turn: does it improve factor productivity, increase the labour force, encourage investment, or shift LRAS right? If a policy primarily affects aggregate demand, it is not a supply-side policy. Also note that expansionary supply-side policies differ from contractionary supply-side policies (e.g., deregulation sometimes can be contractionary, but in this context all options are clearly either supply-side or demand-side).
Step-by-Step Reasoning
-
Option A: an increase in government expenditure on training. This is a classic supply-side measure. Training improves the skills of the workforce, leading to higher labour productivity. This increases the productive capacity of the economy, shifting LRAS right. Government spending financed by borrowing or taxation can be fiscal policy, but when it is specifically targeted at improving factor quality, it qualifies as supply-side policy. Hence, this is expansionary supply-side.
-
Option B: an increase in sales tax. A sales tax (indirect tax) reduces disposable income and consumption, shifting AD left. This is a contractionary fiscal policy, not a supply-side measure. It does not directly affect LRAS. Therefore, not expansionary supply-side.
-
Option C: an increase in the rate of interest. Interest rates are a tool of monetary policy. A rise in interest rates discourages borrowing and spending, reducing AD. This is a contractionary monetary policy. It may indirectly affect investment in the long run, but its primary impact is on aggregate demand, and it is not classified as supply-side policy.
-
Option D: an increase of the exchange rate. An appreciation of the exchange rate makes exports more expensive and imports cheaper. This tends to reduce net exports, shifting AD left. It may also affect the supply side by making imported raw materials cheaper, but the net effect is generally considered contractionary on the economy, and it is not typically classified as supply-side policy. The direct objective of exchange rate adjustment is to manage the balance of payments or the price level, not to increase productive capacity.
Thus, only option A is a clear example of an expansionary supply-side policy.
Key Takeaways
- Supply-side policies aim to increase productive capacity and shift LRAS right.
- Common tools include training, infrastructure, tax reforms (though not all tax changes are supply-side), deregulation, and technology support.
- Distinguish supply-side from demand-side policies: fiscal and monetary policies primarily affect AD.
- When answering MCQs, focus on the objective of the policy and its effect on LRAS, not just on the instrument used.
Common Mistakes
- Confusing any increase in government spending as fiscal policy. While government spending is a fiscal instrument, its purpose matters. Spending on training aimed at improving productivity is supply-side policy. Spending on public sector wages or transfer payments is typically consumption and part of fiscal policy. The question tests this distinction.
- Thinking that tax cuts are always supply-side. Tax cuts can be both demand-side (boosting AD) and supply-side (incentivising work/investment). In this question, sales tax increase is clearly demand-side contractionary.
- Assuming interest rate changes affect supply. Interest rates affect the cost of borrowing for investment, but their primary use is demand management. In the short run, their effect on AS is limited. The standard classification treats interest rate changes as monetary policy.
Things to Be Careful About
- Read the description of each policy carefully: 'increase in government expenditure on training' is specifically about training, not general spending.
- Do not confuse exchange rate policy with supply-side policy. Exchange rate changes affect competitiveness and import prices but are not primarily aimed at increasing productive capacity.
- Remember that 'expansionary' in supply-side context means increasing capacity, not boosting aggregate demand. A policy that reduces costs for firms (e.g., deregulation) is also expansionary supply-side.
In this MCQ, the key was to recognise that training improves the quality of labour, a factor of production, directly increasing the economy's potential output.
The table indicates the factor inputs required to produce wheat and cars in countries X and Y.
| units of factor inputs to produce one tonne of wheat | units of factor inputs to produce one car | |
|---|---|---|
| country X | 4 | 2 |
| country Y | 8 | 6 |
What makes it possible for both countries to benefit from trade?
Options
A Country X has an absolute advantage in wheat and car production.
B Country Y has an absolute advantage in wheat and car production.
C Country Y has a comparative advantage in wheat production.
D Opportunity cost of wheat and car production is the same between countries.
Working
Country X: opportunity cost of 1 tonne of wheat = 4 inputs / 2 inputs per car = 2 cars.
Country Y: opportunity cost of 1 tonne of wheat = 8 inputs / 6 inputs per car = 1.33 cars.
Since 1.33 < 2, Country Y has a lower opportunity cost of wheat production – a comparative advantage in wheat.
Country X has the comparative advantage in cars (0.5 wheat per car vs 0.75 in Y).
Gains from trade are possible when countries specialise in the good in which they have a comparative advantage and then trade. The fact that Country Y has a comparative advantage in wheat (option C) is one half of that necessary condition; the other half (X’s advantage in cars) is implied by the data.
Answer
C
C
Background Concept
Two countries can gain from trade if they have different opportunity costs of production. The concept of comparative advantage (David Ricardo) states that a country should specialise in the good it can produce at a lower relative cost – even if it is less efficient in absolute terms at producing everything. The opportunity cost of a good is the quantity of the other good that must be sacrificed to produce one more unit of the first good. When opportunity costs differ, total world output can rise through specialisation and trade, enabling both countries to consume beyond their own production possibility frontiers.
Understanding the Question
The table gives the units of factor inputs needed to produce one tonne of wheat and one car in countries X and Y. Inputs are the same factor (e.g. labour hours), so we can directly compare efficiency. The question asks: What makes it possible for both countries to benefit from trade? That is, which of the four options correctly identifies the condition that leads to mutual gains?
Option A states a factual truth (X needs fewer inputs for both goods – absolute advantage). Option B is factually false. Option C states that Y has a comparative advantage in wheat. Option D claims that opportunity costs are the same – which would eliminate the basis for trade. We need to evaluate each in light of the theory of comparative advantage.
Approach
- Compute the opportunity cost of wheat in each country (inputs for wheat divided by inputs for a car).
- Compute the opportunity cost of a car in each country (inputs for a car divided by inputs for wheat).
- Compare the opportunity costs to see which country has the lower cost for each good.
- Explain why the existence of different opportunity costs (comparative advantage) is the source of gains from trade, and why absolute advantage alone (option A) is not sufficient.
- Conclude that option C is correct – Y’s comparative advantage in wheat is part of the difference that makes mutual gains possible.
Step-by-Step Reasoning
Step 1 – Opportunity cost in Country X
To produce 1 tonne of wheat, X uses 4 units of input. With those same 4 units, X could produce cars: 4 units ÷ 2 units per car = 2 cars. So the opportunity cost of 1 wheat in X = 2 cars.
To produce 1 car, X uses 2 units. Those 2 units could have produced 2÷4 = 0.5 tonnes of wheat. So opportunity cost of 1 car in X = 0.5 wheat.
Step 2 – Opportunity cost in Country Y
To produce 1 tonne of wheat, Y uses 8 units. With 8 units it could produce 8÷6 = 4/3 ≈ 1.333 cars. So opportunity cost of 1 wheat in Y = 1.333 cars.
To produce 1 car, Y uses 6 units; those 6 units could produce 6÷8 = 0.75 wheat. So opportunity cost of 1 car in Y = 0.75 wheat.
Step 3 – Identifying comparative advantage
- Wheat: X’s cost = 2 cars, Y’s cost = 1.333 cars. Y’s cost is lower → Y has a comparative advantage in wheat.
- Cars: X’s cost = 0.5 wheat, Y’s cost = 0.75 wheat. X’s cost is lower → X has a comparative advantage in cars.
Step 4 – Why this leads to gains from trade
If each country specialises in the good where it has a comparative advantage – Y in wheat, X in cars – the combined output of both goods can be higher than if each produced both. Through trade, both can then consume a mix that lies beyond their unspecialised production possibilities. This is the classic Ricardo model. The difference in opportunity costs (not the absolute advantage) is the engine of mutual benefit.
Step 5 – Evaluating the options
- Option A: “Country X has an absolute advantage in wheat and car production.” This is correct from the data (X uses 4 vs 8 for wheat, 2 vs 6 for cars). However, absolute advantage alone does not guarantee gains from trade. If X had a comparative advantage in both goods (identical opportunity cost ratios), no gains would arise. Since X does not have a comparative advantage in both, the statement is true but does not answer the question – the mere fact of absolute advantage is not what makes trade beneficial.
- Option B: “Country Y has an absolute advantage in wheat and car production.” This is false – Y uses more inputs for both.
- Option C: “Country Y has a comparative advantage in wheat production.” As shown, this is true, and it is part of the necessary condition for mutual gains. (The other part, that X has a comparative advantage in cars, is the mirror image.) Among the options, C is the only one that correctly identifies a comparative advantage, which is the foundation for beneficial trade.
- Option D: “Opportunity cost of wheat and car production is the same between countries.” This is false – we calculated 2 vs 1.333 for wheat, 0.5 vs 0.75 for cars. If it were true, there would be no gains from trade, making the statement the opposite of what makes trade beneficial.
Step 6 – Conclusion
Option C is correct. It identifies a comparative advantage that, together with the other country’s comparative advantage in the other good, creates the opportunity for specialisation and trade. The question’s phrasing (“What makes it possible…”) is most directly satisfied by the existence of differing comparative advantages, expressed here through one of them.
Key Takeaways
- Gains from trade arise from comparative advantage (differences in opportunity costs), not from absolute advantage.
- To find comparative advantage, compute the opportunity cost of each good in each country and compare across countries.
- A country has a comparative advantage in a good if it has a lower opportunity cost of producing that good than the other country.
- Even a country with absolute disadvantage in everything can still gain from trade if it specialises in the good where its opportunity cost is lower.
Common Mistakes
- Thinking that absolute advantage is the basis for gains from trade. Many students pick option A because it is a true statement, but the question asks for the reason trade is beneficial, not just a fact about the data.
- Miscalculating opportunity costs from input data. Some students incorrectly divide output by input or forget to invert when moving from input requirements to opportunity cost. Always ask: “If I use these inputs to produce one good, how much of the other good am I sacrificing?”
- Believing that if one country has absolute advantage in both, there is no point in trading. This is a common misconception – comparative advantage can still exist and generate gains.
- Assuming that if opportunity costs are different, only one country benefits. In reality, both can benefit through appropriate terms of trade.
Things to Be Careful About
- Input data vs output data: The table shows inputs per unit of output. To find opportunity cost in terms of the other good, divide the input requirement of the good in question by the input requirement of the other good. For example, opportunity cost of wheat = (inputs for wheat) / (inputs for car).
- Read the question carefully: It asks what makes it possible for both to benefit. The direct answer is the existence of different opportunity costs, but the options only offer statements about absolute/comparative advantages. Option C, while it names only one comparative advantage, is the only option that correctly refers to comparative advantage and is factually correct.
- In multiple-choice questions, sometimes more than one option may be a true statement (here A and C are both true). Choose the one that answers the specific question asked. Option A is a true fact but does not explain why trade benefits both; option C does.
- Ensure you compute opportunity costs accurately: For wheat in Y, 8/6 = 4/3 ≈ 1.33; for X, 4/2 = 2. These ratios confirm Y’s lower cost for wheat.
A government decides to allow the country’s currency to depreciate to remove the deficit on its current account of the balance of payments.
What is the most likely reason why this would not work?
Options
A The country gains a competitive advantage from the depreciation.
B The country has a surplus on its capital and financial accounts.
C The price elasticities of demand for the country’s exports and imports are greater than one.
D There are high trade barriers with the country’s main trading partners.
Reasoning
Currency depreciation makes exports cheaper in foreign currency and imports more expensive in domestic currency. This tends to increase export volumes and reduce import volumes, improving the current account. However, the Marshall-Lerner condition states that this improvement occurs only if the sum of the price elasticities of demand for exports and imports is greater than one. Option C states elasticities greater than one, which would actually help depreciation work, so it is not a reason for failure. Option A (gaining competitive advantage) is a benefit, not a hindrance. Option B (surplus on capital and financial accounts) is unrelated to the current account effect. Option D: high trade barriers imposed by main trading partners can prevent export volumes from rising even though they become cheaper, because barriers such as tariffs or quotas restrict market access. Similarly, barriers may also constrain the reduction in imports. Therefore, trade barriers are the most likely reason depreciation would not eliminate the current account deficit.
Answer
D
D
Background Concept
Currency depreciation and the current account: When a currency depreciates, exports become cheaper for foreign buyers and imports become more expensive for domestic consumers. This should increase the volume of exports and decrease the volume of imports, improving the current account balance. However, the extent of the volume response depends on the price elasticities of demand for exports and imports (the Marshall-Lerner condition). Additionally, even if elasticities are favourable, other factors such as trade barriers can prevent the volume adjustments.
Understanding the Question
The question presents a policy of depreciation intended to remove a current account deficit. It asks for the most likely reason why this policy might fail. The four options test knowledge of: (A) competitive advantage – which is a potential benefit, not a failure; (B) capital and financial account surplus – which is a separate account and does not directly affect the current account impact; (C) elasticities greater than one – which according to Marshall-Lerner would actually make depreciation effective; (D) high trade barriers with main trading partners – which could block export expansion.
Approach
To answer, we need to recall what conditions are necessary for depreciation to improve the current account. The Marshall-Lerner condition is the key theoretical condition. Options that would help depreciation work can be eliminated. Options irrelevant to the current account mechanism can also be eliminated. Only one option presents a plausible barrier to the mechanism: trade barriers limiting the volume response.
Step-by-Step Reasoning
- Currency depreciation reduces the foreign price of exports. If trade barriers (tariffs, quotas, non-tariff barriers) are imposed by trading partners, the effective price paid by foreign consumers may not fall by the full amount of depreciation (e.g., if an ad valorem tariff is applied, the tariff amount may increase to offset the cheaper price, or quotas may limit the quantity that can be sold regardless of price). Thus export volumes may not increase.
- Imports become more expensive, so domestic consumers switch to domestic substitutes, reducing import volumes. However, if the country itself maintains high trade barriers on imports, import volumes may already be restricted, so the depreciation-induced reduction in imports may be limited. But the option refers to barriers with the country’s main trading partners, meaning those partners impose barriers on this country’s exports, so the export effect is hindered.
- Therefore, high trade barriers (option D) are a realistic reason why depreciation fails to improve the current account.
- Option C is incorrect because high elasticities (>1) satisfy Marshall-Lerner and would facilitate improvement.
- Option A is wrong because competitive advantage enhances the effect.
- Option B is irrelevant: the capital and financial account surplus does not prevent the current account from improving; it is a different account, and there is no direct causal hindrance.
Key Takeaways
- Currency depreciation improves the current account only if the Marshall-Lerner condition holds (PEDx + PEDm > 1).
- Even if elasticities are high, trade barriers can obstruct the volume response, so the policy may fail.
- Barriers imposed by trading partners limit export expansion.
- The Marshall-Lerner condition is a critical tool for evaluating exchange rate policy.
- When assessing why a policy fails, look for factors that block the transmission mechanism.
Common Mistakes
- Assuming that elasticities greater than one prevent improvement (actually they help).
- Confusing current account with capital account; a capital account surplus does not counteract the current account effect.
- Thinking that gaining competitive advantage is a reason for failure.
Things to Be Careful About
- Read the question precisely: it asks for the most likely reason depreciation would not work. D is the only option that introduces an obstacle.
- The Marshall-Lerner condition is about elasticities; trade barriers are a separate constraint.
- In multiple-choice questions, eliminate options that are clearly supportive or irrelevant.
When must the terms of trade of a country change?
Options
A when the volume of exports falls and the volume of imports rises
B when the total value of exports falls and the total value of imports rises
C when the balance of trade in goods moves from deficit to surplus
D when the average price of exports rises and the average price of imports falls
Reasoning
The terms of trade are defined as the ratio of export prices to import prices (often expressed as an index). A change in the terms of trade must arise from a change in export prices, import prices, or both. Options A, B, and C involve changes in volumes, values, or the trade balance, which can occur without any change in the price ratio. Only option D states a change in both export and import prices in opposite directions, which necessarily alters the ratio.
Answer
D
D
Background Concept
The terms of trade measure the relative price of a country's exports compared to its imports. The most common definition is the commodity terms of trade or net barter terms of trade, calculated as:
Index of average export prices / Index of average import prices × 100
If this ratio increases, the terms of trade have improved (each unit of exports can buy more imports); if it decreases, they have deteriorated. It is a pure price ratio, not a measure of trade volumes or values. A change in the terms of trade must arise from a change in export prices, import prices, or both.
Understanding the Question
The question asks "When must the terms of trade of a country change?" The key word is "must" – we need the event that necessarily (under any circumstances) causes the terms of trade to change. We are given four options involving changes in export/import volumes, values, trade balance, or prices. We must identify which one guarantees a change in the price ratio.
Approach
Recall the definition of terms of trade as the ratio of export prices to import prices. Evaluate each option to see if it necessarily alters that ratio. If an option could occur without any change in the relative prices of exports and imports, it is not a "must" condition.
Step-by-Step Reasoning
- Option A: Volume of exports falls and volume of imports rises. Volumes do not appear in the terms of trade formula. A change in volumes alone leaves the ratio of prices unchanged. Therefore, terms of trade do not necessarily change. For example, if export prices and import prices remain the same, the terms of trade are constant.
- Option B: Total value of exports falls and total value of imports rises. Total value = price × quantity. The fall in export value could be due to lower export prices OR lower export volumes (or both). Similarly, the rise in import value could be due to higher import prices OR higher import volumes. It is possible that the change in total values arises entirely from volume changes, with prices unchanged. Hence, no necessary change in terms of trade.
- Option C: The balance of trade in goods moves from deficit to surplus. The trade balance is the difference between export values and import values. A switch from deficit to surplus can occur through changes in volumes, prices, or both. For example, a country could export much more at the same prices while importing less at the same prices – the terms of trade would be unchanged. So no necessary change.
- Option D: Average price of exports rises and average price of imports falls. This directly alters the numerator and denominator of the terms of trade ratio. The ratio must change. Even if only one of these price changes occurs, the terms of trade would change, but the option includes both, making the change certain.
Thus, only option D guarantees a change in the terms of trade.
Key Takeaways
- The terms of trade are a pure price concept; they are not directly affected by quantities or values.
- Distinguish between terms of trade, trade balance, and trade volumes.
- The word "must" in multiple-choice questions requires an event that inevitably leads to the outcome.
Common Mistakes
- Confusing "terms of trade" with "balance of trade" or "trade balance". For example, a student might think that a trade deficit turning into a surplus necessarily improves the terms of trade, but it does not if the change is due to volume rather than price.
- Believing that a change in export values automatically means a change in export prices – ignoring the role of quantity.
- Forgetting that the terms of trade is a ratio, so both export and import prices matter.
Things to Be Careful About
- Always check the exact definition of the term being tested.
- In multiple-choice questions, look for the condition that is both necessary and sufficient for the specified outcome.
- Pay attention to the word "must" – it means the condition is sufficient, not just possible.
The table shows an extract from a country’s balance of payments.
| exports $ billion | imports $ billion | |
|---|---|---|
| trade in goods | 150 | 200 |
| trade in services | 70 | 50 |
| primary (investment) income | 120 | 100 |
| secondary (transfer) income | 15 | 20 |
What is the current account balance?
Options
A -$10bn
B -$15bn
C -$30bn
D -$50bn
Working
Current account balance = (exports – imports) for each component:
Trade in goods: 150 – 200 = –$50bn
Trade in services: 70 – 50 = +$20bn
Primary income: 120 – 100 = +$20bn
Secondary income: 15 – 20 = –$5bn
Total = –$50 + $20 + $20 – $5 = –$15bn
Answer
B
B
Background Concept
The current account of the balance of payments records all transactions in goods, services, and income flows between residents of one country and the rest of the world. It has four main components:
- Trade in goods: exports and imports of physical products.
- Trade in services: exports and imports of intangible services (e.g. tourism, banking).
- Primary income: investment income (profits, dividends, interest) and compensation of employees earned abroad.
- Secondary income: current transfers such as foreign aid, remittances, and gifts.
The balance on each component is exports minus imports. The current account balance is the sum of these four balances. A negative balance indicates a deficit (more spending abroad than earnings from abroad), and a positive balance indicates a surplus.
Understanding the Question
The table provides export and import data (in $bn) for each of the four current account components. The question asks for the overall current account balance. This is a straightforward arithmetic task: compute each component's net balance and sum them. The answer options are four negative numbers, so a deficit is expected.
Approach
- For each row in the table, subtract imports from exports.
- Add the four results together.
- Match the total to one of the four options.
Step-by-Step Reasoning
- Trade in goods: exports 150 – imports 200 = –50 (a deficit in goods trade).
- Trade in services: exports 70 – imports 50 = +20 (a surplus in services trade).
- Primary income: exports 120 – imports 100 = +20 (net inflow of investment income).
- Secondary income: exports 15 – imports 20 = –5 (net outflow of transfers).
Adding them: –50 + 20 = –30; –30 + 20 = –10; –10 – 5 = –15. The current account balance is –$15bn.
Thus option B is correct.
Key Takeaways
- The current account balance is not just the trade balance (goods + services); it also includes primary and secondary income flows.
- Always sum the net balances of all four components, not just goods and services.
- Pay careful attention to signs: deficits are negative, surpluses positive.
Common Mistakes
- Forgetting to include primary and secondary income, leading to an answer of –$30bn (option C), which is only goods + services (–50+20 = –30).
- Misreading the table: e.g., subtracting exports from imports instead of the other way round, or summing exports and imports separately rather than netting each component.
- Arithmetic error when adding the signed numbers.
Things to Be Careful About
- Ensure you use the correct columns: exports minus imports.
- Keep units consistent (all figures are $bn).
- Double-check the sign and magnitude of the final answer before selecting an option.
The table shows the goods balance and services balance for a country in selected years.
| year | goods balance $ billion | services balance $ billion |
|---|---|---|
| 2015 | +120 | -30 |
| 2016 | +110 | -30 |
| 2017 | +50 | -10 |
| 2018 | +130 | -60 |
| 2019 | +140 | -50 |
Between which years did the overall goods and services balance change the most?
Options
A 2015–2016
B 2016–2017
C 2017–2018
D 2018–2019
Working
For each year, overall goods and services balance = goods balance + services balance.
- 2015: +120 + (-30) = +90
- 2016: +110 + (-30) = +80
- 2017: +50 + (-10) = +40
- 2018: +130 + (-60) = +70
- 2019: +140 + (-50) = +90
Change between consecutive years:
- 2015–2016: 80 – 90 = –10 (absolute change 10)
- 2016–2017: 40 – 80 = –40 (absolute change 40)
- 2017–2018: 70 – 40 = +30 (absolute change 30)
- 2018–2019: 90 – 70 = +20 (absolute change 20)
The largest absolute change is 40, which occurred between 2016 and 2017.
Answer
B
B
Background Concept
The current account of the balance of payments records transactions in goods, services, primary income, and secondary income. The trade balance is the net of exports and imports. A goods balance of +120bn means exports exceed imports by that amount; a services balance of -30bn means imports of services exceed exports. The combined goods and services balance is often referred to as the 'trade balance' or 'balance on trade in goods and services'. To compare changes over time, we sum the two balances for each year and then calculate the absolute change between years.
Understanding the Question
We are given a table of goods balance and services balance for five years. The question asks: between which years did the overall goods and services balance change the most? 'Change the most' means the largest absolute difference in the combined balance between two consecutive years.
Approach
- For each year calculate the combined goods and services balance.
- Compute the difference (change) between each consecutive pair of years.
- Identify the pair with the largest absolute change.
Importantly, the question does not ask for direction of change (surplus/deficit) but the size of the change.
Step-by-Step Reasoning
- 2015: goods +120, services –30 → overall = +90
- 2016: goods +110, services –30 → overall = +80 → change from 2015: –10 (size 10)
- 2017: goods +50, services –10 → overall = +40 → change from 2016: –40 (size 40)
- 2018: goods +130, services –60 → overall = +70 → change from 2017: +30 (size 30)
- 2019: goods +140, services –50 → overall = +90 → change from 2018: +20 (size 20)
The largest absolute change is 40 between 2016 and 2017. So answer is B.
Key Takeaways
- The overall balance is the sum of its components. Changes in either component affect the total.
- When comparing changes, compute the absolute difference, not just the signed value.
- Simple arithmetic with signed numbers can test attention to detail.
Common Mistakes
- Forgetting to add negative services balances correctly. For 2018: +130 + (-60) = +70, not +190.
- Computing changes only on one component (e.g., only goods balance) and ignoring services.
- Misreading the table: e.g., using 2017 goods balance of +50 but services -10, could mistakenly think overall is +60? Actually +50-10=+40 correct.
- Picking 2015-2016 because the goods balance fell by 10 and services unchanged, but overall change was only 10, not the largest.
Things to Be Careful About
- Always include the sign (positive/negative) when adding.
- 'Change the most' means absolute magnitude; a fall of 40 is larger than a rise of 30.
- The question asks for the two-year interval, not the direction.
The diagram shows the market for both domestic and imported computers for an economy. The world price is p1.
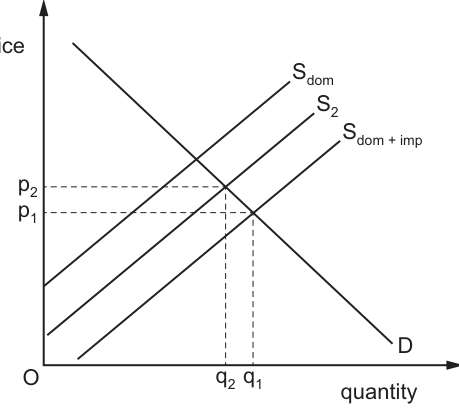
Which government policy would lead to a price of p2?
Options
A an embargo on imports
B an exchange rate appreciation
C a subsidy to domestic producers
B a tariff on imports
Reasoning
The diagram shows the market for computers with domestic supply (Sdom), total supply including imports (Sdom + imp), and downward-sloping demand (D). At the world price p1, total supply intersects demand at quantity q1. A tariff is a tax imposed on imported goods, which raises the cost of imports and reduces the quantity of imports supplied at every price. This shifts the total supply curve leftward from Sdom + imp to S2, creating a new equilibrium at the higher price p2 and lower quantity q2.
Evaluating the other options:
- An embargo would ban all imports entirely, so total supply would equal domestic supply (Sdom), leading to a price higher than p2.
- An exchange rate appreciation makes imports cheaper in domestic currency, shifting total supply right and lowering the price below p1.
- A subsidy to domestic producers lowers their production costs, shifting domestic supply right and reducing the equilibrium price.
Answer
D
D
Background Concept
A tariff is a specific indirect tax levied by a government on each unit of imported goods entering the country. Its primary purpose is to raise the domestic price of imported goods, making domestically produced goods more price-competitive, while also generating government revenue. To analyse the effect of a tariff, we use the demand and supply model for a market that includes both domestic producers and importers: the total supply of the good available to domestic consumers is the horizontal sum of domestic supply (Sdom, the quantity domestic producers are willing to supply at each price) and import supply (the quantity foreign producers are willing to export to the domestic market at each price). This combined supply curve (Sdom + imp) lies to the right of the domestic supply curve alone, as imports add to the total quantity available at each price.
Other relevant government and trade policies have distinct effects: an embargo is a complete legal ban on all imports of a good, eliminating import supply entirely; an exchange rate appreciation occurs when the domestic currency increases in value relative to foreign currencies, making imports cheaper for domestic buyers; a production subsidy is a payment from the government to domestic producers for each unit they produce, lowering their production costs and encouraging higher domestic output.
Understanding the Question
The question provides a demand and supply diagram for the domestic computer market, where the world price (the price at which the country can import computers freely) is p1. It asks which government policy would result in a higher equilibrium price of p2. The diagram shows that p2 is the equilibrium price associated with the S2 supply curve, which lies between the domestic supply curve (Sdom) and the total supply curve including imports (Sdom + imp). The task is to identify which policy shifts the total supply curve to S2, leading to the higher price p2.
Approach
To solve this, we will first recall the effect of each policy option on the total supply of computers in the domestic market, then match the resulting price change to the diagram:
- First, eliminate policies that would lower the price below p1, as the question requires a price increase to p2.
- Next, eliminate policies that would raise the price above p2, as the diagram shows p2 is not the highest possible price.
- The remaining policy will be the one that shifts total supply leftward from Sdom + imp to S2, leading to the equilibrium at p2.
Step-by-Step Reasoning
- Interpret the diagram: The downward-sloping curve D represents domestic demand for computers. Sdom is the supply of computers from domestic producers. Sdom + imp is the total supply available to domestic consumers when imports are allowed freely at the world price. At p1, total supply meets demand at quantity q1, which is the free-trade equilibrium. The S2 curve is a leftward shift from Sdom + imp, representing a reduction in total supply (either from fewer imports, less domestic output, or both). The equilibrium at p2 occurs where S2 intersects demand, at quantity q2 (lower than q1, as expected when supply falls).
- Evaluate Option A (embargo on imports): An embargo is a complete ban on all imports of computers. This would remove import supply entirely, so total market supply would be equal to domestic supply (Sdom). The intersection of Sdom and D would occur at a price higher than p2, as Sdom lies to the left of S2. This does not match the diagram's p2, so Option A is incorrect.
- Evaluate Option B (exchange rate appreciation): An appreciation of the domestic currency means that each unit of domestic currency can purchase more foreign currency. This reduces the domestic currency price of imported computers, so importers are willing to supply more imports at every domestic price. This would shift the total supply curve (Sdom + imp) further to the right, leading to an equilibrium price lower than p1. This is the opposite of the required price increase, so Option B is incorrect.
- Evaluate Option C (subsidy to domestic producers): A production subsidy is a payment from the government to domestic computer producers for each unit they produce. This lowers the production costs of domestic firms, so they are willing to supply more computers at every price. This shifts the domestic supply curve (Sdom) to the right, which would also shift the total supply curve (Sdom + imp) rightward, leading to a lower equilibrium price, not a higher one. So Option C is incorrect.
- Evaluate Option D (tariff on imports): A tariff is a tax imposed on each imported computer. This raises the cost for importers of bringing computers into the domestic market, so they are willing to supply fewer imports at every domestic price. This reduces total supply, shifting the total supply curve leftward from Sdom + imp to S2. The new intersection of S2 and demand is at price p2 and quantity q2, which exactly matches the diagram. This is the correct policy.
Key Takeaways
- A tariff is a tax on imports that raises the domestic price of imported goods, reducing import volumes and shifting total market supply leftward.
- In a market with both domestic and imported supply, the total supply curve is the horizontal sum of domestic supply and import supply at each price. Policies that affect imports shift the total supply curve, while policies that affect domestic production shift the domestic supply curve.
- An embargo eliminates all imports, leading to a higher price than a tariff, which only reduces import volumes.
- Exchange rate appreciations lower import prices, while production subsidies lower domestic production costs, both leading to lower equilibrium prices.
Common Mistakes
- Confusing the effect of a tariff with a production subsidy: a subsidy shifts domestic supply right (lower price), while a tariff shifts total supply left (higher price).
- Misidentifying the supply curves: forgetting that Sdom + imp is the total supply under free trade, so import restrictions shift this curve left, not the domestic supply curve alone.
- Misreading the diagram: assuming p2 is the price associated with the domestic supply curve, when it is actually associated with the S2 curve, which is a leftward shift from the total supply curve, not a shift to the domestic curve.
- Confusing an embargo with a tariff: an embargo bans all imports, leading to a higher price than p2, so it does not match the diagram.
Things to Be Careful About
- Always distinguish between policies that affect import supply (tariffs, embargoes, exchange rate changes) and policies that affect domestic supply (subsidies, production taxes).
- Check the direction of the required price change: the question asks for a policy that raises the price from p1 to p2, so any policy that lowers the price can be immediately eliminated.
- Note that the S2 curve is not the domestic supply curve: it is a leftward shift from the total supply curve, meaning imports are still available but at a higher price, which is exactly the effect of a tariff (not an embargo, which would eliminate imports entirely).
What is not a likely cause of a deficit in the current account of the balance of payments?
Options
A Consumer spending is low.
B Primary incomes in the form of investment income are low.
C The rate of exchange is high.
D Wage costs of production are high.
Answer
A current account deficit means that the value of imports of goods and services plus net outflows of primary and secondary income exceeds exports plus net inflows. Option A states "Consumer spending is low." Low consumer spending tends to reduce imports (since less consumption of imported goods) and may improve the current account, so it is not a likely cause of a deficit. In contrast, options B, C, and D are likely causes: low primary incomes (investment income) reduce credits; a high exchange rate makes exports more expensive and imports cheaper; high wage costs raise production costs, reducing export competitiveness. Therefore, the answer is A.
A
Background Concept
The current account of the balance of payments records exports and imports of goods and services, plus primary income (investment income, compensation of employees) and secondary income (transfers). A deficit occurs when total debits exceed total credits. Several factors can cause a deficit: high exchange rate making exports less competitive; high domestic costs reducing competitiveness; low foreign demand; high domestic demand for imports; low income from investments abroad; etc. It is important to distinguish factors that increase imports or reduce exports from those that do the opposite.
Understanding the Question
The question asks "What is not a likely cause of a deficit in the current account?" So we need to identify which of the four options would NOT typically contribute to a deficit. Option A: low consumer spending. Option B: low primary incomes (investment income). Option C: high exchange rate. Option D: high wage costs. The correct answer is A because low consumer spending reduces demand for imported goods, thus likely improves the current account.
Approach
We evaluate each option against the common causes of a current account deficit. A deficit arises when the country spends more foreign currency than it earns. Anything that reduces exports or increases imports (or reduces income from abroad) contributes to a deficit. Anything that reduces imports or increases exports would reduce a deficit. Thus we look for the option that would not contribute.
Step-by-Step Reasoning
- Option A: Consumer spending is low. Lower consumer spending typically reduces demand for all goods, including imported goods. This leads to lower imports, which would improve the current account balance, not worsen it. So this is not a likely cause of a deficit.
- Option B: Primary incomes in the form of investment income are low. Investment income earned by residents from foreign investments is part of primary income credits. If these are low, it reduces the credits side, making a deficit more likely. So this is a likely cause.
- Option C: The rate of exchange is high. A high exchange rate (appreciated currency) makes exports more expensive for foreign buyers and imports cheaper for domestic consumers. This tends to reduce exports and increase imports, worsening the current account. So likely cause.
- Option D: Wage costs of production are high. High wage costs increase production costs, making exports less competitive in international markets, reducing export revenue. Also, cheaper imports may be substituted for domestic goods. So likely cause.
Thus only A is not a likely cause.
Key Takeaways
- A current account deficit can arise from various factors that reduce export competitiveness or increase import attractiveness.
- Understanding the direction of causality is crucial: factors that reduce demand for imports will improve the current account.
- The exchange rate, domestic costs, and income from abroad are key determinants.
Common Mistakes
- Confusing a high exchange rate with a low one: a high exchange rate means the currency is strong, which hurts exports, not helps.
- Thinking that low consumer spending necessarily reduces imports, but it does reduce overall demand, including imports.
- Overlooking primary income as a component of the current account.
Things to Be Careful About
- "Not" in the question: ensure you are selecting the option that is NOT a cause.
- Understand the distinction between a current account deficit and a trade deficit; the current account includes primary and secondary income.
- High wage costs may also be offset by productivity, but the question says "high", so likely a cause.
Your score so far
Answer a question to start scoring
Your marks add up here as you work through the paper.