Economics 9708/22 — October/November 2023
Cambridge AS Level · AS Level Data Response and Essays · worked solutions for every part, with the mark scheme
Topics Price Stability · Methods of Government Intervention in Markets · Demand and Supply · Market Equilibrium and the Price Mechanism · Unemployment · Economic Growth · +8 more
Electric cars create challenges for oil producers
Oil companies are facing uncertainty in 2020 as the COVID-19 pandemic causes a collapse in demand for their product, but car producers are predicting the pandemic will help accelerate the use of electric cars. Looking ahead, cuts in investment by oil companies as their revenues fall could reduce supply enough to cause a rise in oil prices. This makes electric cars more attractive just as car producers increase production.
Table 1.1 Selected data from the oil and car industries, 2014 to 2020
| 2014 | 2015 | 2016 | 2017 | 2018 | 2019 | 2020 | |
|---|---|---|---|---|---|---|---|
| Average real global price of oil (US$ per barrel) | 93.2 | 48.5 | 43.3 | 50.8 | 65.2 | 57.0 | 39.7 |
| Global sales of electric cars (millions) | N/A | 0.6 | 0.8 | 1.3 | 2.1 | 2.2 | 2.3 |
Sources: Macrotrends.net and World Economic Forum
However, the rise of electric car sales could slow within the next few years due to a worldwide shortage of the supply of lithium needed for car batteries. Demand for lithium could triple by 2025 to one million tonnes per year and then double again to two million tonnes per year by 2030. A typical lithium mine produces 30 000 tonnes per year which means the market needs approximately four new mines per year to meet demand. However, it usually takes about six years to discover, develop and put a lithium mine into production.
Rising global sales of electric cars are impacting on world oil producers. The boom years for the oil industry are over as economies start to deal with climate change. This will have significant implications for petrostates (countries whose economies are almost totally reliant on oil and gas).
Volatile oil prices, as illustrated in Table 1.1, have already left many petrostate governments struggling. The governments of most Middle Eastern oil producing countries cannot maintain a balanced budget at the 2020 average oil price of around US$40. Years of unstable oil revenues have left these countries with significant levels of national debt.
Venezuela offers a cautionary tale. Serious mismanagement has caused its oil output in 2020 to drop to about 10% of its 2000 level. Gross domestic product (GDP) has fallen by more than 75% in the past 5 years and more than 5 million people have left the country.
The solution is diversification. Wealthy Middle East states, such as Oman and Saudi Arabia, are investing in renewable energy and international tourism. Attempts at change by less wealthy petrostates such as Venezuela are hampered by a lack of capital at home and because they are often unable to attract international investors. As a result, they tend to focus on short-term rather than long-term economic growth.
Ultimately, many petrostates are likely to need outside support to diversify their economies. In addition to financial aid, it is suggested that wealthy countries should also offer technical assistance such as retraining workers, help designing new tax systems and support with the adoption of renewable energy.
Sources: Adapted from: Matthew Green and Simon Jessop, Reuters, 19 May 2020 and: STV news PA Media, August 2021 and: energymonitor.ai/policy, April 2021
Using the data in Table 1.1, calculate the percentage change in the average real global price of oil between 2014 and 2020.
Working
Percentage change = ((Value in 2020 - Value in 2014) / Value in 2014) x 100
= ((39.7 - 93.2) / 93.2) x 100
= (-53.5 / 93.2) x 100
= -57.4%
Answer
The average real global price of oil fell by 57.4% between 2014 and 2020.
-57.4%
Background Concept
A percentage change measures the relative change in a value over time, allowing comparison of changes of different magnitudes. The formula is: ((New Value - Old Value) / Old Value) x 100. A negative result indicates a fall, a positive result a rise. 'Real' means the price has been adjusted for inflation, so the change reflects a genuine change in purchasing power, not just a change in the general price level.
Understanding the Question
The question asks for a specific calculation using the data provided in Table 1.1. The two relevant figures are the average real global price of oil in 2014 (US$93.2 per barrel) and in 2020 (US$39.7 per barrel). The command word 'calculate' means the answer must show the working and the final numerical result. The mark scheme awards 2 marks for the correct percentage change, including the negative sign to show it is a fall.
Approach
- Identify the old value (2014) and the new value (2020) from the table.
- Apply the percentage change formula.
- Calculate the difference, divide by the old value, and multiply by 100.
- State the result with the correct sign and unit.
Step-by-Step Reasoning
- Identify the values: The price in 2014 is US$93.2. The price in 2020 is US$39.7.
- Calculate the change: The price fell by US$93.2 - US$39.7 = US$53.5.
- Apply the formula: The percentage change is (-53.5 / 93.2) x 100.
- Perform the division: -53.5 / 93.2 = -0.574 (approximately).
- Convert to a percentage: -0.574 x 100 = -57.4%.
- Interpret the result: The negative sign confirms the price fell. The magnitude is a 57.4% decrease.
Key Takeaways
- The percentage change formula is a fundamental tool in economics for comparing data over time.
- Always include the sign (+ or -) to indicate the direction of the change.
- 'Real' values are adjusted for inflation, making them more meaningful for comparisons over time.
Common Mistakes
- Omitting the negative sign: The mark scheme explicitly states that a simple statement of '57.4%' without indicating it is a fall only earns 1 mark. The negative sign or the word 'fall' is essential.
- Incorrect formula: Using (Old - New) / New instead of (New - Old) / Old will give the wrong sign and magnitude.
- Using the wrong figures: Selecting data from the wrong row or column in the table.
Things to Be Careful About
- The mark scheme allows a range of 57% to 58%, so rounding is acceptable.
- The unit is a percentage change, so the answer is '-57.4%', not 'US$53.5'.
- The data is for the 'average real global price', so the calculation is on the price itself, not on a quantity.
Explain why the price of oil on the world market fell in 2020.
Answer
The COVID-19 pandemic caused a collapse in demand for oil (e.g., due to lockdowns reducing transport and industrial activity). This led to a leftward shift of the demand curve for oil. At the original price, there was now a surplus of oil. To eliminate this surplus and clear the market, producers were forced to lower the price.
The price fell because the pandemic caused a sharp fall in demand for oil, creating a surplus that forced producers to reduce prices.
Background Concept
In a market economy, the price of a good is determined by the interaction of demand and supply. The demand curve shows the quantity consumers are willing and able to buy at different prices. A change in a factor other than the good's own price (a determinant of demand, such as income, tastes, or the price of related goods) will shift the entire demand curve. A fall in demand shifts the curve to the left. At the original equilibrium price, quantity supplied now exceeds quantity demanded, creating a surplus. This surplus puts downward pressure on the price, which falls until a new equilibrium is reached where quantity demanded equals quantity supplied.
Understanding the Question
The question asks to explain a specific event: the fall in the world market price of oil in 2020. The extract provides the context: 'the COVID-19 pandemic causes a collapse in demand for their product'. The command word is 'explain', which requires a causal chain of reasoning. The answer must link the pandemic to the price fall using economic theory.
Approach
- Identify the cause: the COVID-19 pandemic.
- Explain the effect on demand: lockdowns, reduced travel, and lower industrial output reduced the demand for oil.
- Use demand and supply analysis: a fall in demand shifts the demand curve left.
- Explain the market adjustment: a surplus is created, leading to a fall in price.
Step-by-Step Reasoning
- The initial shock: The COVID-19 pandemic led to widespread lockdowns, travel restrictions, and a sharp reduction in economic activity. This directly reduced the need for oil for transportation (cars, planes, ships) and industrial production.
- Effect on demand: This represents a change in a determinant of demand (consumer preferences and income). The entire demand curve for oil shifts to the left.
- Market disequilibrium: At the original price, the quantity of oil supplied (by producers) is now greater than the quantity demanded. This is a surplus (excess supply).
- Price adjustment: To sell their surplus oil, producers compete with each other by lowering the price. This is the price mechanism at work.
- New equilibrium: The price continues to fall until a new equilibrium is reached where the lower quantity supplied equals the lower quantity demanded.
Key Takeaways
- A change in a non-price determinant of demand causes a shift of the demand curve.
- A surplus leads to a fall in price.
- The price mechanism (the 'invisible hand') works to clear the market.
Common Mistakes
- Confusing a shift with a movement: Saying 'a fall in price led to a fall in quantity demanded' is a movement along the curve, not the cause of the initial price fall. The initial cause was a shift of the curve.
- Mentioning supply: The question is about a demand-side shock. While supply may have also been affected, the primary and most direct cause given in the extract is the collapse in demand. Focusing on supply would be a misdirection.
- Being too vague: Simply saying 'demand fell' without explaining why (the pandemic) or the mechanism (surplus leads to lower price) is insufficient for full marks.
Things to Be Careful About
- The answer must be a clear chain of reasoning: pandemic -> fall in demand -> surplus -> lower price.
- Use the correct terminology: 'demand curve shifts left', 'surplus', 'market clearing'.
- The answer is only 2 marks, so it should be concise but complete.
With the help of a diagram, explain why the supply problem referred to may lead to increases in the price of electric cars in the future and consider one policy that may be used to overcome this supply problem.
Answer
The supply problem refers to a worldwide shortage of lithium, a key input in electric car batteries. This shortage could be caused by demand for lithium growing faster than supply. This will increase the price of lithium, which is a cost of production for electric cars. Higher costs of production will reduce the supply of electric cars, shifting the supply curve for electric cars to the left, from S1 to S2. This leads to a higher equilibrium price for electric cars, from P1 to P2, and a lower quantity, from Q1 to Q2.
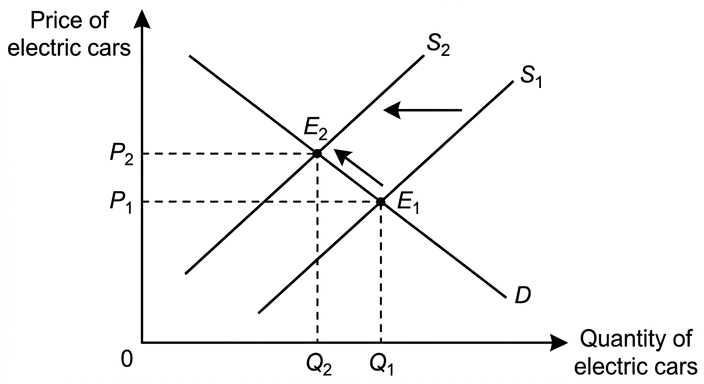
One policy to overcome this supply problem is for the government to provide subsidies to companies for research and development (R&D) into alternative battery technologies that do not rely on lithium. This would encourage innovation and could lead to the discovery of cheaper or more abundant materials, reducing the pressure on lithium supply and potentially lowering the cost of production for electric cars in the long run.
The shortage of lithium will increase its price, raising production costs for electric cars and reducing their supply, leading to a higher price. A policy to overcome this is a government subsidy for R&D into alternative battery technologies.
Background Concept
This question involves a derived demand chain. Lithium is a factor of production (a raw material) for electric cars. An increase in the price of a factor of production will increase a firm's costs. In a competitive market, an increase in costs reduces the profitability of supplying a good at any given price, causing the supply curve to shift to the left. This results in a higher equilibrium price and a lower equilibrium quantity for the final good (electric cars).
Understanding the Question
The question has two parts. First, 'with the help of a diagram, explain why the supply problem... may lead to increases in the price of electric cars'. This requires a diagram of the market for electric cars, not lithium. The 'supply problem' is the lithium shortage, which is the cause. The effect is on the electric car market. Second, 'consider one policy that may be used to overcome this supply problem'. The policy must address the lithium shortage itself, not the price of electric cars. The command word 'consider' implies a brief evaluation of the policy's effectiveness.
Approach
- Explain the link: The lithium shortage increases the cost of producing electric cars.
- Draw the diagram: A standard demand and supply diagram for the electric car market, showing a leftward shift of the supply curve.
- Explain the diagram: Label the axes, curves, and the new equilibrium to show the higher price.
- Propose a policy: Choose a policy that directly addresses the lithium shortage (e.g., subsidies for R&D into alternatives, or for opening new lithium mines).
- Consider the policy: Briefly explain how it would work and one potential limitation.
Step-by-Step Reasoning
- The problem: The extract states there will be a 'worldwide shortage of the supply of lithium'. This means the supply of lithium is not keeping up with the rapidly growing demand.
- Impact on lithium price: Basic demand and supply analysis shows that when demand grows faster than supply, the price of lithium will rise significantly.
- Impact on electric car producers: Lithium is a key cost in producing electric car batteries. A higher lithium price directly increases the cost of production for electric car manufacturers.
- Impact on electric car supply: Facing higher costs, firms will be willing to supply fewer electric cars at any given price. The supply curve for electric cars shifts to the left.
- Impact on electric car price: With a leftward shift in supply and an unchanged demand (in the short run), the equilibrium price of electric cars will rise, and the equilibrium quantity will fall.
- The diagram: Draw a diagram for the electric car market. Label the vertical axis 'Price of electric cars' and the horizontal axis 'Quantity of electric cars'. Draw a downward-sloping demand curve (D) and an upward-sloping supply curve (S1). Mark the initial equilibrium at P1, Q1. Then draw a new supply curve (S2) to the left of S1. The new equilibrium is at P2 (higher) and Q2 (lower).
- Policy proposal: A government could offer subsidies to companies for R&D into alternative battery technologies (e.g., sodium-ion, solid-state). This reduces the cost of innovation, making it more likely that a viable alternative to lithium will be developed.
- Consideration: The policy is effective in the long run but does not solve the immediate shortage. It also relies on successful innovation, which is uncertain.
Key Takeaways
- Changes in the price of a factor of production affect the supply curve of the final good.
- A diagram must be fully explained in the text to earn marks.
- A policy must be directly relevant to the problem identified in the question.
Common Mistakes
- Drawing the wrong diagram: Drawing a diagram for the lithium market instead of the electric car market. The question asks for the effect on the price of electric cars.
- Shifting the demand curve: The initial shock is a supply-side problem (higher costs), not a change in consumer demand for electric cars.
- Not explaining the diagram: Just drawing the diagram without describing what it shows (which curve shifts, why, and the new equilibrium) will lose marks.
- Proposing an irrelevant policy: Suggesting a policy like a price cap on electric cars, which does not address the root cause (the lithium shortage).
Things to Be Careful About
- The diagram must be clearly labelled with all relevant curves and equilibrium points.
- The policy must be 'one policy' and must be aimed at 'overcoming this supply problem' (the lithium shortage).
- The 'consider' part requires a brief evaluative comment, not just a description of the policy.
Explain whether unemployment caused by the diversification of petrostates away from oil and gas production is likely to be cyclical or structural and consider which type of unemployment is likely to be more damaging to these economies.
Answer
The unemployment caused by diversification away from oil and gas is likely to be structural, not cyclical. Structural unemployment occurs when there is a mismatch between the skills workers have and the skills demanded by new industries. As petrostates diversify, workers with skills specific to the oil and gas industry (e.g., drilling engineers, refinery operators) will find their skills are no longer in demand. They will need retraining to find jobs in new sectors like renewable energy or tourism. This is a long-term change in the structure of the economy.
Cyclical unemployment, in contrast, is caused by a fall in aggregate demand (AD) during a recession. While the initial fall in oil revenue could reduce AD, the primary cause of the job losses is the permanent shift away from oil, not a temporary downturn in the economic cycle.
Evaluation: Structural unemployment is likely to be more damaging to these economies. It is a long-term problem that requires significant investment in retraining and education, which petrostates with limited funds may struggle to provide. It can lead to long-term 'hysteresis' effects, where workers become discouraged and leave the labour force permanently, reducing the economy's potential output. Cyclical unemployment, while painful, is typically temporary and can be addressed by expansionary fiscal or monetary policy to boost AD. The extract notes that less wealthy petrostates lack capital, making it harder for them to tackle structural unemployment, making it more damaging.
The unemployment is likely to be structural. Structural unemployment is likely to be more damaging because it is a long-term problem requiring costly retraining, which poorer petrostates cannot afford, leading to hysteresis and a permanent loss of output.
Background Concept
Unemployment is a situation where individuals who are willing and able to work cannot find a job. Economists classify unemployment by its cause. Structural unemployment arises from a long-term change in the structure of the economy, such as a decline in a major industry or technological change. It involves a mismatch between workers' skills and the available jobs. Cyclical unemployment (also called demand-deficient unemployment) is caused by a fall in aggregate demand in the economy, typically during a recession. It is temporary and will fall as the economy recovers.
Understanding the Question
The question asks to 'explain whether unemployment caused by the diversification of petrostates away from oil and gas production is likely to be cyclical or structural'. This requires a clear definition of both types and a reasoned argument for which one fits the scenario. The second part asks to 'consider which type of unemployment is likely to be more damaging to these economies'. This requires an evaluation, comparing the consequences of each type within the specific context of petrostates. The mark scheme allocates up to 4 marks for explanation/analysis and up to 2 marks for evaluation.
Approach
- Define the two types of unemployment: Clearly state what structural and cyclical unemployment are.
- Analyse the scenario: Explain why the diversification leads to structural unemployment (a permanent shift in the economy's structure, a skills mismatch).
- Contrast with cyclical: Explain why it is not primarily cyclical (it's not a temporary fall in AD, but a permanent change).
- Evaluate the damage: Compare the long-term vs. short-term impacts, the difficulty of curing each type, and the specific challenges faced by petrostates (lack of capital, need for retraining).
- Reach a justified conclusion: State which is more damaging and why, based on the analysis.
Step-by-Step Reasoning
- Identifying the type: Diversification means the economy is deliberately moving away from its main industry (oil and gas). This is a permanent, structural change. Workers in the oil and gas sector have specific skills (e.g., geologists, pipeline engineers) that are not directly transferable to new sectors like tourism or renewable energy. This is a classic case of a skills mismatch, which is the definition of structural unemployment.
- Why not cyclical? Cyclical unemployment is caused by a lack of aggregate demand. While the fall in oil revenue could reduce national income and thus AD, the primary driver of the job losses is the decision to diversify, not a recession. The jobs in oil and gas are being deliberately phased out, not temporarily suspended.
- Comparing the damage (Evaluation):
- Structural unemployment is more damaging because:
- It is long-term. Workers may be unemployed for years while they retrain or relocate.
- It leads to hysteresis: long-term unemployment can erode workers' skills and motivation, making them permanently unemployable, reducing the economy's productive capacity.
- It is expensive to fix. It requires government spending on retraining programs, education, and possibly relocation subsidies. The extract notes that less wealthy petrostates 'lack capital', making this very difficult.
- It can lead to social problems like increased poverty and inequality in specific regions.
- Cyclical unemployment is less damaging because:
- It is temporary. Once the economy recovers, demand picks up, and workers are rehired.
- It can be addressed by standard macroeconomic policies (e.g., cutting interest rates, increasing government spending).
- It does not involve a fundamental skills mismatch.
- Structural unemployment is more damaging because:
- Conclusion: Given the permanent nature of the change and the specific financial constraints of many petrostates, structural unemployment poses a greater and more lasting threat to their economies.
Key Takeaways
- The classification of unemployment depends on its root cause.
- Structural unemployment is a supply-side problem; cyclical unemployment is a demand-side problem.
- Evaluation requires comparing the consequences of different options within a specific context.
Common Mistakes
- One-sided answer: Only discussing one type of unemployment. The mark scheme explicitly states a maximum of 2 marks if only one type is considered.
- Confusing the types: Saying the unemployment is cyclical because the economy is in a downturn. The cause is a structural shift, even if it leads to a downturn.
- Vague evaluation: Simply stating 'structural is worse' without explaining why, using the context of the extract (lack of capital, long-term nature).
- No conclusion: The evaluation requires a justified conclusion about which is 'more damaging'.
Things to Be Careful About
- The answer must be grounded in the context of 'petrostates' and the extract's information (e.g., lack of capital, focus on short-term vs. long-term growth).
- The evaluation must compare the two types, not just describe one.
- The conclusion must be a clear judgement, not a summary of both sides.
Assess whether diversification is likely to be more successful in Venezuela or Saudi Arabia as they reduce their dependence on oil production.
Answer
Diversification is likely to be far more successful in Saudi Arabia than in Venezuela.
Analysis for Saudi Arabia: The extract states that wealthy Middle East states like Saudi Arabia are 'investing in renewable energy and international tourism'. This shows they have the necessary capital to fund diversification. They can attract international investors and have the financial stability to focus on long-term growth. Their existing wealth provides a buffer, allowing them to invest in retraining and new infrastructure.
Analysis for Venezuela: The extract describes Venezuela as a 'cautionary tale'. Its oil output has collapsed, GDP has fallen by over 75%, and millions have emigrated. It suffers from 'serious mismanagement' and a 'lack of capital'. This means it cannot fund diversification itself. Furthermore, it is 'often unable to attract international investors', likely due to political and economic instability. As a result, it is forced to focus on 'short-term rather than long-term economic growth', which is the opposite of what successful diversification requires.
Evaluation: The key difference is the availability of capital and institutional stability. Saudi Arabia has the resources and stability to implement a long-term diversification plan. Venezuela lacks both, creating a vicious cycle where its inability to diversify perpetuates its economic problems. Therefore, diversification is much more likely to succeed in Saudi Arabia.
Diversification is likely to be more successful in Saudi Arabia because it has the capital, stability, and ability to attract investment needed for long-term planning, whereas Venezuela lacks these due to mismanagement and economic collapse.
Background Concept
Diversification is an economic strategy to reduce reliance on a single industry (in this case, oil and gas) to create a more stable and sustainable economy. Its success depends on several factors, including the availability of financial capital, human capital (skilled workers), institutional stability, and the ability to attract foreign direct investment (FDI). A country with a strong existing economy can use its wealth to fund the transition, while a country in crisis may be trapped in a cycle of poverty and instability.
Understanding the Question
The question asks to 'assess whether diversification is likely to be more successful in Venezuela or Saudi Arabia'. The command word 'assess' requires a judgement based on a balanced analysis of both sides. The answer must use evidence from the extract to compare the two countries' starting positions and constraints. The mark scheme allocates up to 4 marks for analysis (up to 3 for each country, max 4 total) and up to 2 marks for evaluation (a justified conclusion).
Approach
- Analyse Saudi Arabia's prospects: Use extract evidence (wealth, investing in renewables/tourism, ability to attract investors) to argue for a high likelihood of success.
- Analyse Venezuela's prospects: Use extract evidence (mismanagement, collapsed GDP, emigration, lack of capital, inability to attract investors, short-term focus) to argue for a low likelihood of success.
- Evaluate and conclude: Compare the two on a key criterion (e.g., access to capital and stability) and state which is more likely to succeed, justifying the judgement.
Step-by-Step Reasoning
- Saudi Arabia's case for success:
- Capital: The extract calls it a 'wealthy Middle East state'. It has the financial resources to invest in new industries.
- Action: It is already 'investing in renewable energy and international tourism', showing a concrete plan is in motion.
- Attractiveness: Its wealth and stability make it attractive to 'international investors', providing an additional source of funding and expertise.
- Time horizon: It can afford to focus on 'long-term economic growth', which is essential for successful diversification.
- Venezuela's case for failure:
- Mismanagement: The extract explicitly states 'serious mismanagement', indicating deep-seated institutional problems.
- Economic collapse: GDP has fallen by over 75%, and oil output is at 10% of its 2000 level. This means the economy is in a deep crisis, with no surplus to invest.
- Lack of capital: It is a 'less wealthy petrostate' with a 'lack of capital at home'.
- Inability to attract investment: It is 'often unable to attract international investors', likely due to high risk and instability.
- Short-term focus: It is forced to focus on 'short-term rather than long-term economic growth', which is incompatible with the long-term planning needed for diversification.
- Emigration: The loss of over 5 million people represents a massive loss of human capital, making it even harder to build new industries.
- Evaluation: The fundamental difference is the presence of a 'virtuous cycle' in Saudi Arabia (wealth -> investment -> growth -> more wealth) versus a 'vicious cycle' in Venezuela (poverty -> no investment -> stagnation -> more poverty). The success of diversification is not just about the desire to change, but the capacity to do so. Saudi Arabia has the capacity; Venezuela does not.
Key Takeaways
- The success of an economic policy depends heavily on a country's specific circumstances (initial conditions, institutions, resources).
- Extract-based answers must use specific evidence from the text to support each point.
- A strong evaluation identifies the key criterion that differentiates the two cases and explains why it matters.
Common Mistakes
- Generalised discussion: Writing a general essay about diversification without specifically referring to Venezuela or Saudi Arabia. The mark scheme caps this at 1 mark.
- One-sided analysis: Only discussing one country. The question asks for a comparison ('more successful in Venezuela or Saudi Arabia').
- Ignoring the extract: Making up facts or not using the specific evidence provided (e.g., the 75% GDP fall, the emigration, the investment in tourism).
- Weak conclusion: Simply saying 'it depends' without stating which country is more likely to succeed and why.
Things to Be Careful About
- The analysis must be balanced, even if the conclusion is one-sided. Discuss both countries.
- The evaluation must be a 'justified conclusion'. This means the final judgement must be supported by the analysis that precedes it.
- Use the exact figures and phrases from the extract to strengthen the answer (e.g., 'GDP has fallen by more than 75%', 'lack of capital').
The rest of this paper
4 more questions- Q2Elasticities of Demand · Price Elasticity of Supply20M
- Q3Classification of Goods and Services · Economic Systems · Methods of Government Intervention in Markets20M
- Q4International Trade and Comparative Advantage · Balance of Payments20M
- Q5Aggregate Demand and Aggregate Supply · Price Stability20M