Economics 9708/22 — May/June 2022
Cambridge AS Level · AS Level Data Response and Essays · worked solutions for every part, with the mark scheme
Topics Balance of Payments · Price Stability · Classification of Goods and Services · Fiscal Policy · Aggregate Demand and Aggregate Supply · Exchange Rates · +5 more
Economic growth in Russia has slowed to well below the global average
In 2019, Russia set an aim to quicken its economic expansion – to grow faster than the world as a whole. So far, the plan is off to an uncertain start.
Content removed due to copyright restrictions.
This has also led to a fall in the value of the exchange rate for the Russian currency, the rouble.
Source: Andrew E. Kramer, The New York Times 18 February 2020
Table 1.1: Russia: Government budget balance as % of national output
| 2015 | 2016 | 2017 | 2018 | 2019 |
|---|---|---|---|---|
| -2.4 | -3.4 | -1.5 | 2.9 | 1.8 |
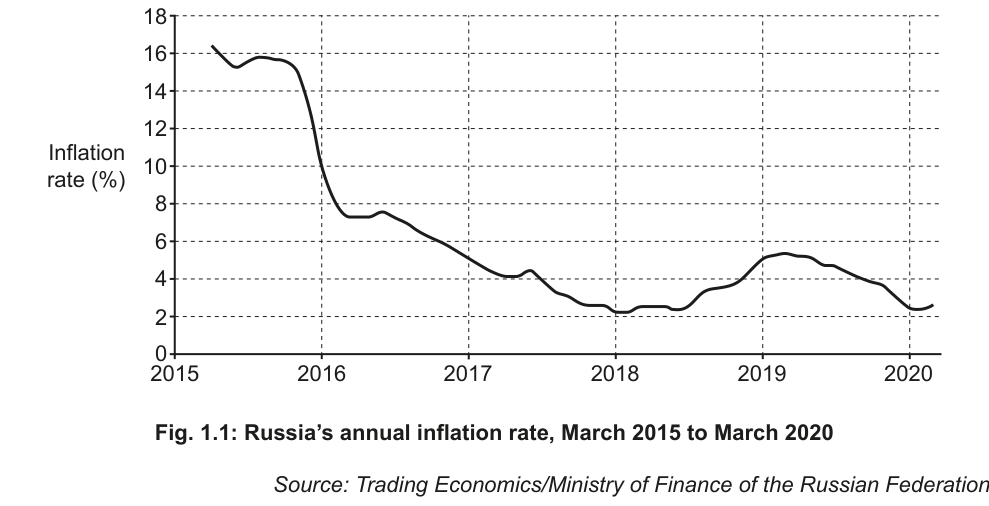
Fig. 1.1: Russia’s annual inflation rate, March 2015 to March 2020
Source: Trading Economics/Ministry of Finance of the Russian Federation
Using Fig. 1.1
Compare the rate of inflation in Russia in March 2015 with that in March 2020.
Answer
The annual inflation rate in Russia was significantly higher in March 2015 (approximately 17%) than in March 2020 (approximately 2.5%), meaning inflation fell substantially over the period (a period of disinflation).
The inflation rate was much higher in March 2015 than in March 2020 (or inflation fell significantly over the period).
Background Concept
Inflation is defined as a sustained increase in the general price level of goods and services in an economy over a period of time. The annual inflation rate measures the percentage change in the price level from the same period in the previous year. Disinflation refers to a fall in the rate of inflation, meaning prices are still rising but at a slower pace.
Understanding the Question
This 1-mark question asks you to compare the annual inflation rate in Russia in March 2015 with that in March 2020, using the data in Fig. 1.1. The graph plots Russia's annual inflation rate from March 2015 to March 2020, with the vertical axis showing the inflation rate in percentage points and the horizontal axis showing the time period. The command word 'compare' at this level only requires you to state the relative size of the two values or the direction of change between them. No figures are required for the mark, though including approximate values is acceptable.
Approach
Read the two values directly from the graph: the inflation rate in March 2015 is approximately 17%, and in March 2020 it is approximately 2.5%. State that the 2015 rate is higher, or that the rate has fallen over the period. No analysis or explanation is needed for this 1-mark question.
Step-by-Step Reasoning
- Locate March 2015 on the horizontal axis of Fig. 1.1: the corresponding inflation rate is approximately 17%.
- Locate March 2020 on the horizontal axis: the corresponding inflation rate is approximately 2.5%.
- Compare the two values: the 2015 rate is far higher than the 2020 rate, so inflation fell significantly over the 5-year period.
Key Takeaways
- You can compare two time series values by stating which is higher/lower or the direction of change.
- For 1-mark comparison questions, no supporting figures or analysis are required unless specified.
Common Mistakes
- Stating that inflation 'improved' or 'became better' instead of referring to the rate falling or being lower: this is not accepted by the mark scheme.
- Providing unnecessary analysis of why inflation fell: this is not required for 1 mark and wastes time.
Things to Be Careful About
- Ensure you refer to the inflation rate, not the price level, for this part (that is the focus of part a(ii)).
- Do not confuse disinflation (falling inflation rate) with deflation (falling price level): inflation was positive throughout the period, so it is disinflation, not deflation.
What has happened to the price level over this period?
Answer
The price level rose over the period, as the annual inflation rate was positive throughout March 2015 to March 2020, meaning prices increased each year.
The price level rose over the period.
Background Concept
Inflation is a sustained increase in the general price level. As long as the inflation rate is positive (above 0%), the price level is rising. Deflation is a fall in the price level, which only occurs if the inflation rate is negative. Disinflation is a fall in the rate of inflation, but the price level still rises if inflation remains positive.
Understanding the Question
This 1-mark question asks what happened to the price level in Russia between March 2015 and March 2020, using Fig. 1.1. The graph shows that the inflation rate was always above 0% over this period, so the price level must have risen. No figures are required for the mark.
Approach
Note that all values on the graph are positive (above 0%), so inflation was positive every year. Positive inflation means the price level increases over time. State this directly.
Step-by-Step Reasoning
- Observe that the lowest inflation rate on Fig. 1.1 is approximately 2% in early 2018, which is still above 0%.
- Since the inflation rate is positive for the entire period, the general price level of goods and services in Russia rose continuously between March 2015 and March 2020.
Key Takeaways
- Positive inflation always corresponds to a rising price level.
- Disinflation (falling inflation rate) does not mean the price level falls; it only means prices are rising more slowly.
Common Mistakes
- Confusing disinflation with deflation: stating the price level fell is incorrect, as inflation was always positive.
- Referencing the inflation rate instead of the price level: the question explicitly asks about the price level, not the inflation rate.
Things to Be Careful About
- The question does not require you to quote specific inflation figures, only to state the change in the price level.
- Ensure you do not claim the price level was stable: even with low inflation of 2%, the price level is still rising.
Explain what could have caused real wages in Russia to decline between 2016 and 2018.
Answer
Real wages are nominal wages adjusted for the rate of inflation, so they fall when the rate of inflation is higher than the growth rate of nominal wages (or when nominal wages fall). One possible cause of declining real wages between 2016 and 2018 is that nominal wage growth was slower than the inflation rate over this period, even as inflation fell from around 8% to 2%. Alternatively, a surplus of labour in the Russian economy could have pushed nominal wages down, reducing real wages even if inflation was low.
Real wages fall when inflation outpaces nominal wage growth (or nominal wages fall); a valid cause is slower nominal wage growth than inflation, or a labour surplus pushing nominal wages down.
Background Concept
Nominal wages are the face value of wages paid to workers, while real wages measure the purchasing power of those wages, adjusted for changes in the price level. The relationship is: Real wage growth ≈ Nominal wage growth - Inflation rate. If inflation is higher than nominal wage growth, real wages fall, meaning workers can afford fewer goods and services even if their nominal pay rises. If nominal wages fall, real wages will also fall unless inflation is negative.
Understanding the Question
This 2-mark question asks for an explanation of a possible cause of declining real wages in Russia between 2016 and 2018. The mark scheme requires two elements: (1) understanding that real wages fall when prices rise faster than nominal wages (or nominal wages fall), and (2) a valid explanation of why this happened in the given period. The question refers to the period 2016-2018, when inflation in Russia fell from around 8% to 2% (from Fig. 1.1), so the cause does not have to be high inflation, but could be weak nominal wage growth or falling nominal wages.
Approach
First, state the definitional link between real wages, nominal wages and inflation to earn the first mark. Then, propose a plausible cause consistent with the Russian economic context of the time, such as weak nominal wage growth, falling nominal wages due to labour market slack, or cost-push inflation from imported goods rising faster than wages.
Step-by-Step Reasoning
- First mark: Explain that real wages are nominal wages adjusted for inflation, so they decline if the inflation rate exceeds the growth rate of nominal wages, or if nominal wages fall outright.
- Second mark: Propose a valid cause. For example, between 2016 and 2018, Russia's inflation rate fell but remained positive, while nominal wage growth may have been even weaker due to slow economic growth (as noted in the article's opening that economic growth was below global average). Alternatively, a surplus of labour in the economy (e.g. from structural unemployment) could have put downward pressure on nominal wages, reducing real wages even with low inflation.
Key Takeaways
- Always distinguish between nominal and real values when discussing wages, income or output: real values adjust for price changes, nominal values do not.
- Real wage decline does not require high inflation: even low positive inflation will reduce real wages if nominal wages are stagnant or falling.
Common Mistakes
- Failing to explain the link between inflation, nominal wages and real wages: just stating 'inflation rose' is not enough, you must link it to nominal wages.
- Proposing an invalid cause, such as rising real wages: this contradicts the question's premise.
- No understanding of real wages: if you only talk about nominal wages falling without linking to inflation or real wages, you will not earn the first mark.
Things to Be Careful About
- The first mark is for understanding the definition of real wage decline, not just stating that prices rose faster than wages: you must make the link explicit.
- The cause must be specific to the 2016-2018 period if possible, but any valid economic cause is acceptable as long as it explains the real wage decline.
Explain whether school lunches provided free-of-charge by the Russian government would be classified as private goods or public goods.
Answer
A good is classified as excludable if people can be prevented from using it if they do not pay for it, and non-excludable if no one can be excluded from using it. A good is rival in consumption if one person's use of it reduces the amount available for others, and non-rival if one person's use does not reduce availability for others. Public goods are defined by being both non-excludable and non-rival, while private goods are both excludable and rival.
Free school lunches provided by the Russian government are excludable, as the government can restrict provision to eligible school-age children and prevent others from accessing them. They are also rival in consumption, as one child eating a provided lunch means that lunch is no longer available for another child. As they are both excludable and rival, free school lunches are private goods (economic goods), not public goods.
Free school lunches provided free-of-charge by the government are private goods, not public goods.
Background Concept
Goods are classified based on two key characteristics: excludability and rivalry in consumption.
- Excludability: A good is excludable if it is possible to prevent people who have not paid for it from using it. Non-excludable goods cannot be restricted to paying users only.
- Rivalry in consumption: A good is rival if one person's consumption reduces the quantity available for others. Non-rival goods can be consumed by multiple people simultaneously without reducing availability.
Private goods (economic goods) are both excludable and rival. Public goods are both non-excludable and non-rival, leading to the free-rider problem where people can benefit without paying, so private firms will not provide them. Merit goods are goods that are under-consumed because consumers underestimate their private benefits, while demerit goods are over-consumed as consumers underestimate their private costs.
Understanding the Question
This 4-mark question asks you to explain whether free school lunches provided by the Russian government are private or public goods. The mark scheme requires you to: (1) demonstrate understanding of excludability/non-excludability, (2) demonstrate understanding of rivalry/non-rivalry, (3) apply both criteria to free school lunches, and (4) reach a correct conclusion. The question is not asking about merit goods, only the public/private classification.
Approach
First, define the two key classification criteria clearly. Then apply each criterion to free school lunches: explain why they are excludable (the government can limit access to school children) and rival (one child's lunch cannot be eaten by another). Finally, conclude that they are private goods, as they meet both criteria for private goods and neither for public goods.
Step-by-Step Reasoning
- First mark (excludability): Define excludability as the ability to prevent non-payers from using a good. Free school lunches are excludable because the government can restrict provision to children enrolled in state schools, and prevent non-eligible people (e.g. adults, children not in school) from accessing them.
- Second mark (rivalry): Define rivalry in consumption as a situation where one person's use of a good reduces the amount available for others. Free school lunches are rival because each lunch is a physical good that can only be eaten by one child; if one child eats it, it is no longer available for another child.
- Third mark (application): Apply both criteria to the good, confirming it is excludable and rival.
- Fourth mark (conclusion): State that since free school lunches are excludable and rival, they are private goods, not public goods. Note that while they are provided free at the point of use by the government, this does not make them public goods: public goods are defined by their characteristics, not by who provides them.
Key Takeaways
- The classification of a good as public or private depends on its inherent characteristics (excludability and rivalry), not on who provides it or whether it is free at the point of use.
- Many goods provided free by the government (e.g. healthcare, education, school meals) are private goods, not public goods, because they are excludable and rival.
- Public goods are rare in real economies: examples include national defence, street lighting, and unpoliced open sea fisheries.
Common Mistakes
- Confusing the provider of the good with its classification: just because the government provides a good free of charge does not make it a public good.
- Failing to apply the criteria to the specific good: defining excludability and rivalry is not enough; you must link them to school lunches to earn the application marks.
- Claiming school lunches are public goods because they are provided by the government: this is incorrect, as they do not meet the non-excludable and non-rival criteria.
Things to Be Careful About
- Ensure you define both excludability and rivalry clearly to earn the first two marks.
- The conclusion must be based on the application of the criteria: do not just state 'they are private goods' without explaining why.
- Do not confuse merit goods with private goods: while free school lunches are a merit good (under-consumed if left to the free market), they are still private goods in terms of their excludability and rivalry.
Assess, using aggregate demand and aggregate supply analysis, the likely impact of the changes shown in Table 1.1 upon the rate of inflation in Russia.
Answer
Table 1.1 shows the Russian government budget moved from a deficit (negative balance) between 2015 and 2017 to a surplus (positive balance) in 2018 and 2019. This reflects a shift to contractionary fiscal policy, either via cuts in government spending (G), increases in taxation (T), or a combination of both.
First, the impact on aggregate demand (AD): AD is calculated as AD = C + I + G + (X - M). A cut in G directly reduces AD, while higher T reduces households' disposable income, lowering consumption (C), and may reduce firms' retained profits, lowering investment (I). The leftward shift in AD reduces the equilibrium price level, so the rate of inflation falls. This is the primary demand-side effect of the budget surplus, which will reduce inflation.
Second, the impact on aggregate supply (AS): Contractionary fiscal policy may also shift the short-run aggregate supply (SRAS) curve. For example, cuts in government spending could reduce subsidies to domestic firms, raising their production costs and shifting SRAS to the left. Higher taxes could also discourage private investment in capital, reducing firms' productive capacity over time and shifting SRAS left. A leftward shift in SRAS raises the equilibrium price level, increasing inflation, which offsets the demand-side reduction in inflation.
The net impact on the inflation rate depends on the relative magnitude of the AD and SRAS shifts. If the AD shift is larger, inflation will fall; if the SRAS shift is larger, inflation may rise or fall only slightly. Overall, the move to a budget surplus is likely to reduce inflation via the demand-side channel, though the supply-side effect will moderate the extent of this reduction.
The move to a budget surplus is likely to reduce Russia's inflation rate, though the effect may be partially offset by leftward shifts in SRAS from reduced government spending and higher taxes.
Background Concept
Fiscal policy refers to the use of government spending (G) and taxation (T) to influence macroeconomic objectives including price stability (low inflation), low unemployment and economic growth. A budget deficit occurs when government spending exceeds tax revenue, while a budget surplus occurs when tax revenue exceeds government spending. A move from deficit to surplus is contractionary fiscal policy, which reduces aggregate demand in the economy.
Aggregate demand (AD) is the total demand for goods and services in an economy at a given price level, calculated as AD = C + I + G + (X - M), where C is consumer spending, I is investment, G is government spending, and (X - M) is net exports. Aggregate supply (AS) is the total supply of goods and services in an economy at a given price level. Short-run AS (SRAS) is upward-sloping, as firms increase output when the price level rises, while long-run AS (LRAS) is vertical at the potential output level.
Inflation is a sustained increase in the general price level. Demand-pull inflation occurs when AD rises faster than AS, pushing up the price level, while cost-push inflation occurs when AS shifts left (e.g. due to higher input costs), pushing up the price level even if AD is constant.
Understanding the Question
This 6-mark point-based question asks you to assess the impact of the changes in Table 1.1 (the Russian government's move from a budget deficit to a surplus) on the rate of inflation, using AD/AS analysis. The mark scheme awards marks for: (1) analysis of the AD impact of contractionary fiscal policy and its effect on inflation (up to 3 marks), (2) analysis of the possible AS impact of the policy and its effect on inflation (up to 2 marks), and (3) a valid conclusion (1 mark). You need to cover both the demand-side and supply-side effects to reach the top mark band, and reach a justified conclusion.
Approach
First, explain what the move from deficit to surplus implies for fiscal policy (contractionary). Then analyse the demand-side effect: how lower G or higher T reduces AD, shifting the AD curve left, lowering the equilibrium price level and thus inflation. Next, analyse the supply-side effect: how fiscal contraction could raise firms' costs or reduce investment, shifting SRAS left, which increases the price level and raises inflation, offsetting the AD effect. Finally, conclude on the net impact, noting that the AD effect is likely to dominate but the AS effect will moderate the reduction in inflation.
Step-by-Step Reasoning
- Interpret Table 1.1: The budget balance was negative (deficit) from 2015 to 2017, and positive (surplus) from 2018 to 2019. This means the government reduced spending, raised taxes, or both to move from borrowing to running a surplus, which is contractionary fiscal policy.
- AD analysis (up to 3 marks): Contractionary fiscal policy directly reduces the G component of AD, and indirectly reduces C (via higher taxes lowering disposable income) and possibly I (via higher taxes reducing firm profits and investment). This shifts the AD curve to the left. At the original equilibrium, this creates a surplus of goods and services, so firms lower prices, reducing the equilibrium price level. A lower price level means a lower rate of inflation, so this effect reduces inflation.
- AS analysis (up to 2 marks): The fiscal contraction may also affect AS. For example, cuts in government spending could reduce subsidies to firms (e.g. for energy or transport), raising their per-unit production costs and shifting the SRAS curve to the left. Higher taxes could also reduce firms' retained profits, lowering investment in new capital, which reduces productive capacity and shifts SRAS left over time. A leftward shift in SRAS reduces output and raises the equilibrium price level, increasing inflation, which offsets the demand-side reduction in inflation.
- Conclusion (1 mark): The net impact on inflation depends on the relative size of the AD and SRAS shifts. In most cases, the demand-side effect of contractionary fiscal policy is larger, so inflation will fall, but the supply-side effect will moderate the extent of this fall. If the government cuts subsidies heavily, the SRAS effect could be large enough to offset the AD effect entirely, leading to higher inflation.
Key Takeaways
- A move from budget deficit to surplus is contractionary fiscal policy, which reduces AD and lowers inflation via the demand side.
- Fiscal policy can also affect AS: cuts to spending or tax rises can raise firms' costs or reduce investment, shifting SRAS left and increasing inflation, which offsets the demand-side effect.
- When assessing the impact of fiscal policy on inflation, you must consider both AD and AS effects to get full marks.
Common Mistakes
- Only analysing the AD effect: this will earn a maximum of 3 marks out of 6, as you miss the AS analysis marks.
- Only analysing the AS effect: this is incorrect, as the primary effect of fiscal contraction is on AD.
- Forgetting to conclude: the 1 mark for a valid conclusion is reserved, so you must end with a judgement on the net impact on inflation.
- Confusing budget deficit/surplus with expansionary/contractionary policy: a move to surplus is contractionary, not expansionary.
Things to Be Careful About
- Explicitly link the change in the budget balance to contractionary fiscal policy: do not just say 'the government cut spending' without linking it to the move to surplus.
- Explain the direction of both AD and SRAS shifts clearly, and link each shift to the resulting change in the price level and inflation.
- Ensure your conclusion addresses the specific question: the impact on the rate of inflation, not on output or employment.
Discuss whether the ‘huge decrease in the price of oil’ and the fall in the value of the rouble might bring more opportunities than threats to the Russian economy.
Answer
There are several opportunities from the two shocks for the Russian economy. First, the huge decrease in the oil price reduces production costs for domestic firms that use oil as an input (e.g. manufacturing, transport), making their exports more price competitive in international markets, which could increase export volumes and improve the current account balance. Second, the fall in the value of the rouble (a depreciation) makes all Russian exports cheaper in foreign currencies: if the price elasticity of demand (PED) for Russia's exports is elastic, export revenue will rise. It also makes imports more expensive for Russian consumers, so if the PED for imports is elastic, import expenditure falls, further improving the current account. A weaker rouble also makes Russia a cheaper destination for foreign tourists, boosting service exports.
There are also significant threats. First, Russia is one of the world's largest oil exporters, so a huge fall in the oil price reduces export revenue significantly if the PED for oil is price inelastic (which it typically is in the short run, as oil is a necessity for many uses). This worsens the current account balance, reduces national income and may lead to higher unemployment in the oil sector. Second, the fall in the rouble's value increases the price of imported goods, leading to imported inflation. This reduces living standards if nominal wages do not rise as fast as import prices, and raises costs for firms that rely on imported inputs, reducing their output and profitability.
The net impact depends on the structure of the Russian economy and the elasticities of its imports and exports. If Russia's non-oil export sector is large and elastic, and the PED for imports is elastic, opportunities may dominate. However, given Russia's high dependence on oil and gas exports, and the likelihood that oil demand is inelastic in the short run, the threats from the oil price fall are likely to outweigh the opportunities, though the weaker rouble provides some offsetting benefits for non-oil exporters. Overall, there are likely to be more threats than opportunities for the Russian economy from these two shocks.
There are likely to be more threats than opportunities for the Russian economy, due to its high dependence on inelastic oil export revenue, though the weaker rouble provides some offsetting benefits for non-oil sectors.
Background Concept
Russia is a major exporter of oil and gas, so its economy is heavily dependent on commodity export revenue. Exchange rate changes affect the relative price of a country's exports and imports: a depreciation (fall in value) of the domestic currency makes exports cheaper for foreign buyers and imports more expensive for domestic consumers. The impact of a depreciation on the trade balance depends on the price elasticity of demand (PED) for exports and imports, as described by the Marshall-Lerner condition: the trade balance will improve only if the sum of the PED of exports and the PED of imports is greater than 1 (elastic).
A fall in the price of a major export commodity like oil has mixed effects: it reduces production costs for domestic firms that use the commodity as an input (an opportunity), but reduces export revenue for commodity producers if demand for the commodity is price inelastic (a threat). The terms of trade (the ratio of export prices to import prices) falls when export prices fall relative to import prices, which reduces a country's purchasing power over imports.
Understanding the Question
This 6-mark point-based evaluative question asks you to discuss whether the huge decrease in the oil price and the fall in the value of the rouble bring more opportunities than threats to the Russian economy. The mark scheme requires you to: (1) analyse opportunities from both shocks (up to 3 marks, maximum 2 if only one shock is considered), (2) analyse threats from both shocks (up to 3 marks, maximum 2 if only one shock is considered), and (3) reach a well-reasoned conclusion on whether opportunities outweigh threats (1 mark). You must cover both shocks for both opportunities and threats to reach the top mark band.
Approach
First, identify opportunities from each shock: lower oil prices reduce input costs for non-oil firms, and a weaker rouble makes exports cheaper and imports more expensive, boosting export revenue if demand is elastic. Then identify threats from each shock: lower oil prices reduce export revenue for the oil sector if demand is inelastic, and a weaker rouble causes imported inflation and higher costs for import-dependent firms. Finally, weigh the two sides, noting that Russia's high dependence on oil exports means the oil price fall is likely to be a larger threat, though the weaker rouble provides some offsetting benefits, and reach a justified conclusion.
Step-by-Step Reasoning
- Opportunities from the oil price fall: Oil is a key input for transport, manufacturing and energy production. A fall in the global oil price reduces production costs for Russian firms that use oil, making their non-oil exports more price competitive in international markets. This could increase non-oil export volumes, improve the current account balance, and raise output and employment in non-oil sectors.
- Opportunities from the fall in the rouble's value: A depreciation of the rouble makes all Russian exports cheaper for foreign buyers. If the PED for Russia's exports is elastic (greater than 1), the percentage rise in export volumes will exceed the percentage fall in price, so total export revenue rises. It also makes imports more expensive for Russian consumers, so if the PED for imports is elastic, the percentage fall in import volumes will exceed the percentage rise in price, so total import expenditure falls, improving the current account. A weaker rouble also makes Russia a cheaper destination for foreign tourists, boosting service export revenue.
- Threats from the oil price fall: Russia is one of the world's largest oil and gas exporters, so oil export revenue makes up a large share of its national income and government budget. Oil demand is typically price inelastic in the short run (PED < 1), as it is a necessity for transport, heating and industrial production. A fall in the oil price will therefore reduce total oil export revenue, worsening the current account balance, lowering national income, and potentially causing job losses and lower profits in the oil and gas sector. It may also reduce government tax revenue from the oil sector, leading to cuts in public spending.
- Threats from the fall in the rouble's value: A weaker rouble increases the price of imported goods, including food, machinery and consumer durables. This leads to imported inflation, which reduces the purchasing power of households if nominal wages do not rise as fast as import prices, lowering living standards. It also raises production costs for firms that rely on imported inputs, reducing their profitability, output and employment.
- Weighing opportunities and threats: The net impact depends on the size of the two shocks, the elasticity of Russia's imports and exports, and the structure of its economy. Given Russia's high dependence on oil and gas exports, and the likelihood that oil demand is inelastic in the short run, the revenue loss from the oil price fall is likely to be large. The weaker rouble provides some offsetting benefits for non-oil exporters, but these are unlikely to fully compensate for the loss of oil revenue. Overall, threats are likely to outweigh opportunities.
Key Takeaways
- The impact of a commodity price fall depends on whether the country is a net exporter or importer of the commodity, and the price elasticity of demand for the commodity.
- The impact of a currency depreciation on the trade balance depends on the Marshall-Lerner condition: the sum of the PED of exports and imports must be greater than 1 for the trade balance to improve.
- When evaluating external shocks, you must consider both the sector-specific effects (e.g. oil exporters vs non-oil exporters) and the economy-wide effects (e.g. inflation, living standards).
Common Mistakes
- Only analysing one of the two shocks: the mark scheme caps the mark at 2 for opportunities or threats if only one shock is considered, so you must cover both oil price fall and rouble depreciation for both sides.
- One-sided analysis: if you only discuss opportunities or only threats, you will not earn the evaluation marks, as evaluative questions require two developed sides.
- Forgetting to conclude: the 1 mark for a justified conclusion is reserved, so you must end with a clear judgement on whether opportunities outweigh threats.
- Assuming a depreciation always improves the trade balance: this is only true if the Marshall-Lerner condition holds, which may not be the case in the short run.
Things to Be Careful About
- Ensure you link each point to the Russian economy specifically, rather than giving generic points about oil prices or exchange rates.
- When discussing the oil price fall, distinguish between the effect on oil exporters (negative) and firms that use oil as an input (positive).
- When discussing the rouble depreciation, distinguish between the effect on exporters (positive) and importers/consumers (negative).
- Your conclusion must be justified: do not just say 'it depends' — explain which side is stronger and why, based on the Russian context.
The rest of this paper
3 more questions- Q2Production Possibility Curves · Economic Systems20M
- Q3Elasticities of Demand · Market Equilibrium and the Price Mechanism20M
- Q4Balance of Payments20M