Economics 9708/12 — February/March 2022
Cambridge AS Level · AS Level Multiple Choice · answer key with instant marking and worked solutions
Topics Demand and Supply · Market Equilibrium and the Price Mechanism · International Trade and Comparative Advantage · Production Possibility Curves · Classification of Goods and Services · Fiscal Policy · +10 more
Tap an option under each question to check it — your score builds as you go.
A production possibility curve shows the combinations of outputs an economy can produce using all available resources.
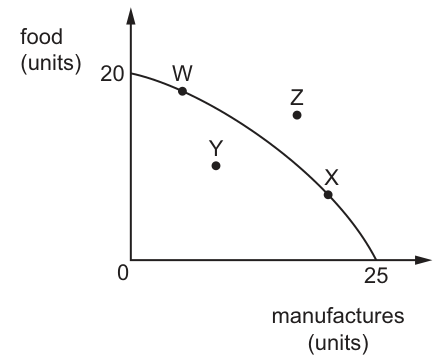
At which points on the diagram are all available resources used?
Options
A W and X only
B W, X and Z only
C W, X, Y and Z
D Z and Y only
Answer
A production possibility curve (PPC) shows the maximum possible output combinations an economy can achieve when all available resources are fully and efficiently employed. Points that lie on the curve, such as W and X, represent productive efficiency where all resources are being used. Point Y lies inside the curve, indicating that resources are underutilised or unemployed. Point Z lies outside the curve, representing a level of output that is unattainable with the economy's current resources and technology. Therefore, only points W and X show all available resources in use.
Answer
A
A
Background Concept
A production possibility curve (PPC), also called a production possibility frontier (PPF), is a fundamental economic model that illustrates the constraints facing an economy. It plots the maximum possible combinations of two goods that can be produced when all available resources (land, labour, capital and enterprise) are fully and efficiently utilised, given the current state of technology.
The curve is typically drawn concave to the origin because of the law of increasing opportunity cost – as production of one good increases, increasingly unsuitable resources must be transferred from the other good, raising the marginal opportunity cost.
Three types of positions on the diagram carry distinct meanings:
- On the curve: Points such as W and X represent productive efficiency. The economy is operating at its maximum potential; all resources are fully employed and there is no waste. It is impossible to increase output of one good without reducing output of the other.
- Inside the curve: Points such as Y represent inefficiency and underutilisation of resources. The economy could increase output of both goods simultaneously by moving toward the curve, for example by reducing unemployment or improving the use of existing capital.
- Outside the curve: Points such as Z represent unattainable output levels with the economy's current resources and technology. To reach Z, the economy would need economic growth – an outward shift of the PPC brought about by factors such as an increase in the quantity or quality of resources or technological progress.
Understanding the Question
The question asks you to identify which points on the diagram represent a situation where all available resources are used. This is a direct test of your understanding of what the PPC represents: the boundary between attainable and unattainable output, and between efficient and inefficient production.
The diagram shows a concave PPC with food on the vertical axis and manufactures on the horizontal axis. Four points are marked: W and X lie on the curve; Y lies inside the curve; Z lies outside the curve. You must select the option that correctly identifies the points where all resources are employed.
Approach
The key is to match each point to its economic meaning:
- Recall that the PPC itself represents the maximum feasible output combinations when resources are fully employed.
- Therefore, any point on the curve indicates full resource utilisation.
- Points inside the curve indicate underutilisation (unemployment or idle capacity).
- Points outside the curve are impossible to reach with current resources.
- Select the option that lists only the points on the curve.
Step-by-Step Reasoning
Step 1: Identify the meaning of point W. Point W lies directly on the PPC. At this point, the economy is producing a relatively high quantity of food and a low quantity of manufactures. Because the point is on the boundary, all available resources are being fully and efficiently used. Any attempt to produce more of either good would require sacrificing some of the other.
Step 2: Identify the meaning of point X. Point X also lies on the PPC, but at a different combination – lower food output and higher manufactures output. Like W, this point represents productive efficiency and full employment of resources.
Step 3: Identify the meaning of point Y. Point Y is located inside the PPC. This means the economy is producing less of both goods than it potentially could. This situation arises when resources are unemployed or underemployed – for example, during a recession when there is cyclical unemployment, or when factories are idle. Because not all resources are being used, Y does not satisfy the condition in the question.
Step 4: Identify the meaning of point Z. Point Z is located outside the PPC. This represents a combination of food and manufactures that exceeds the economy's current productive capacity. With the existing quantity and quality of resources and the current technology, the economy cannot reach Z. It is therefore not a point where all available resources are used; rather, it is a point that would require more resources than currently exist.
Step 5: Select the correct option. Only points W and X satisfy the condition of using all available resources. Option A states "W and X only", which matches our analysis.
Key Takeaways
- The PPC represents the maximum output combinations possible with full and efficient use of all available resources.
- Points on the curve indicate productive efficiency and full employment.
- Points inside the curve indicate inefficiency and underutilisation of resources.
- Points outside the curve are unattainable with current resources.
- When a question asks where "all available resources are used", look exclusively for points on the curve itself.
Common Mistakes
-
Confusing point Y with full employment: Some students mistakenly believe that any point inside the curve still uses all resources. This is incorrect – points inside the curve specifically represent underutilisation, meaning some resources are idle.
-
Confusing point Z with full employment: Students may think that because Z represents high output, it must use all resources. However, Z is unattainable with current resources; reaching it would require more resources than the economy possesses.
-
Misreading the diagram: Failing to notice whether a point is on, inside, or outside the curve leads to selecting the wrong option. Always check the position relative to the curve carefully.
Things to Be Careful About
- The phrase "all available resources are used" is the precise definition of a point on the PPC. Do not confuse this with points that merely use some resources efficiently.
- The shape of the curve (concave) is irrelevant to this particular question; what matters is the position of each point relative to the curve.
- In multiple-choice questions of this type, eliminate any option that includes point Y (inefficient) or point Z (unattainable) before selecting your final answer.
The rest of this paper
29 more questions- Q2Economic Methodology1M
- Q3(Legacy) - Money1M
- Q4Production Possibility Curves1M
- Q5Demand and Supply1M
- Q6Demand and Supply1M
- Q7Demand and Supply1M
- Q8Elasticities of Demand1M
- Q9Classification of Goods and Services1M
- Q10Price Elasticity of Supply1M
- Q11Demand and Supply · Market Equilibrium and the Price Mechanism1M
- Q12Demand and Supply1M
- Q13Market Equilibrium and the Price Mechanism1M
- Q14Fiscal Policy1M
- Q15Methods of Government Intervention in Markets1M
- Q16Classification of Goods and Services1M
- Q17Fiscal Policy1M
- Q18Methods of Government Intervention in Markets · Market Equilibrium and the Price Mechanism1M
- Q19Price Stability1M
- Q20Protectionism1M
- Q21International Trade and Comparative Advantage1M
- Q22Aggregate Demand and Aggregate Supply1M
- Q23Aggregate Demand and Aggregate Supply1M
- Q24Balance of Payments1M
- Q25International Trade and Comparative Advantage1M
- Q26Protectionism1M
- Q27International Trade and Comparative Advantage1M
- Q28Balance of Payments1M
- Q29Monetary Policy1M
- Q30Monetary Policy1M