Economics 9708/23 — October/November 2021
Cambridge AS Level · AS Level Data Response and Essays · worked solutions for every part, with the mark scheme
Topics Elasticities of Demand · Fiscal Policy · Aggregate Demand and Aggregate Supply · Protectionism · Economic Growth · Scarcity, Choice and Opportunity Cost · +5 more
China’s uncertain economic prospects
Fig. 1.1 below shows growth in real output by components of aggregate demand in China from 2010 to 2017.
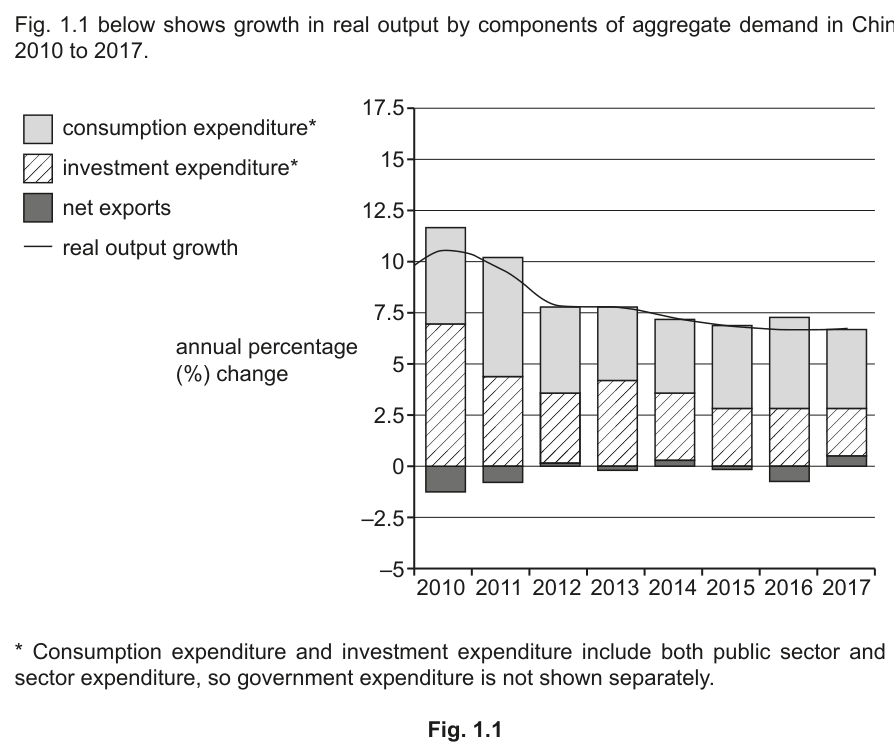
- Consumption expenditure and investment expenditure include both public sector and private sector expenditure, so government expenditure is not shown separately.
Table 1.1 below shows the annual percentage (%) change in new car sales in China from 2010 to 2017.
Table 1.1
| Year | % change |
|---|---|
| 2010 | 33.2 |
| 2011 | 5.2 |
| 2012 | 7.1 |
| 2013 | 15.7 |
| 2014 | 9.9 |
| 2015 | 7.6 |
| 2016 | 14.9 |
| 2017 | 2.4 |
In 2018, real output in China’s economy grew by 6.6%, its lowest figure this century (see Fig. 1.1). Many economists believe that growth in China’s real output will continue to be around this level over the next few years.
In looking to the future, the Chinese government has sought to restructure its economy. This has resulted in an increased contribution from domestic consumption, with less reliance on large-scale manufacturing in favour of quality manufacturing. For Chinese consumers, buying a house is the main priority, followed by purchasing a new car. Table 1.1 shows the annual rate of change in new car sales from 2010 to 2017.
China’s plans for maintaining its growth in real output at a rate of around 6.6% are threatened by ongoing tensions over trade with the United States (US). These tensions provide a real threat to China meeting even its most pessimistic growth targets for real output. Various studies have estimated the effects of a protectionist trade war with the US on China’s economy. These estimates are all negative and range from -0.6% to -1.4% of real output.
Source: China Daily, 19 February 2019 and knoema.com, October 2019
Use the data in Fig. 1.1 to describe how the contribution to real output growth of the different components of aggregate demand in China has changed from 2010 to 2017.
What relationship might you expect between the rate of growth in real output and sales of new cars in an economy?
Consider whether the evidence in Fig. 1.1 and Table 1.1 supports this relationship.
State one protectionist measure that may be adopted by the US in a trade war with China and explain what effect this would have on consumers and producers in the US.
Discuss whether cuts in direct taxes would increase the demand for all types of consumer goods in China.
Discuss whether increasing domestic consumption is the best way for China to maintain the growth in real output at the current rate 'over the next few years'.
The rest of this paper
3 more questions- Q2Scarcity, Choice and Opportunity Cost · Economic Systems · Classification of Goods and Services · Reasons for Government Intervention in Markets20M
- Q3Elasticities of Demand20M
- Q4Price Stability · Monetary Policy · Fiscal Policy20M