Economics 9708/23 — October/November 2020
Cambridge AS Level · AS Level Data Response and Essays · worked solutions for every part, with the mark scheme
Topics Aggregate Demand and Aggregate Supply · Elasticities of Demand · Price Elasticity of Supply · Exchange Rates · Balance of Payments · Market Equilibrium and the Price Mechanism · +3 more
Malaysia’s persistent trade surplus
Malaysia has the third highest income per head in South East Asia and, in the last six years, has experienced an average rate of growth approaching 6% per year. It is now a successful ‘newly industrialised market economy’ with a strong export sector. This strength is seen in its consistent surplus on its balance of trade in goods and services (see Fig. 1.1).
In the past, Malaysia’s economy was firmly based on the production of basic raw materials such as rubber and tin. In more recent years, however, its growing prosperity has come about through it being a leading exporter of electrical appliances, electronic parts, petroleum and natural gas. China is its biggest export market, accounting for 16% of total exports in 2016, and a further 11% of exports go to the European Union (EU). Malaysia’s economy though remains vulnerable to external shocks like the global financial crisis of 2007–2008, which led to capital outflows.
Despite what appears to be a strong external trade position, the foreign exchange rate of Malaysia’s currency, the ringgit (RM), against the US dollar has experienced significant change since 2013 (see Fig. 1.2). Given the importance of trade in goods and services to its economy, any volatility and uncertainty of the ringgit’s value may well hinder Malaysia in its drive to become a ‘high income economy’.
Source: adapted from tradingeconomics.com/articles, accessed April 2018
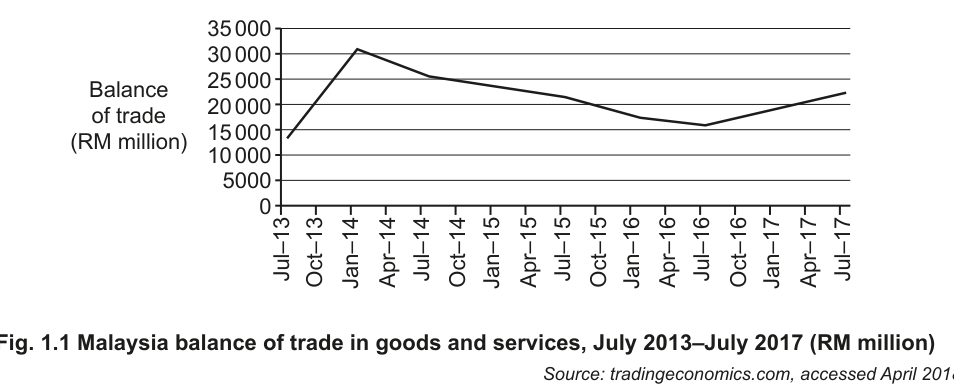
Fig. 1.1 Malaysia balance of trade in goods and services, July 2013–July 2017 (RM million)
Source: tradingeconomics.com, accessed April 2018
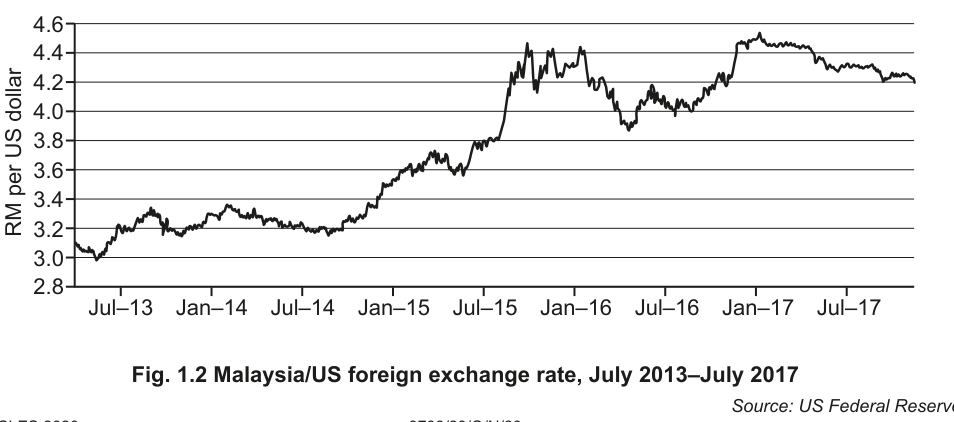
Fig. 1.2 Malaysia/US foreign exchange rate, July 2013–July 2017
Source: US Federal Reserve
State whether the Malaysian ringgit depreciated or appreciated against the US dollar over the period July 2013 to July 2017. Justify your answer.
Answer
The Malaysian ringgit depreciated against the US dollar over the period.
Justification: The exchange rate is measured as RM per US dollar. Over the period, the number of ringgits needed to buy one US dollar rose from approximately 3.2 in July 2013 to approximately 4.3 in July 2017. This means the ringgit buys fewer US dollars, so it has depreciated (or equivalently, the US dollar has appreciated against the ringgit).
The Malaysian ringgit depreciated against the US dollar, as the RM per USD exchange rate rose from ~3.2 in July 2013 to ~4.3 in July 2017, meaning the ringgit is worth less US dollars.
Background Concept
An exchange rate is the price of one currency expressed in terms of another. When an exchange rate is quoted as units of domestic currency per unit of foreign currency (e.g., RM per US dollar), a rise in the rate means the domestic currency buys less foreign currency: this is a depreciation of the domestic currency. A fall in the rate means the domestic currency buys more foreign currency: this is an appreciation.
Understanding the Question
The question asks you to identify whether the Malaysian ringgit (RM) depreciated or appreciated against the US dollar (USD) between July 2013 and July 2017, using the data in Fig. 1.2, and to justify your answer with reference to the exchange rate data. The key is to interpret the direction of the RM per USD rate over the period.
Approach
First, read the starting and ending values of the exchange rate in Fig. 1.2. Then apply the definition of depreciation/appreciation for a quote expressed as RM per USD: if the number of RM per USD rises, the ringgit has depreciated; if it falls, it has appreciated. The justification must link the observed change in the rate to the definition.
Step-by-Step Reasoning
- Fig. 1.2 shows the Malaysia/US exchange rate quoted as RM per US dollar. In July 2013, the rate was approximately 3.2 RM per USD. By July 2017, the rate had risen to approximately 4.3 RM per USD.
- A higher RM per USD rate means that more ringgits are needed to buy one US dollar. This means the ringgit has lost value relative to the US dollar, which is defined as a depreciation of the ringgit (or equivalently, an appreciation of the US dollar).
- The justification does not require exact figures, only a clear statement that the ringgit is worth less US dollars (or the US dollar is worth more ringgits) at the end of the period than at the start.
Key Takeaways
- Always check the convention of the exchange rate quote (domestic per foreign vs foreign per domestic) before identifying appreciation or depreciation.
- A rise in the domestic currency per foreign currency rate always indicates depreciation of the domestic currency.
Common Mistakes
- Reversing the direction: stating that a rise in RM per USD is an appreciation of the ringgit, which is incorrect.
- Failing to link the observed change in the rate to the definition of depreciation in the justification, e.g., just stating "the rate went up" without explaining what that means for the ringgit's value.
Things to Be Careful About
- The question asks for the movement of the ringgit against the US dollar, not the other way around. Make sure your justification refers to the ringgit's value, not just the change in the rate.
Describe the relationship you would expect between a change in the foreign exchange rate of a country and its balance of trade in goods and services.
Answer
- A depreciation (fall in value) of a country's exchange rate makes its exports cheaper in foreign markets and imports more expensive for domestic consumers. This is expected to increase export volumes and reduce import volumes, leading to an increase in the trade surplus (or a reduction in a trade deficit).
- An appreciation (rise in value) of a country's exchange rate makes its exports more expensive in foreign markets and imports cheaper for domestic consumers. This is expected to reduce export volumes and increase import volumes, leading to a decrease in the trade surplus (or an increase in a trade deficit).
Depreciation of the exchange rate increases the trade surplus (or reduces a deficit); appreciation decreases the trade surplus (or increases a deficit).
Background Concept
The balance of trade in goods and services is the difference between the value of a country's exports and imports of goods and services. It is a key component of the current account of the balance of payments. Exchange rate movements affect the relative prices of exports and imports: when a domestic currency depreciates, domestic goods become cheaper for foreign buyers (boosting exports) and foreign goods become more expensive for domestic buyers (reducing imports), improving the trade balance. The opposite occurs when the domestic currency appreciates.
Understanding the Question
This part asks you to describe the expected (theoretical) relationship between changes in a country's foreign exchange rate and its balance of trade in goods and services. You need to cover both directions of exchange rate movement: depreciation and appreciation, and the corresponding expected change in the trade balance (surplus or deficit). No data from the figures is required for this part.
Approach
First, define the two relevant exchange rate movements: depreciation (fall in the domestic currency's value) and appreciation (rise in the domestic currency's value). Then, for each, explain the effect on export and import prices, and the resulting expected change in the trade balance.
Step-by-Step Reasoning
- For a depreciation of the domestic currency: exports become cheaper for foreign consumers, so the quantity of exports demanded rises. Imports become more expensive for domestic consumers, so the quantity of imports demanded falls. The combination of higher export revenue and lower import expenditure increases the trade surplus (or reduces an existing trade deficit).
- For an appreciation of the domestic currency: exports become more expensive for foreign consumers, so the quantity of exports demanded falls. Imports become cheaper for domestic consumers, so the quantity of imports demanded rises. The combination of lower export revenue and higher import expenditure decreases the trade surplus (or increases an existing trade deficit).
Key Takeaways
- The theoretical link between exchange rate movements and the trade balance operates through changes in the relative prices of exports and imports, which affect the quantity of exports and imports demanded (the Marshall-Lerner condition, which requires the sum of export and import demand elasticities to be greater than 1 for the relationship to hold, is not required for this question).
- The relationship works in both directions: depreciation improves the trade balance, appreciation worsens it.
Common Mistakes
- Only describing one direction of exchange rate movement (e.g., only depreciation) and missing the appreciation case, which would lose the second mark.
- Confusing the direction of the effect, e.g., stating that depreciation worsens the trade balance.
- Using data from the figures in this part, which is not required and may lead to inaccuracies if the data does not fit the theoretical relationship.
Things to Be Careful About
- Make sure to clearly link each exchange rate movement to its expected effect on the trade balance, rather than just stating the two movements separately.
Explain whether the evidence in Fig. 1.1 and Fig. 1.2 confirms this relationship.
Answer
The evidence in the two figures does not generally confirm the expected relationship. For example, between January 2014 and July 2016, the ringgit depreciated (the RM per USD rate rose from approximately 3.3 to 4.5), but the trade surplus fell from approximately RM31,000 million to RM16,000 million. This is the opposite of the expected relationship, where depreciation should increase the trade surplus.
(Alternatively, a candidate could note that between July 2013 and January 2014, both the exchange rate rose (depreciation) and the trade surplus increased, which is consistent with the expected relationship, but this is only a short period and the overall trend does not support the theory.)
The evidence does not generally confirm the expected relationship, as periods of ringgit depreciation (e.g., 2014–2016) coincided with a falling trade surplus, which contradicts the theoretical prediction.
Background Concept
The theoretical relationship between exchange rate movements and the trade balance (described in part b-i) is not always observed in real-world data, for several reasons: time lags in the adjustment of trade volumes to price changes, the fact that trade is often priced in foreign currencies (so exchange rate changes do not immediately affect prices), differences in the price elasticity of demand for exports and imports, and other factors affecting trade volumes (such as changes in foreign or domestic income, productivity, or trade policies).
Understanding the Question
This part asks you to use the data in Fig. 1.1 (Malaysia's trade balance) and Fig. 1.2 (the Malaysia/US exchange rate) to explain whether the observed trends confirm the theoretical relationship you described in part b-i. You need to compare the timing of exchange rate movements and changes in the trade surplus, and note any inconsistencies or consistencies.
Approach
First, identify the key trends in both graphs over the full period, then look for specific time periods where the two variables move in the same or opposite directions to the theoretical expectation. You do not need to explain why the relationship does not hold, only to describe whether the evidence confirms it.
Step-by-Step Reasoning
- The theoretical expectation is that ringgit depreciation (rise in RM per USD) should be associated with a rising trade surplus, and appreciation (fall in RM per USD) with a falling trade surplus.
- Looking at the full period July 2013 to July 2017:
- From July 2013 to January 2014: RM per USD rises slightly (depreciation), trade surplus rises sharply from ~RM14,000m to ~RM31,000m: this is consistent with the theory.
- From January 2014 to July 2016: RM per USD rises significantly (further depreciation, from ~3.3 to ~4.5), but the trade surplus falls steadily from ~RM31,000m to ~RM16,000m: this is inconsistent with the theory, as depreciation should have increased the surplus.
- From July 2016 to July 2017: RM per USD falls slightly (appreciation, from ~4.5 to ~4.3), but the trade surplus rises from ~RM16,000m to ~RM22,000m: this is also inconsistent with the theory.
- Overall, the two graphs do not show a clear consistent relationship, so the evidence does not confirm the theoretical expectation. The only consistent period is the first few months, but the rest of the period contradicts the theory.
Key Takeaways
- Real-world data often does not fit theoretical models perfectly, due to other influencing factors and time lags.
- When testing a theoretical relationship with data, it is important to look at the full time period, not just isolated segments, to get an accurate picture.
Common Mistakes
- Only noting a single consistent period and concluding that the evidence confirms the relationship, ignoring the longer periods where it does not hold.
- Reversing the direction of causation (e.g., stating that the trade balance affects the exchange rate) without explaining it, which may lose marks unless clearly justified.
- Quoting figures without linking them to the trends in the other graph, e.g., just stating the trade surplus fell without mentioning the exchange rate movement at the same time.
Things to Be Careful About
- Always link changes in one variable to changes in the other at the same time period, to show you are comparing the two trends.
- The question asks whether the evidence confirms the relationship, so your answer must give a clear overall judgement, supported by specific data from the graphs.
In July 2017, Malaysia’s balance of trade in goods and services was RM22045 million and its current account balance was RM9642 million.
Explain the reason for this difference.
Answer
The current account balance includes not only the balance of trade in goods and services, but also net primary income (e.g., cross-border profits, interest and dividends) and net secondary income (e.g., remittances, foreign aid). The trade surplus of RM22,045 million is larger than the current account surplus of RM9,642 million because Malaysia's net primary and secondary income is negative: outflows of primary and secondary income exceed inflows, so these components reduce the overall current account balance.
The difference is due to negative net primary and secondary income balances, which are included in the current account but not in the trade balance, reducing the current account surplus below the trade surplus.
Background Concept
The current account of the balance of payments records all flows of income and spending between a country and the rest of the world. It has four main components:
- Trade in goods (visible balance)
- Trade in services (invisible balance)
- Net primary income: income earned by residents from abroad minus income earned by foreign residents domestically (e.g., profits of foreign-owned firms in Malaysia sent overseas, wages of Malaysian workers abroad, interest and dividend payments)
- Net secondary income: one-way transfers with no corresponding good or service provided, e.g., remittances sent home by Malaysian workers overseas, foreign aid received or given.
The balance of trade in goods and services is the sum of the first two components. The current account balance is the sum of all four components.
Understanding the Question
You are given the July 2017 values for Malaysia's balance of trade in goods and services (RM22,045 million surplus) and its overall current account balance (RM9,642 million surplus). You need to explain why the current account surplus is smaller than the trade surplus.
Approach
First, recall the components of the current account that are not included in the trade balance: primary income and secondary income. Then explain that if these components are negative (net outflows exceed inflows), they will reduce the current account balance relative to the trade balance. You can also calculate the implied value of the net primary and secondary income to support your explanation.
Step-by-Step Reasoning
- The current account balance = balance of trade in goods + balance of trade in services + net primary income + net secondary income.
- The trade balance given is the sum of trade in goods and services, so the difference between the current account balance and the trade balance is equal to net primary income + net secondary income.
- Calculating the difference: RM9,642 million - RM22,045 million = -RM12,403 million. This means net primary and secondary income is negative: Malaysia pays out more in primary income (e.g., profits of foreign-owned firms in Malaysia sent to their home countries) and secondary income (e.g., remittances sent abroad) than it receives.
- These negative net income flows reduce the overall current account surplus, making it smaller than the trade surplus.
Key Takeaways
- The trade balance is only a part of the current account; the current account also includes cross-border income and transfer flows.
- A country can have a trade surplus but a smaller current account surplus (or even a current account deficit) if its net primary and secondary income is negative.
Common Mistakes
- Stating that the difference is due to the capital account or financial account, which are separate from the current account and do not affect its balance.
- Failing to explain why the difference exists, e.g., just stating "other parts of the current account" without identifying them or explaining that they are negative.
- Confusing the trade balance (goods + services) with the current account, leading to incorrect explanations.
Things to Be Careful About
- The question gives both values as surpluses, so the difference must be explained by a negative component, not a positive one. Make sure your explanation accounts for the current account being smaller than the trade surplus.
Other than exchange rate changes, explain two possible reasons for Malaysia’s increasing balance of trade in goods and services surplus from July 2016 to July 2017.
Answer
Two possible reasons for the increasing trade surplus from July 2016 to July 2017 are:
-
Rising foreign incomes in Malaysia's major export markets: China and the EU together account for 27% of Malaysia's total exports. If real incomes in these markets grew between 2016 and 2017, demand for Malaysian exports (electrical appliances, electronic parts, petroleum and natural gas) would increase. Higher export volumes raise the value of exports relative to imports, increasing the trade surplus.
-
Increased government subsidies for export industries: Subsidies reduce the production costs of Malaysian export firms, enabling them to lower export prices or expand output. Lower export prices make Malaysian goods more price-competitive in global markets, increasing the quantity of exports demanded. Higher export volumes, or higher export values if prices are maintained, raise the trade surplus.
(An alternative valid reason is a fall in domestic consumer demand in Malaysia: lower household disposable incomes reduce spending on imported goods, lowering import volumes and increasing the trade surplus.)
Two key reasons are rising foreign incomes in Malaysia's main export markets (increasing export demand) and government subsidies to export industries (making exports more price-competitive), both of which raise export volumes and the trade surplus.
Background Concept
The balance of trade in goods and services is the difference between the value of a country's exports and imports of goods and services. A trade surplus occurs when export value exceeds import value. Factors affecting the trade balance include exchange rate movements, changes in domestic and foreign incomes, changes in production costs and competitiveness, government trade policies, and changes in domestic demand. For this question, exchange rate changes are excluded, so you need to focus on other factors.
Understanding the Question
You are asked to explain two possible reasons (other than exchange rate changes) for the increase in Malaysia's trade surplus between July 2016 and July 2017. Each reason needs to be identified and then explained with a clear causal chain linking the factor to higher exports or lower imports, and thus to a larger trade surplus. You can use context from the extract (e.g., Malaysia's main export markets, its key export industries) to strengthen your answers.
Approach
First, brainstorm possible factors that affect export and import volumes other than exchange rates: changes in foreign income, changes in domestic income, government policies (subsidies, taxes, trade agreements), changes in productivity or quality of exports, changes in global commodity prices (for Malaysia's petroleum and gas exports). Then select the two strongest reasons, and for each, build a full causal chain: factor -> change in export/import prices or demand -> change in export/import volumes -> change in trade surplus.
Step-by-Step Reasoning
- Reason 1: Growth in foreign incomes in Malaysia's key export markets
- The extract states that China (16% of exports) and the EU (11% of exports) are Malaysia's largest export markets. If real incomes in these economies grew between 2016 and 2017, demand for Malaysian exports (electrical appliances, electronic parts, petroleum and natural gas) would increase.
- Higher foreign demand for Malaysian exports raises the volume and value of exports, ceteris paribus. If import volumes remain constant, the trade surplus increases.
- Reason 2: Government subsidies to export industries
- The Malaysian government could provide subsidies to its export sectors (e.g., electronics, petroleum) to lower their production costs.
- Lower production costs allow firms to reduce export prices, making Malaysian goods more price-competitive in global markets. This increases the quantity of exports demanded.
- Higher export volumes raise the value of exports, increasing the trade surplus, ceteris paribus.
(Alternative valid reason: A fall in domestic consumer demand in Malaysia would reduce household spending on imported goods, lowering import volumes and increasing the trade surplus, ceteris paribus.)
Key Takeaways
- The trade balance is affected by a wide range of factors beyond exchange rates, including income levels at home and abroad, government policy, and changes in competitiveness.
- A full explanation of a factor's effect on the trade balance requires linking the factor to changes in either export or import volumes (or both), not just stating the factor exists.
Common Mistakes
- Identifying a reason but failing to explain how it affects the trade balance, e.g., just stating "foreign incomes rose" without linking this to higher export demand and a larger surplus.
- Using exchange rate changes as a reason, which the question explicitly excludes.
- Listing more than two reasons but explaining none fully, which will not earn full marks as each reason requires a full explanation.
Things to Be Careful About
- Use context from the extract where possible (e.g., mentioning Malaysia's key export markets or industries) to make your explanation more applied and credible.
- Make sure each causal chain is complete: factor -> change in exports/imports -> change in trade surplus.
Discuss whether the Malaysian government should be concerned about persistent surpluses in its balance of trade in goods and services.
Answer
Advantages of persistent trade surpluses for Malaysia:
- Higher export volumes increase aggregate demand, leading to higher real output and employment in export industries and related sectors (via the multiplier effect). This supports Malaysia's economic growth and its goal of becoming a high-income economy.
- Trade surpluses generate foreign currency inflows, improving the current account balance, increasing foreign exchange reserves, and attracting foreign direct investment, which further supports economic growth.
- A strong export sector reduces Malaysia's vulnerability to domestic economic shocks, as export demand provides a stable source of revenue.
Disadvantages of persistent trade surpluses for Malaysia:
- If the economy is operating near full capacity, higher aggregate demand from export-led growth may cause demand-pull inflation, eroding living standards.
- Persistent large surpluses may lead to retaliation from trading partners, who may impose tariffs or other trade barriers on Malaysian exports, reducing export volumes and worsening the trade balance.
- Large foreign currency inflows from trade surpluses can cause the ringgit to appreciate, making other non-resource export sectors less competitive and increasing volatility in the exchange rate (as seen in Fig. 1.2), which creates uncertainty for exporters and investors.
- A reliance on export-led growth may lead to under-investment in domestic industries and lower domestic consumption, reducing living standards for domestic consumers who have less access to a variety of goods and services.
Evaluative judgement:
The Malaysian government should be moderately concerned about persistent trade surpluses. While the surpluses have supported strong economic growth and employment in recent years, the risks of inflation, trading partner retaliation, and exchange rate volatility mean that an overly large and persistent surplus is unsustainable. The government should aim to maintain a more balanced trade position, for example by stimulating domestic demand to reduce reliance on exports, while continuing to support export sector competitiveness.
The Malaysian government should be moderately concerned: while persistent trade surpluses have supported growth and employment, the risks of demand-pull inflation, trading partner retaliation, and exchange rate volatility mean the government should pursue a more balanced trade position to ensure sustainable long-term growth.
Background Concept
A balance of trade surplus occurs when a country's export value exceeds its import value. Persistent surpluses have both positive and negative effects on the domestic economy and the country's external relationships. Positive effects include higher aggregate demand, economic growth, and employment, as well as improved external balances and foreign exchange reserves. Negative effects include potential demand-pull inflation if the economy is at full capacity, retaliation from trading partners who view the surplus as a result of unfair trade practices, exchange rate appreciation that harms other export sectors, and under-consumption of domestic goods if resources are diverted to export production.
Understanding the Question
The question asks you to discuss whether the Malaysian government should be concerned about persistent trade surpluses. This is an evaluative question, so you need to present both advantages and disadvantages of the surpluses, then reach a justified judgement about whether the government should be concerned, based on the relative strength of the advantages and disadvantages. You can use context from the extract (e.g., Malaysia's growth rate, its vulnerability to external shocks, exchange rate volatility) to support your points.
Approach
First, outline the advantages of persistent trade surpluses for Malaysia, linking each to the extract's context (e.g., export-led growth, high income economy goal). Then outline the disadvantages, again using context where relevant (e.g., exchange rate volatility in Fig. 1.2, vulnerability to external shocks). Finally, weigh the two sides: consider whether the advantages outweigh the disadvantages, or vice versa, and under what conditions. Reach a clear, justified judgement that answers the question directly.
Step-by-Step Reasoning
- Advantages of persistent trade surpluses
- Higher export volumes increase aggregate demand (AD = C + I + G + (X - M)), leading to higher real output and employment in export sectors (electronics, petroleum, appliances) and related industries (logistics, retail). This supports Malaysia's average 6% annual growth rate and its goal of becoming a high-income economy.
- Trade surpluses improve the current account balance, increasing foreign exchange reserves and reducing vulnerability to external shocks (such as the 2007-2008 financial crisis, which caused capital outflows). Strong reserves also attract foreign direct investment, which further boosts productive capacity and growth.
- A strong export sector provides a stable source of foreign currency earnings, which can be used to fund imports of capital goods needed for further industrialisation.
- Disadvantages of persistent trade surpluses
- If the economy is operating near full employment (as a newly industrialised economy with 6% growth might be), higher AD from export-led growth can cause demand-pull inflation, eroding the purchasing power of households and reducing international competitiveness if domestic prices rise faster than trading partners' prices.
- Persistent large surpluses may lead to protectionist retaliation from trading partners, who may accuse Malaysia of unfair trade practices (e.g., export subsidies) and impose tariffs or quotas on Malaysian exports. This would reduce export volumes and worsen the trade balance, as well as increase uncertainty for exporters.
- Large foreign currency inflows from trade surpluses can cause the ringgit to appreciate, making other non-resource export sectors less competitive. This is linked to the exchange rate volatility seen in Fig. 1.2, which the extract notes may hinder Malaysia's development as a high-income economy by creating uncertainty for exporters and investors.
- A focus on export production may lead to under-consumption of domestically produced goods, as resources are diverted to meet foreign demand rather than domestic demand, potentially lowering living standards for Malaysian consumers who have less access to a range of goods and services.
- Evaluative judgement
- The advantages of the trade surplus have clearly supported Malaysia's strong growth and industrialisation in recent years, so the surpluses are not entirely negative. However, the disadvantages — particularly the risk of trading partner retaliation, exchange rate volatility, and potential inflation — mean that persistent large surpluses are not sustainable in the long run. The government should therefore be moderately concerned, and should implement policies to stimulate domestic demand (e.g., targeted cash transfers, infrastructure spending) to reduce reliance on exports and achieve a more balanced trade position, while maintaining support for export sector competitiveness.
Key Takeaways
- Evaluative questions require a balanced discussion of both advantages and disadvantages, followed by a justified judgement that answers the specific question asked.
- Persistent trade imbalances (surpluses or deficits) have both domestic and external consequences, and the optimal position is often a balanced trade account, rather than a large surplus or deficit.
- Context from the extract (e.g., Malaysia's growth goals, exchange rate volatility, key export markets) should be used to make your answer specific to the question, rather than generic.
Common Mistakes
- Presenting only advantages or only disadvantages of the trade surplus, which forfeits all evaluation marks (a one-sided answer scores zero for evaluation in 9708 mark schemes).
- Ending with a summary of both sides instead of a justified judgement, e.g., "there are advantages and disadvantages" without stating whether the government should be concerned and why.
- Failing to use context from the extract, giving a generic answer about trade surpluses that does not address Malaysia's specific situation.
- Listing many shallow points instead of developing a few points fully, which loses marks for lack of depth.
Things to Be Careful About
- The judgement must be clear and justified: do not sit on the fence with "it depends" unless you explain what it depends on and which way the balance falls under different conditions.
- Make sure each advantage and disadvantage is fully explained, with a clear link to the trade surplus and to the Malaysian economy, rather than just stating a generic effect of surpluses.
The rest of this paper
3 more questions- Q2Market Equilibrium and the Price Mechanism · Methods of Government Intervention in Markets · Elasticities of Demand · Price Elasticity of Supply20M
- Q3Elasticities of Demand · Price Elasticity of Supply20M
- Q4Supply-Side Policy · Aggregate Demand and Aggregate Supply · Price Stability20M