Economics 9708/12 — October/November 2020
Cambridge AS Level · AS Level Multiple Choice · answer key with instant marking and worked solutions
Topics Exchange Rates · Elasticities of Demand · Demand and Supply · Price Elasticity of Supply · Fiscal Policy · Monetary Policy · +15 more
Tap an option under each question to check it — your score builds as you go.
The diagram shows a production possibility curve.
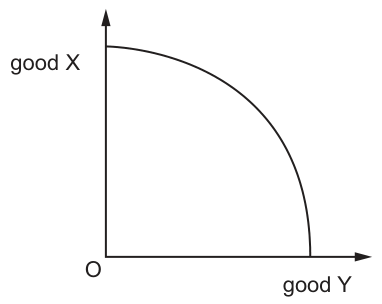
What can be deduced from the shape of this curve?
Options
A decreasing marginal returns to consumption
B decreasing opportunity costs of consumption
C increasing opportunity costs of production
D increasing returns to scale
The production possibility curve (PPC) is drawn concave to the origin (bowed outwards). This shape indicates that as production of one good increases, the opportunity cost of producing additional units of that good rises. This occurs because resources are not equally efficient in producing both goods; resources better suited to producing good X must be reallocated to produce more of good Y, resulting in increasingly larger sacrifices of good X. Therefore, the curve demonstrates increasing opportunity costs of production.
Answer
C
C
Background Concept
A Production Possibility Curve (PPC) is a graphical representation showing the maximum possible output combinations of two goods an economy can produce when all resources are fully and efficiently employed, given the current state of technology. The curve illustrates the fundamental economic problem of scarcity and the need for choice.
Opportunity cost is the value of the next best alternative foregone when a choice is made. On a PPC, moving along the curve from one point to another shows the trade-off between producing the two goods. The slope of the PPC at any point represents the marginal rate of transformation (MRT), which equals the opportunity cost of producing one more unit of the good on the horizontal axis in terms of the good on the vertical axis.
The typical bowed-out (concave to the origin) shape reflects the law of increasing opportunity cost. This arises because resources are heterogeneous—they are not equally productive in all uses. For example, some land, labour, and capital are better suited to producing good X than good Y. As an economy produces more of good Y, it must first reallocate resources that are relatively inefficient in producing Y but efficient in producing X. The opportunity cost of each additional unit of Y therefore rises as Y's production expands.
Understanding the Question
You are shown a diagram of a PPC with good X on the vertical axis and good Y on the horizontal axis. The curve is clearly bowed outwards (concave to the origin). The question asks what can be deduced from this specific shape. The four options test whether you can link the visual shape to the correct economic concept, and also whether you can eliminate distractors that confuse production with consumption or confuse opportunity cost with returns to scale.
Approach
First, identify the key feature: the curve is concave to the origin. Second, recall what this shape signifies in economic theory. Third, evaluate each option against this knowledge:
- Options A and B refer to "consumption," but a PPC shows production possibilities, not consumption patterns. These can be eliminated immediately.
- Option D refers to "increasing returns to scale," which is a production concept relating to how output changes when all inputs are increased proportionally. It is not what the bowed-out shape of a PPC represents.
- Option C refers to "increasing opportunity costs of production," which is the standard interpretation of a concave PPC.
Step-by-Step Reasoning
- Identify the diagram type: The image shows a Production Possibility Curve (also called a Production Possibility Frontier or Transformation Curve). The axes are labelled good X and good Y.
- Observe the shape: The curve is bowed outward from the origin (concave to the origin). It is not a straight line.
- Apply economic theory: A straight-line PPC would imply constant opportunity cost—each additional unit of good Y always costs the same amount of good X. A bowed-out PPC implies that as you produce more of good Y, you must give up increasingly larger amounts of good X. This is because resources are not perfectly adaptable. Resources that are best at producing X are moved to Y production only when Y production is high, and these resources are very productive in X, so their transfer costs a lot of X output.
- Evaluate the options:
- A (decreasing marginal returns to consumption): Incorrect. The PPC is about production, not consumption. Also, marginal returns to consumption is not a standard concept linked to PPC shape.
- B (decreasing opportunity costs of consumption): Incorrect. Again, the PPC shows production, not consumption. Decreasing opportunity cost would be shown by a convex curve (bowed in toward the origin), which is not the case here.
- C (increasing opportunity costs of production): Correct. The bowed-out shape directly illustrates that the opportunity cost of producing additional units of a good increases as more of that good is produced.
- D (increasing returns to scale): Incorrect. Returns to scale refer to what happens when a firm increases all its inputs. While related to production, the PPC shape specifically illustrates opportunity cost, not returns to scale.
- Conclusion: The shape of the curve allows us to deduce that there are increasing opportunity costs of production.
Key Takeaways
- A PPC shows the trade-offs an economy faces when allocating scarce resources between two goods.
- The standard bowed-out shape reflects increasing opportunity cost because resources are heterogeneous and not equally efficient in producing both goods.
- Always check whether the question is about production (PPC) or consumption; the PPC does not directly show consumption levels.
- Opportunity cost is measured in terms of the good sacrificed, not in monetary terms.
Common Mistakes
- Confusing production with consumption: Options A and B mention consumption. The PPC is a production frontier; it shows what can be produced, not what is consumed. This is a common trap.
- Confusing the direction of the curve: A curve bowed inward (convex to the origin) would suggest decreasing opportunity cost, but the diagram clearly shows the standard bowed-out shape.
- Misidentifying the concept: Increasing returns to scale is a microeconomic concept about firm behaviour when all inputs are increased, not about the trade-off between two different goods on a frontier.
Things to Be Careful About
- The axes represent quantities of goods produced, not utility or consumption.
- The curve assumes full and efficient use of resources; points inside the curve represent inefficiency, and points outside are unattainable with current resources.
- The "increasing" refers to the marginal opportunity cost—each additional unit costs more than the previous one.
- In multiple-choice questions, eliminate options that refer to the wrong domain (consumption vs. production) first, as this often leaves the correct answer immediately.
The rest of this paper
29 more questions- Q2Classification of Goods and Services1M
- Q3Economic Methodology1M
- Q4(Legacy) - Money1M
- Q5Elasticities of Demand1M
- Q6Elasticities of Demand1M
- Q7Consumer and Producer Surplus1M
- Q8Demand and Supply · Market Equilibrium and the Price Mechanism1M
- Q9Demand and Supply1M
- Q10Price Elasticity of Supply1M
- Q11Demand and Supply1M
- Q12Market Equilibrium and the Price Mechanism1M
- Q13Price Elasticity of Supply1M
- Q14Methods of Government Intervention in Markets1M
- Q15Fiscal Policy1M
- Q16Reasons for Government Intervention in Markets1M
- Q17Income and Wealth Inequality1M
- Q18Elasticities of Demand · Price Elasticity of Supply · Methods of Government Intervention in Markets1M
- Q19Monetary Policy1M
- Q20Protectionism1M
- Q21Exchange Rates1M
- Q22Balance of Payments1M
- Q23International Trade and Comparative Advantage1M
- Q24Exchange Rates1M
- Q25Aggregate Demand and Aggregate Supply1M
- Q26Exchange Rates1M
- Q27Exchange Rates · International Trade and Comparative Advantage1M
- Q28Fiscal Policy · Monetary Policy · Price Stability1M
- Q29Supply-Side Policy · Fiscal Policy · Monetary Policy1M
- Q30Aggregate Demand and Aggregate Supply1M