Economics 9708/11 — October/November 2020
Cambridge AS Level · AS Level Multiple Choice · answer key with instant marking and worked solutions
Topics Demand and Supply · Market Equilibrium and the Price Mechanism · Fiscal Policy · Classification of Goods and Services · International Trade and Comparative Advantage · Exchange Rates · +15 more
Tap an option under each question to check it — your score builds as you go.
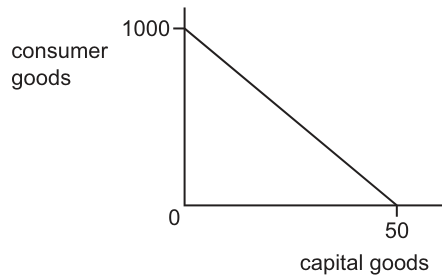
The diagram shows an economy’s production possibility curve.
It has been employing its resources in the ratio of 80% consumer goods production and 20% capital goods production.
What will be the result if it decides to double its output of capital goods?
Options
A a gain of 20 capital goods
B a gain of 40 capital goods
C a loss of 200 consumer goods
D a loss of 600 consumer goods
Working
The diagram shows a linear production possibility curve (PPC) with a maximum output of 1000 consumer goods (vertical axis) and 50 capital goods (horizontal axis). A straight-line PPC indicates constant opportunity cost.
Current production is in the ratio 80% consumer goods to 20% capital goods:
- Current capital goods = 20% of 50 = 10 units
- Current consumer goods = 80% of 1000 = 800 units
Doubling capital goods output means producing 20 units. The slope of the PPC is -1000/50 = -20, meaning each additional unit of capital goods costs 20 units of consumer goods. Increasing capital goods from 10 to 20 units (an increase of 10 units) requires giving up 10 x 20 = 200 consumer goods.
Thus consumer goods production falls from 800 to 600 units, a loss of 200 consumer goods.
Answer
C
C
Background Concept
A Production Possibility Curve (PPC) illustrates the maximum possible output combinations of two goods an economy can achieve when all resources are fully and efficiently employed, given the current state of technology. The curve is typically bowed outward (concave to the origin) because of increasing opportunity cost: as production of one good expands, increasingly unsuitable resources must be transferred, raising the marginal cost. However, when the PPC is a straight line, as in this question, opportunity cost is constant. This means the economy gives up a fixed amount of the other good for each additional unit produced, regardless of the output mix. The slope of the PPC equals the opportunity cost of the good on the horizontal axis measured in terms of the good on the vertical axis.
Understanding the Question
The question presents a linear PPC with consumer goods on the vertical axis (maximum 1000 units) and capital goods on the horizontal axis (maximum 50 units). The economy is currently operating at a point where 80% of resources go to consumer goods and 20% to capital goods. The question asks what the result will be if the economy decides to double its output of capital goods. This requires calculating the opportunity cost of that reallocation in terms of lost consumer goods. The four options present different numerical outcomes, only one of which correctly reflects the trade-off shown by the diagram.
Approach
To solve this, follow these steps:
- Convert the percentage allocation into actual quantities using the intercepts of the PPC.
- Determine the new quantity of capital goods after doubling.
- Use the constant opportunity cost (derived from the slope or the intercepts) to find how many consumer goods must be given up to produce the extra capital goods.
- Compare the calculated loss with the options provided.
Because the PPC is linear, the opportunity cost per unit is constant at 20 consumer goods per capital good (1000/50). This makes the calculation straightforward arithmetic.
Step-by-Step Reasoning
First, identify the current production levels. The maximum possible output of consumer goods is 1000 and of capital goods is 50. If the economy allocates 80% of its resources to consumer goods, it produces 0.80 x 1000 = 800 consumer goods. Similarly, 20% of resources allocated to capital goods yields 0.20 x 50 = 10 capital goods.
Second, determine the new capital goods output. Doubling the current 10 units gives 20 units of capital goods.
Third, calculate the opportunity cost. Because the PPC is a straight line, the opportunity cost is constant. The slope is rise over run: -1000/50 = -20. This means that to produce one more unit of capital goods, the economy must give up 20 units of consumer goods. To increase capital goods from 10 to 20 units (an increase of 10 units), the economy gives up 10 x 20 = 200 consumer goods.
Alternatively, using the PPC equation: Consumer goods = 1000 - 20(Capital goods). At 20 capital goods, consumer goods = 1000 - 400 = 600. The fall from 800 to 600 is 200 consumer goods.
Finally, evaluate the options. Option A (gain of 20 capital goods) is incorrect because the gain is 10 units, not 20. Option B (gain of 40 capital goods) is also incorrect. Option D (loss of 600 consumer goods) would imply consumer goods fall to 200, which would require producing 40 capital goods, not 20. Only option C correctly identifies the loss of 200 consumer goods.
Key Takeaways
- A linear PPC implies constant opportunity cost, calculated as the ratio of the intercepts.
- When resources are reallocated along the PPC, the opportunity cost of the good being increased is found by multiplying the change in quantity by the constant marginal rate of transformation (the slope).
- Percentage allocations must be applied to the maximum possible outputs to find actual quantities before calculating trade-offs.
Common Mistakes
- Misreading the axes or percentages: Some students may apply the 80% to capital goods or the 20% to consumer goods, reversing the calculation.
- Incorrect slope calculation: Dividing 50 by 1000 instead of 1000 by 50 gives the reciprocal, leading to an opportunity cost of 0.05 rather than 20.
- Doubling the wrong base: The current output is 10 units (20% of 50), not 50 or 20. Doubling 10 gives 20, not 40.
- Confusing the gain with the loss: The question asks for the result of doubling capital goods; the relevant trade-off is the consumer goods lost, not the capital goods gained.
Things to Be Careful About
- Always verify which axis represents which good before calculating. Here, consumer goods are vertical and capital goods are horizontal.
- Check whether the PPC is linear or bowed. A linear curve means constant opportunity cost, simplifying the calculation to a single multiplication.
- Ensure the final answer matches the form of the options: the question asks for the result, and the correct option describes a loss of consumer goods, not a gain of capital goods.
The rest of this paper
29 more questions- Q2Economic Methodology1M
- Q3(Legacy) - Money1M
- Q4Economic Systems1M
- Q5Market Equilibrium and the Price Mechanism1M
- Q6Elasticities of Demand1M
- Q7Price Elasticity of Supply1M
- Q8Consumer and Producer Surplus1M
- Q9Market Equilibrium and the Price Mechanism1M
- Q10Demand and Supply1M
- Q11Demand and Supply1M
- Q12Demand and Supply1M
- Q13Demand and Supply1M
- Q14Income and Wealth Inequality1M
- Q15Methods of Government Intervention in Markets1M
- Q16Classification of Goods and Services · Market Equilibrium and the Price Mechanism1M
- Q17Classification of Goods and Services1M
- Q18Fiscal Policy1M
- Q19International Trade and Comparative Advantage1M
- Q20International Trade and Comparative Advantage1M
- Q21Aggregate Demand and Aggregate Supply1M
- Q22Price Stability1M
- Q23Exchange Rates1M
- Q24Balance of Payments1M
- Q25Protectionism1M
- Q26Balance of Payments1M
- Q27Exchange Rates1M
- Q28Monetary Policy · Fiscal Policy1M
- Q29Fiscal Policy1M
- Q30Supply-Side Policy1M