Economics 9708/12 — February/March 2020
Cambridge AS Level · AS Level Multiple Choice · answer key with instant marking and worked solutions
Topics Balance of Payments · Market Equilibrium and the Price Mechanism · Methods of Government Intervention in Markets · Exchange Rates · Elasticities of Demand · Price Elasticity of Supply · +11 more
Tap an option under each question to check it — your score builds as you go.
The diagram shows the production possibility curve of a desert island economy where the inhabitants produce just two commodities, coconuts and fish.
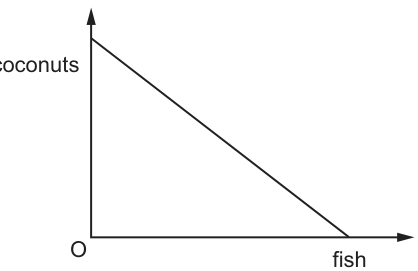
What explains the shape of the production possibility curve?
Options
A Coconuts and fish are perfect complements.
B Coconuts and fish are perfect substitutes.
C The inhabitants consume more fish than coconuts.
D The opportunity cost of increasing fish production is constant.
Reasoning
A straight-line (linear) production possibility curve indicates that the opportunity cost of producing one good in terms of the other is constant at every point on the curve.
- Options A and B refer to consumer preferences (perfect complements and perfect substitutes, which describe the shape of indifference curves, not production possibility curves), so they are incorrect.
- Option C is irrelevant because the PPC shows production possibilities, not consumption patterns.
- Option D correctly identifies that a straight PPC reflects constant opportunity cost.
Answer
D
D
Background Concept
A production possibility curve (PPC, also called a production possibility frontier, PPF) is a model that shows the maximum possible output combinations of two goods an economy can produce when all resources are fully and efficiently employed, given the current state of technology. The shape of the PPC reveals the nature of opportunity cost in the economy:
- A straight, downward-sloping PPC indicates constant opportunity cost: each additional unit of one good always requires the same sacrifice of the other good. This occurs when resources are perfectly substitutable between the production of the two goods (for example, all workers are equally skilled at catching fish and picking coconuts).
- A bowed-out (concave) PPC indicates increasing opportunity cost: each additional unit of one good requires a larger sacrifice of the other good. This is the more common real-world case, as resources are not perfectly adaptable to producing both goods (for example, workers specialised in fishing are less productive if moved to coconut picking, so more and more fishing output is given up to produce each extra unit of coconuts).
Understanding the Question
The question provides a diagram of a desert island economy's PPC, with coconuts on the vertical axis and fish on the horizontal axis. The curve is a straight downward-sloping line. The question asks what explains this specific shape. The four options test whether you can link PPC shape to the underlying economic concept of opportunity cost, and distinguish PPC analysis from other microeconomic models like indifference curves.
Approach
To answer this, first recall the link between PPC shape and opportunity cost. Then evaluate each option against this knowledge, eliminating any that refer to unrelated concepts or misstate the relationship. The correct option must directly explain why the PPC is straight.
Step-by-Step Reasoning
- First, identify the key feature of the given PPC: it is a straight line, not bowed out.
- Evaluate Option A: "Coconuts and fish are perfect complements." Perfect complements describe a consumption relationship where two goods are always consumed together in fixed proportions, which is a feature of indifference curves, not PPCs. This is irrelevant to the shape of the production possibility curve, so A is incorrect.
- Evaluate Option B: "Coconuts and fish are perfect substitutes." Perfect substitutes also describe a consumer preference (where a consumer is willing to swap one good for the other at a constant rate), again a feature of indifference curves, not PPCs. This does not explain the PPC's shape, so B is incorrect.
- Evaluate Option C: "The inhabitants consume more fish than coconuts." Consumption patterns are not shown on a PPC, which only illustrates production trade-offs. The shape of the PPC is determined by production technology and resource adaptability, not how much the population chooses to consume. So C is incorrect.
- Evaluate Option D: "The opportunity cost of increasing fish production is constant." A straight-line PPC has a constant gradient, meaning the trade-off between the two goods is the same at every production point. This directly matches the definition of constant opportunity cost, so D is the correct explanation.
Key Takeaways
- The shape of a PPC is determined by the nature of opportunity cost in the economy: straight = constant opportunity cost, bowed out = increasing opportunity cost.
- PPC analysis is about production trade-offs, not consumer preferences or consumption patterns. Do not confuse PPCs with indifference curves, which describe consumer choice.
- When answering questions about PPC shape, always link the shape directly to the opportunity cost concept.
Common Mistakes
- Confusing PPCs with indifference curves: options A and B are common distractors that test this confusion. Remember that PPCs relate to production, while indifference curves relate to consumption preferences.
- Assuming consumption levels affect PPC shape: the PPC shows what can be produced, not what is consumed. Consumption choices are shown by points inside or on the PPC, not the curve's shape.
- Forgetting that a straight PPC is a special case: most real-world PPCs are bowed out, but a straight line is used in models to represent constant opportunity cost, usually when resources are perfectly adaptable between the two goods.
Things to Be Careful About
- Always check what the model in the question is: if it is a PPC, the answer must relate to production and opportunity cost, not consumer behaviour.
- The gradient of the PPC is the opportunity cost: a constant gradient (straight line) means constant opportunity cost, a rising gradient (bowed out) means increasing opportunity cost.
- For 1-mark multiple choice questions, you do not need to write an extended explanation, just identify the correct link between the curve's shape and the economic concept.
The rest of this paper
29 more questions- Q2Scarcity, Choice and Opportunity Cost1M
- Q3Economic Methodology1M
- Q4Economic Systems1M
- Q5Elasticities of Demand1M
- Q6Price Elasticity of Supply1M
- Q7Demand and Supply1M
- Q8Elasticities of Demand1M
- Q9Market Equilibrium and the Price Mechanism1M
- Q10Market Equilibrium and the Price Mechanism1M
- Q11Market Equilibrium and the Price Mechanism1M
- Q12Elasticities of Demand1M
- Q13Price Elasticity of Supply1M
- Q14Methods of Government Intervention in Markets1M
- Q15Methods of Government Intervention in Markets · Market Equilibrium and the Price Mechanism1M
- Q16Methods of Government Intervention in Markets1M
- Q17Fiscal Policy · Methods of Government Intervention in Markets1M
- Q18Income and Wealth Inequality1M
- Q19Balance of Payments1M
- Q20Exchange Rates · Price Stability1M
- Q21International Trade and Comparative Advantage1M
- Q22Balance of Payments1M
- Q23Aggregate Demand and Aggregate Supply1M
- Q24Balance of Payments · Exchange Rates1M
- Q25Balance of Payments1M
- Q26Price Stability1M
- Q27Aggregate Demand and Aggregate Supply1M
- Q28Exchange Rates · Balance of Payments1M
- Q29Fiscal Policy1M
- Q30Exchange Rates · Monetary Policy1M