Economics 9708/23 — October/November 2019
Cambridge AS Level · AS Level Data Response and Essays · worked solutions for every part, with the mark scheme
Topics Aggregate Demand and Aggregate Supply · Methods of Government Intervention in Markets · Price Stability · International Trade and Comparative Advantage · Exchange Rates · Demand and Supply · +5 more
China and India: BRICS partners yet competitors
BRIC is a term referring to the economies of Brazil, Russia, India and China. It originated from Jim O’Neill of Goldman Sachs who predicted that these four countries would be the fastest growing market economies in the twenty-first century and that by 2050 they would be amongst the wealthiest economic powers. South Africa was added to the group in 2010 resulting in them being known as BRICS economies.
It should be stressed that the five BRICS economies are not a formal trading organisation like the European Union, although their leaders do meet annually to discuss global economic issues of common concern and relevance.
Of the five countries, China and India in particular compete with each other in world markets. India is following China in embarking on a policy of growth in its manufacturing industries; it is also a major exporter of agricultural goods to neighbouring countries in south-east Asia.
Table 1.1 below shows that India has experienced the highest rate of consumer price inflation of all BRICS economies since 2008. It has also experienced a rapid deterioration of over 30% in its terms of trade. There are serious doubts over whether Indian products really can compete with those from China in world markets.
Table 1.1: Consumer Prices Index (CPI) for BRICS economies, 2012–15 (2008=100)
| 2012 | 2013 | 2014 | 2015 | |
|---|---|---|---|---|
| Brazil | 124.5 | 131.8 | 140.2 | 155.2 |
| Russia | 136.0 | 145.2 | 156.5 | 180.8 |
| India | 147.7 | 163.8 | 174.1 | 184.4 |
| China | 110.9 | 113.8 | 116.1 | 117.7 |
| South Africa | 123.9 | 131.0 | 130.0 | 145.4 |
Source: BRICS Joint Statistical Publications
Fig. 1.2 below shows how China’s terms of trade have changed from 2012 to 2016.
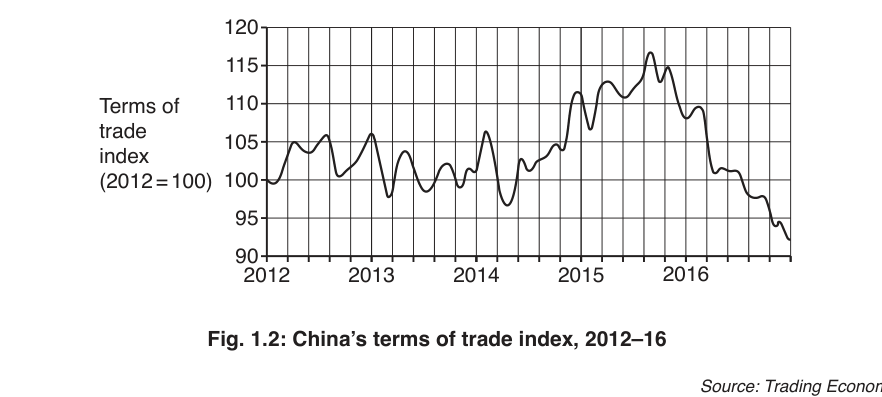
Fig. 1.2: China’s terms of trade index, 2012–16
Source: Trading Economics
Using Table 1.1, compare the rate of inflation for China and India between 2012 and 2015.
Explain two possible reasons why the CPI might not be an accurate measure of inflation in a BRICS economy such as India.
Explain one possible aggregate demand reason and one possible aggregate supply reason for the differing rates of inflation in the BRICS economies since 2012.
Using Fig. 1.2, describe how China’s terms of trade changed from the high point in 2015 to the end of 2016.
Explain one possible reason for this change.
With the help of the information, discuss what is likely to be the most important factor that will determine how successfully India can compete with China when trading in world markets.
The rest of this paper
3 more questions- Q2Demand and Supply · Market Equilibrium and the Price Mechanism · Classification of Goods and Services · Reasons for Government Intervention in Markets · Methods of Government Intervention in Markets20M
- Q3Aggregate Demand and Aggregate Supply · Economic Systems · Methods of Government Intervention in Markets20M
- Q4Balance of Payments20M