Economics 9708/23 — May/June 2019
Cambridge AS Level · AS Level Data Response and Essays · worked solutions for every part, with the mark scheme
Topics Demand and Supply · Market Equilibrium and the Price Mechanism · Elasticities of Demand · National Income Statistics · Economic Growth · Aggregate Demand and Aggregate Supply · +5 more
Difficult times for OPEC and Nigeria
The Organisation of Petroleum Exporting Countries (OPEC) has 13 members and produces over 30 million barrels of oil a day, responsible for half of global production. Its members, strongly influenced by Saudi Arabia, seek to limit the supply of oil in order to sustain stable prices to aid their own economic development.
OPEC members have become concerned about the increase in oil production in the United States (US) due to the use of fracking (a new technique for extracting oil) and its impact on world oil prices and OPEC’s own market share. In 2014, OPEC decided to increase its own supply of oil in a bid to bankrupt higher-cost US producers. The effects were remarkable. A 12% increase in OPEC’s production saw the world price fall by around 60% to less than US$30 per barrel. This was much lower than US producers’ costs but it led to a 45% cut in OPEC’s oil revenue.
In late 2016, it was clear that governments in OPEC countries were suffering from reduced oil revenues. There was also growing evidence that US oil producers had been able to cut costs to remain competitive with OPEC, even though the world price was still well below US$50 per barrel. This was thought to be the minimum price for producing oil in the US. In a surprising change of policy, OPEC decided to cut its oil production by 3%. The result was a 10% increase in the world price of oil.
Nigeria is the largest economy in Africa. It produces around 8% of OPEC’s total oil supply which accounts for over 80% of Nigeria’s export revenue. Nigeria’s economy has been seriously affected by OPEC’s decision to increase supply on the world market. Its Gross Domestic Product (GDP), a measure of total national output, has continued to fall along with oil output. The slowdown in the economy has affected taxation paid to the government. In addition import restrictions have been put in place to try to offset a severe shortage of foreign currency.
Source: Sunday Telegraph 4 December 2016
Fig. 1.1 and Fig. 1.2 show the changes in Nigeria’s crude oil production and the relative changes in oil output from 2015 to 2016.
Fig. 1.1: Nigeria’s oil output, 2015–2016
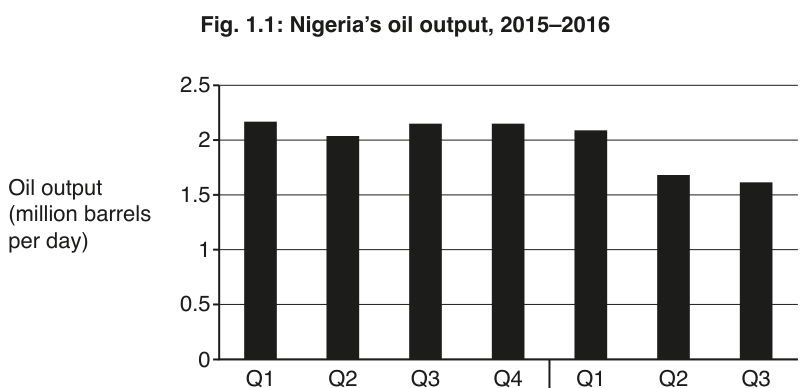
Fig. 1.2: Nigeria’s annual growth rates for oil production
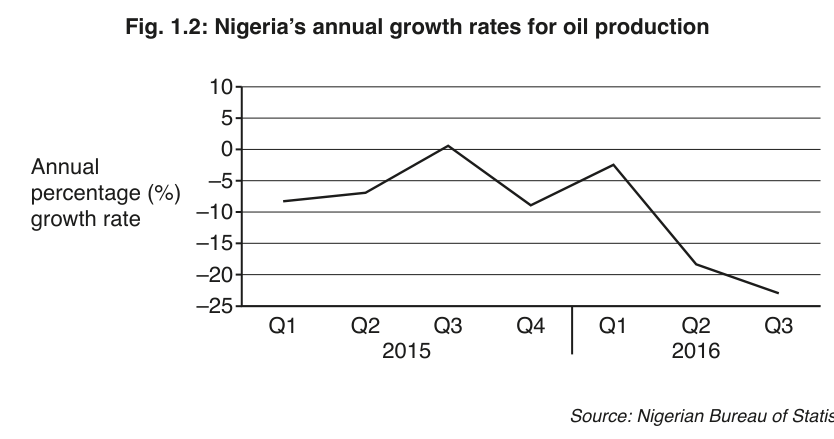
Source: Nigerian Bureau of Statistics, 2016
Describe, using Fig. 1.1, the change in oil production in Nigeria between 2015 and 2016.
Answer
Oil production in Nigeria fell between 2015 and 2016. Output started at approximately 2.2 million barrels per day in Q1 2015 and ended at around 1.6 million barrels per day in Q3 2016. The decline was fairly steady until Q1 2016, after which there was a sharp fall between Q1 and Q2 2016 (from about 2.1 million to 1.7 million barrels per day), followed by a further fall to 1.6 million in Q3 2016.
Oil production fell from around 2.2 million barrels per day in Q1 2015 to around 1.6 million in Q3 2016, with the sharpest drop between Q1 and Q2 2016.
Background Concept
Bar charts display quantitative data over time or across categories. In economics, they are commonly used to show output, prices, or growth rates. Reading a bar chart accurately requires noting the scale on the vertical axis and the categories on the horizontal axis, then identifying whether the overall pattern is rising, falling, or fluctuating.
Understanding the Question
The question asks you to describe the change in Nigeria's oil production between 2015 and 2016 using Fig. 1.1. This means you must state what happened to output over the period, using the actual figures from the chart as evidence. You should identify the starting level, the ending level, and any notable changes in the rate of decline.
Approach
First, identify the overall trend: is output rising or falling? Then quote the approximate values for Q1 2015 and Q3 2016 to show the magnitude of change. Finally, identify any sharp changes, such as the drop between Q1 and Q2 2016, which the mark scheme specifically rewards.
Step-by-Step Reasoning
Looking at Fig. 1.1, the bars represent oil output in million barrels per day. In Q1 2015, output was approximately 2.2 million barrels per day. It fell slightly in Q2 2015 to around 2.05, then recovered slightly in Q3 and Q4 2015 to around 2.15. In 2016, output was around 2.1 in Q1, then fell sharply to 1.7 in Q2 and 1.6 in Q3. The overall trend is clearly downward, with a particularly sharp fall in the first half of 2016. The mark scheme awards one mark for identifying the overall fall, one mark for the approximate start and end figures, and one mark for noting the most rapid fall between Q1 and Q2 2016 (though only 2 marks are available, so any two of these points gain full credit).
Key Takeaways
When describing data from a chart, always state the overall trend first, then support it with specific figures. Note any turning points or sharp changes in the rate of change.
Common Mistakes
- Stating a trend without any figures to back it up.
- Listing every single data point without identifying the overall trend.
- Misreading the scale or axes, for example confusing million barrels with thousand barrels.
Things to Be Careful About
Make sure you read the y-axis correctly (million barrels per day) and the x-axis (quarters from Q1 2015 to Q3 2016). The values are approximate, so phrases like 'around' or 'approximately' are appropriate. The mark scheme rewards the most rapid fall between Q1 and Q2 2016, so highlighting this sharp drop is important.
Compare, using supply and demand diagrams, how OPEC’s decisions affected the world price of oil in 2014 and in 2016.
Answer
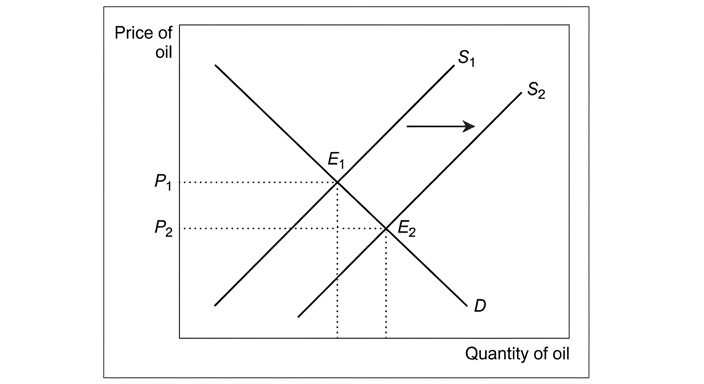
In 2014, OPEC increased its supply of oil. This is represented by a rightward shift of the world supply curve from S1 to S2. The increase in supply leads to a new equilibrium with a lower world price (P2 < P1) and a higher quantity of oil traded.
In 2016, OPEC cut its oil production. This is represented by a leftward shift of the world supply curve from S1 to S2. The decrease in supply leads to a new equilibrium with a higher world price (P2 > P1) and a lower quantity of oil traded.
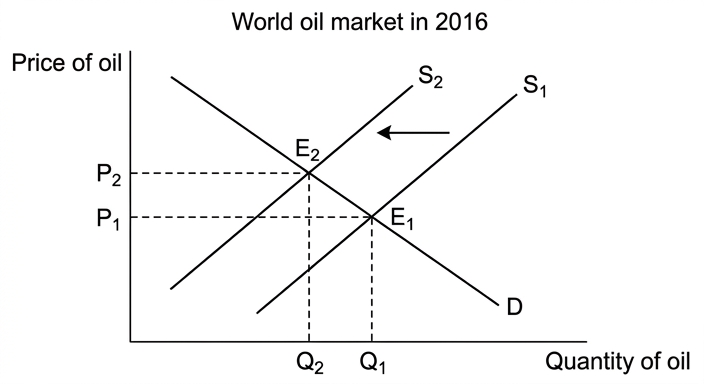
Thus, OPEC's 2014 decision to increase supply lowered the world price, while its 2016 decision to cut supply raised the world price.
In 2014, increased supply shifted S right, lowering price; in 2016, decreased supply shifted S left, raising price.
Background Concept
The market price of a good is determined by the interaction of demand and supply. A shift in the supply curve (caused by a change in a non-price determinant of supply, such as the number of suppliers or technology) leads to a new equilibrium price and quantity. An increase in supply (rightward shift) lowers price and raises quantity; a decrease in supply (leftward shift) raises price and lowers quantity, assuming demand is unchanged.
Understanding the Question
The question asks you to compare, using supply and demand diagrams, how OPEC's decisions affected the world price of oil in 2014 and 2016. You must show two diagrams: one for the 2014 increase in supply and one for the 2016 decrease in supply. The key is to show the shift in the supply curve and the resulting change in equilibrium price.
Approach
Draw two separate supply and demand diagrams (or one combined diagram). For 2014, shift the supply curve to the right and show the lower equilibrium price. For 2016, shift the supply curve to the left and show the higher equilibrium price. Label all curves and equilibrium points clearly.
Step-by-Step Reasoning
In 2014, OPEC decided to increase its supply of oil. In the world oil market, this increases the total quantity of oil supplied at every price, shifting the world supply curve to the right from S1 to S2. With demand unchanged, the new intersection of demand and supply occurs at a lower price (P2) and a higher quantity. This explains the 60% fall in price mentioned in the text.
In 2016, OPEC decided to cut production by 3%. This reduces the total quantity supplied at every price, shifting the world supply curve to the left from S1 to S2. With demand unchanged, the new equilibrium occurs at a higher price (P2) and a lower quantity. This explains the 10% rise in price.
The diagrams must show the demand curve (downward sloping), the original supply curve (S1), the new supply curve (S2), the original equilibrium (E1, P1) and the new equilibrium (E2, P2). Arrows should indicate the direction of the shift.
Key Takeaways
- An increase in supply shifts the supply curve right, lowering price and raising quantity.
- A decrease in supply shifts the supply curve left, raising price and lowering quantity.
- Always label curves (D, S1, S2) and equilibrium points (E1, E2, P1, P2).
Common Mistakes
- Shifting the demand curve instead of the supply curve.
- Confusing a movement along the supply curve with a shift of the curve.
- Forgetting to label axes or curves.
- Drawing the supply curve upward sloping but labelling it incorrectly.
Things to Be Careful About
The question asks you to compare the two years, so make sure both diagrams are present and clearly distinguished. The mark scheme awards up to 2 marks for each diagram, so accuracy in showing the shift and the new equilibrium is essential.
‘The demand for OPEC’s oil is price inelastic.’
What evidence is there in the information to support this claim?
Answer
The text states that a 12% increase in OPEC's production caused the world price to fall by around 60%, but OPEC's oil revenue only fell by 45%. Since the percentage fall in price (60%) was greater than the percentage fall in total revenue (45%), the percentage rise in quantity demanded must have been proportionally smaller than the percentage fall in price. This indicates that demand for OPEC's oil is price inelastic (PED < 1).
The 60% fall in price caused only a 45% fall in revenue, implying the percentage rise in quantity demanded was less than 60%, so demand is price inelastic.
Background Concept
Price elasticity of demand (PED) measures the responsiveness of quantity demanded to a change in price. It is calculated as the percentage change in quantity demanded divided by the percentage change in price. When PED is less than 1 (in absolute value), demand is price inelastic, meaning quantity demanded changes proportionally less than price. A key property of inelastic demand is that total revenue (price x quantity) moves in the same direction as price: when price falls, total revenue falls, and vice versa.
Understanding the Question
The question asks what evidence in the text supports the claim that demand for OPEC's oil is price inelastic. You need to look at the percentage changes in price and total revenue (or quantity) and apply the relationship between PED and total revenue.
Approach
Identify the percentage change in price and the percentage change in total revenue from the text. If price fell by a larger percentage than revenue, then quantity demanded must have risen by a smaller percentage than price fell, indicating inelastic demand.
Step-by-Step Reasoning
The text states that OPEC increased production by 12%, causing the world price to fall by around 60%. OPEC's oil revenue fell by only 45%. Total revenue equals price multiplied by quantity. If price fell by 60% and revenue fell by only 45%, then the quantity sold must have increased by enough to offset part of the price fall, but not enough to prevent revenue from falling. Specifically, the percentage rise in quantity demanded was smaller than the percentage fall in price (since revenue still fell). This means PED = % change in Q / % change in P has an absolute value less than 1, confirming price inelastic demand.
Key Takeaways
- When demand is price inelastic, a fall in price causes total revenue to fall.
- The relationship between percentage changes in price and revenue reveals the elasticity.
- OPEC's revenue fell less than price, proving inelastic demand.
Common Mistakes
- Confusing the direction of change (e.g., saying revenue fell more than price).
- Forgetting that inelastic demand means quantity changes less than price.
- Not linking the evidence explicitly to the definition of inelastic demand.
Things to Be Careful About
The text gives a 12% increase in production (supply), not a percentage increase in quantity demanded. However, the increase in supply led to a price fall, which in turn increased quantity demanded along the demand curve. The revenue data reflects the outcome of this price change.
Fig. 1.2 shows that production in Nigeria’s oil sector declined sharply from Q1 of 2016. During this period, total national output for Nigeria fell by an annual rate of only around 2%.
What can be inferred from this about the relative importance of the non-oil sectors in Nigeria?
Answer
Since total national output (GDP) fell by only around 2% while oil production declined much more sharply (with annual growth rates falling to around -23% by Q3 2016), the non-oil sectors must be relatively more important in Nigeria's economy. The non-oil sector is large enough to cushion the overall GDP figure against the severe oil sector contraction, suggesting it accounts for the majority of national output.
The non-oil sectors are relatively more important, as the much smaller fall in total GDP compared to oil output indicates the non-oil sector constitutes a large share of Nigeria's economy.
Background Concept
Gross Domestic Product (GDP) measures the total monetary value of all final goods and services produced within a country in a given period. It is the sum of output across all sectors of the economy. When one sector contracts sharply, the overall impact on GDP depends on the size of that sector relative to the rest of the economy. If a small sector shrinks, GDP is barely affected; if a large sector shrinks, GDP falls sharply.
Understanding the Question
The question states that Nigeria's oil sector production declined sharply from Q1 2016, while total national output (GDP) fell by only around 2% annually. You must infer what this tells us about the relative importance of the non-oil sectors.
Approach
Compare the magnitude of the change in the oil sector with the change in total GDP. If the oil sector shrank dramatically but GDP barely fell, the non-oil sector must be large and/or growing enough to offset the oil decline. This implies the non-oil sector is relatively more important.
Step-by-Step Reasoning
Fig. 1.2 shows that oil production growth rates fell to around -23% by Q3 2016, indicating a severe contraction in the oil sector. However, the text states that total national output (GDP) fell by only around 2% annually during this period. Since GDP is the aggregate of all sectors, the much smaller fall in GDP compared to oil output implies that the non-oil sectors either grew or declined much less sharply. Therefore, the non-oil sector must account for a large proportion of Nigeria's GDP—indeed, the text implies it is responsible for around 90% of output. This means the non-oil sectors are relatively more important for the overall economy.
Key Takeaways
- GDP is the sum of all sectoral outputs.
- A small change in GDP despite a large change in one sector implies that sector is relatively small.
- The non-oil sector's stability makes it the dominant contributor to Nigeria's GDP.
Common Mistakes
- Concluding that the oil sector is more important because it gets more attention in the text.
- Ignoring the difference between the rate of change and the level of output.
- Failing to make the comparison explicit.
Things to Be Careful About
The text mentions that the non-oil sector is responsible for around 90% of output in the guidance. Your inference should reflect that the non-oil sector is larger and more economically significant than the oil sector, despite oil's dominance of exports.
Analyse, using aggregate demand and aggregate supply, two likely effects of OPEC’s policies on the economy of Nigeria.
Answer
Effect 1: Impact on Aggregate Demand from the 2014 policy
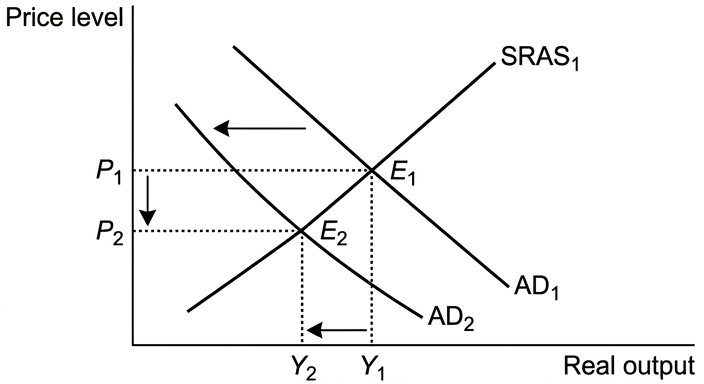
OPEC's 2014 decision to increase supply and lower the world price of oil reduced Nigeria's export revenue, since oil accounts for over 80% of Nigeria's export revenue. Lower export revenue reduces net exports (X - M), which is a component of aggregate demand (AD = C + I + G + (X - M)). This causes the AD curve to shift leftward from AD1 to AD2, leading to a fall in real output and employment, and possibly a lower price level.
Effect 2: Impact on Aggregate Demand from the 2016 policy
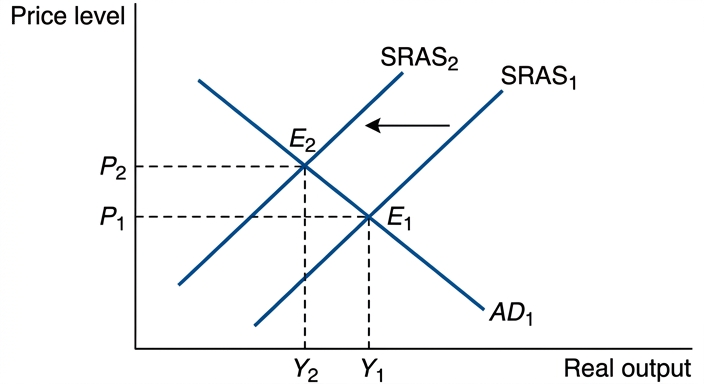
OPEC's 2016 decision to cut supply and raise the world price would increase Nigeria's export revenue, shifting the AD curve rightward from AD1 to AD2. This would increase real output and employment. However, Nigeria's own oil production had already fallen sharply due to the earlier low prices, so the higher price may not immediately translate into higher output. Alternatively, the earlier period of low prices reduced investment in productive capacity, shifting the SRAS curve leftward from SRAS1 to SRAS2, causing higher prices and lower real output.
OPEC's 2014 supply increase lowered oil prices and Nigeria's export revenue, shifting AD left and reducing output/employment; its 2016 supply cut raised prices, which would shift AD right, though Nigeria's constrained production capacity may limit the benefit.
Background Concept
Aggregate demand (AD) represents the total demand for an economy's goods and services at different price levels. It is composed of consumption (C), investment (I), government spending (G), and net exports (X - M). A shift in AD affects real output and the price level. Aggregate supply (AS) represents the total output firms are willing to produce at different price levels. A leftward shift in AS reduces output and raises the price level (cost-push effects).
Understanding the Question
The question asks you to analyse, using AD/AS, two likely effects of OPEC's policies on Nigeria. The text describes two policies: the 2014 increase in supply (which lowered prices) and the 2016 cut in supply (which raised prices). You must link these external price changes to shifts in Nigeria's AD or AS curves.
Approach
Identify two channels through which OPEC's policies affect Nigeria. First, through the export revenue channel: lower oil prices reduce export earnings, reducing AD. Second, through the production/profitability channel: lower prices reduce oil output and government revenue, reducing productive capacity and shifting AS. Alternatively, analyse the effect of the 2016 price increase on AD. Draw AD/AS diagrams to show the shifts and label the new equilibria.
Step-by-Step Reasoning
Effect 1: The 2014 policy (lower price) and Aggregate Demand
OPEC increased supply in 2014, causing the world price to fall by 60%. Nigeria relies on oil for over 80% of its export revenue. Lower oil prices drastically reduced Nigeria's export earnings. Since exports (X) are a component of AD, a fall in X reduces AD, shifting the AD curve leftward from AD1 to AD2. This results in lower real output (GDP falls), higher unemployment, and a lower price level.
Effect 2: The 2016 policy (higher price) and Aggregate Demand or Supply
When OPEC cut supply in late 2016, the world price rose by 10%. Higher oil prices would increase Nigeria's export revenue, shifting AD rightward and boosting output and employment. However, Nigeria's own production had fallen sharply (to 1.6 million barrels per day by Q3 2016), so it may not have been able to increase output to benefit from the higher price. Alternatively, the prolonged period of low prices had reduced investment in the oil sector and government revenue for infrastructure, shifting the short-run AS curve leftward. This would raise the price level while reducing output—a stagflationary effect.
The diagrams should show the relevant shift (AD left for the 2014 effect; AD right or AS left for the 2016 effect) with labelled curves and equilibria.
Key Takeaways
- Export revenue changes shift AD via the net exports component.
- Changes in commodity prices affect both AD (through income) and AS (through production costs and capacity).
- Always link the external shock (oil price) to the specific component of AD or AS.
Common Mistakes
- Drawing a demand and supply diagram for the world market instead of an AD/AS diagram for Nigeria.
- Forgetting to label the axes (Price level, Real output) and curves (AD, SRAS, LRAS).
- Describing the effect without showing the shift in the curve.
- Only analysing one policy when the question asks for effects of OPEC's policies (plural).
Things to Be Careful About
The mark scheme requires reference to two policies (the 2014 increase and the 2016 cut). Ensure you analyse the effect of each, or two distinct effects from the overall period. The diagrams must be explained in the prose—state which curve shifts, in which direction, and what happens to equilibrium output and prices.
Discuss, with the help of the information, the extent to which OPEC will be able to control the world price of oil.
Answer
OPEC can influence the world price of oil because it produces approximately half of global oil supply. By collectively deciding to increase or decrease output, OPEC can shift the world supply curve and thereby affect the equilibrium price. For example, in 2014 a 12% increase in OPEC production caused the world price to fall by around 60%, and in 2016 a 3% cut led to a 10% price rise.
However, OPEC's ability to control the price is constrained. First, the rise of US oil production through fracking means OPEC no longer dominates global supply; in 2014, OPEC's attempt to bankrupt US producers by lowering prices only led to US producers cutting costs and remaining competitive. Second, OPEC members have different economic needs; governments suffering from reduced revenues may cheat on production quotas or overproduce to earn income, undermining collective action. Third, the world price is also determined by global demand, which OPEC cannot control.
In conclusion, OPEC can influence the world price of oil through its supply decisions, but it cannot fully control it due to competing supply sources, the behaviour of non-OPEC producers, and the need for member countries to earn revenue.
OPEC can influence but not fully control the world price of oil; its market power is significant but constrained by non-OPEC supply, member compliance issues, and global demand conditions.
Background Concept
Market control refers to the ability of a firm or group of firms to influence the market price. A cartel like OPEC can exert market power by coordinating output decisions to restrict supply and raise price, acting like a monopoly. However, the extent of this control depends on the cartel's share of total supply, the availability of substitutes or alternative suppliers, and the willingness of members to comply with agreements.
Understanding the Question
The question asks you to discuss the extent to which OPEC will be able to control the world price of oil, using the information provided. This requires you to explain how OPEC can influence price (through supply restrictions), then evaluate the limitations on this control, and finally reach a judgement on the extent of control.
Approach
Structure your answer in three parts: (1) explain OPEC's influence using the data on its production share and the price changes in 2014 and 2016; (2) develop the factors that limit this control, such as non-OPEC supply (US fracking), member compliance, and demand-side factors; (3) conclude with a justified judgement on the extent of control.
Step-by-Step Reasoning
OPEC's influence: The text states OPEC produces over 30 million barrels a day, responsible for half of global production. By limiting supply, OPEC can shift the world supply curve left, raising price. The 2016 data shows a 3% cut increased price by 10%, demonstrating direct influence. The 2014 data shows a 12% increase lowered price by 60%, confirming supply changes affect price.
Limitations on control:
- Non-OPEC competition: US fracking has increased non-OPEC supply. In 2014, OPEC tried to bankrupt US producers by flooding the market, but US producers cut costs and survived, meaning OPEC cannot easily eliminate competition.
- Incentive to cheat: OPEC members need oil revenue for economic development. When prices are low, members may overproduce to earn income, breaking agreements. The text notes governments were suffering from reduced revenues by late 2016, creating pressure to cheat.
- Demand-side factors: OPEC cannot control global demand for oil, which depends on economic growth, alternative energy, and efficiency gains.
Judgement: OPEC can significantly influence the price in the short run by coordinating supply cuts, but it cannot fully control it due to external supply sources, internal compliance problems, and demand conditions. Its control is partial and temporary.
Key Takeaways
- Cartels can influence price by restricting supply, but their power depends on market share and member cooperation.
- The rise of alternative supply sources (US fracking) reduces cartel power.
- Evaluation requires weighing the ability to influence against the constraints.
Common Mistakes
- A one-sided answer that only explains OPEC's influence without evaluating limitations (this forfeits evaluation marks).
- Ending with a summary rather than a justified judgement.
- Ignoring the data provided in the extract.
Things to Be Careful About
The question asks about the 'extent' of control, so your conclusion must address this directly—state whether control is partial, significant, or limited, and explain why. Use the specific evidence from the text (US fracking, revenue needs, production figures) to support your evaluation.
The rest of this paper
3 more questions- Q2Classification of Goods and Services · Methods of Government Intervention in Markets20M
- Q3Price Stability20M
- Q4International Trade and Comparative Advantage · Protectionism20M