Economics 9708/21 — May/June 2019
Cambridge AS Level · AS Level Data Response and Essays · worked solutions for every part, with the mark scheme
Topics Exchange Rates · Protectionism · Balance of Payments · Production Possibility Curves · Economic Systems · Methods of Government Intervention in Markets · +2 more
Trade tensions between China and the United States
At a World Economic Forum meeting in Switzerland in 2017, the Chinese President re-affirmed his country’s commitment to free trade and pledged never to start a protectionist ‘trade war’ or to benefit from a devaluation of its currency, the yuan. Meanwhile, the United States (US) President stated that the ‘America First’ doctrine means increased protectionism and he repeatedly threatened to impose tariffs and import quotas on Chinese goods.
During 2016, the value of the US dollar rose against most currencies. In contrast, the Chinese yuan weakened significantly from 6.20 yuan per US dollar at the end of 2014 to 6.95 yuan at the end of 2016. The US President has accused China of intentionally devaluing the yuan in order to boost China’s export competitiveness. Despite strong downward pressure on its currency, China has attempted to keep the yuan–US dollar exchange rate relatively stable, costing more than US$2 trillion of its official foreign exchange reserves. China has stated that it does not want the yuan to fall in value any more than the US does, but no country has complete control over its exchange rate.
China, like Japan and Germany, usually has a current account surplus on the balance of payments, but China’s current account surplus as a percentage of GDP fell in 2016 and the International Monetary Fund expects it to decrease further, as exports continue to fall.
There are three policy paths that a country can follow with regard to its exchange rate: a completely free float, a managed float or a fixed (pegged) exchange rate. Each of these has various advantages and disadvantages. At present, China’s policy is a managed float, but some economists have argued that it is the yuan–US dollar exchange rate that is regarded as being especially important and so it might be better if China decided to fix (peg) the yuan to the dollar. Fig. 1.1 shows the yuan–US dollar exchange rate over three years.
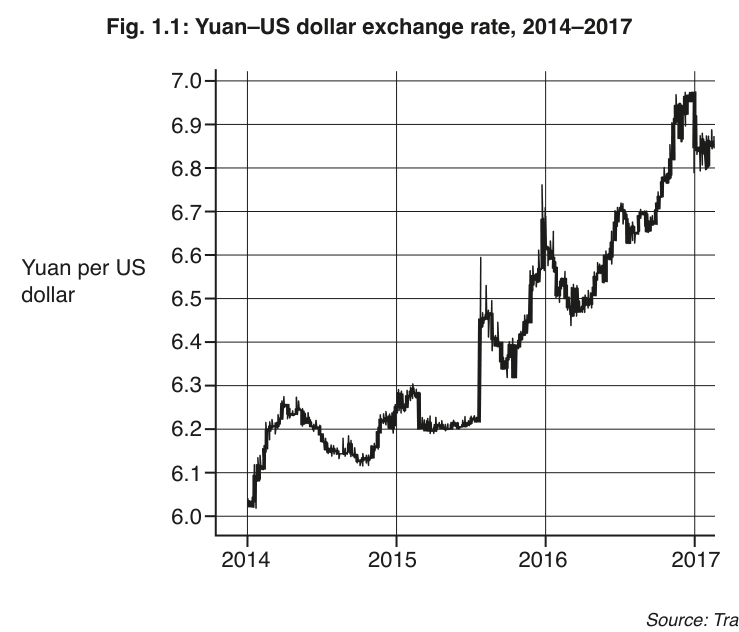
Fig. 1.1: Yuan–US dollar exchange rate, 2014–2017
Source: Adapted from China Daily, 10–12 February 2017
Source: Trading Economics
Describe, using Fig. 1.1, how the value of the yuan against the US dollar has changed between 2014 and 2017.
Answer
Between 2014 and 2017, the yuan depreciated (fell in value) against the US dollar. At the start of 2014, the exchange rate was approximately 6.0 yuan per US dollar, and by 2017 it had risen to around 6.9 yuan per US dollar. This represents a depreciation of approximately 15% (calculated as (6.9 - 6.0)/6.0 x 100 = 15%). The depreciation was not smooth, with periods of volatility, particularly a sharp rise in the yuan per dollar rate (fall in yuan value) from mid-2015 onwards.
The yuan depreciated by approximately 15% against the US dollar between 2014 and 2017, rising from ~6.0 to ~6.9 yuan per US dollar.
Background Concept
An exchange rate is the price of one currency expressed in terms of another. When the number of units of domestic currency needed to buy one unit of foreign currency rises (e.g. more yuan per US dollar), the domestic currency has depreciated (fallen in value) against the foreign currency. Depreciation makes domestic exports cheaper for foreign buyers and imports more expensive for domestic consumers. Exchange rate movements are typically shown on line graphs, with the exchange rate on the vertical axis and time on the horizontal axis.
Understanding the Question
This 2-mark part asks you to describe how the value of the Chinese yuan changed against the US dollar between 2014 and 2017, using the provided Fig. 1.1. You need to identify the overall direction of change, use specific figures from the graph to support your description, and calculate the approximate percentage change in the exchange rate over the period. No evaluation or explanation of causes is required, only description of the trend shown.
Approach
First, identify the starting and ending values of the exchange rate (yuan per US dollar) from the graph. Note that a higher value on this axis means the yuan has depreciated (it takes more yuan to buy one dollar). Calculate the percentage change using the formula: % change = (Ending value - Starting value)/Starting value x 100. State the overall trend clearly, then support it with the figures and percentage change.
Step-by-Step Reasoning
- The vertical axis of Fig. 1.1 measures the number of yuan per US dollar, so a rise in the line means the yuan is depreciating against the dollar.
- At the start of 2014, the exchange rate is approximately 6.0 yuan per US dollar. By 2017, it has risen to approximately 6.9 yuan per US dollar.
- The overall trend is a depreciation of the yuan against the US dollar over the period, with increased volatility from mid-2015 onwards.
- The percentage change is calculated as (6.9 - 6.0)/6.0 x 100 = 15%, which falls within the 14-16% range accepted by the mark scheme.
Key Takeaways
- A rise in the domestic currency per foreign currency exchange rate means depreciation of the domestic currency.
- When describing exchange rate trends from a graph, always state the overall direction first, then support with specific figures.
- Percentage change calculations for exchange rates use the starting value as the base.
Common Mistakes
- Confusing depreciation with appreciation: if the yuan per dollar rate rises, the yuan is depreciating, not appreciating.
- Stating a trend without using figures from the graph: the mark scheme requires specific data to support the description.
- Incorrectly calculating the percentage change by using the ending value as the base, rather than the starting value.
Things to Be Careful About
- Check the axis label: this graph is yuan per US dollar, so a higher value is yuan depreciation. If the axis were US dollars per yuan, the direction would be reversed.
- The mark scheme accepts a percentage change between 14% and 16%, so approximate figures from the graph are acceptable, as long as the calculation is correct.
- You do not need to explain why the yuan depreciated, only describe the change shown in the graph.
The US President threatened to increase protectionism of the US economy.
Explain, using a diagram, how one of the methods of protection mentioned in the article can work.
Answer
A tariff is a tax imposed by a government on imported goods. It raises the price of imported products relative to domestically produced goods, reducing the quantity of imports demanded and protecting domestic producers from foreign competition.
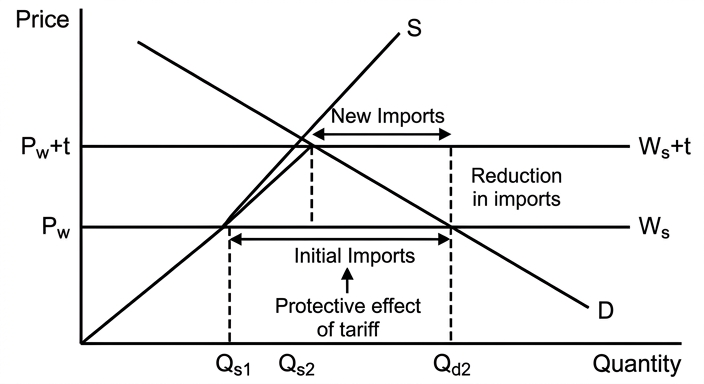
The diagram shows the market for a good imported by the US from China. The vertical axis is price, the horizontal axis is quantity. Domestic supply is S, domestic demand is D. The world supply curve without tariff is Ws, and with a tariff it is Ws+t (shifted vertically upwards by the tariff amount). The world price without tariff is Pw, and with the tariff it is Pw+t. At Pw, domestic supply is Qs1, domestic demand is Qd1, so imports are Qd1 - Qs1. With the tariff, domestic supply rises to Qs2, domestic demand falls to Qd2, so imports fall to Qd2 - Qs2. The tariff reduces import volume, protecting domestic producers who can now sell more at a higher price.
A tariff is a tax on imports that raises import prices, reduces import quantity, and protects domestic producers, as shown in the diagram.
Background Concept
Protectionism refers to government policies that restrict international trade to protect domestic industries from foreign competition. Common protectionist methods include tariffs (taxes on imported goods), import quotas (limits on the quantity or value of imports), export subsidies, and administrative barriers. A tariff raises the price of imported goods, reducing their quantity demanded and giving domestic producers a price advantage. The effect of a tariff can be illustrated using a partial equilibrium supply and demand diagram for the imported good.
Understanding the Question
This 4-mark part asks you to explain how one protectionist method mentioned in the article (tariff or import quota) works, using a diagram. You need to provide a clear explanation of the mechanism of the chosen policy (2 marks) and a correctly labelled diagram showing its effect (2 marks). The article mentions tariffs and import quotas as the protectionist methods threatened by the US President, so you can choose either.
Approach
Choose one policy (tariff is often simpler to explain and diagram). First, define the policy clearly, then explain how it raises the price of imports, reduces import quantity, and protects domestic producers. Draw a standard import market diagram with domestic supply and demand, world supply, and the effect of the tariff. Label all axes and curves, show the shift in world supply, and explain how the diagram demonstrates the reduction in imports.
Step-by-Step Reasoning
- A tariff is a tax imposed by a government on each unit of an imported good. For example, the US could impose a 25% tariff on Chinese steel imports.
- The tariff raises the cost of importing the good, so the price of imported steel in the US market rises by the amount of the tariff.
- As the price of imported steel rises, US consumers (including manufacturers) demand less imported steel, and domestic steel producers are able to supply more at the higher market price.
- The diagram shows the US steel market: vertical axis is price of steel, horizontal axis is quantity of steel. Domestic supply is S, domestic demand is D. The world supply curve without tariff is Ws, which is horizontal at the world price Pw. With the tariff, the effective price of imports rises to Pw + tariff, so the world supply curve shifts up to Ws+t.
- At the original world price Pw, domestic supply is Qs1, domestic demand is Qd1, so imports are Qd1 - Qs1. At the higher price Pw+t, domestic supply rises to Qs2, domestic demand falls to Qd2, so imports fall to Qd2 - Qs2. The reduction in imports is the protective effect of the tariff, as domestic producers gain market share.
Key Takeaways
- A tariff is a tax on imports that raises their domestic price, reducing import demand and protecting domestic producers.
- A correct tariff diagram must show domestic supply and demand, world supply with and without the tariff, and the reduction in import volume.
- The protective effect of a tariff comes from the reduction in imports, not just the rise in price.
Common Mistakes
- Failing to explain that a tariff is a tax on imports: the mark scheme requires you to stress that it is a tax/duty.
- Drawing an incorrect diagram: for example, shifting the domestic supply curve instead of the world supply curve, or failing to show the reduction in imports.
- Forgetting to label axes and curves: unlabelled diagrams lose marks, as axis and curve labels are credit criteria.
- Choosing a quota but drawing a tariff diagram, or vice versa: if you choose a quota, the diagram must show a vertical quota line limiting import quantity, not a shifted world supply curve.
Things to Be Careful About
- The mark scheme awards 1 mark for a correctly labelled supply and demand diagram (PQDS: price, quantity, domestic supply) and 1 mark for showing the distinction between supply without and with the tariff (or quota line for a quota).
- Make sure your explanation links the tariff to its effect on import volume, not just the price of imports.
- If you choose to explain a quota instead, define it as a limit on the quantity or value of imports, and draw a diagram with a vertical line at the quota quantity, showing that imports cannot exceed that level.
Explain two effects of the fall in China’s current account surplus for China’s economy.
Answer
- Lower inflationary pressure: A fall in the current account surplus means either export demand has fallen or import demand has risen. If export demand falls, this reduces aggregate demand (AD) in China, leading to lower upward pressure on the price level, reducing inflationary pressure.
- Higher unemployment: If the fall in the surplus is driven by a decline in export demand, Chinese firms that produce goods for export will see lower sales. To cut costs, these firms may reduce their workforce, leading to higher structural or cyclical unemployment in export-oriented sectors.
Two effects are: (1) lower inflationary pressure from reduced aggregate demand, and (2) higher unemployment in export sectors.
Background Concept
The balance of payments is a record of all economic transactions between a country and the rest of the world. The current account records trade in goods and services, primary income (e.g. investment income) and secondary income (e.g. transfers). A current account surplus means the country exports more than it imports, earning foreign currency. Changes in the current account surplus reflect changes in export demand, import demand, or the relative price of exports and imports. These changes have domestic macroeconomic effects, including on aggregate demand, inflation, output, and employment.
Understanding the Question
This 4-mark part asks you to explain two effects of a fall in China's current account surplus for its domestic economy. A fall in the surplus means either export demand has fallen, import demand has risen, or both. You need to explain two distinct macroeconomic effects, linking the change in the current account to a domestic economic outcome. No evaluation is required, only explanation of cause and effect.
Approach
Choose two clear effects from the mark scheme's indicative content. For each, build a short chain of reasoning: fall in surplus -> change in export/import demand -> change in aggregate demand -> domestic macroeconomic outcome (inflation, unemployment, GDP, living standards). Make sure each effect is distinct and fully explained.
Step-by-Step Reasoning
- First possible effect: Lower inflationary pressure. A fall in the current account surplus is likely driven by a decline in export demand (as noted in the article, China's exports are falling). Lower export demand reduces aggregate demand (AD) in China, as export spending is a component of AD (AD = C + I + G + (X - M)). A leftward shift in AD reduces the upward pressure on the price level, leading to lower inflation or even disinflation.
- Second possible effect: Higher unemployment. If the fall in the surplus is due to lower export demand, Chinese firms that produce goods for export will see a decline in sales. To reduce costs, these firms may cut back on production and lay off workers, leading to higher unemployment in export-oriented sectors such as manufacturing. This is a form of structural unemployment if the decline in export demand is permanent, or cyclical unemployment if it is due to a global downturn.
- Alternative effects: If the fall in the surplus is due to rising import demand, this could increase the standard of living for Chinese consumers, who have access to a wider range of imported goods at lower prices. Alternatively, a fall in export demand could reduce domestic GDP and economic growth, as the export sector contributes to total output.
Key Takeaways
- A current account surplus is a net injection of foreign spending into the domestic economy, so a fall in the surplus reduces aggregate demand.
- Changes in the current account affect domestic macroeconomic variables such as inflation, output, employment and living standards via their effect on aggregate demand.
- The specific effects depend on the cause of the fall in the surplus (lower exports vs higher imports).
Common Mistakes
- Stating an effect without explaining the causal link: for example, saying "unemployment will rise" without linking it to lower export demand reducing firm output and hiring.
- Choosing two effects that are not distinct: for example, saying "lower GDP and lower economic growth" which are the same outcome, not two separate effects.
- Forgetting to link the effect to the Chinese economy specifically: the question asks for effects for China's economy, not generic effects of a current account fall.
Things to Be Careful About
- The mark scheme awards up to 2 marks per effect, so each effect needs a clear chain of reasoning, not just a statement.
- You can use evidence from the article to support your explanation: the article notes that China's exports are falling, which is the cause of the fall in the surplus, so linking your effect to falling exports is appropriate.
- The guidance notes that a persistent current account surplus can lead to protectionist responses from trading partners, which is another possible effect, but the domestic effects listed above are more direct.
Explain two likely reasons why China has opted for a managed float exchange rate system.
Answer
- Retained government influence: Unlike a completely free float, a managed float allows the Chinese government and central bank to intervene in the foreign exchange market (for example, by selling US dollar reserves to buy yuan and support its value) to prevent excessive exchange rate volatility that could harm international trade and economic stability.
- Balance of stability and flexibility: A managed float combines the benefits of both fixed and floating systems. It provides more stability than a free float (reducing uncertainty for exporters and importers) while avoiding the high cost of maintaining a fully fixed exchange rate, which would require much larger foreign exchange reserves to defend the peg against market pressures.
China chooses a managed float to retain government influence over the exchange rate to reduce volatility, and to balance the stability of a fixed peg with the lower reserve requirements of a free float.
Background Concept
Countries can choose from three main exchange rate systems: a free float (the exchange rate is determined entirely by market forces of demand and supply for the currency, with no government intervention), a fixed (pegged) exchange rate (the government sets the value of the currency against another currency or basket of currencies, and intervenes to maintain that value), and a managed float (a hybrid system where the exchange rate is mostly determined by market forces, but the government or central bank intervenes occasionally to smooth excessive volatility or steer the rate towards a desired level). Each system has trade-offs: free floats are self-adjusting but volatile, fixed rates provide stability for trade but require large reserves to maintain, and managed floats aim to balance the benefits of both.
Understanding the Question
This 4-mark part asks you to explain two likely reasons why China has chosen a managed float exchange rate system, rather than a free float or a fixed peg to the US dollar. You need to apply knowledge of the advantages and disadvantages of each exchange rate system to explain China's specific choice, using evidence from the article where relevant (e.g. the article notes China spent $2 trillion in reserves to stabilise the yuan, and wants to avoid excessive volatility).
Approach
Choose two reasons that highlight the trade-offs China faces. First, explain why a free float is not suitable (excessive volatility harms trade), and why a fixed peg is too costly (requires massive reserves to defend). Then explain how a managed float addresses these issues: it allows some government intervention to reduce volatility, while avoiding the high cost of a full peg. Use evidence from the article (e.g. the $2 trillion spent on stabilising the yuan) to support your points.
Step-by-Step Reasoning
- First reason: To retain policy influence and reduce harmful exchange rate volatility. A completely free float would allow the yuan's value to fluctuate freely based on market forces, which could lead to sharp, unpredictable depreciations or appreciations. The article notes that the yuan weakened significantly from 2014 to 2016, and China spent over $2 trillion in foreign exchange reserves to prevent further depreciation. A managed float allows the People's Bank of China to intervene in the foreign exchange market (by buying or selling yuan and foreign currencies) to smooth out excessive volatility, which reduces uncertainty for Chinese exporters and importers and protects trade flows.
- Second reason: To balance stability and cost. A fully fixed (pegged) exchange rate to the US dollar would provide full stability for US-China trade, but would require China to hold very large foreign exchange reserves to defend the peg against market pressures (as seen in 2015-2016, when China spent $2 trillion to support the yuan). A managed float requires smaller reserves, as the government only intervenes to limit large moves in the exchange rate, not to maintain a fixed value. It also allows China to retain some control over monetary policy for domestic demand management, which would be impossible under a full peg (as interest rates would have to be set to maintain the peg, not to meet domestic objectives).
Key Takeaways
- A managed float exchange rate system balances the benefits of free floats (flexibility, lower reserve requirements) and fixed pegs (stability for trade).
- Countries with large, open economies that trade heavily with a major partner (like China's trade with the US) often choose managed floats to avoid excessive volatility while retaining some policy autonomy.
- The cost of maintaining a fixed exchange rate is very high, as it requires large foreign exchange reserves to defend the peg against market pressures.
Common Mistakes
- Confusing managed float with free float or fixed exchange rate: a managed float involves occasional government intervention, unlike a free float, and does not require maintaining a fixed value, unlike a peg.
- Giving a reason that applies to all exchange rate systems: for example, saying "it allows trade" which is true of all systems, not a reason to choose managed float specifically.
- Forgetting to link the reason to China's specific context: the article mentions China's large trade with the US and its use of reserves to stabilise the yuan, so referencing this context strengthens your answer.
Things to Be Careful About
- The mark scheme awards up to 2 marks per reason, so each reason needs a clear explanation of why it applies to China's choice of managed float, not just a generic advantage of managed float.
- You can reference the article's evidence: the $2 trillion spent on reserves shows that China is willing to intervene to stabilise the yuan, which is consistent with a managed float.
- The guidance notes that free floats are volatile, and fixed pegs require extensive reserve support, so contrasting managed float with these two alternatives strengthens your answer.
Discuss who would be the winners and the losers from a protectionist ‘trade war’ between the US and China.
Answer
Winners from a US-China trade war:
- Domestic producers in protected industries: For example, US steel and aluminium producers would gain from tariffs on Chinese imports, as they face less foreign competition and can raise prices and output.
- Governments collecting tariff revenue: Both the US and Chinese governments would earn revenue from tariffs imposed on each other's goods, which could be used to fund public spending or cut other taxes.
- Infant industries in both countries: New or struggling domestic industries that were previously unable to compete with cheaper imports from the other country would be able to grow and develop behind the protection of tariffs or quotas.
Losers from a US-China trade war:
- Consumers in both countries: Tariffs raise the price of imported goods, so consumers face higher prices and less choice, reducing their real living standards.
- Exporters facing retaliatory tariffs: Chinese exporters of goods such as electronics and machinery that face US tariffs would see lower sales and profits, while US exporters of agricultural and high-tech goods facing Chinese retaliatory tariffs would also lose out.
- Firms using imported intermediate goods: Manufacturers in both countries that rely on imported components from the other country would face higher input costs, reducing their competitiveness and output.
- Overall economic efficiency: Reduced trade means countries can no longer specialise according to comparative advantage, leading to higher global production costs and lower total output.
Conclusion: While specific groups such as protected domestic producers and governments collecting tariff revenue gain from a trade war, the losses to consumers, exporters and overall economic efficiency are far larger. A protectionist trade war between the US and China would therefore be net harmful to both economies, with the losers significantly outnumbering the winners.
A US-China trade war creates small, concentrated gains for protected producers and governments, but large, widespread losses for consumers, exporters and overall economic efficiency, so the losers significantly outweigh the winners.
Background Concept
A protectionist trade war occurs when two or more countries impose reciprocal tariffs, quotas or other trade barriers on each other's goods in response to protectionist policies. The effects of a trade war are distributional: some groups gain from the protection of domestic industries, while others lose from higher prices, reduced trade and retaliatory barriers. Arguments for protectionism include protecting infant or declining industries, strategic security, raising tariff revenue, and reducing trade deficits. Arguments against protectionism include higher consumer prices, reduced export opportunities due to retaliation, inefficiency from reduced specialisation, and lower total global output.
Understanding the Question
This 6-mark evaluative part asks you to discuss who the winners and losers would be from a protectionist trade war between the US and China. You need to identify at least one winner and one loser, explain why they gain or lose, and reach a justified conclusion on the overall impact of the trade war. The mark scheme awards up to 3 marks for winners, 3 marks for losers, and 1 reserved mark for a justified conclusion, so you need to develop both sides fully before reaching a verdict.
Approach
First, identify groups that would gain from the trade war: domestic producers in protected industries, governments collecting tariff revenue, infant industries that can grow behind protection. Explain why each gains. Then identify groups that would lose: consumers facing higher prices, exporters facing retaliatory tariffs, firms using imported inputs, and the overall economy due to efficiency losses. Explain why each loses. Finally, weigh the two sides: the gains are concentrated in small, specific groups, while the losses are spread across the wider population and the economy as a whole, so the losers outweigh the winners. Reach a justified conclusion that answers the question.
Step-by-Step Reasoning
- Winners from the trade war:
a. Domestic producers in protected industries: US steel and aluminium producers would gain from tariffs on Chinese imports, as they face less foreign competition and can raise prices and output. Similarly, Chinese domestic producers of goods that previously faced US imports would gain from Chinese retaliatory tariffs.
b. Governments: Both the US and Chinese governments would earn revenue from the tariffs they impose on each other's goods, which could be used to fund public services or cut other taxes.
c. Infant industries: New or struggling domestic industries in both countries that were previously unable to compete with cheaper imports from the other country would be able to grow and develop behind the protection of trade barriers, potentially becoming competitive in the long run. - Losers from the trade war:
a. Consumers: Tariffs raise the price of imported goods, so consumers in both countries face higher prices for goods such as electronics, clothing and machinery, reducing their real purchasing power and living standards. They also have less choice of goods available.
b. Exporters facing retaliatory tariffs: Chinese exporters of electronics, machinery and textiles that face US tariffs would see lower sales and profits, as their goods become more expensive in the US market. Similarly, US exporters of agricultural products, aircraft and high-tech goods that face Chinese retaliatory tariffs would lose access to the large Chinese market.
c. Firms using imported intermediate goods: Manufacturers in both countries that rely on imported components from the other country (e.g. US tech firms using Chinese-made parts, Chinese manufacturers using US agricultural inputs) would face higher input costs, reducing their profitability and competitiveness in global markets.
d. Overall economic efficiency: Protectionism reduces the extent of specialisation according to comparative advantage, leading to higher global production costs, lower total output and a loss of economic welfare (deadweight loss) in both countries. - Evaluation and conclusion: The gains from the trade war are concentrated in a small number of specific groups (protected producers, governments), while the losses are spread across the much larger groups of consumers, exporters and the wider economy. The efficiency losses from reduced trade mean that the total cost of the trade war exceeds the total gains. While some groups benefit, the trade war is net harmful to both the US and Chinese economies, with the losers significantly outnumbering the winners.
Key Takeaways
- Protectionist trade wars have distributional effects: some groups gain, but the overall economy loses due to reduced specialisation and trade.
- Winners from protectionism are typically concentrated, well-organised groups (producers in protected industries), while losers are diffuse (consumers, exporters).
- Retaliatory tariffs mean that protectionist policies harm a country's own exporters as well as foreign producers.
Common Mistakes
- Writing a one-sided answer: only listing winners or only listing losers, which forfeits all evaluation marks. The mark scheme explicitly requires consideration of both winners and losers to gain full marks.
- Listing points without explanation: for example, saying "consumers lose" without explaining that tariffs raise import prices and reduce living standards.
- Ending with a summary instead of a justified conclusion: a conclusion that just restates the winners and losers without stating which side is stronger and why is vague and scores low marks.
- Forgetting to consider retaliatory tariffs: a trade war involves reciprocal barriers, so US tariffs on Chinese goods lead to Chinese tariffs on US goods, harming US exporters as well as Chinese ones.
Things to Be Careful About
- The mark scheme reserves 1 mark for a justified conclusion, so you must end with a clear verdict on whether the winners or losers are more significant, and why.
- Make sure each point is explained: the mark scheme awards marks for developed points, not just assertions.
- You can use evidence from the article to support your points: for example, the article notes that China has a large current account surplus and exports many goods to the US, so Chinese exporters would be heavily impacted by US tariffs.
- Avoid generic points about free trade: focus specifically on the winners and losers of a US-China trade war, as the question asks.
The rest of this paper
3 more questions- Q2Production Possibility Curves · Economic Systems20M
- Q3Methods of Government Intervention in Markets20M
- Q4Aggregate Demand and Aggregate Supply · Price Stability20M