Economics 9708/12 — May/June 2019
Cambridge AS Level · AS Level Multiple Choice · answer key with instant marking and worked solutions
Topics Exchange Rates · Aggregate Demand and Aggregate Supply · Demand and Supply · Methods of Government Intervention in Markets · Fiscal Policy · Balance of Payments · +13 more
Tap an option under each question to check it — your score builds as you go.
A production possibility curve for a country is shown.
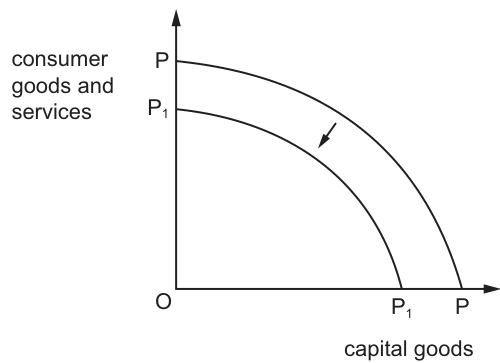
What would cause the shift from PP to P1P1?
Options
A application of more machinery used in manufacturing
B productivity decreases
C scientific methods applied to farming
D switch from production of consumer goods to capital goods
Working
An inward shift of the production possibility curve (from PP to P1P1) indicates a reduction in the economy's productive capacity — the maximum output of both consumer goods and capital goods has fallen. This occurs when there is a decrease in the quantity or quality of resources, or a fall in productivity.
Productivity decreases mean that less output can be produced from a given amount of inputs, directly reducing the economy's productive capacity and shifting the PPC inward.
Answer
B
B
Background Concept
A production possibility curve (PPC) illustrates the maximum possible output combinations of two goods an economy can produce when all resources are fully and efficiently employed, given the current state of technology. The curve is typically concave due to increasing opportunity costs. An outward shift (from P1P1 to PP) represents economic growth, caused by an increase in the quantity or quality of factors of production (more labour, more capital, better technology, or improved productivity). Conversely, an inward shift (from PP to P1P1) represents a reduction in productive capacity, caused by a decrease in the quantity or quality of resources, or a fall in productivity.
It is crucial to distinguish between a shift of the PPC and a movement along the PPC. A shift occurs when the economy's productive capacity itself changes. A movement along the curve occurs when the economy reallocates existing resources between the two goods, moving from one point on the curve to another.
Understanding the Question
The question presents a diagram showing the PPC shifting inward from the outer curve PP to the inner curve P1P1. The vertical axis represents consumer goods and services, and the horizontal axis represents capital goods. The arrow points inward, indicating that the economy can now produce less of both goods than before. The question asks which option would cause this inward shift.
This is a 1-mark multiple-choice question testing knowledge of what factors shift the PPC. The correct answer must be something that reduces the economy's productive capacity.
Approach
To answer this, evaluate each option against the economic definition of what causes a PPC to shift inward:
- Recall that inward shifts are caused by: reduction in resources, natural disasters, war, decline in productivity, or deterioration of technology.
- Recall that outward shifts are caused by: more resources, better technology, improved productivity, or investment in capital.
- Recall that movements along the curve are caused by reallocating resources between the two goods.
Apply this test to each option.
Step-by-Step Reasoning
Option A: Application of more machinery used in manufacturing
This increases the capital stock available to the economy. More machinery means greater productive capacity, particularly for manufacturing output. This would shift the PPC outward, not inward. Therefore, A is incorrect.
Option B: Productivity decreases
Productivity measures output per unit of input. If productivity falls, the economy gets less output from the same amount of labour, capital, and land. This directly reduces the maximum possible output of both consumer goods and capital goods. The entire PPC shifts inward. This matches the diagram exactly. Therefore, B is correct.
Option C: Scientific methods applied to farming
This represents technological progress in agriculture. Better farming techniques increase the output that can be obtained from a given amount of land and labour. This increases productive capacity and shifts the PPC outward. Therefore, C is incorrect.
Option D: Switch from production of consumer goods to capital goods
This describes reallocating resources to produce more capital goods and fewer consumer goods. This is a movement along the existing PPC from a point with more consumer goods to a point with more capital goods. It does not change the economy's overall productive capacity, so the curve itself does not shift. Therefore, D is incorrect.
Key Takeaways
- An inward shift of the PPC means the economy's productive capacity has fallen.
- Causes of inward shifts include: fewer resources, lower productivity, natural disasters, war, or outdated technology.
- Causes of outward shifts include: more resources, better technology, higher productivity, or education/training.
- Movements along the PPC are caused by changes in the allocation of resources between the two goods, not by changes in capacity.
Common Mistakes
- Confusing movements along the curve with shifts of the curve: Students often think that changing what is produced (e.g., making more capital goods) shifts the curve. It does not; it is merely a movement along the existing curve.
- Thinking any change causes a shift: Only changes in the quantity/quality of resources or technology shift the curve. Price changes, preference changes, or reallocation of existing resources do not shift the curve.
- Misreading the diagram direction: The arrow points inward, indicating a reduction in capacity. Students must look carefully at whether the shift is inward or outward.
Things to Be Careful About
- Always check the direction of the arrow in the diagram. An inward arrow means reduced capacity.
- Ensure you understand the difference between a shift (change in capacity) and a movement along (change in allocation).
- When evaluating options, ask: "Does this change the maximum possible output, or just what we choose to produce?" Only the former shifts the curve.
The rest of this paper
29 more questions- Q2Economic Systems1M
- Q3Production Possibility Curves1M
- Q4Classification of Goods and Services · Reasons for Government Intervention in Markets1M
- Q5Price Elasticity of Supply1M
- Q6Market Equilibrium and the Price Mechanism1M
- Q7Demand and Supply1M
- Q8Market Equilibrium and the Price Mechanism1M
- Q9Elasticities of Demand1M
- Q10Demand and Supply1M
- Q11Consumer and Producer Surplus1M
- Q12Elasticities of Demand1M
- Q13Demand and Supply1M
- Q14National Income Statistics1M
- Q15Methods of Government Intervention in Markets1M
- Q16Methods of Government Intervention in Markets1M
- Q17Methods of Government Intervention in Markets1M
- Q18Fiscal Policy1M
- Q19Exchange Rates · Fiscal Policy · Monetary Policy1M
- Q20Aggregate Demand and Aggregate Supply1M
- Q21Balance of Payments1M
- Q22Exchange Rates1M
- Q23Aggregate Demand and Aggregate Supply1M
- Q24Protectionism1M
- Q25Price Stability1M
- Q26Balance of Payments1M
- Q27Exchange Rates1M
- Q28Exchange Rates · Monetary Policy · Balance of Payments1M
- Q29Aggregate Demand and Aggregate Supply · Fiscal Policy1M
- Q30Aggregate Demand and Aggregate Supply · Supply-Side Policy1M